NMR Metabolite Profiles in Male Meat-Eaters, Fish-Eaters, Vegetarians and Vegans, and Comparison with MS Metabolite Profiles
Abstract
1. Introduction
2. Results
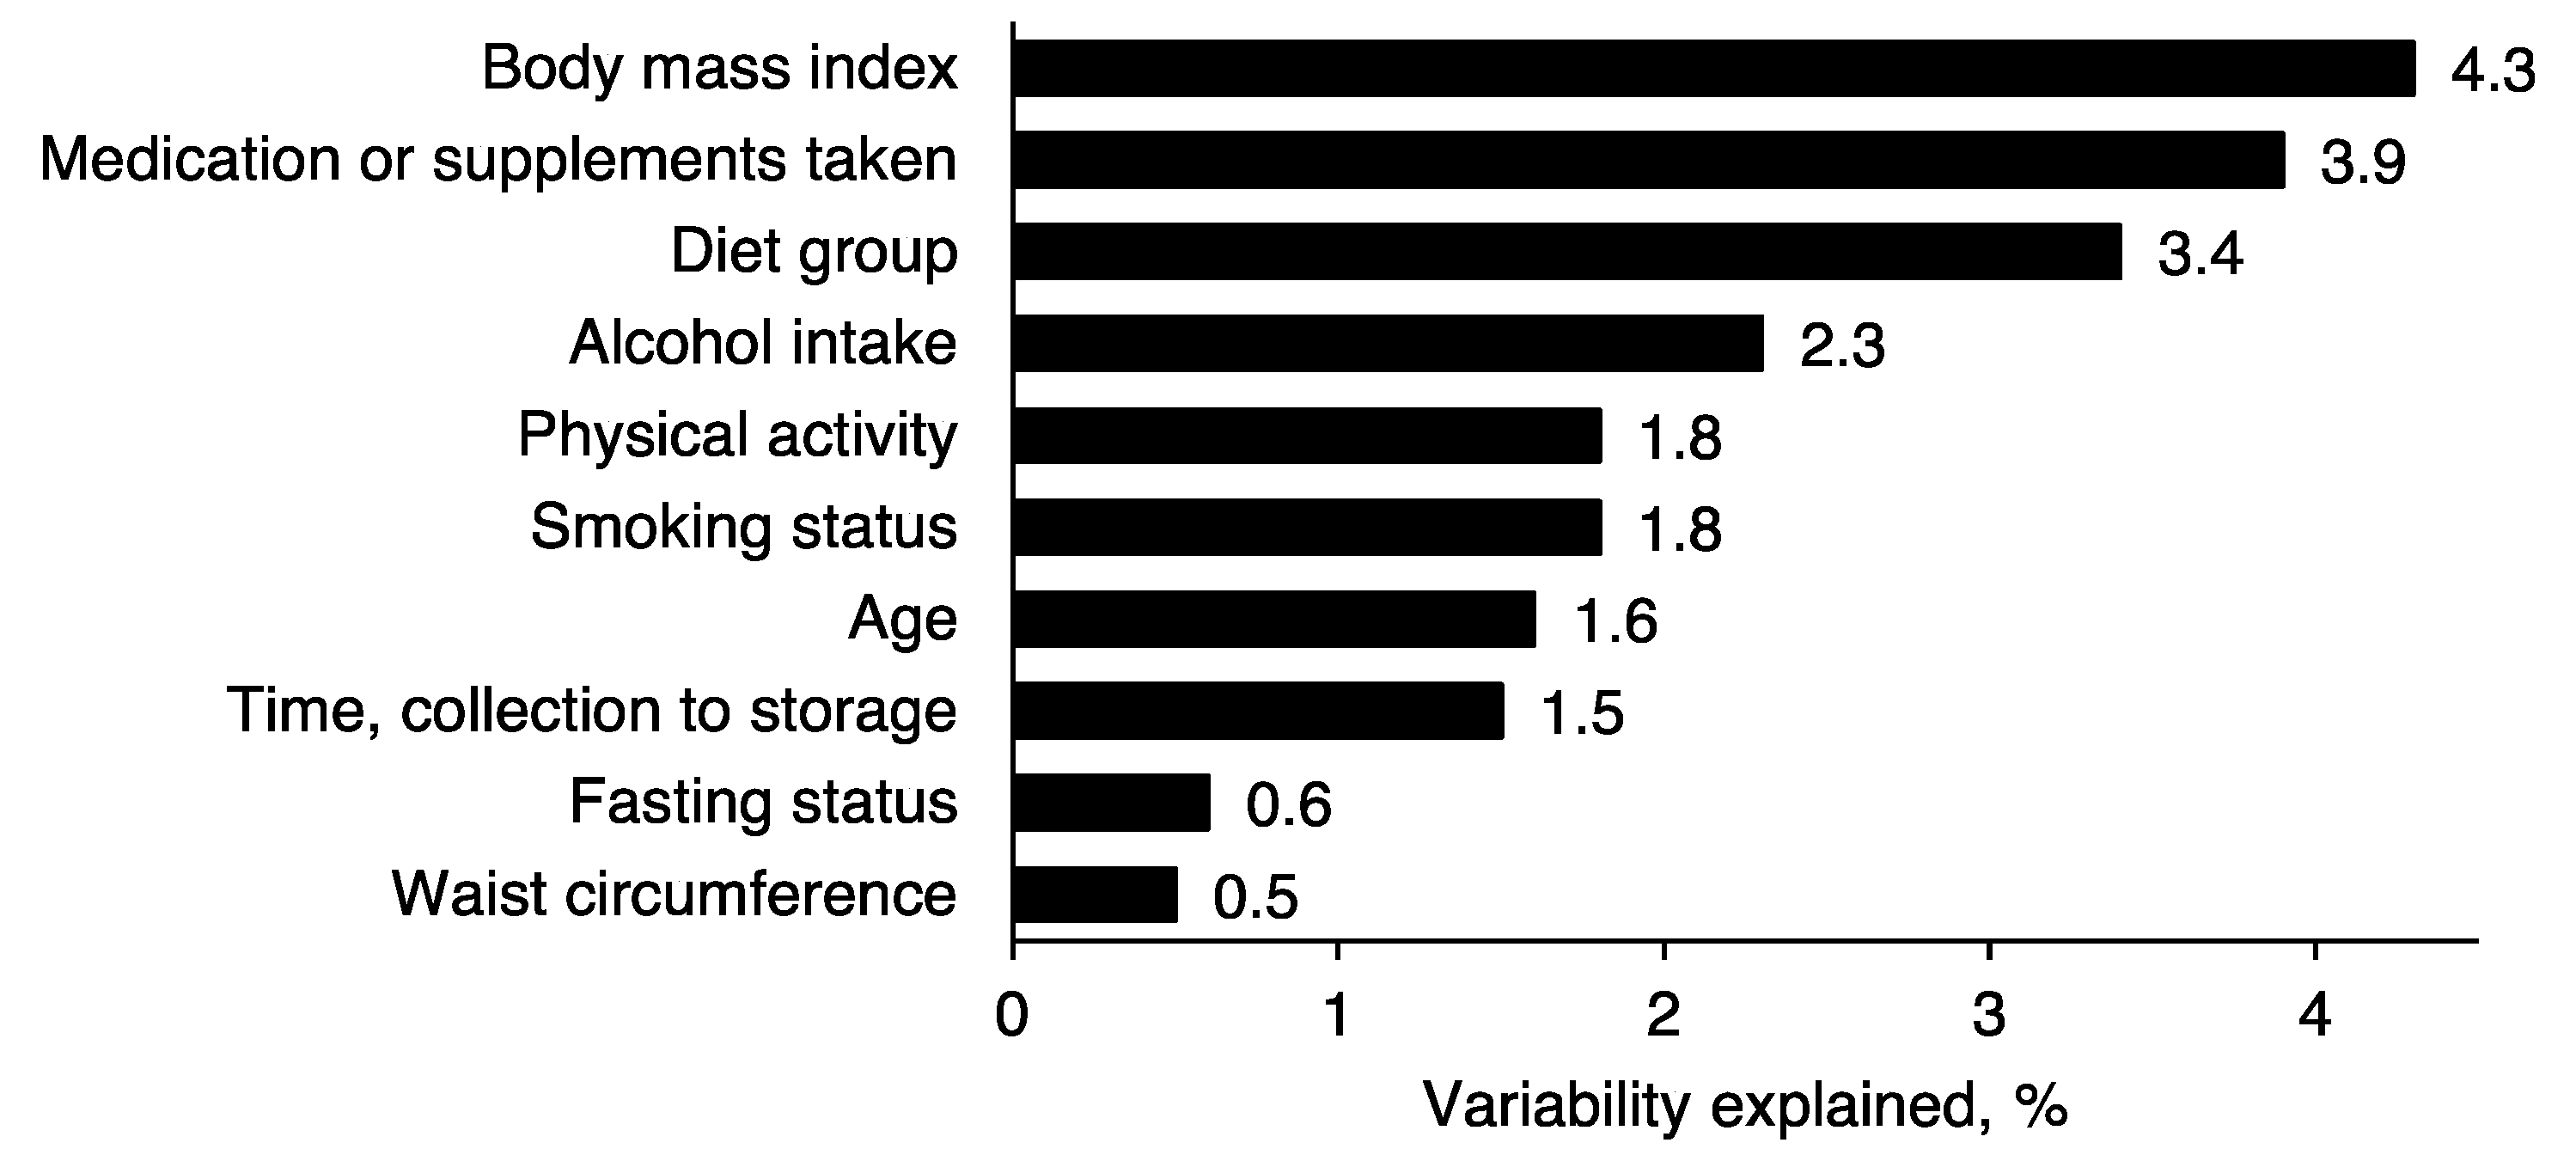
2.1. Participant and Sample Characteristics
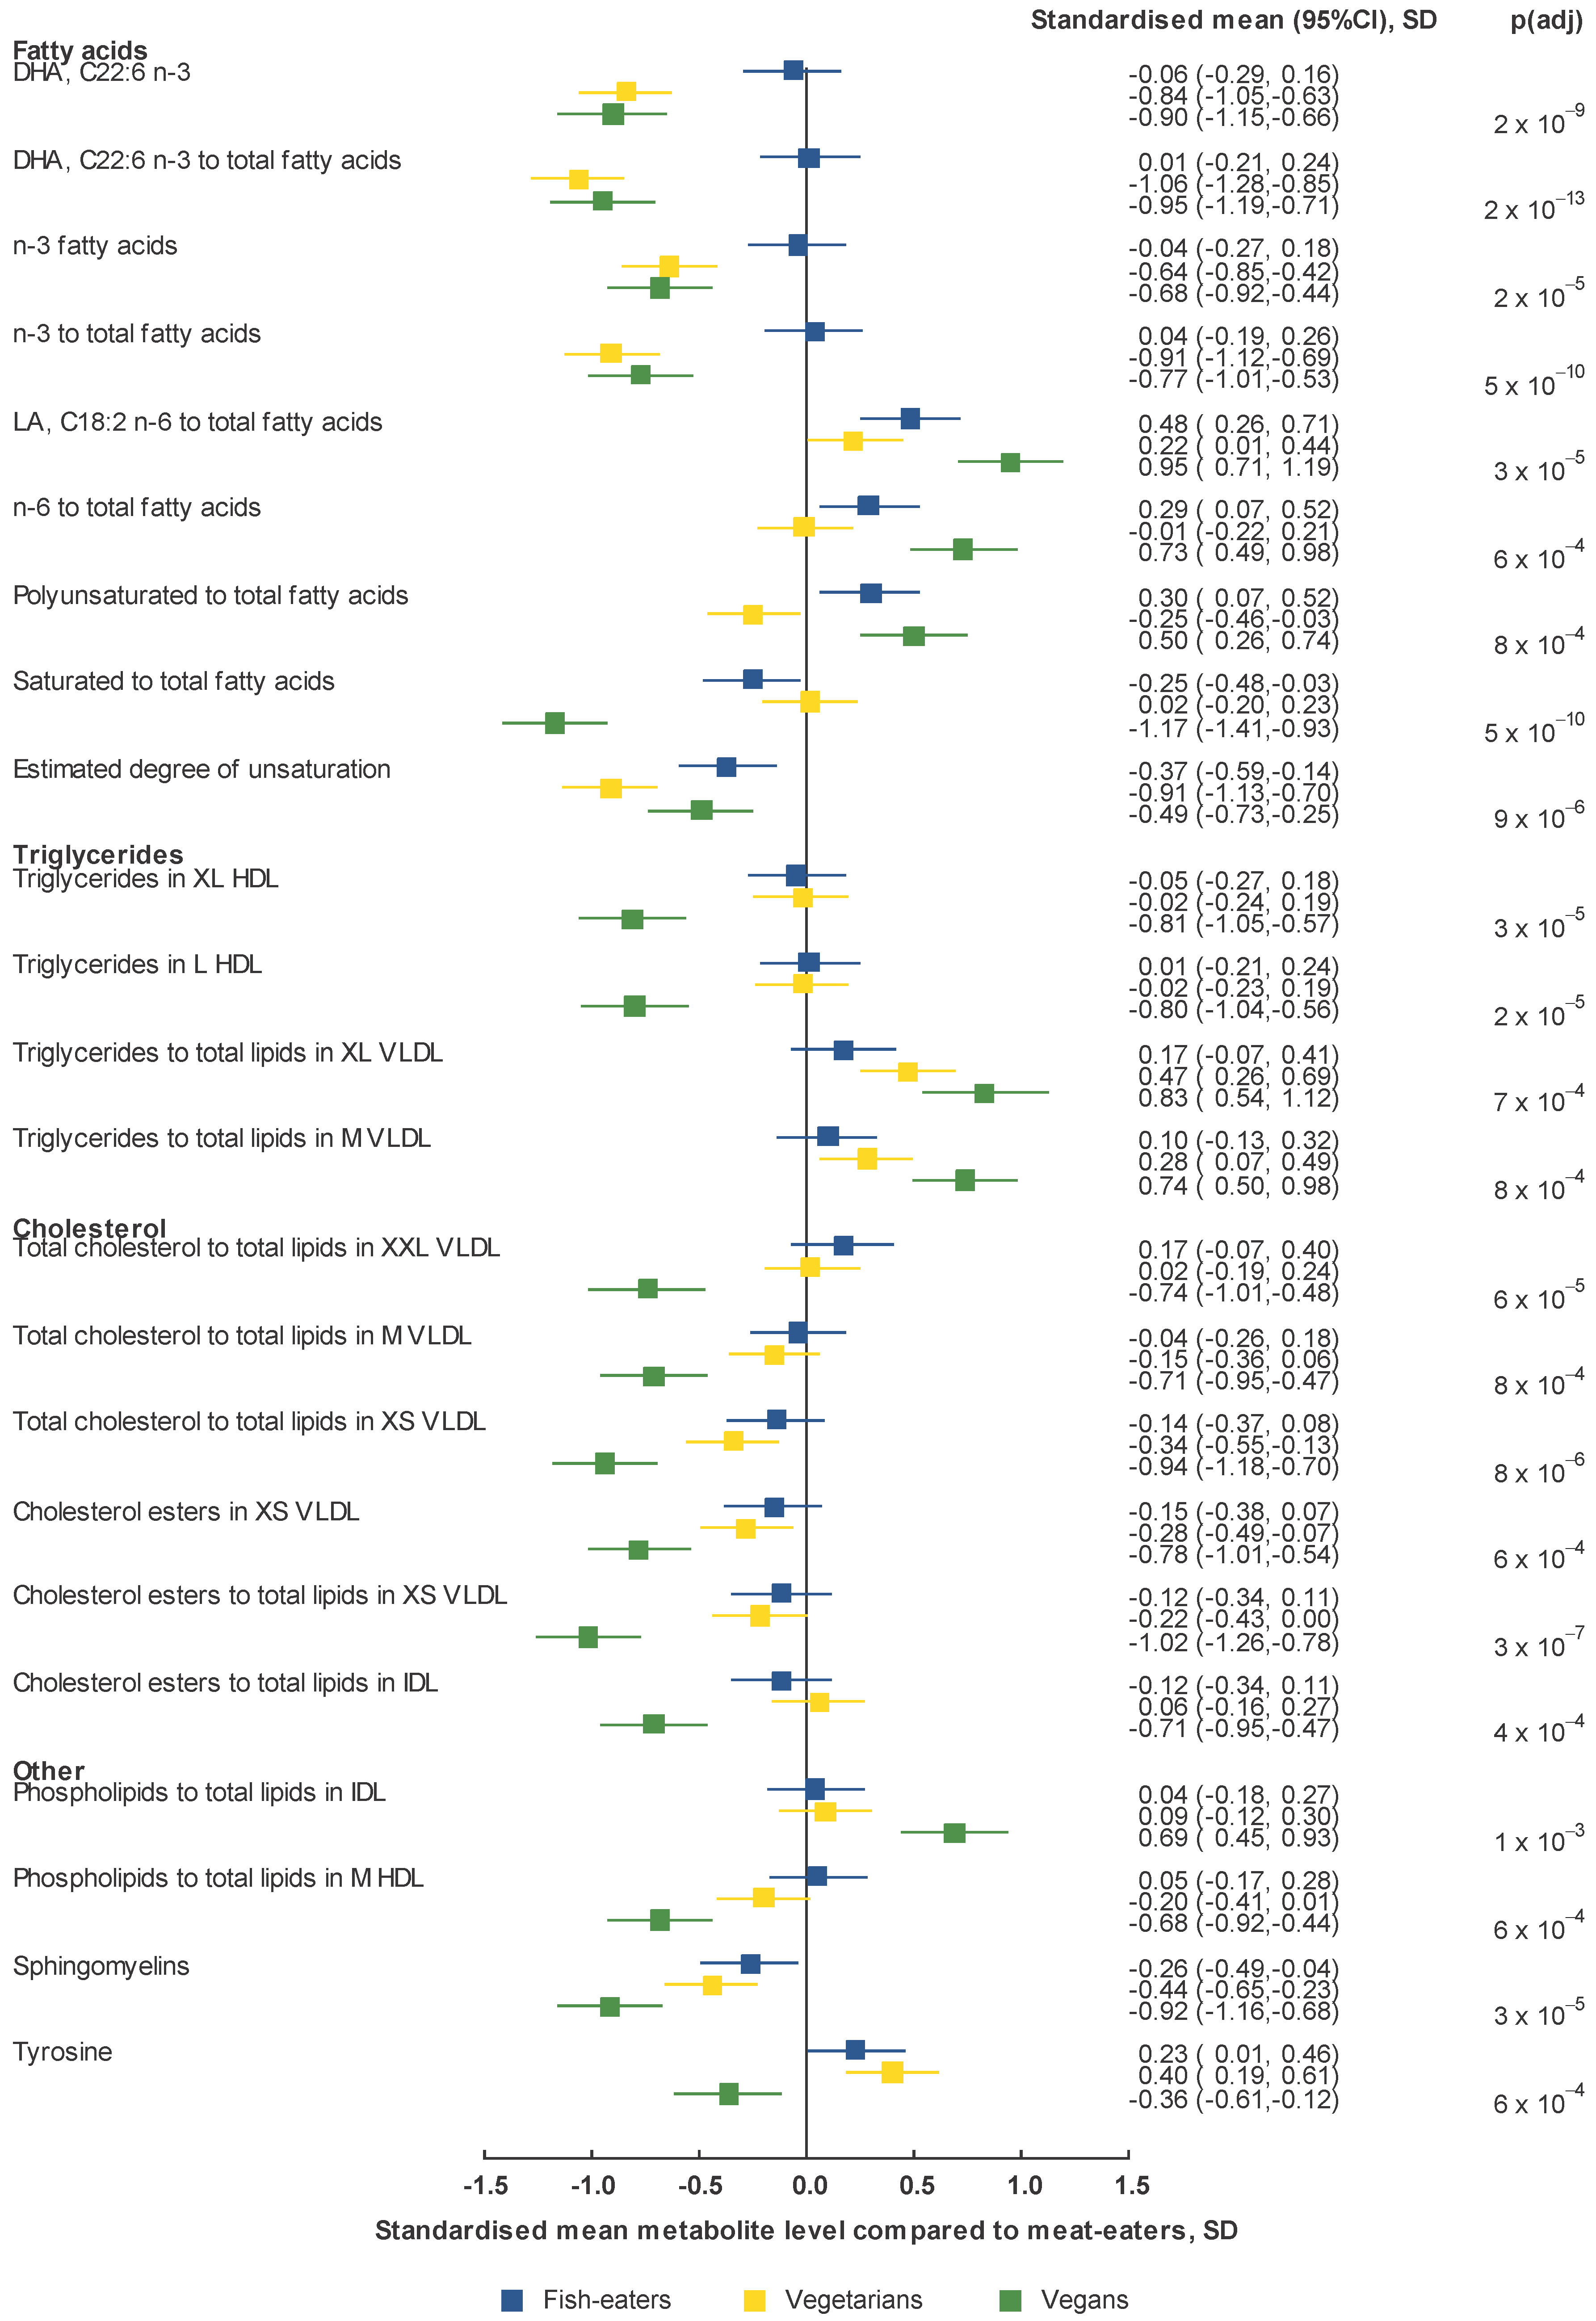
2.2. Metabolomics Profile by Diet Group—Univariate Analysis
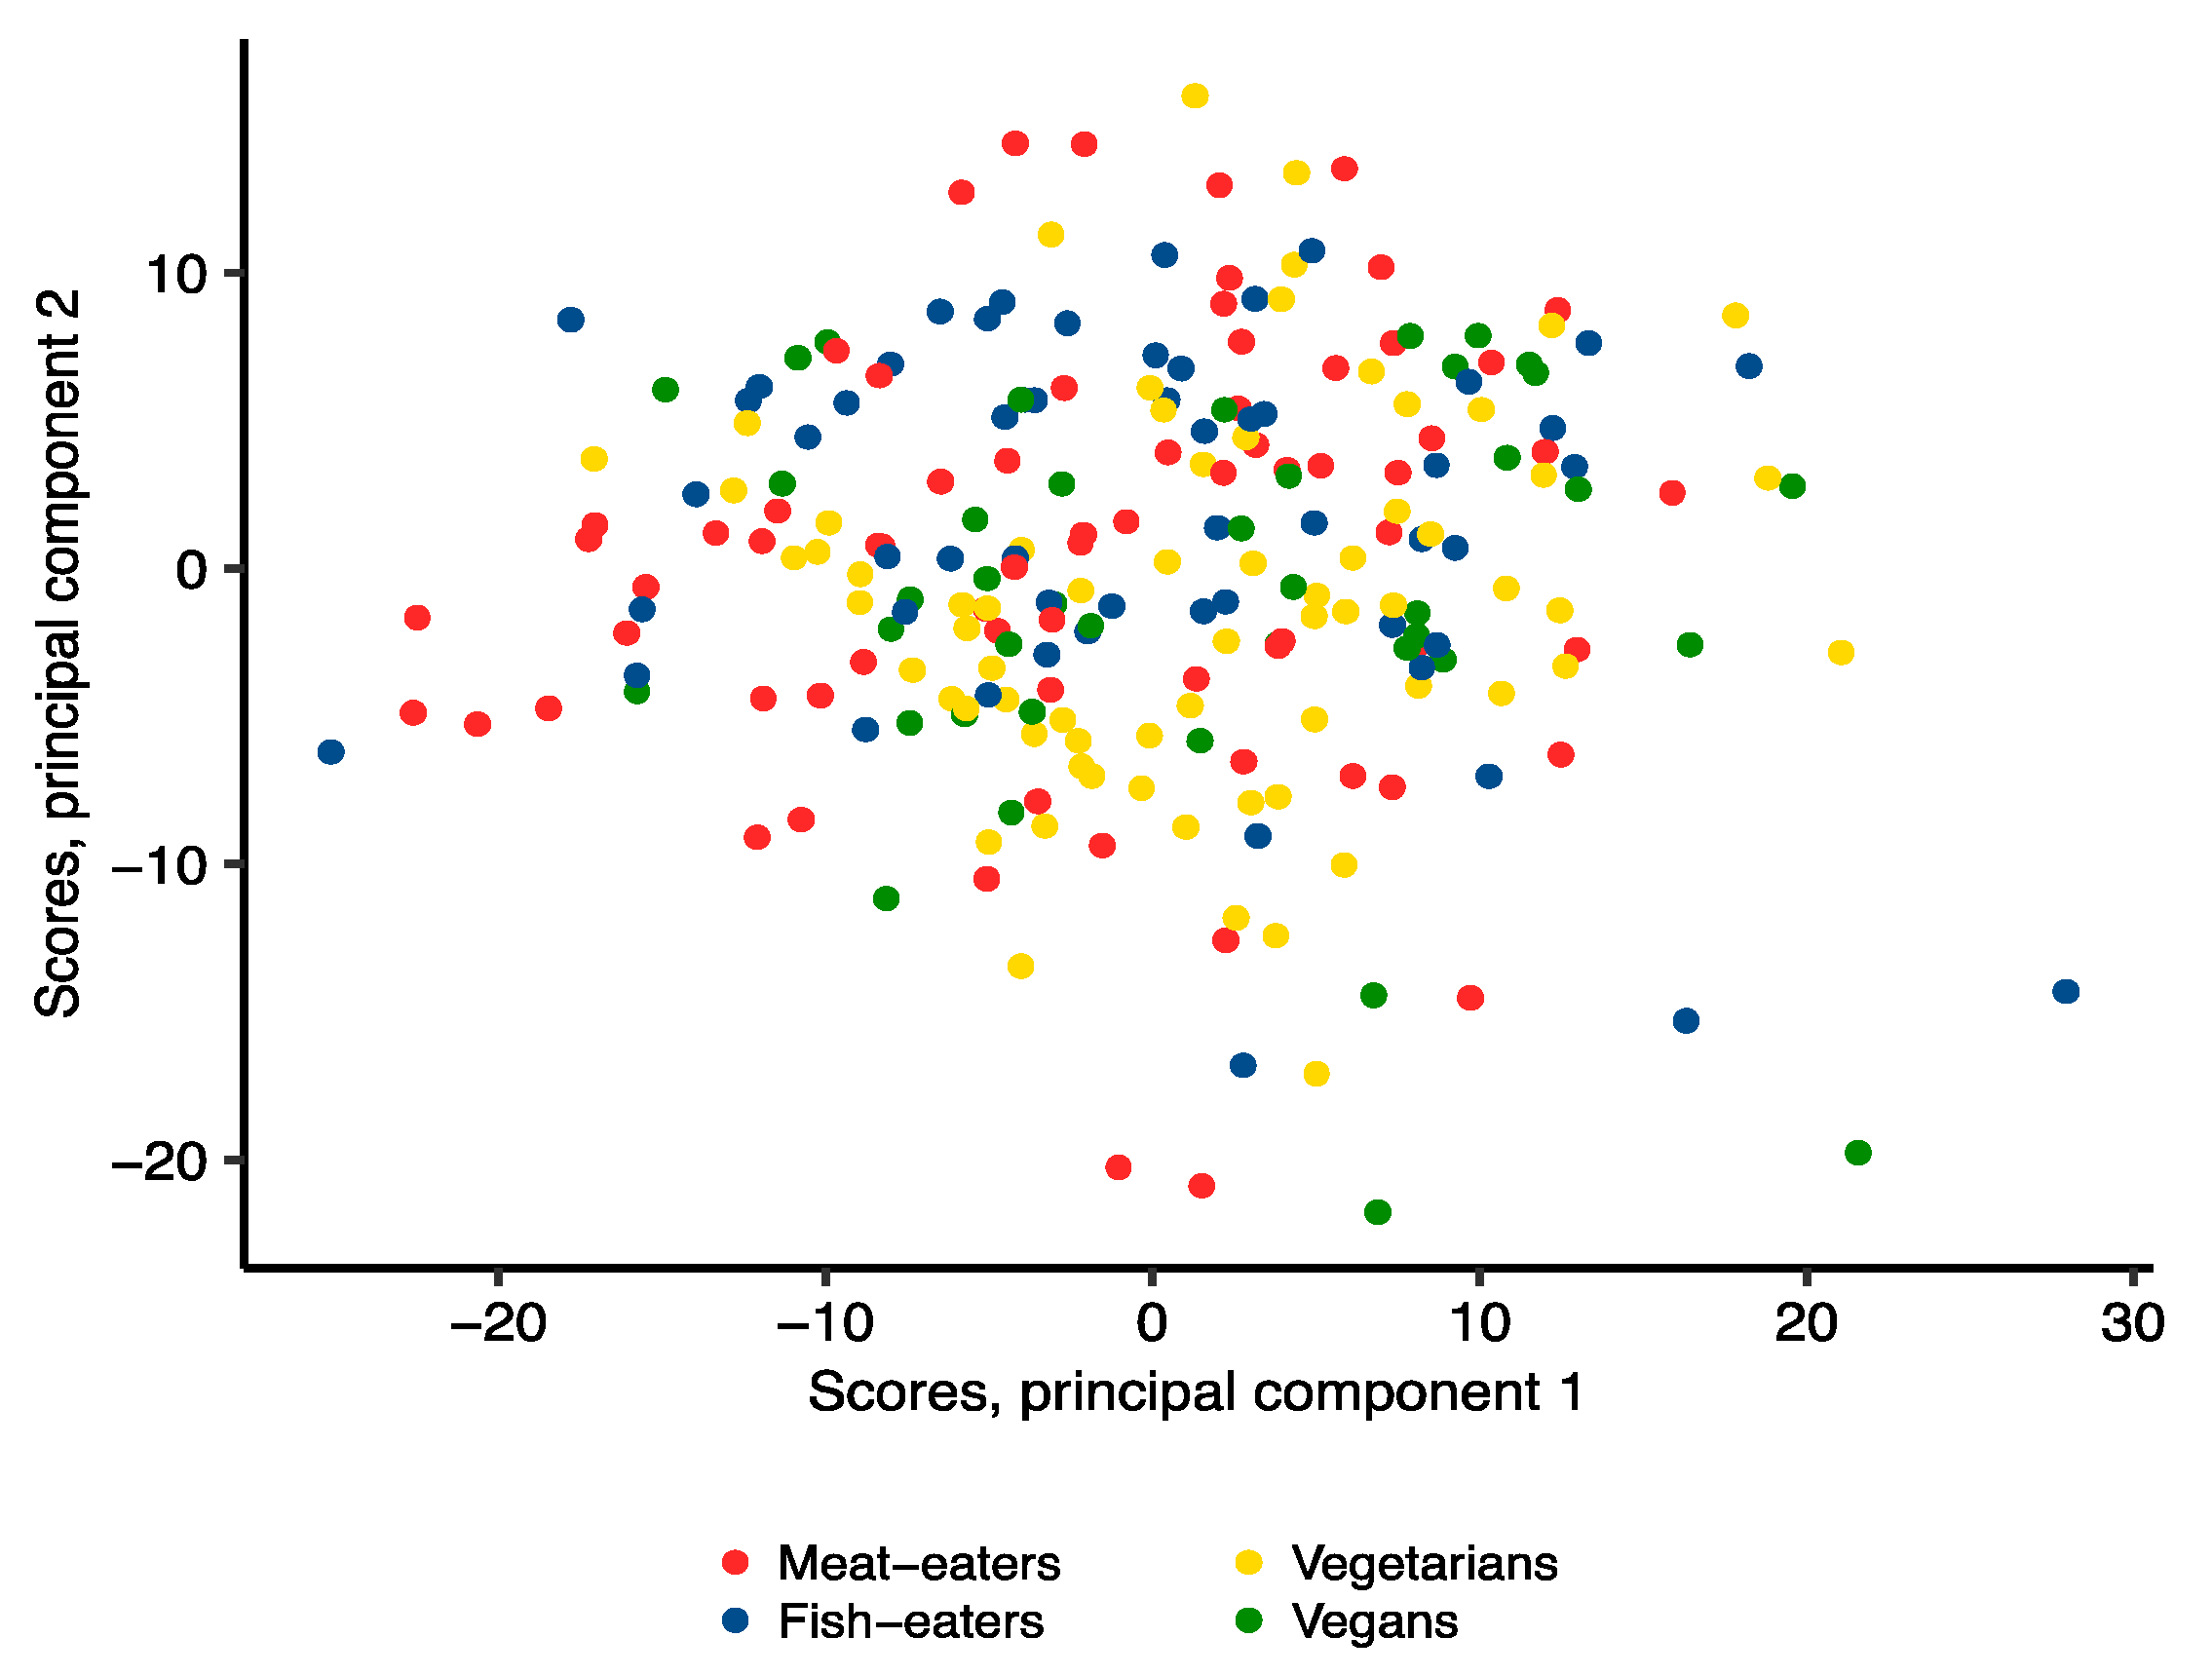
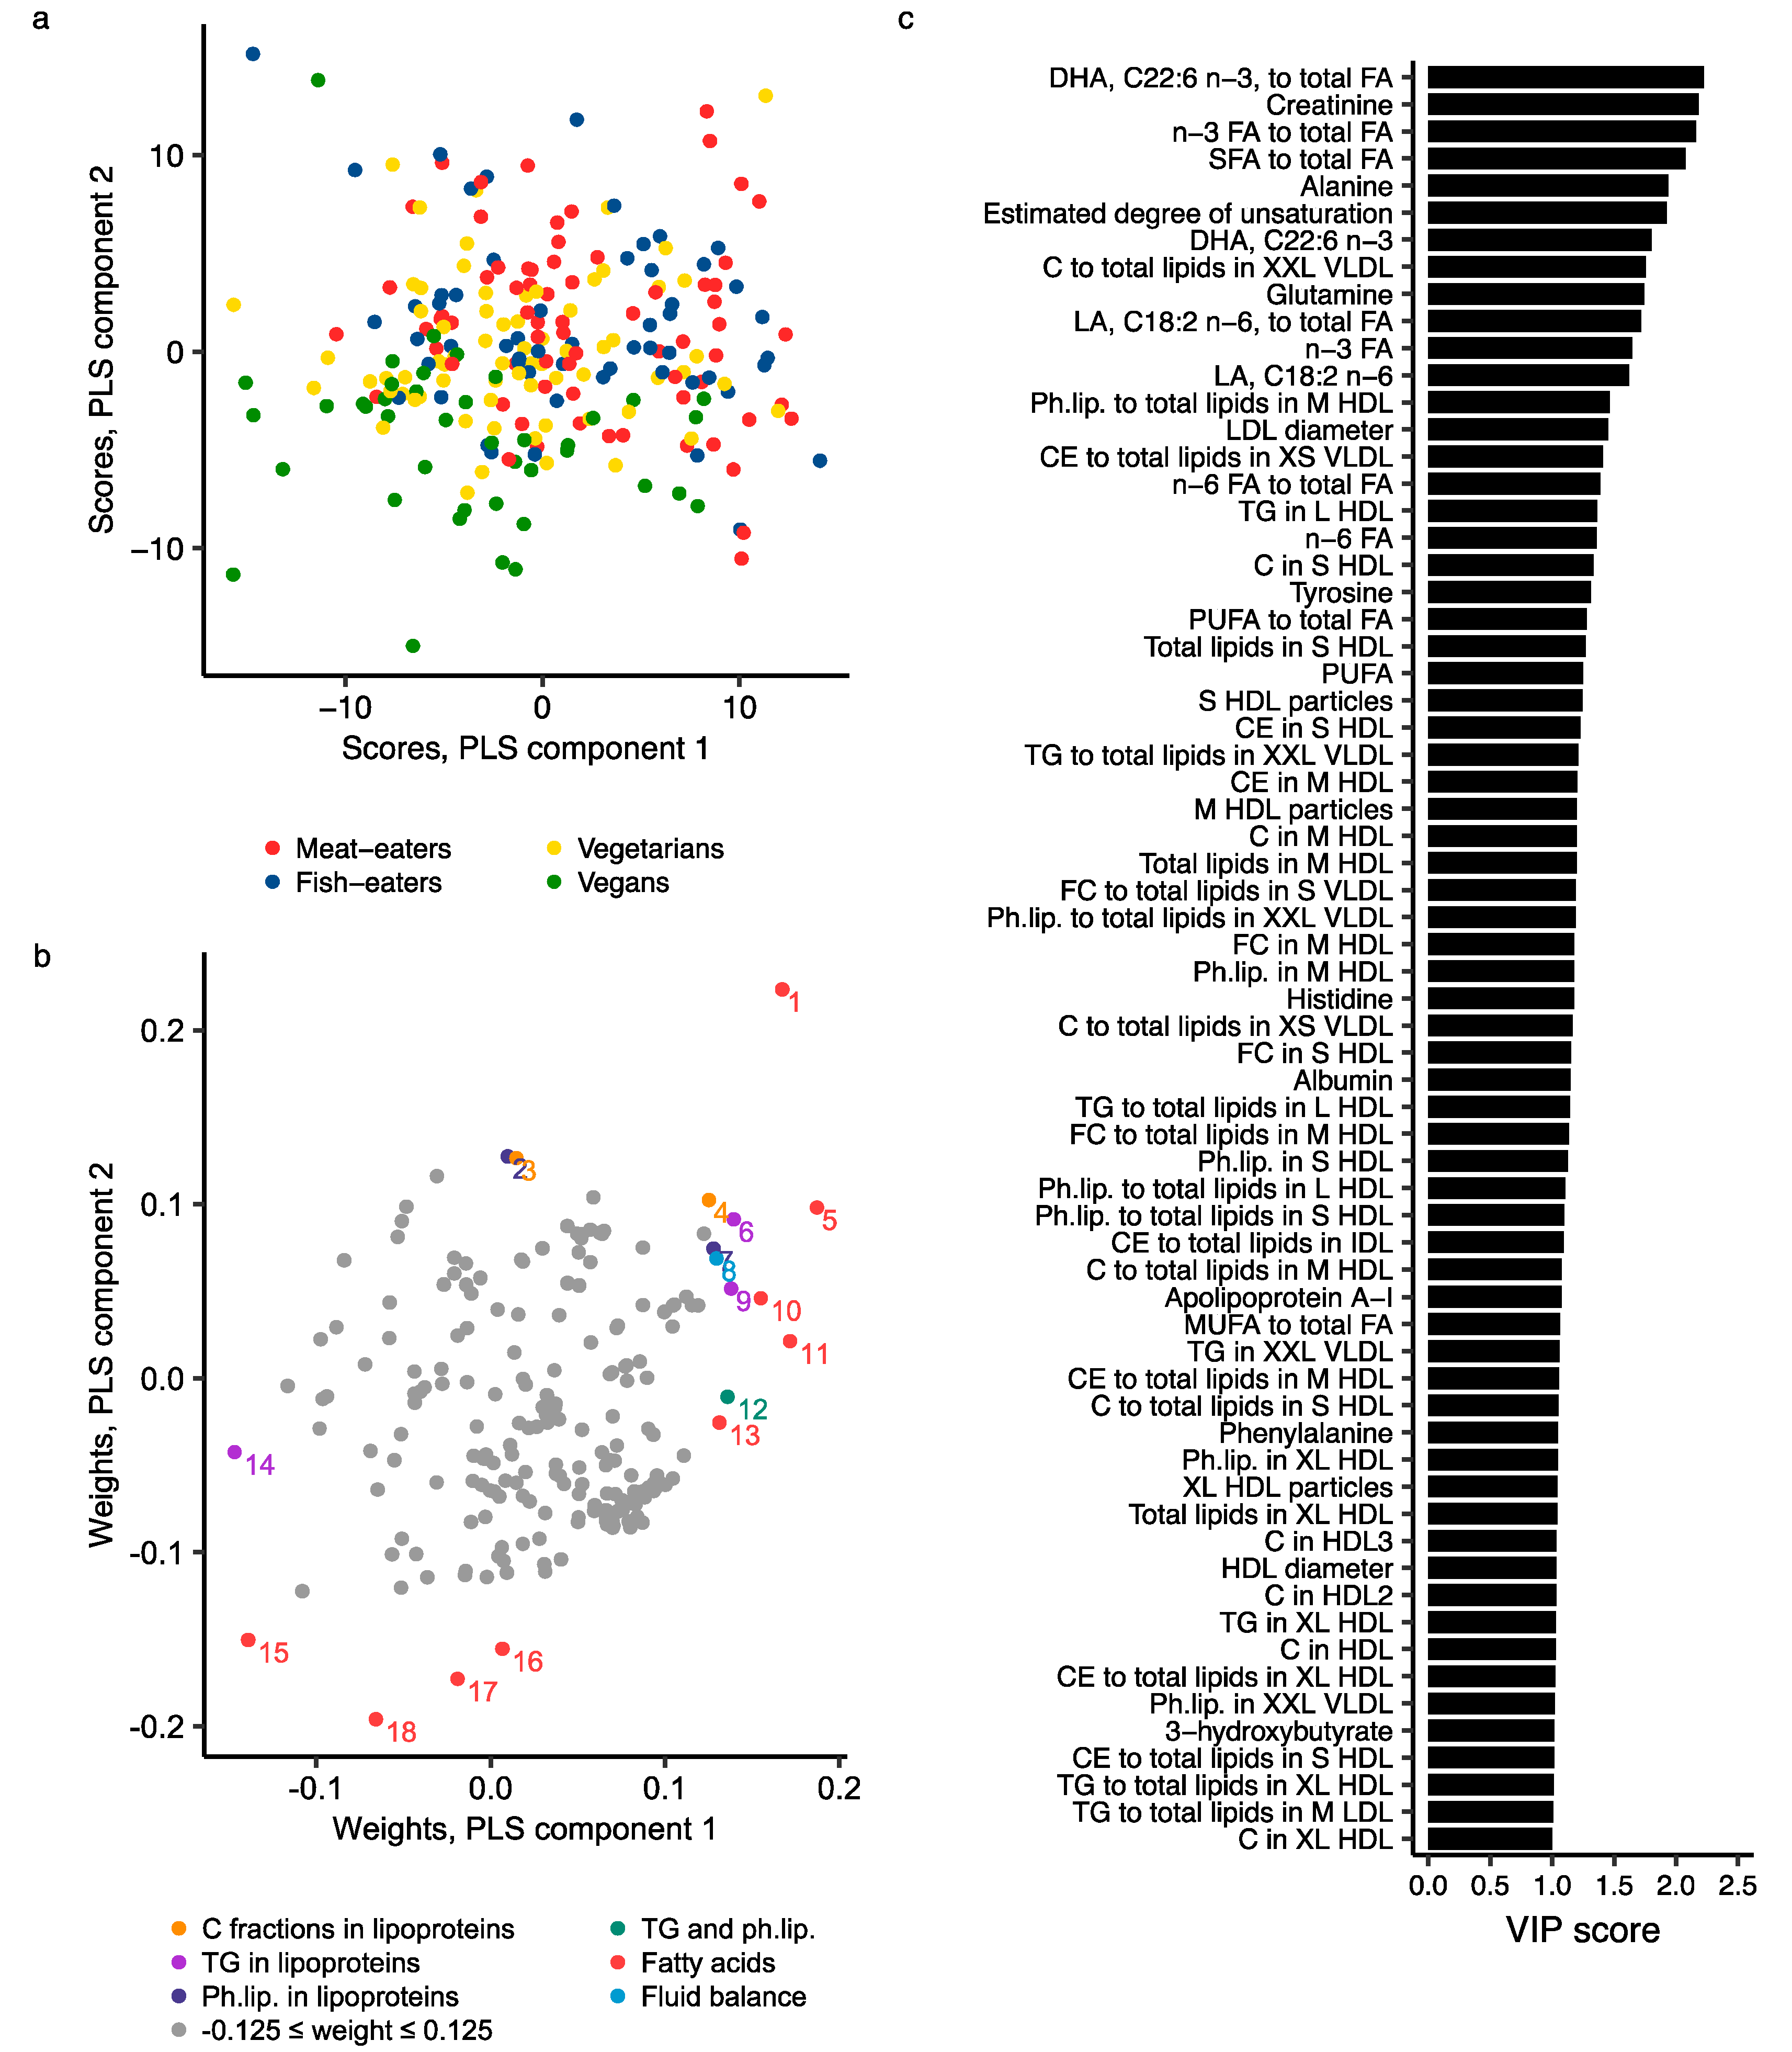
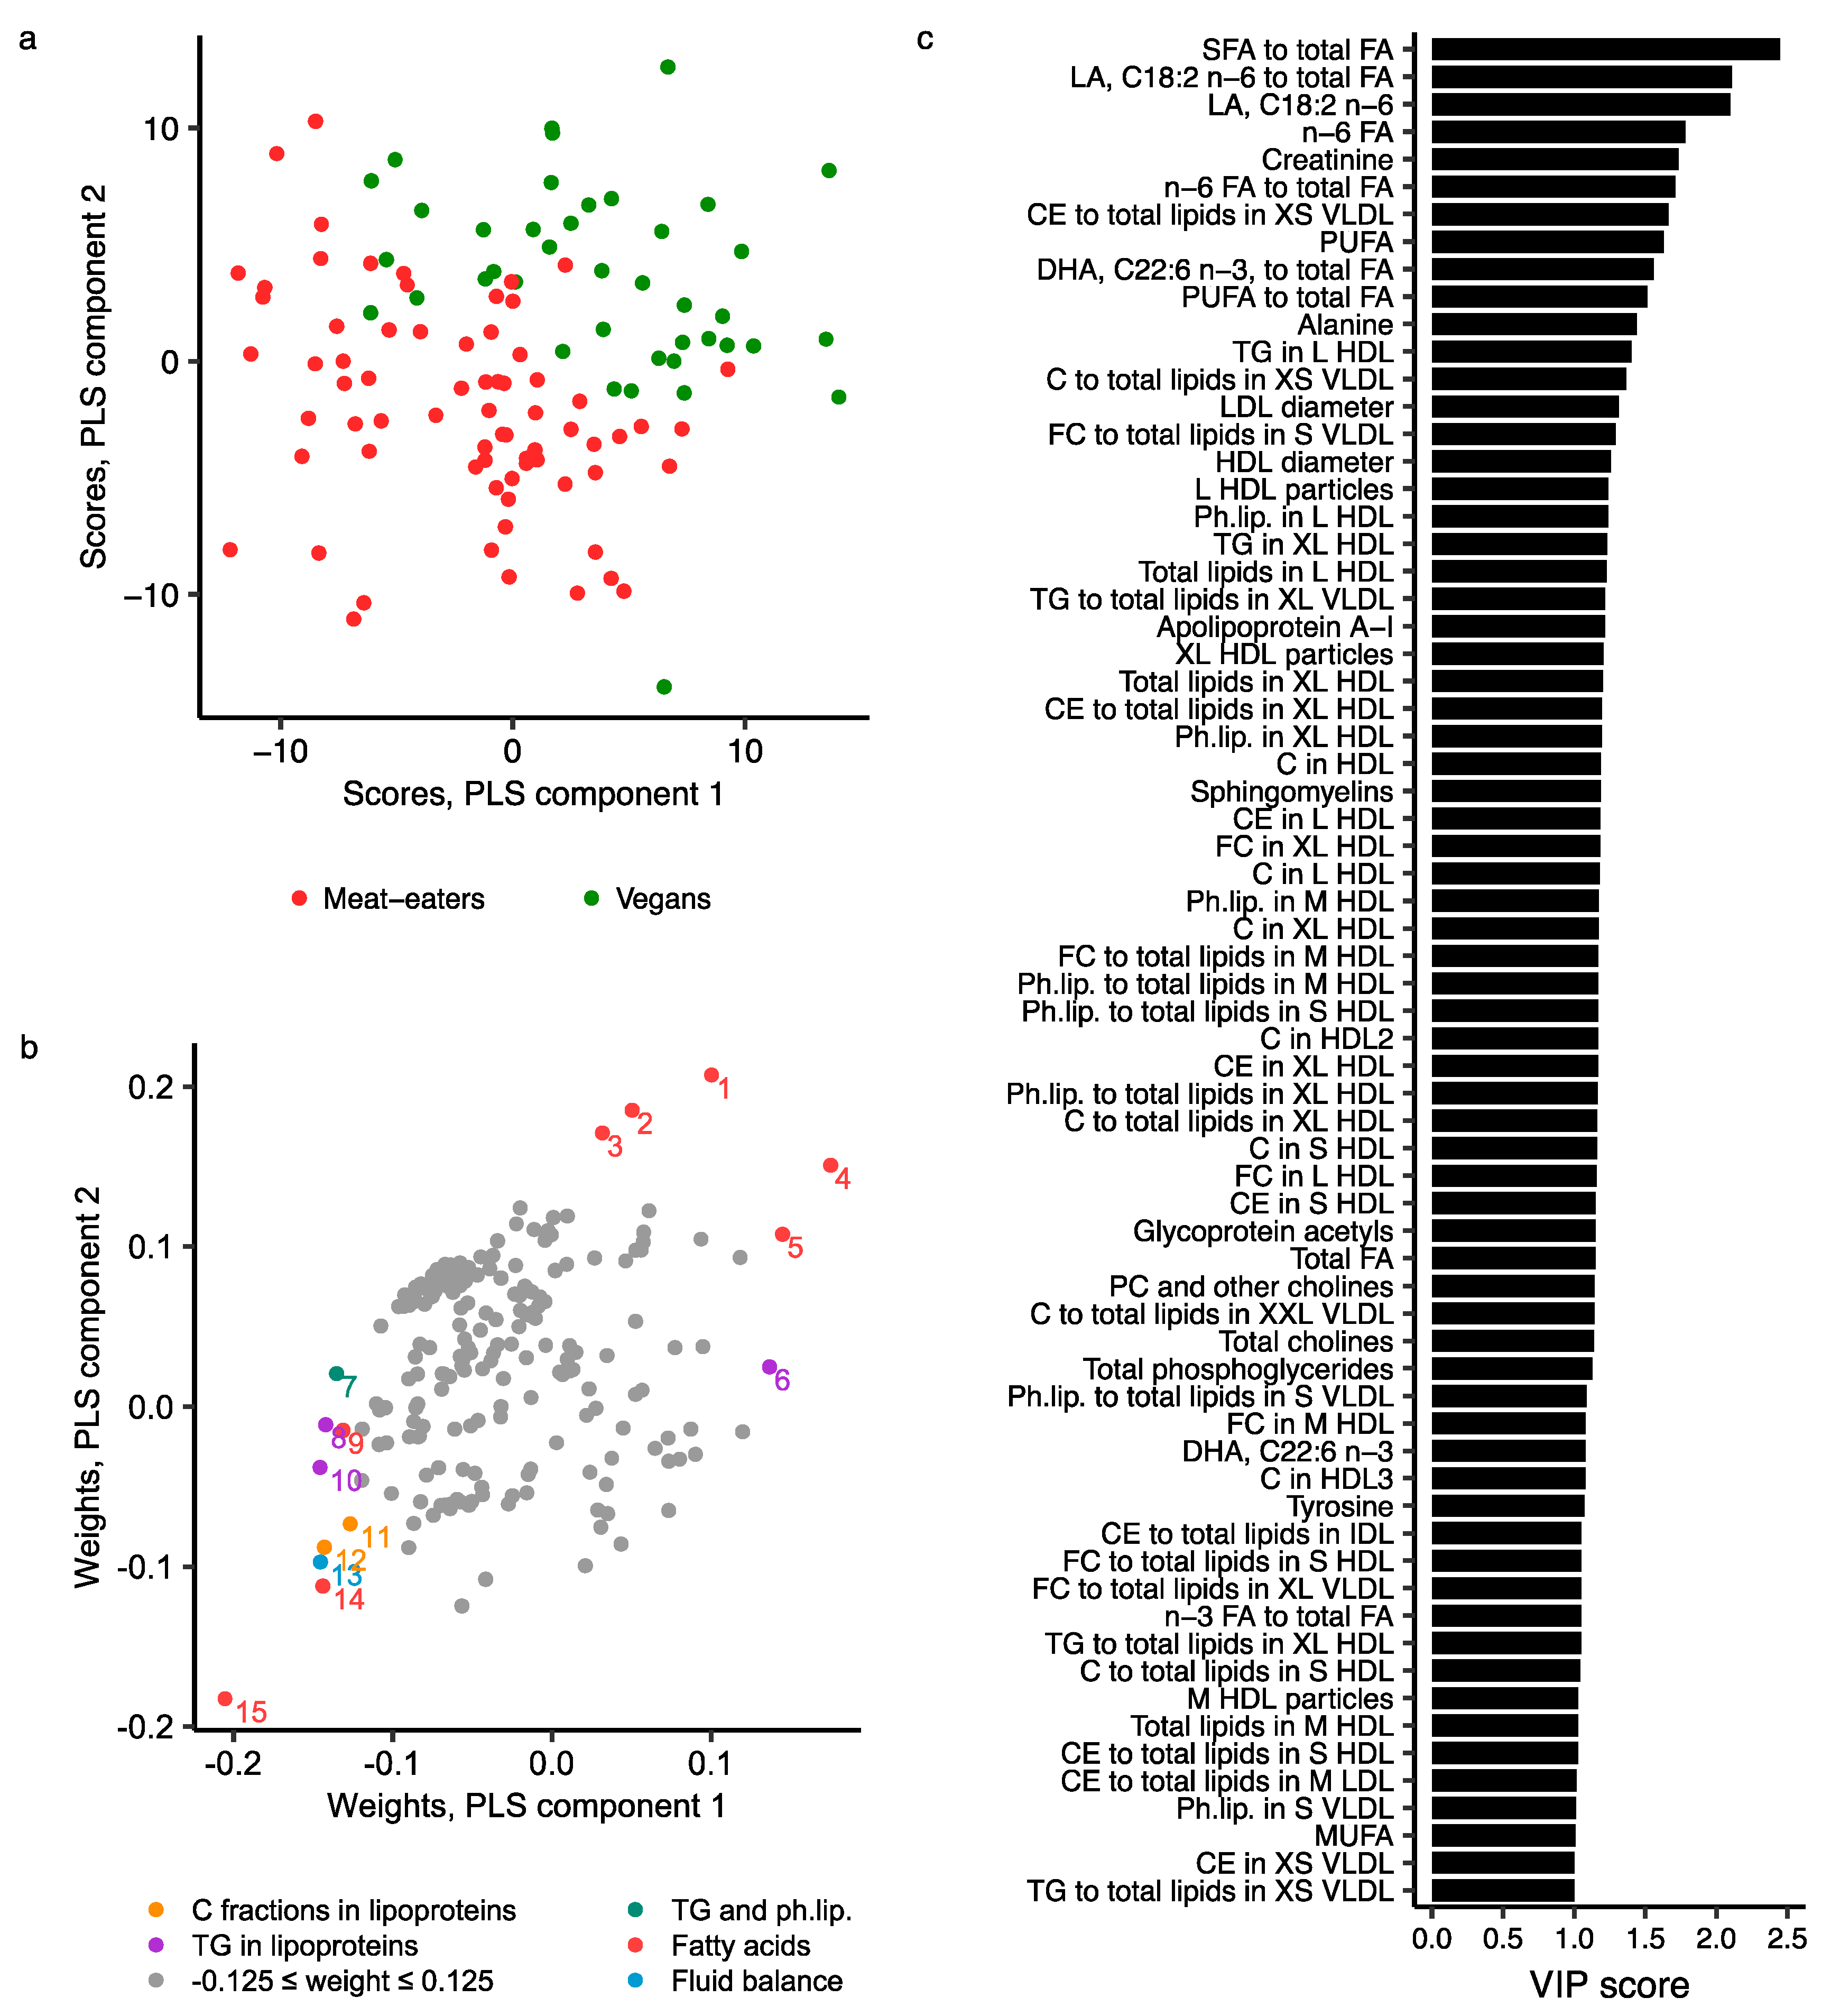
2.3. Metabolomics Profile by Diet Group—Multivariate Analysis
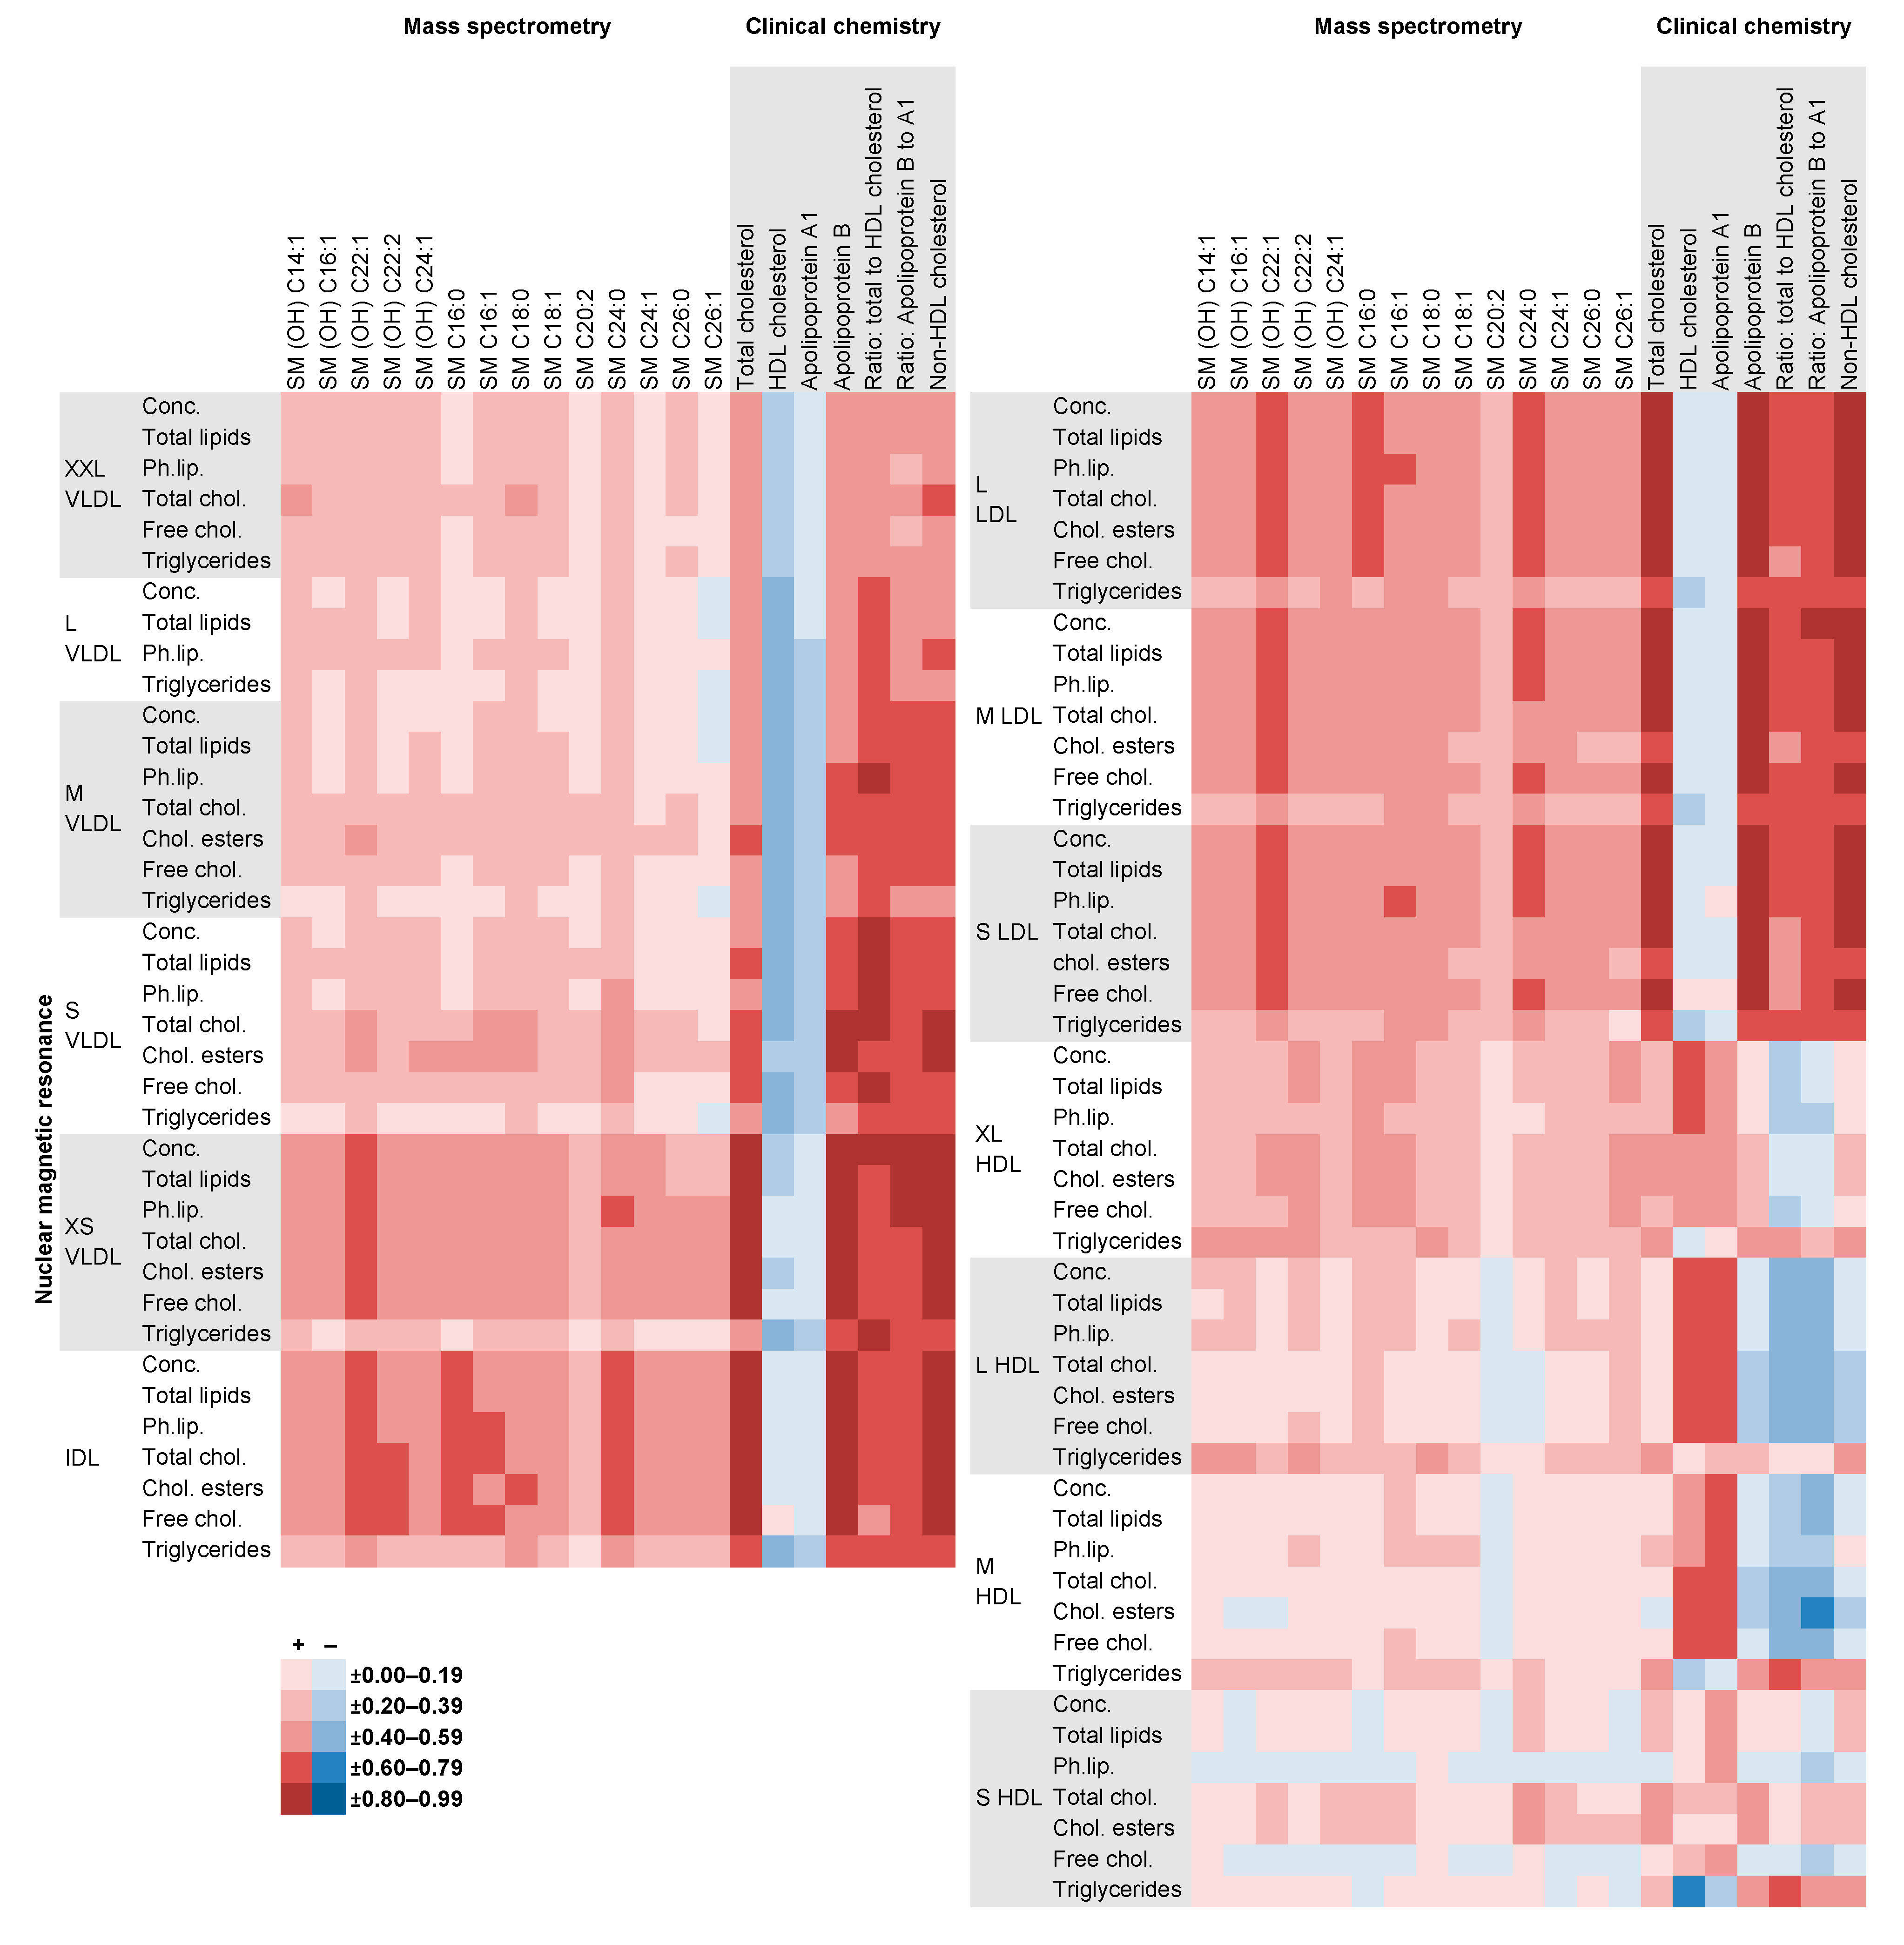
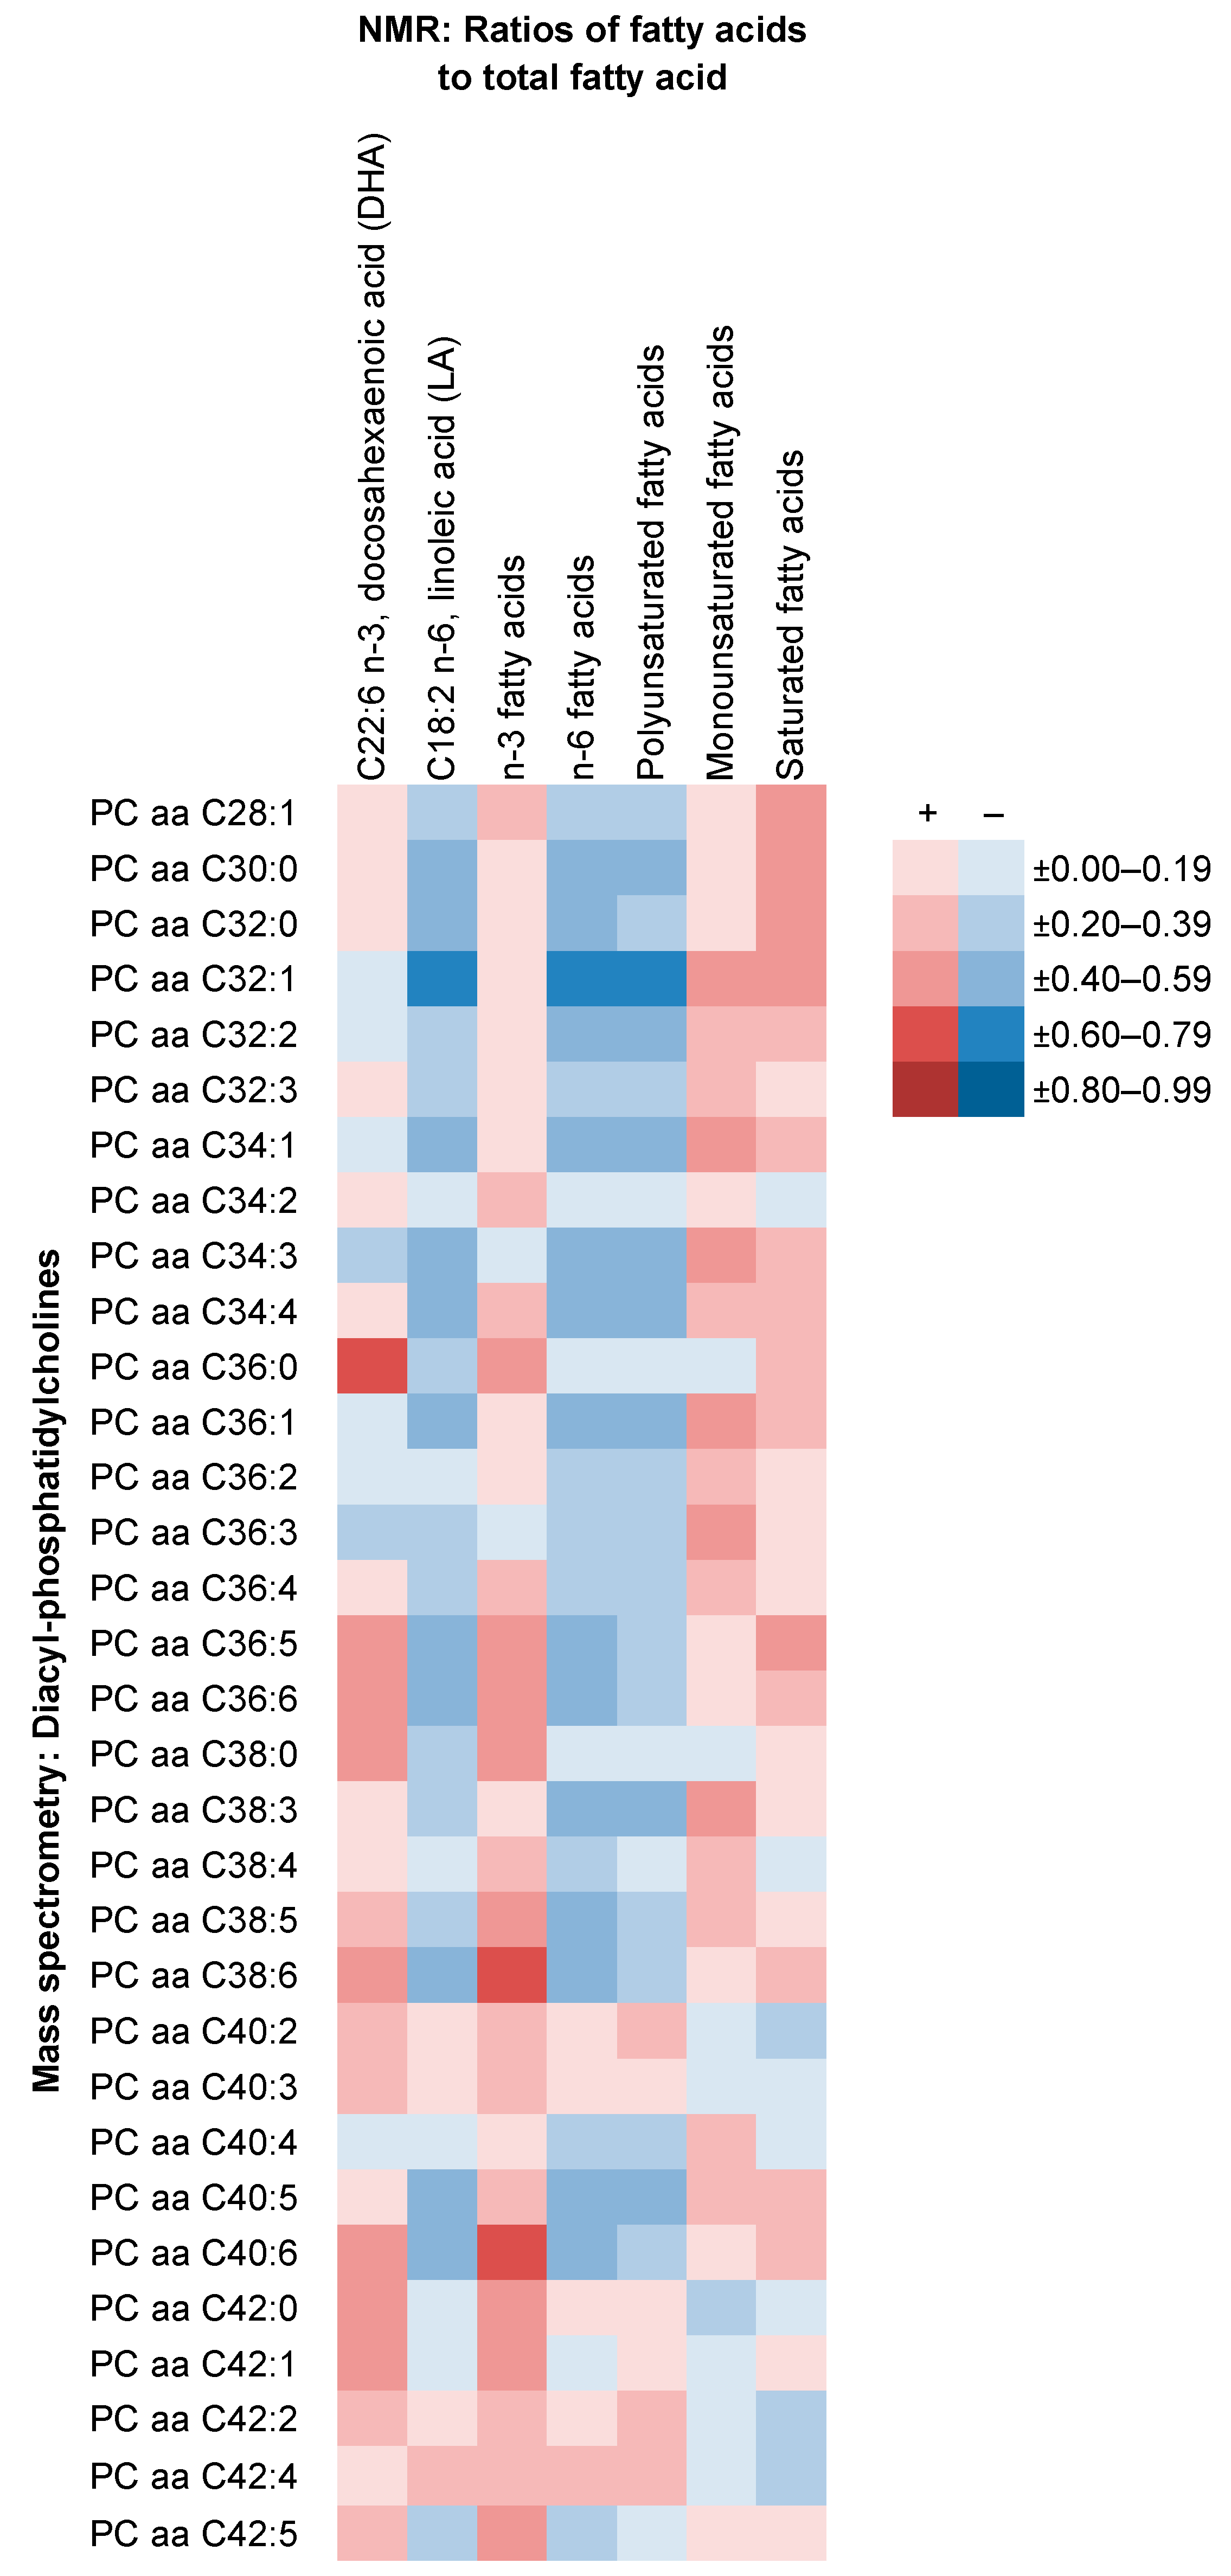
2.4. Comparison of NMR Measures with Those from MS, Clinical Chemistry and GC
3. Discussion
3.1. Main Findings
3.2. Findings in Context of the Literarure
3.3. Strengths and Limitations
3.4. Future Work
4. Materials and Methods
4.1. Study Population and Data Collection
4.2. Laboratory Analysis
4.3. Statistical Analysis
5. Conclusions
Supplementary Materials
Author Contributions
Funding
Institutional Review Board Statement
Informed Consent Statement
Data Availability Statement
Acknowledgments
Conflicts of Interest
Disclaimer
References
- Leitzmann, C. Vegetarian nutrition: Past, present, future. Am. J. Clin. Nutr. 2014, 100 (Suppl. S1), 496S–502S. [Google Scholar] [CrossRef]
- Satija, A.; Bhupathiraju, S.N.; Spiegelman, D.; Chiuve, S.E.; Manson, J.E.; Willett, W.; Rexrode, K.M.; Rimm, E.B.; Hu, F.B. Healthful and Unhealthful Plant-Based Diets and the Risk of Coronary Heart Disease in U.S. Adults. J. Am. Coll. Cardiol. 2017, 70, 411–422. [Google Scholar] [CrossRef] [PubMed]
- Kahleova, H.; Levin, S.; Barnard, N.D. Vegetarian Dietary Patterns and Cardiovascular Disease. Prog. Cardiovasc. Dis. 2018, 61, 54–61. [Google Scholar] [CrossRef]
- Tong, T.Y.N.; Appleby, P.N.; Bradbury, K.E.; Perez-Cornago, A.; Travis, R.C.; Clarke, R.; Key, T.J. Risks of ischaemic heart disease and stroke in meat eaters, fish eaters, and vegetarians over 18 years of follow-up: Results from the prospective EPIC-Oxford study. BMJ 2019, 366, l4897. [Google Scholar] [CrossRef]
- Orlich, M.J.; Singh, P.N.; Sabaté, J.; Fan, J.; Sveen, L.; Bennett, H.; Knutsen, S.F.; Beeson, W.L.; Jaceldo-Siegl, K.; Butler, T.L.; et al. Vegetarian Dietary Patterns and the Risk of Colorectal Cancers. JAMA Intern. Med. 2015, 175, 767–776. [Google Scholar] [CrossRef] [PubMed]
- Key, T.J.; Appleby, P.N.; Crowe, F.L.; Bradbury, K.E.; Schmidt, J.A.; Travis, R.C. Cancer in British vegetarians: Updated analyses of 4998 incident cancers in a cohort of 32,491 meat eaters, 8612 fish eaters, 18,298 vegetarians, and 2246 vegans. Am. J. Clin. Nutr. 2014, 100 (Suppl. S1), 378S–385S. [Google Scholar] [CrossRef]
- Tantamango-Bartley, Y.; Knutsen, S.F.; Knutsen, R.; Jacobsen, B.K.; Fan, J.; Beeson, W.L.; Sabate, J.; Hadley, D.; Jaceldo-Siegl, K.; Penniecook, J.; et al. Are strict vegetarians protected against prostate cancer? Am. J. Clin. Nutr. 2016, 103, 153–160. [Google Scholar] [CrossRef] [PubMed]
- Tantamango-Bartley, Y.; Jaceldo-Siegl, K.; Fan, J.; Fraser, G. Vegetarian Diets and the Incidence of Cancer in a Low-risk Population. Cancer Epidemiol. Biomarkers Prev. 2013, 22, 286–294. [Google Scholar] [CrossRef]
- Papier, K.; Appleby, P.N.; Fensom, G.K.; Knuppel, A.; Perez-Cornago, A.; Schmidt, J.A.; Tong, T.Y.N.; Key, T.J. Vegetarian diets and risk of hospitalisation or death with diabetes in British adults: Results from the EPIC-Oxford study. Nutr. Diabetes 2019, 9, 7. [Google Scholar] [CrossRef]
- Tonstad, S.; Butler, T.; Yan, R.; Fraser, G.E. Type of Vegetarian Diet, Body Weight, and Prevalence of Type 2 Diabetes. Diabetes Care 2009, 32, 791–796. [Google Scholar] [CrossRef] [PubMed]
- Tong, T.Y.N.; Appleby, P.N.; Armstrong, M.E.G.; Fensom, G.K.; Knuppel, A.; Papier, K.; Perez-Cornago, A.; Travis, R.C.; Key, T.J. Vegetarian and vegan diets and risks of total and site-specific fractures: Results from the prospective EPIC-Oxford study. BMC Med. 2020, 18, 353. [Google Scholar] [CrossRef]
- Scalbert, A.; Brennan, L.; Manach, C.; Andres-Lacueva, C.; Dragsted, L.O.; Draper, J.; Rappaport, S.M.; Van Der Hooft, J.J.J.; Wishart, D.S. The food metabolome: A window over dietary exposure. Am. J. Clin. Nutr. 2014, 99, 1286–1308. [Google Scholar] [CrossRef]
- Guasch-Ferré, M.; Bhupathiraju, S.N.; Hu, F.B. Use of Metabolomics in Improving Assessment of Dietary Intake. Clin. Chem. 2018, 64, 82–98. [Google Scholar] [CrossRef]
- Wurtz, P.; Havulinna, A.S.; Soininen, P.; Tynkkynen, T.; Prieto-Merino, D.; Tillin, T.; Ghorbani, A.; Artati, A.; Wang, Q.; Tiainen, M.; et al. Metabolite profiling and cardiovascular event risk: A prospective study of 3 population-based cohorts. Circulation 2015, 131, 774–785. [Google Scholar] [CrossRef]
- Holmes, M.V.; Millwood, I.Y.; Kartsonaki, C.; Hill, M.R.; Bennett, D.A.; Boxall, R.; Guo, Y.; Xu, X.; Bian, Z.; Hu, R.; et al. Lipids, Lipoproteins, and Metabolites and Risk of Myocardial Infarction and Stroke. J. Am. Coll. Cardiol. 2018, 71, 620–632. [Google Scholar] [CrossRef]
- Marklund, M.; Wu, J.H.; Imamura, F.; Del Gobbo, L.C.; Fretts, A.; De Goede, J.; Shi, P.; Tintle, N.; Wennberg, M.; Aslibekyan, S.; et al. Biomarkers of Dietary Omega-6 Fatty Acids and Incident Cardiovascular Disease and Mortality. Circulation 2019, 139, 2422–2436. [Google Scholar] [CrossRef]
- Guasch-Ferré, M.; Hruby, A.; Toledo, E.; Clish, C.B.; Martínez-González, M.A.; Salas-Salvadó, J.; Hu, F.B. Metabolomics in Prediabetes and Diabetes: A Systematic Review and Meta-analysis. Diabetes Care 2016, 39, 833–846. [Google Scholar] [CrossRef]
- His, M.; Viallon, V.; Dossus, L.; Gicquiau, A.; Achaintre, D.; Scalbert, A.; Ferrari, P.; Romieu, I.; Onland-Moret, N.C.; Weiderpass, E.; et al. Prospective analysis of circulating metabolites and breast cancer in EPIC. BMC Med. 2019, 17, 1–13. [Google Scholar] [CrossRef]
- Schmidt, J.A.; Fensom, G.K.; Rinaldi, S.; Scalbert, A.; Appleby, P.N.; Achaintre, D.; Gicquiau, A.; Gunter, M.J.; Ferrari, P.; Kaaks, R.; et al. Patterns in metabolite profile are associated with risk of more aggressive prostate cancer: A prospective study of 3057 matched case-control sets from EPIC. Int. J. Cancer 2020, 146, 720–730. [Google Scholar] [CrossRef] [PubMed]
- Schmidt, J.A.; Rinaldi, S.; Ferrari, P.; Carayol, M.; Achaintre, D.; Scalbert, A.; Cross, A.J.; Gunter, M.J.; Fensom, G.K.; Appleby, P.N.; et al. Metabolic profiles of male meat eaters, fish eaters, vegetarians, and vegans from the EPIC-Oxford cohort. Am. J. Clin. Nutr. 2015, 102, 1518–1526. [Google Scholar] [CrossRef]
- Schmidt, J.A.; Rinaldi, S.; Scalbert, A.; Ferrari, P.; Achaintre, D.; Gunter, M.J.; Appleby, P.N.; Key, T.J.; Travis, R.C. Plasma concentrations and intakes of amino acids in male meat-eaters, fish-eaters, vegetarians and vegans: A cross-sectional analysis in the EPIC-Oxford cohort. Eur. J. Clin. Nutr. 2016, 70, 306–312. [Google Scholar] [CrossRef]
- Wu, G.D.; Compher, C.; Chen, E.Z.; Smith, S.A.; Shah, R.D.; Bittinger, K.; Chehoud, C.; Albenberg, L.G.; Nessel, L.; Gilroy, E.; et al. Comparative metabolomics in vegans and omnivores reveal constraints on diet-dependent gut microbiota metabolite production. Gut 2016, 65, 63–72. [Google Scholar] [CrossRef]
- Lindqvist, H.M.; Rådjursöga, M.; Malmodin, D.; Winkvist, A.; Ellegård, L. Serum metabolite profiles of habitual diet: Evaluation by 1H-nuclear magnetic resonance analysis. Am. J. Clin. Nutr. 2019, 110, 53–62. [Google Scholar] [CrossRef]
- Wang, F.; Wan, Y.; Yin, K.; Wei, Y.; Wang, B.; Yu, X.; Ni, Y.; Zheng, J.; Huang, T.; Song, M.; et al. Lower circulating branched-chain amino acid concentrations among vegetarians are associated with changes in gut microbial composition and function. Mol. Nutr. Food Res. 2019, 63, e1900612. [Google Scholar] [CrossRef]
- Xu, J.; Yang, S.; Cai, S.; Dong, J.; Li, X.; Chen, Z. Identification of biochemical changes in lactovegetarian urine using 1H NMR spectroscopy and pattern recognition. Anal. Bioanal. Chem. 2010, 396, 1451–1463. [Google Scholar] [CrossRef]
- Lindqvist, H.M.; Rådjursöga, M.; Torstensson, T.; Jansson, L.; Ellegård, L.; Winkvist, A. Urine Metabolite Profiles and Nutrient Intake Based on 4-Day Weighed Food Diary in Habitual Vegans, Vegetarians, and Omnivores. J. Nutr. 2021, 151, 30–39. [Google Scholar] [CrossRef] [PubMed]
- Bradbury, K.E.; Crowe, F.L.; Appleby, P.N.; Schmidt, J.A.; Travis, R.C.; Key, T.J. Serum concentrations of cholesterol, apolipoprotein A-I and apolipoprotein B in a total of 1694 meat-eaters, fish-eaters, vegetarians and vegans. Eur. J. Clin. Nutr. 2014, 68, 178–183. [Google Scholar] [CrossRef]
- Rosell, M.S.; Lloyd-Wright, Z.; Appleby, P.N.; Sanders, T.A.B.; Allen, N.E.; Key, T.J. Long-chain n-3 polyunsaturated fatty acids in plasma in British meat-eating, vegetarian, and vegan men. Am. J. Clin. Nutr. 2005, 82, 327–334. [Google Scholar] [CrossRef]
- Yu, B.; Zanetti, K.A.; Temprosa, M.; Albanes, D.; Appel, N.; Barrera, C.B.; Ben-Shlomo, Y.; Boerwinkle, E.; Casas, J.P.; Clish, C.; et al. The Consortium of Metabolomics Studies (COMETS): Metabolomics in 47 Prospective Cohort Studies. Am. J. Epidemiol. 2019, 188, 991–1012. [Google Scholar] [CrossRef] [PubMed]
- Rosell, M.; Appleby, P.; Spencer, E.; Key, T. Weight gain over 5 years in 21,966 meat-eating, fish-eating, vegetarian, and vegan men and women in EPIC-Oxford. Int. J. Obes. 2006, 30, 1389–1396. [Google Scholar] [CrossRef]
- Perez-Cornago, A.; Huybrechts, I.; Appleby, P.N.; Schmidt, J.A.; Crowe, F.L.; Overvad, K.; Tjønneland, A.; Kühn, T.; Katzke, V.; Trichopoulou, A.; et al. Intake of individual fatty acids and risk of prostate cancer in the European Prospective Investigation into Cancer and Nutrition. Int. J. Cancer 2020, 146, 44–57. [Google Scholar] [CrossRef]
- Fages, A.; Ferrari, P.; Monni, S.; Dossus, L.; Floegel, A.; Mode, N.; Johansson, M.; Travis, R.C.; Bamia, C.; Sánchez-Pérez, M.-J.; et al. Investigating sources of variability in metabolomic data in the EPIC study: The Principal Component Partial R-square (PC-PR2) method. Metabolomics 2014, 10, 1074–1083. [Google Scholar] [CrossRef]
- Pinto, A.M.; Sanders, T.A.B.; Kendall, A.C.; Nicolaou, A.; Gray, R.; Al-Khatib, H.; Hall, W.L. A comparison of heart rate variability, n-3 PUFA status and lipid mediator profile in age- and BMI-matched middle-aged vegans and omnivores. Br. J. Nutr. 2017, 117, 669–685. [Google Scholar] [CrossRef]
- Dierckx, T.; Chiche, L.; Daniel, L.; Lauwerys, B.; Van Weyenbergh, J.; Jourde-Chiche, N. Serum GlycA Level is Elevated in Active Systemic Lupus Erythematosus and Correlates to Disease Activity and Lupus Nephritis Severity. J. Clin. Med. 2020, 9, 970. [Google Scholar] [CrossRef]
- Tynkkynen, T.; Mursu, J.; Nurmi, T.; Tuppurainen, K.; Laatikainen, R.; Soininen, P. NMR protocol for determination of oxidation susceptibility of serum lipids and application of the protocol to a chocolate study. Metabolomics 2012, 8, 386–398. [Google Scholar] [CrossRef]
- Suhre, K.; Meisinger, C.; Döring, A.; Altmaier, E.; Belcredi, P.; Gieger, C.; Chang, D.; Milburn, M.V.; Gall, W.E.; Weinberger, K.M.; et al. Metabolic footprint of diabetes: A multiplatform metabolomics study in an epidemiological setting. PLoS ONE 2010, 5, e13953. [Google Scholar] [CrossRef]
- Raffler, J.; Römisch-Margl, W.; Petersen, A.-K.; Pagel, P.; Blöchl, F.; Hengstenberg, C.; Illig, T.; Meisinger, C.; Stark, K.; Wichmann, H.-E.; et al. Identification and MS-assisted interpretation of genetically influenced NMR signals in human plasma. Genome Med. 2013, 5, 13. [Google Scholar] [CrossRef]
- Yet, I.; Menni, C.; Shin, S.-Y.; Mangino, M.; Soranzo, N.; Adamski, J.; Suhre, K.; Spector, T.D.; Kastenmüller, G.; Bell, J.T. Genetic Influences on Metabolite Levels: A Comparison across Metabolomic Platforms. PLoS ONE 2016, 11, e0153672. [Google Scholar] [CrossRef]
- Wu, J.H.Y.; Marklund, M.; Imamura, F.; Tintle, N.; Korat, A.V.A.; De Goede, J.; Zhou, X.; Yang, W.-S.; de Oliveira Otto, M.C.; Kröger, J.; et al. Omega-6 fatty acid biomarkers and incident type 2 diabetes: Pooled analysis of individual-level data for 39,740 adults from 20 prospective cohort studies. Lancet Diabetes Endocrinol. 2017, 5, 965–974. [Google Scholar] [CrossRef]
- Imamura, F.; Sharp, S.J.; Koulman, A.; Schulze, M.B.; Kröger, J.; Griffin, J.L.; Huerta, J.M.; Guevara, M.; Sluijs, I.; Agudo, A.; et al. A combination of plasma phospholipid fatty acids and its association with incidence of type 2 diabetes: The EPIC-InterAct case-cohort study. PLoS Med. 2017, 14, e1002409. [Google Scholar] [CrossRef]
- Stevens, V.L.; Hoover, E.; Wang, Y.; Zanetti, K.A. Pre-Analytical Factors that Affect Metabolite Stability in Human Urine, Plasma, and Serum: A Review. Metabolites 2019, 9, 156. [Google Scholar] [CrossRef]
- Santos Ferreira, D.L.; Maple, H.J.; Goodwin, M.; Brand, J.S.; Yip, V.; Min, J.L.; Groom, A.; Lawlor, D.A.; Ring, S. The Effect of Pre-Analytical Conditions on Blood Metabolomics in Epidemiological Studies. Metabolites 2019, 9, 64. [Google Scholar] [CrossRef]
- Wurtz, P.; Wang, Q.; Soininen, P.; Kangas, A.J.; Fatemifar, G.; Tynkkynen, T.; Tiainen, M.; Perola, M.; Tillin, T.; Hughes, A.D.; et al. Metabolomic Profiling of Statin Use and Genetic Inhibition of HMG-CoA Reductase. J. Am. Coll. Cardiol. 2016, 67, 1200–1210. [Google Scholar] [CrossRef] [PubMed]
- Kaluarachchi, M.; Boulangé, C.L.; Karaman, I.; Lindon, J.C.; Ebbels, T.M.D.; Elliott, P.; Tracy, R.P.; Olson, N.C. A comparison of human serum and plasma metabolites using untargeted 1H NMR spectroscopy and UPLC-MS. Metabolomics 2018, 14, 1–12. [Google Scholar] [CrossRef]
- Li-Gao, R.; Hughes, D.A.; Le Cessie, S.; De Mutsert, R.; Heijer, M.D.; Rosendaal, F.R.; Van Dijk, K.W.; Timpson, N.J.; Mook-Kanamori, D.O. Assessment of reproducibility and biological variability of fasting and postprandial plasma metabolite concentrations using 1H NMR spectroscopy. PLoS ONE 2019, 14, e0218549. [Google Scholar] [CrossRef] [PubMed]
- Davey, G.K.; Spencer, E.A.; Appleby, P.N.; Allen, N.E.; Knox, K.H.; Key, T.J. EPIC-Oxford: Lifestyle characteristics and nutrient intakes in a cohort of 33,883 meat-eaters and 31,546 non meat-eaters in the UK. Public Health Nutr. 2003, 6, 259–268. [Google Scholar] [CrossRef]
- Bingham, S.A.; Cassidy, A.; Cole, T.J.; Welch, A.; Runswick, S.A.; Black, A.E.; Thurnham, D.; Bates, C.; Khaw, K.T.; Key, T.J.A.; et al. Validation of weighed records and other methods of dietary assessment using the 24 h urine nitrogen technique and other biological markers. Br. J. Nutr. 1995, 73, 531–550. [Google Scholar] [CrossRef]
- Bingham, S.A.; Gill, C.; Welch, A.; Day, K.; Cassidy, A.; Khaw, K.T.; Sneyd, M.J.; Key, T.J.A.; Roe, L.; Day, N.E. Comparison of dietary assessment methods in nutritional epidemiology: Weighed records v. 24 h recalls, food-frequency questionnaires and estimated-diet records. Br. J. Nutr. 1994, 72, 619–643. [Google Scholar] [CrossRef]
- Soininen, P.; Kangas, A.J.; Raitakari, O.T.; Savolainen, M.J.; Ala-Korpela, M.; Würtz, P.; Tukiainen, T.; Tynkkynen, T.; Laatikainen, R.; Järvelin, M.-R.; et al. High-throughput serum NMR metabonomics for cost-effective holistic studies on systemic metabolism. Analyst 2009, 134, 1781–1785. [Google Scholar] [CrossRef] [PubMed]
- Soininen, P.; Kangas, A.J.; Würtz, P.; Suna, T.; Ala-Korpela, M. Quantitative Serum Nuclear Magnetic Resonance Metabolomics in Cardiovascular Epidemiology and Genetics. Circ. Cardiovasc. Genet. 2015, 8, 192–206. [Google Scholar] [CrossRef] [PubMed]
- Würtz, P.; Kangas, A.J.; Soininen, P.; Lawlor, D.A.; Smith, G.D.; Ala-Korpela, M. Quantitative Serum Nuclear Magnetic Resonance Metabolomics in Large-Scale Epidemiology: A Primer on -Omic Technologies. Am. J. Epidemiol. 2017, 186, 1084–1096. [Google Scholar] [CrossRef] [PubMed]
- Benjamini, Y.; Hochberg, Y. Controlling the False Discovery Rate—A Practical and Powerful Approach to Multiple Testing. J. R. Stat. Soc. Ser. B Methodol. 1995, 57, 289–300. [Google Scholar] [CrossRef]
- Eriksson, L.; Byrne, T.; Johansson, E.; Trygg, J.; Vikström, C. Multi- and Megavariate Data Analysis Basic—Principles and Applications, 3rd ed.; MKS Umetrics AB: Malmö, Sweden, 2013; pp. 55–88. [Google Scholar]
- Simeone, P.; Trerotola, M.; Urbanella, A.; Lattanzio, R.; Ciavardelli, D.; Di Giuseppe, F.; Eleuterio, E.; Sulpizio, M.; Eusebi, V.; Pession, A.; et al. A Unique Four-Hub Protein Cluster Associates to Glioblastoma Progression. PLoS ONE 2014, 9, e103030. [Google Scholar] [CrossRef] [PubMed]
| Meat-Eaters (n = 80) | Fish-Eaters (n = 69) | Vegetarians (n = 74) | Vegans (n = 63) | |
|---|---|---|---|---|
| Participant characteristics | ||||
| Age at blood collection, years | 44.0 (37.0, 44.0) | 43.0 (38.0, 46.0) | 44.0 (36.0, 44.0) | 42.0 (38.0, 46.0) |
| Body mass index 2, kg/m2 | 24.5 (22.1, 26.1) | 22.7 (21.1, 24.4) | 22.9 (21.6, 25.7) | 22.1 (20.5, 24.4) |
| Waist circumference 2, cm | 86.0 (81.0, 91.0) | 81.0 (79.0, 86.0) | 84.0 (81.0, 86.0) | 81.0 (76.0, 89.0) |
| Current smoker | 10 (12%) | 6 (9%) | 5 (7%) | 3 (5%) |
| Very physically active 2,3 | 19 (25%) | 12 (18%) | 11 (16%) | 21 (35%) |
| Alcohol intake, g/d | 9.8 (3.2, 17.5) | 10.6 (4.9, 30.0) | 10.6 (5.1, 28.6) | 2.9 (1.0, 13.0) |
| Nutrient intakes 4 | ||||
| Energy, kJ/d | 9562 (8156, 11508) | 9681 (8347, 11025) | 9640 (8197, 11523) | 8169 (6615, 9689) |
| Protein, %E | 14.0 (12.7, 15.7) | 13.0 (11.6, 14.6) | 12.6 (11.1, 13.9) | 12.6 (11.2, 13.8) |
| Carbohydrate, %E | 51.5 (47.9, 55.7) | 51.8 (49.0, 58.4) | 53.9 (48.8, 58.1) | 58.8 (54.9, 64.0) |
| Total fat, %E | 31.6 (28.3, 34.8) | 31.9 (26.6, 35.4) | 31.2 (28.7, 34.9) | 28.6 (22.9, 33.9) |
| SFA, %E | 10.2 (8.7, 12.1) | 9.7 (7.7, 11.8) | 9.8 (8.0, 11.8) | 5.4 (4.2, 6.8) |
| MUFA, %E | 11.0 (9.1, 11.9) | 10.2 (8.9, 11.7) | 10.7 (9.2, 11.9) | 10.7 (7.8, 12.2) |
| PUFA, %E | 7.2 (6.2, 8.1) | 7.9 (6.8, 8.8) | 8.0 (6.8, 9.1) | 9.6 (7.9, 11.4) |
| DHA (C22:6 n-3), %E | 0.031 (0.021, 0.044) | 0.028 (0.020, 0.043) | 0.003 (0.002, 0.005) | - |
| LA (C18:2 n-6), %E | 6.4 (5.5, 7.1) | 7.0 (6.0, 7.8) | 7.0 (6.0, 8.2) | 8.3 (6.8, 9.6) |
| Blood sample related factors | ||||
| Time since last meal 2, h | 1.8 (1.0, 3.3) | 2.0 (1.2, 4.0) | 2.3 (1.5, 4.0) | 2.5 (1.5, 4.1) |
| Meds./supplements taken 2 | 54 (68%) | 44 (65%) | 51 (69%) | 40 (63%) |
| Time, collection 2, hh:mm | 11:10 (10:00, 15:20) | 10:50 (9:45, 15:38) | 10:25 (9:40, 13:00) | 10:30 (9:35, 15:00) |
| Process delay ≤ 32 h 2,5 | 52 (66%) | 24 (35%) | 37 (51%) | 27 (46%) |
| Metabolites | Meat-Eaters (n = 80) | Fish-Eaters (n = 69) | Vegetarians (n = 74) | Vegans (n = 63) | p(adj)2 |
|---|---|---|---|---|---|
| Mean (95% CI) | Mean (95% CI) | Mean (95% CI) | Mean (95% CI) | ||
| XS VLDL, μmol/L | |||||
| Cholesterol esters | 159 (151, 168) | 154 (145, 162) | 149 (141, 157) | 132 (124, 140) | 6 × 10⁻⁴ |
| XL HDL, μmol/L | |||||
| Triglycerides | 11.4 (9.95, 13.1) | 11.1 (9.62, 12.8) | 11.2 (9.85, 12.8) | 6.89 (5.93, 8.00) | 3 × 10⁻⁵ |
| L HDL, μmol/L | |||||
| Triglycerides | 20.3 (17.9, 23.0) | 20.4 (18.0, 23.2) | 20.1 (17.8, 22.7) | 12.9 (11.3, 14.8) | 2 × 10⁻⁵ |
| Ratio to total lipids in XXL VLDL, % | |||||
| Total cholesterol 3 | 17.1 (15.9, 18.3) | 18.0 (16.7, 19.3) | 17.2 (16.1, 18.4) | 13.6 (12.6, 14.8) | 6 × 10⁻⁵ |
| Ratio to total lipids in XL VLDL, % | |||||
| Triglycerides 3 | 60.2 (59.0, 61.3) | 61.0 (59.8, 62.3) | 62.6 (61.5, 63.7) | 64.5 (63.0, 66.1) | 7 × 10⁻⁴ |
| Ratio to total lipids in M VLDL, % | |||||
| Total cholesterol | 28.6 (27.8, 29.3) | 28.4 (27.7, 29.2) | 28.0 (27.3, 28.8) | 26.2 (25.5, 27.0) | 8 × 10⁻⁴ |
| Triglycerides | 50.8 (50.1, 51.5) | 51.1 (50.4, 51.8) | 51.6 (51.0, 52.3) | 53.1 (52.3, 53.8) | 8 × 10⁻⁴ |
| Ratio to total lipids in XS VLDL, % | |||||
| Total cholesterol | 49.4 (48.9, 50.0) | 49.1 (48.6, 49.6) | 48.6 (48.2, 49.1) | 47.3 (46.7, 47.8) | 8 × 10⁻⁶ |
| Cholesterol esters | 33.6 (33.1, 34.1) | 33.3 (32.9, 33.8) | 33.1 (32.7, 33.6) | 31.5 (31.0, 31.9) | 3 × 10⁻⁷ |
| Ratio to total lipids in IDL,% | |||||
| Phospholipids | 27.5 (27.3, 27.6) | 27.5 (27.3, 27.7) | 27.5 (27.4, 27.7) | 60.2 (59.6, 60.8) | 1 × 10⁻³ |
| Cholesterol esters | 43.9 (43.5, 44.4) | 43.7 (43.3, 44.1) | 44.1 (43.7, 44.5) | 42.6 (42.2, 43.1) | 4 × 10⁻⁴ |
| Ratio to total lipids in M HDL, % | |||||
| Phospholipids | 47.1 (46.7, 47.5) | 47.2 (46.8, 47.6) | 46.8 (46.4, 47.1) | 46.0 (45.6, 46.4) | 6 × 10⁻⁴ |
| Triglycerides and phospholipids, μmol/L | |||||
| Sphingomyelins 3 | 391 (378, 405) | 376 (363, 389) | 366 (354, 378) | 339 (327, 352) | 3 × 10⁻⁵ |
| Fatty acids, μmol/L | |||||
| Estimated degree of unsaturation3 | 1.19 (1.18, 1.19) | 1.17 (1.16, 1.18) | 1.15 (1.14, 1.16) | 1.17 (1.16, 1.18) | 9 × 10⁻⁶ |
| DHA, C22:6 n-3 3 | 126 (118, 134) | 124 (116, 132) | 99.3 (93.4, 106) | 97.5 (91.0, 104) | 2 × 10⁻⁹ |
| n-3 fatty acids 3 | 380 (355, 407) | 376 (350, 403) | 312 (292, 334) | 307 (285, 331) | 2 × 10⁻⁵ |
| Ratios of fatty acids to total fatty acid, % | |||||
| DHA, C22:6 n-3 3 | 1.27 (1.21, 1.33) | 1.27 (1.21, 1.33) | 1.01 (0.96, 1.05) | 1.03 (0.98, 1.09) | 2 × 10⁻¹³ |
| LA, C18:2 n-6 3 | 28.3 (27.5, 29.1) | 30.1 (29.2, 30.9) | 29.1 (28.3, 29.9) | 31.9 (30.9, 32.9) | 3 × 10⁻⁵ |
| n-3 fatty acids 3 | 3.82 (3.65, 4.00) | 3.85 (3.67, 4.03) | 3.16 (3.03, 3.31) | 3.25 (3.09, 3.42) | 5 × 10⁻¹⁰ |
| n-6 fatty acids 3 | 33.5 (33.0, 34.1) | 34.3 (33.7, 34.9) | 33.5 (33.0, 34.1) | 35.5 (34.8, 36.1) | 6 × 10⁻⁴ |
| Polyunsaturated fatty acids 3 | 37.4 (36.8, 38.0) | 38.2 (37.6, 38.9) | 36.7 (36.2, 37.3) | 38.8 (38.1, 39.5) | 8 × 10⁻⁴ |
| Saturated fatty acids 3 | 36.3 (36.0, 36.6) | 36.0 (35.7, 36.3) | 36.3 (36.0, 36.6) | 34.7 (34.4, 35.1) | 5 × 10⁻¹⁰ |
| Amino acids, μmol/L | |||||
| Tyrosine 3 | 54.8 (52.5, 57.1) | 57.2 (54.8, 59.7) | 59.1 (56.7, 61.6) | 51.1 (48.8, 53.5) | 6 × 10⁻⁴ |
| Metabolites | n | r | p |
|---|---|---|---|
| Mass spectrometry 1 | |||
| Alanine | 286 | 0.94 | <0.0001 |
| Glutamine | 279 | 0.62 | <0.0001 |
| Histidine | 284 | 0.74 | <0.0001 |
| Histidine, excl. 1 outlier | 283 | 0.68 | <0.0001 |
| Isoleucine | 286 | 0.83 | <0.0001 |
| Leucine | 286 | 0.87 | <0.0001 |
| Valine | 286 | 0.70 | <0.0001 |
| Phenylalanine | 220 | 0.49 | <0.0001 |
| Tyrosine | 284 | 0.87 | <0.0001 |
| Creatinine | 284 | 0.84 | <0.0002 |
| Clinical chemistry 2 | |||
| Apolipoprotein A-I | 286 | 0.82 | <0.0001 |
| Apolipoprotein B | 286 | 0.92 | <0.0001 |
| Total cholesterol | 286 | 0.94 | <0.0001 |
| Total high-density lipoprotein (HDL) cholesterol | 286 | 0.86 | <0.0001 |
| Capillary gas-liquid chromatography 3 | |||
| C22:6 n-3, docosahexaenoic acid (DHA) | 71 | 0.03 | 0.8 |
| C22:6 n-3, docosahexaenoic acid (DHA), excl. 1 outlier | 70 | −0.01 | 0.9 |
| C18:2 n-6, linoleic acid (LA) | 72 | 0.15 | 0.2 |
Publisher’s Note: MDPI stays neutral with regard to jurisdictional claims in published maps and institutional affiliations. |
© 2021 by the authors. Licensee MDPI, Basel, Switzerland. This article is an open access article distributed under the terms and conditions of the Creative Commons Attribution (CC BY) license (http://creativecommons.org/licenses/by/4.0/).
Share and Cite
Schmidt, J.A.; Fensom, G.K.; Rinaldi, S.; Scalbert, A.; Gunter, M.J.; Holmes, M.V.; Key, T.J.; Travis, R.C. NMR Metabolite Profiles in Male Meat-Eaters, Fish-Eaters, Vegetarians and Vegans, and Comparison with MS Metabolite Profiles. Metabolites 2021, 11, 121. https://doi.org/10.3390/metabo11020121
Schmidt JA, Fensom GK, Rinaldi S, Scalbert A, Gunter MJ, Holmes MV, Key TJ, Travis RC. NMR Metabolite Profiles in Male Meat-Eaters, Fish-Eaters, Vegetarians and Vegans, and Comparison with MS Metabolite Profiles. Metabolites. 2021; 11(2):121. https://doi.org/10.3390/metabo11020121
Chicago/Turabian StyleSchmidt, Julie A., Georgina K. Fensom, Sabina Rinaldi, Augustin Scalbert, Marc J. Gunter, Michael V. Holmes, Timothy J. Key, and Ruth C. Travis. 2021. "NMR Metabolite Profiles in Male Meat-Eaters, Fish-Eaters, Vegetarians and Vegans, and Comparison with MS Metabolite Profiles" Metabolites 11, no. 2: 121. https://doi.org/10.3390/metabo11020121
APA StyleSchmidt, J. A., Fensom, G. K., Rinaldi, S., Scalbert, A., Gunter, M. J., Holmes, M. V., Key, T. J., & Travis, R. C. (2021). NMR Metabolite Profiles in Male Meat-Eaters, Fish-Eaters, Vegetarians and Vegans, and Comparison with MS Metabolite Profiles. Metabolites, 11(2), 121. https://doi.org/10.3390/metabo11020121


