Article

Integrative Analysis of Metabolome and Microbiome in Patients with Progressive Alcohol-Associated Liver Disease

1
School of Marine Sciences, Nanjing University of Information Science and Technology, Nanjing 210044, China
2
Department of Medicine, University of California San Diego, La Jolla, CA 92093, USA
3
School of Biological and Pharmaceutical Engineering, Nanjing Tech University, Nanjing 211816, China
4
School of Environmental Science and Engineering, Nanjing University of Information Science and Technology, Nanjing 210044, China
5
Jiangsu Key Laboratory of Atmospheric Environment Monitoring and Pollution Control, Collaborative Inovation Center of Atmospheric Environment and Equipment Technology, Nanjing 210044, China
6
Laboratory of Hepato-Gastroenterology, Institute of Experimental and Clinical Research, Université Catholique de Louvain, 1200 Brussels, Belgium
7
Department of Hepato-Gastroenterology, St. Luc University Hospital, Université Catholique de Louvain, 1200 Brussels, Belgium
8
Department of Medicine, VA San Diego Healthcare System, San Diego, CA 92161, USA
*
Authors to whom correspondence should be addressed.
Metabolites 2021, 11(11), 766; https://doi.org/10.3390/metabo11110766
Submission received: 14 October 2021 / Revised: 5 November 2021 / Accepted: 7 November 2021 / Published: 10 November 2021
(This article belongs to the Special Issue Biomarker Discovery through Microbiome Metabolism Analysis)

Abstract

:
Alcohol-associated liver disease is one of the most prevalent diseases around the world, with 10–20% of patients developing progressive liver disease. To identify the complex and correlated nature of metabolic and microbial data types in progressive liver disease, we performed an integrated analysis of the fecal and serum metabolomes with the gut microbiome in a cohort of 38 subjects, including 15 patients with progressive liver disease, 16 patients with non-progressive liver disease, and 7 control subjects. We found that although patients were generally clustered in three groups according to disease status, metabolites showed better separation than microbial species. Furthermore, eight serum metabolites were correlated with two microbial species, among which seven metabolites were decreased in patients with progressive liver disease. Five fecal metabolites were correlated with three microbial species, among which four metabolites were decreased in patients with progressive liver disease. When predicting progressive liver disease from non-progressive liver disease using correlated metabolic and microbial signatures with the random forest model, correlated serum metabolites and microbial species showed great predictive power, with the area under the receiver operating characteristic curve achieving 0.91. The multi-omics signatures identified in this study are helpful for the early identification of patients with progressive alcohol-associated liver disease, which is a key step for therapeutic intervention.

Graphical Abstract

1. Introduction

Alcohol-associated liver disease (ALD) is one of the most prevalent diseases around the world and is a global health burden [1,2,3]. Chronic alcohol consumption is the main contributor to ALD development [1,2]. Other factors, such as gender, ethnicity, metabolic syndrome, concomitant liver diseases, genetic factors, and smoking history, can also affect the progression of ALD [1,2]. ALD includes a wide spectrum of liver manifestations, from simple steatosis developing in the majority of patients with alcohol use disorder, to progressive steatohepatitis, fibrosis, and cirrhosis developing in 10–20% of patients. Early identification of progressive liver disease is a key step for effective intervention.
Chronic alcohol consumption or binge drinking significantly alters the gut microbial profile, resulting in increased bacterial translocation and intestinal barrier dysfunction, which promotes ALD development [4,5,6,7,8,9,10,11,12]. While abstinence is the most important factor for ALD treatment, the use of probiotics to alter the gut microbiota might be effective in the prevention and treatment of ALD [13,14,15,16,17]. Metabolomics studies are conducted to determine host or bacteria-associated metabolites as biomarkers of ALD [8,18]. For instance, changes in the gut microbiota affect bile acid metabolism and induce inflammation and liver injury in ALD patients [19,20,21,22,23,24].
While technological advances have led to multiple omics datasets, large-scale multi-omics integration is still a challenging task. While there are many software tools available to analyze metabolomics or microbial datasets, most of them are only accountable for analyzing single omics datasets. However, investigating a single omics dataset is oftentimes insufficient to fully understand the biological significance of gut microbes and metabolites. Here, we used mixOmics to perform an integrative and comprehensive analysis of the metabolome and gut microbiome in ALD patients, which incorporates a wide range of methods to support multi-omics analysis [25]. We investigated the complex and correlated nature of metagenomics and metabolomics data, which are used as multi-omics signatures to predict progressive liver disease in ALD patients.

2. Results

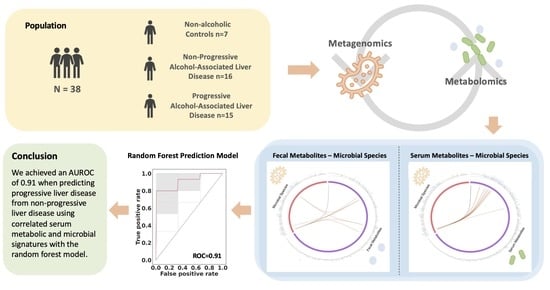
2.1. Patient Characteristics

We used mixOmics to perform an integrative analysis of the metabolome and microbial species in 38 subjects, including 15 patients with progressive liver disease, 16 patients with non-progressive liver disease, and 7 control subjects. Subject characteristics are shown in Table 1. As expected, patients with progressive liver disease showed higher levels of alanine aminotransferase (ALT), aspartate aminotransferase (AST), total bilirubin, gamma-glutamyl-transferase (GGT), controlled attenuation parameter (CAP), and CK18-M65.

2.2. Microbial Species, Fecal and Serum Metabolites in ALD Patients

A total of 280 microbial species were detected in ALD patients. As shown in Figure 1A, five, two, and eight microbial species were enriched in control subjects, patients with alcohol-associated non-progressive liver disease, and patients with progressive liver disease, respectively, as revealed by Linear discriminant analysis Effect Size (LEfSe).
A total of 590 metabolites were annotated in the fecal samples. When comparing patients with non-progressive liver disease to control subjects, 130 fecal metabolites showed a raw p-value of less than 0.05, among which 39 metabolites showed a false discovery rate (FDR) of less than 0.05 (Figure 1B, left). When comparing patients with progressive liver disease to control subjects, 130 metabolites showed a raw p-value of less than 0.05, among which 60 metabolites showed an FDR of less than 0.05 (Figure 1B, middle). When comparing patients with progressive liver disease to patients with non-progressive liver disease, 58 metabolites showed a raw p-value of less than 0.05, among which none showed an FDR of less than 0.05 (Figure 1B, right).
A total of 590 metabolites were also annotated in the serum samples. When comparing patients with non-progressive liver disease to control subjects, 123 serum metabolites showed a raw p-value of less than 0.05, among which 39 metabolites showed an FDR less than 0.05 (Figure 1C, left). When comparing patients with progressive liver disease to control subjects, 170 metabolites showed a raw p-value of less than 0.05, among which 89 metabolites showed an FDR of less than 0.05 (Figure 1C, middle). When comparing patients with progressive liver disease to patients with non-progressive liver disease, 78 metabolites showed a raw p-value of less than 0.05, among which six metabolites showed an FDR of less than 0.05 (Figure 1C, right).

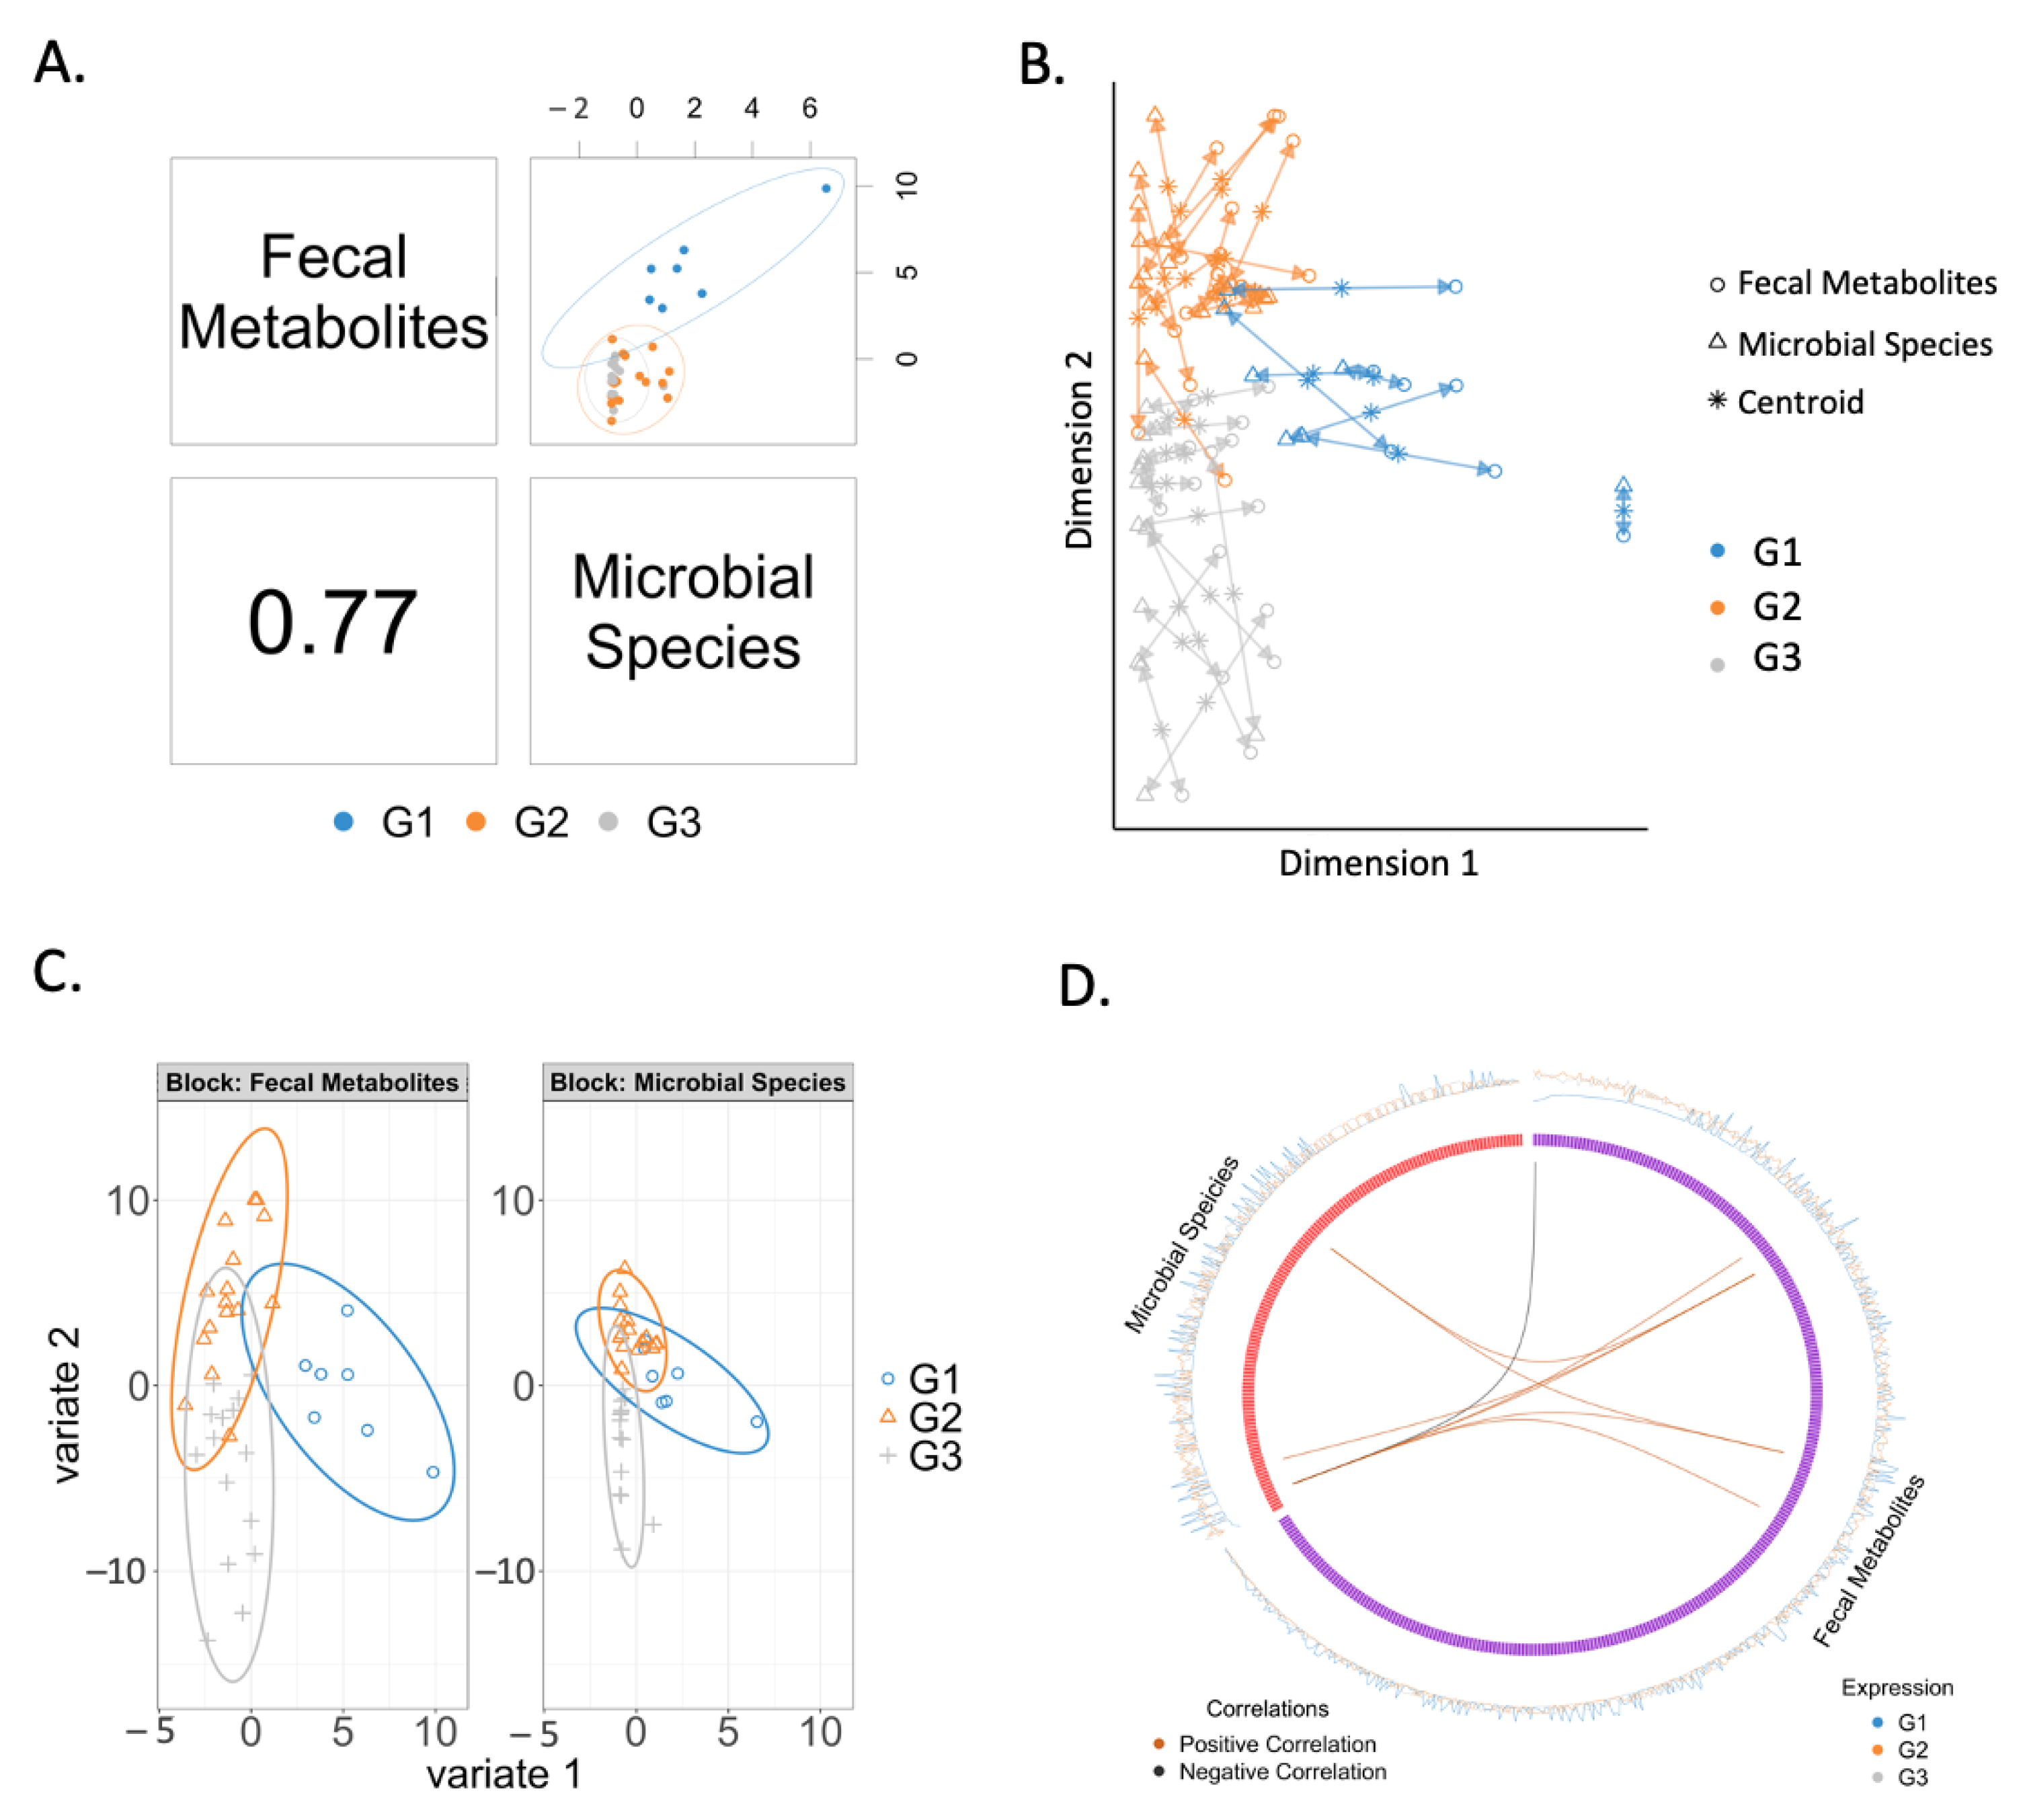
2.3. Correlation between Fecal Metabolites and Microbial Species

The overall correlation between fecal metabolites and microbial species was 0.77 (Figure 2A). The agreement between microbial species and fecal metabolites is shown in Figure 2B. When analyzing fecal metabolites and microbial species separately, we found that both microbial species and fecal metabolites were generally clustered in three groups according to the disease status, with fecal metabolites showing better separation than microbial species (Figure 2C). The correlation between fecal metabolites and microbial species is shown in the circos plot (Figure 2D, Table 2). Coprococcus sp. ART55/1 was negatively correlated with the fecal level of phenylalanine, and positively correlated with the fecal level of 3-methylglutarylcarnitine, carbamazepine, linolenic acid, and cystine. Meanwhile, Acidaminococcus fermentans was positively correlated with linolenic acid and cystine levels in feces. Lachnospiraceae bacterium 8_1_57FAA was positively correlated with the fecal level of linolenic acid.

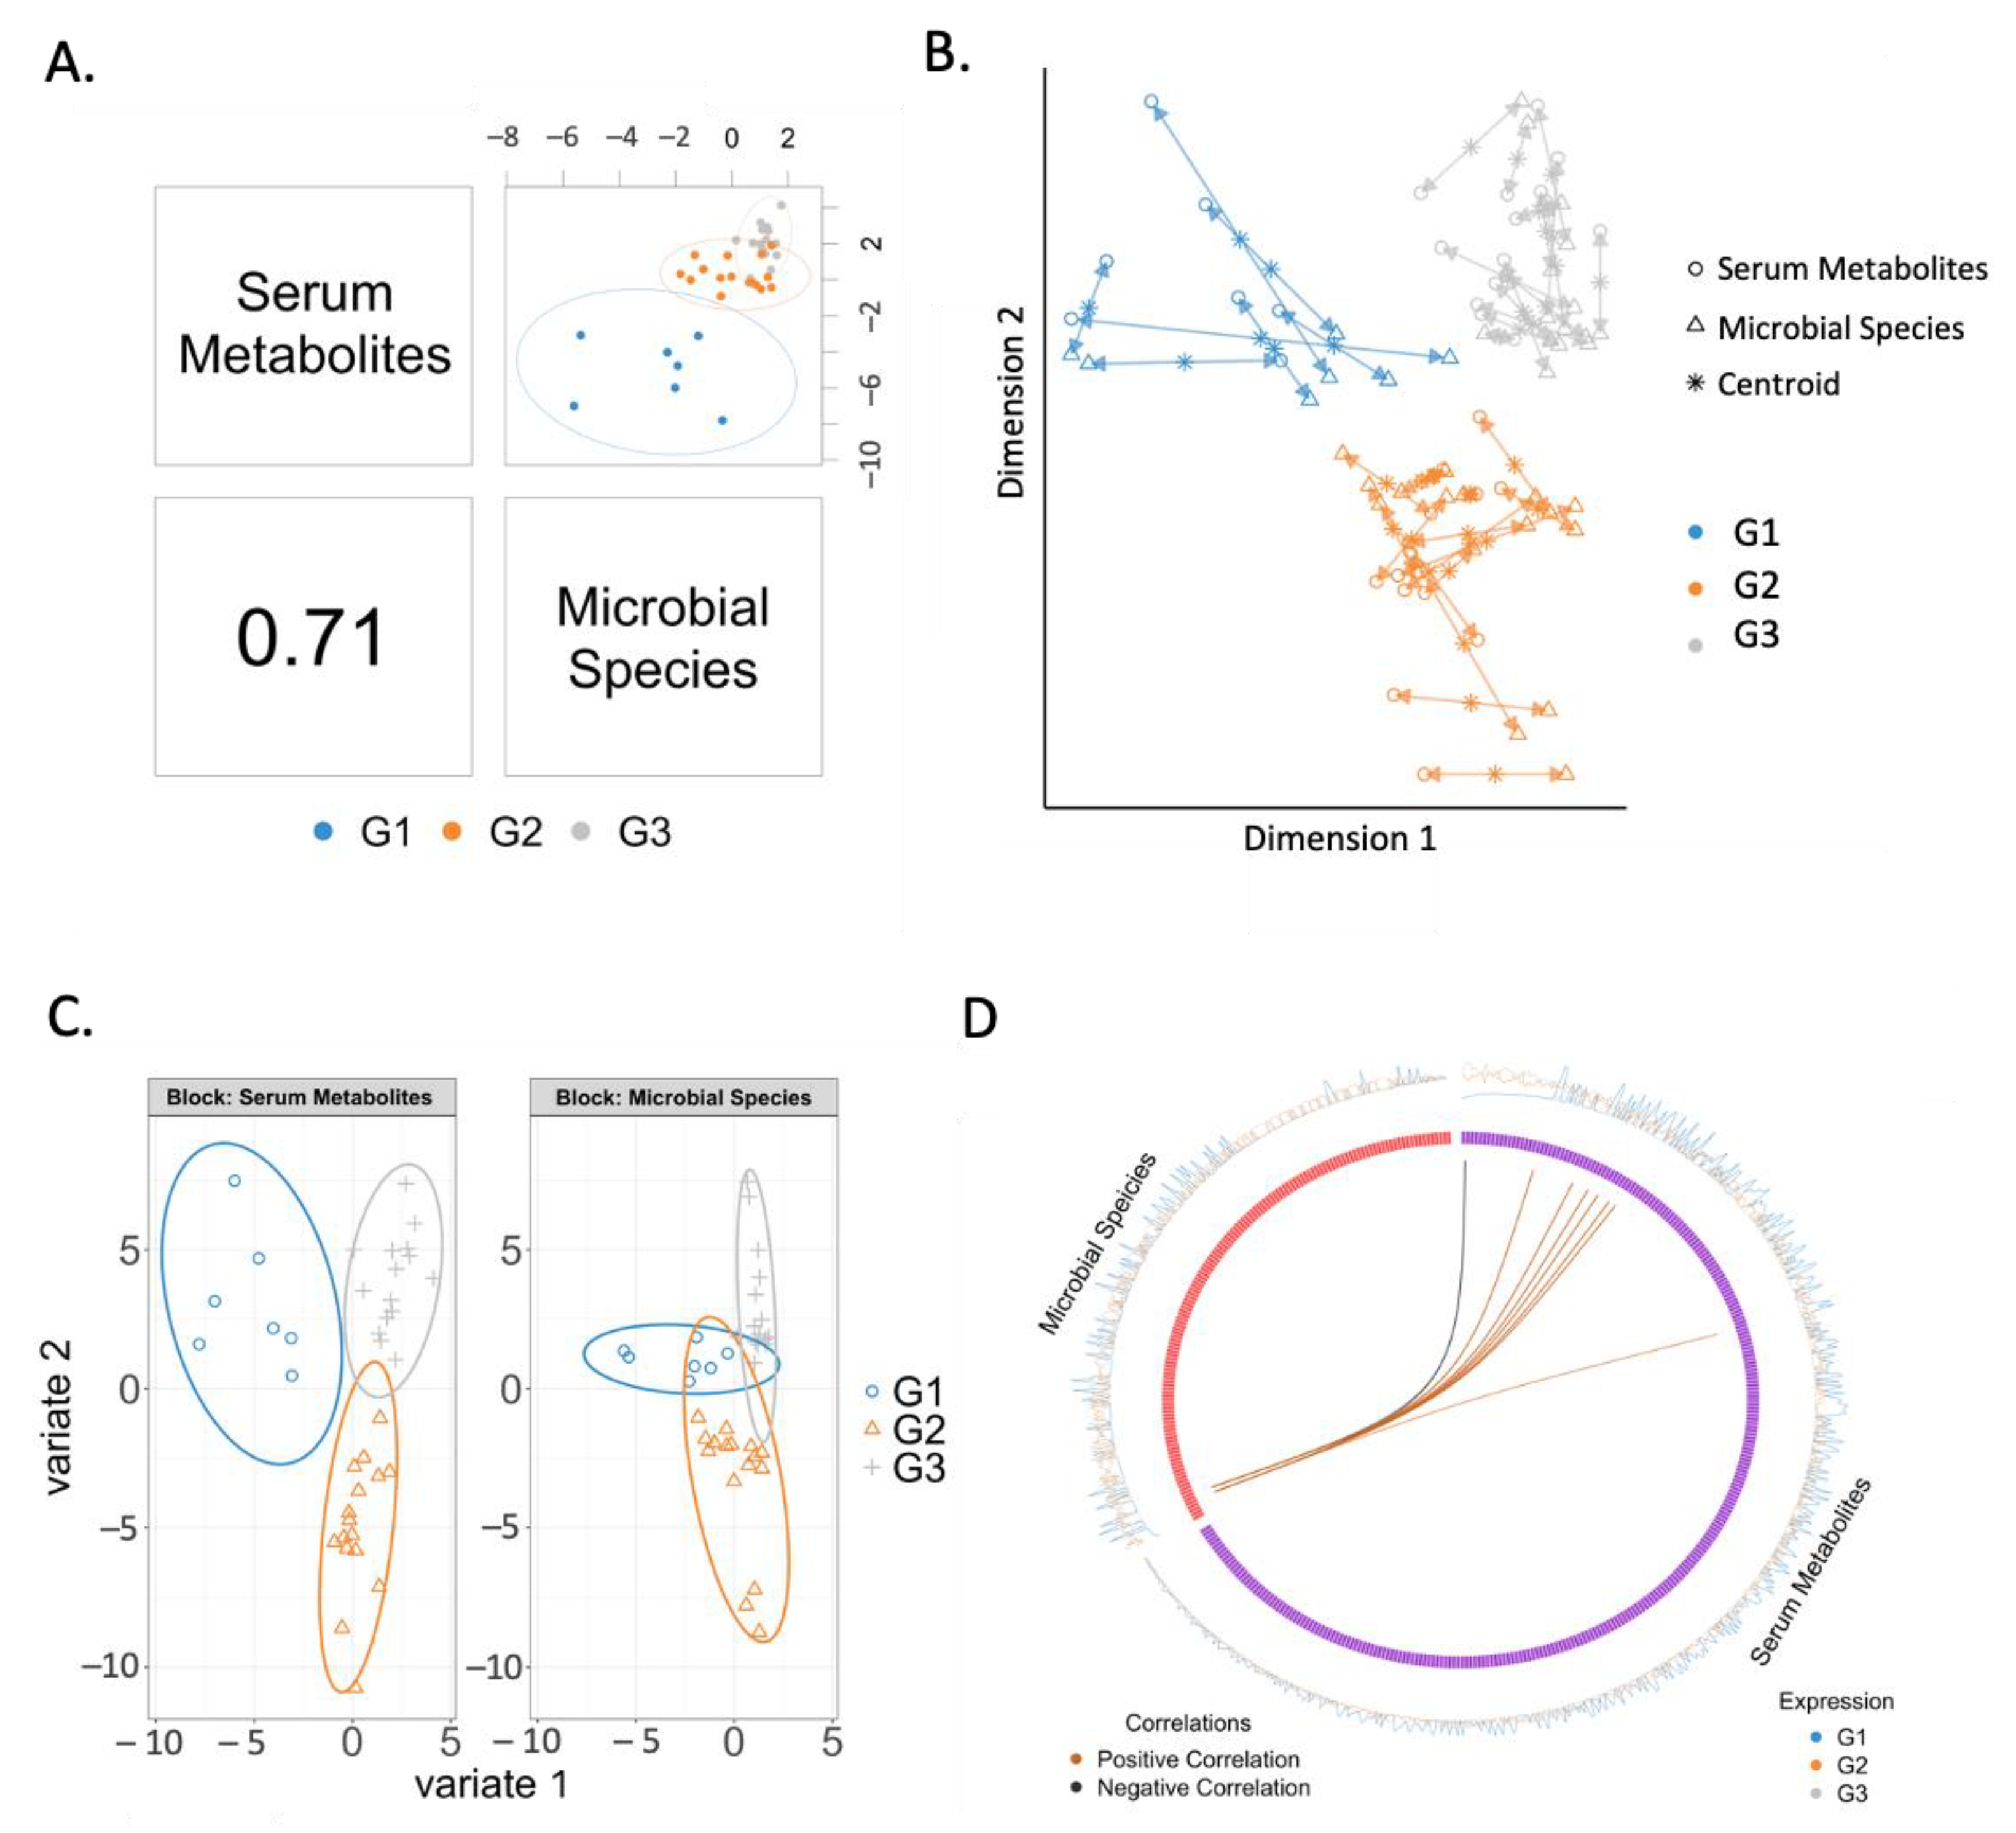
2.4. Correlation between Serum Metabolites and Microbial Species

The overall correlation between serum metabolites and microbial species was 0.71 (Figure 3A). In particular microbial species and serum metabolites from patients with progressive liver disease showed better agreement than the two other groups (Figure 3B). When analyzing serum metabolites and microbial species separately, we found that both microbial species and serum metabolites were generally clustered by disease status, with serum metabolites showing better separation than microbial species (Figure 3C). As shown in the circos plot, correlations were found between eight serum metabolites and two microbial species (Figure 3D, Table 3). Odoribacter splanchnicus and Coprococcus sp. ART55-1 were negatively correlated with the serum level of glutamic acid, but positively correlated with 2-O-methylcytidine, 3-hydroxyanthranilic acid, glutamine, guanosine, inosine, and kynurenic acid. In addition, Coprococcus sp. ART55-1 was positively correlated with the serum level of butyrylcarnitine.

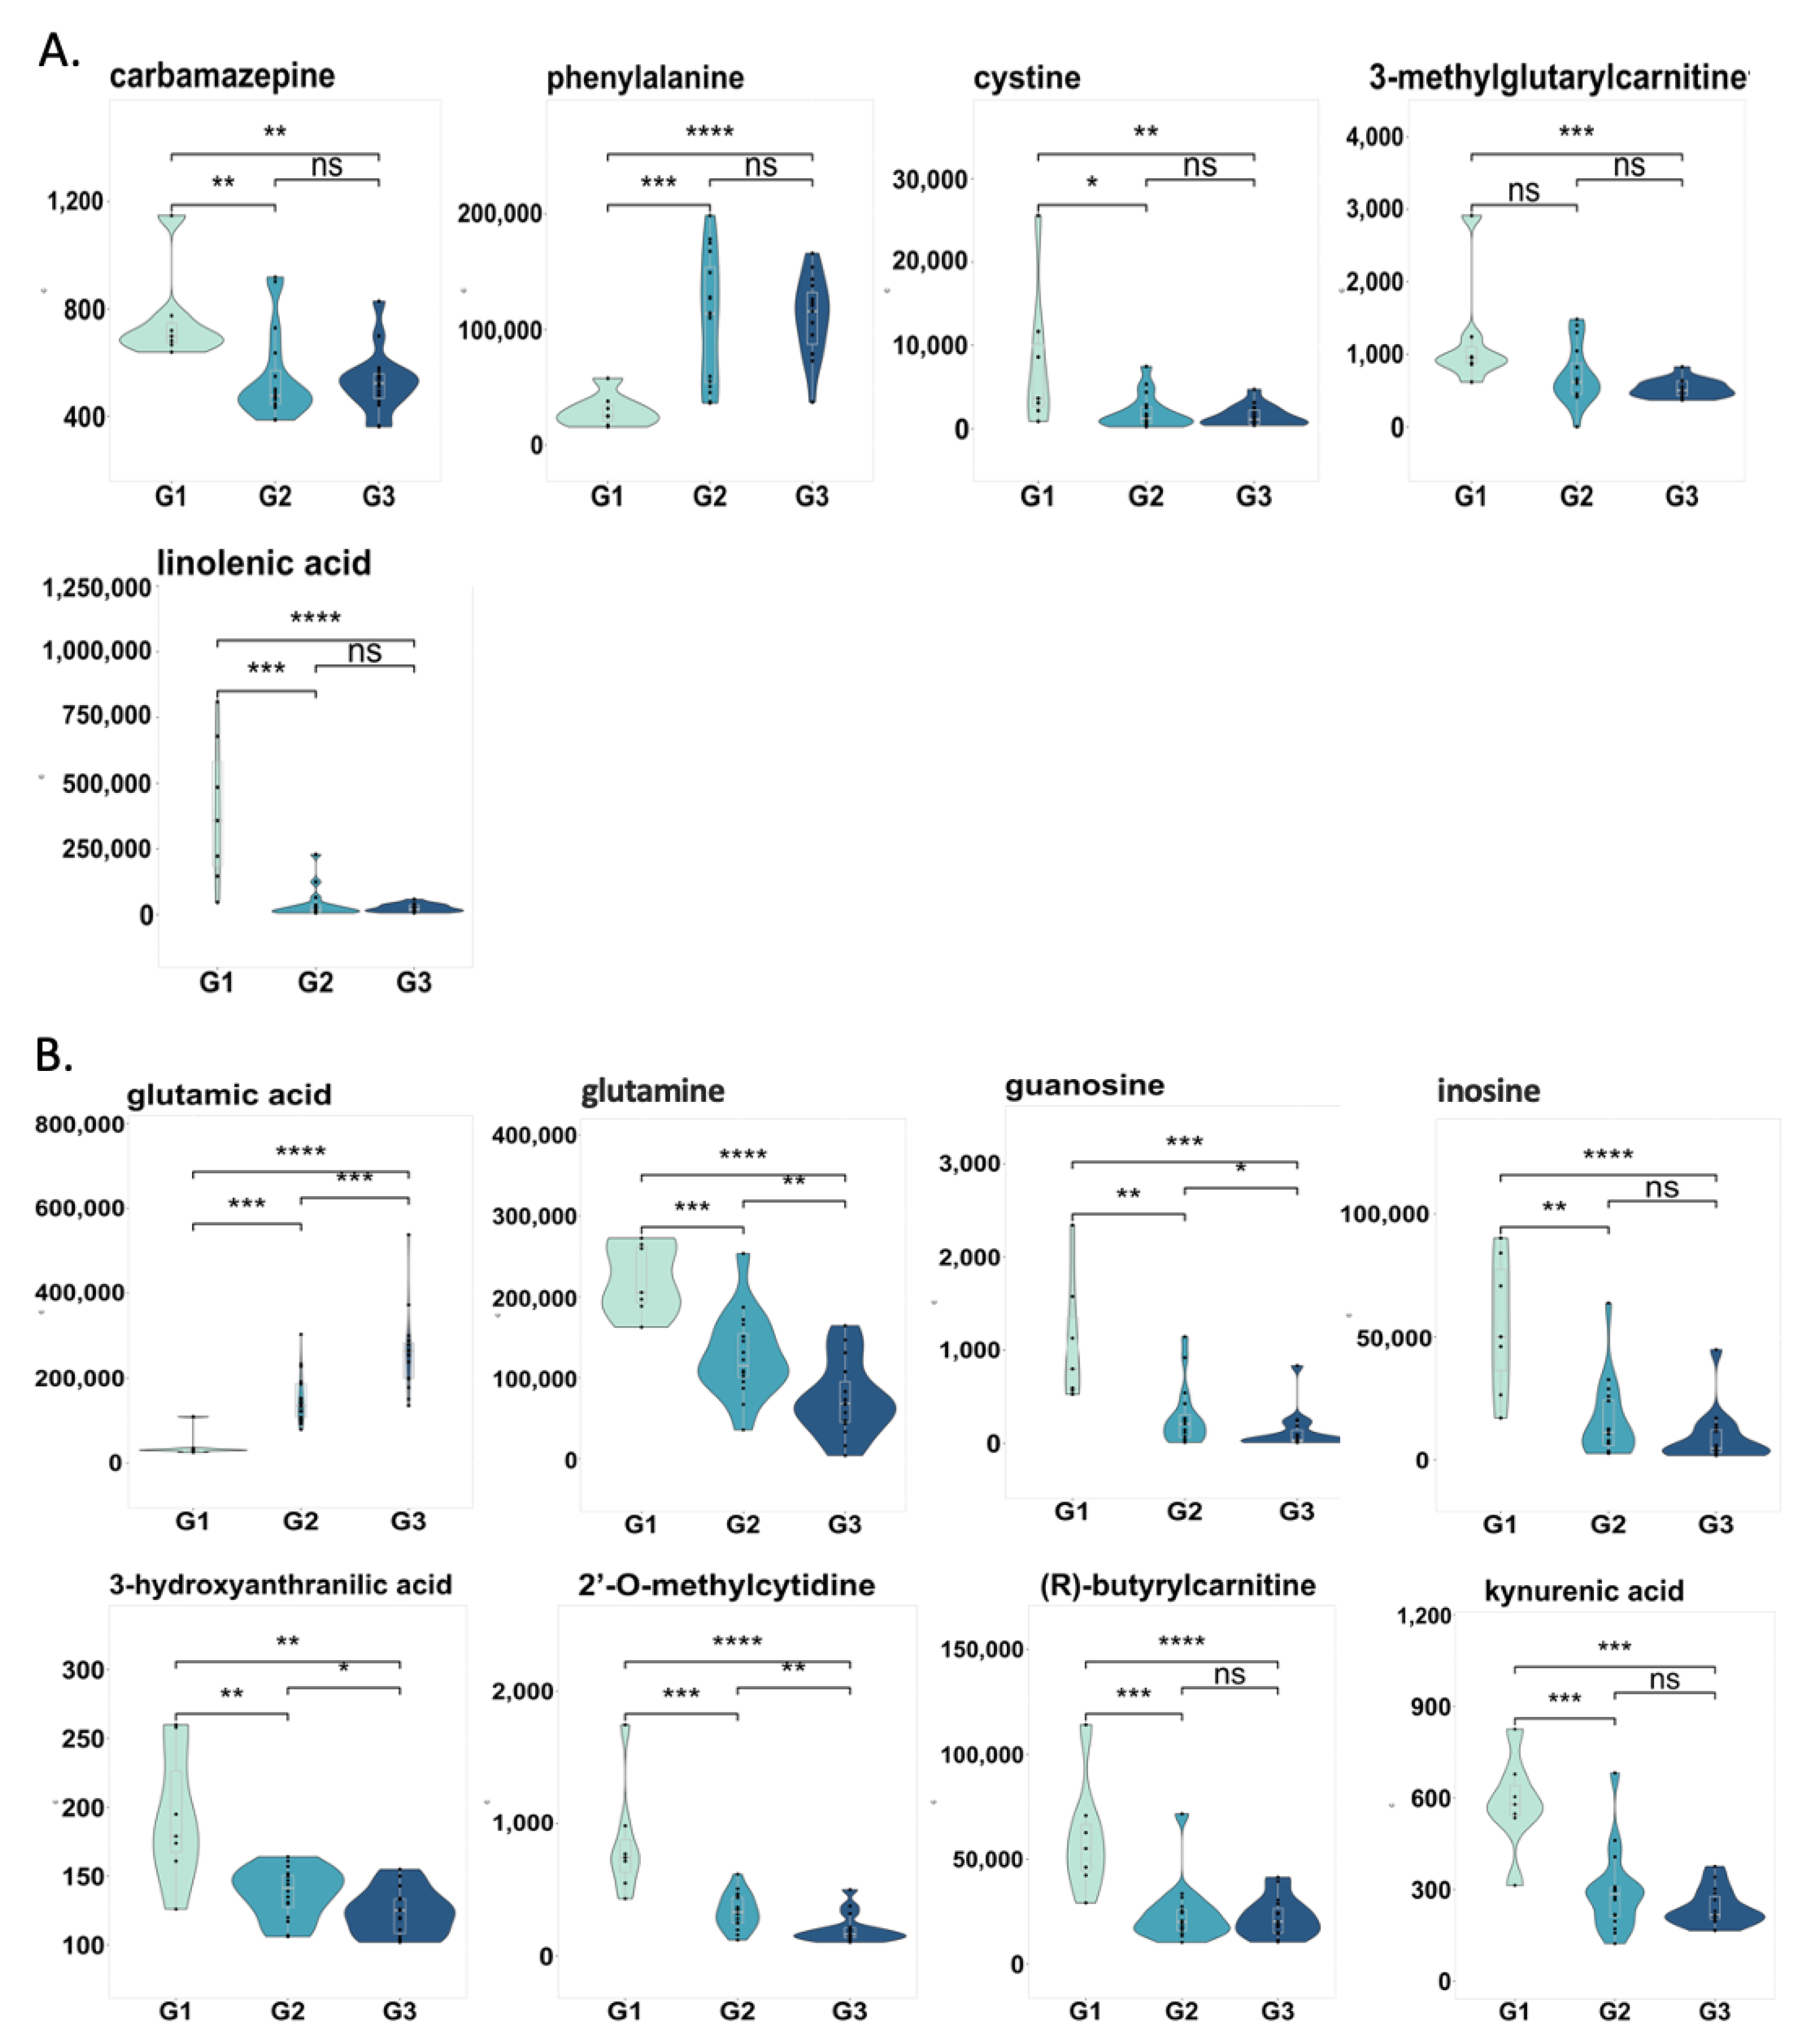
2.5. Changes in Correlated Metabolites and Gut Microbes in Three Groups

Next, we examined the levels of five fecal metabolites in three groups correlated with microbial species. Out of five fecal metabolites, three were significantly decreased in patients with both non-progressive liver disease and progressive liver disease compared to control subjects (Figure 4A). Meanwhile, the level of 3-methylglutarylcarnitine was significantly decreased in patients with progressive liver disease compared to control subjects. In contrast, phenylalanine was increased in patients with both non-progressive liver disease and progressive liver disease compared to controls. We further examined the level of eight serum metabolites, which showed correlations with microbial species in the three groups, as shown in Figure 4B. Out of eight serum metabolites, seven were significantly decreased in patients with both non-progressive liver disease and progressive liver disease compared to controls. Among these seven metabolites, the levels of four were significantly decreased in patients with progressive liver disease compared to patients with non-progressive liver disease, including glutamine, 3-hydroxyanthanilic acid, 2′-O-methylcytidine, and guanosine. In contrast to glutamine, glutamic acid was increased in patients with both non-progressive liver disease and progressive liver disease. Notably, glutamic acid was significantly increased in patients with progressive liver disease compared to patients with non-progressive liver disease. Next, we checked the microbial pathways that are associated with these metabolites in three groups (Table S1). However, no significant difference was found in these pathways.
Among four microbial species correlated with serum or fecal metabolites, Coprococcus sp. ART55-1 and Lachnospiraceae bacterium 8_1_57FAA were enriched in control subjects; meanwhile, the levels of Acidaminococcus fermentans and Odoribacter splanchnicus were not significantly different among the three groups (Figure 1A).

2.6. Prediction of Progressive Liver Disease Using Correlated Metabolites and Microbial Species

We built a random forest model to differentiate patients with progressive liver disease from patients with non-progressive liver disease. When using correlated fecal metabolites and microbial species, the area under receiver operating characteristic (AUROC) curve was only 0.51 (Figure 5A). The importance of correlated variables is shown in Figure 5B. Correlated serum metabolites and microbial species showed strong predictive power, with an AUROC curve of 0.91 when predicting progressive liver disease (Figure 5C), which is better than that of correlated fecal metabolites and microbial species. The importance of ten variables is shown in Figure 5D. The serum level of glutamic acid was selected as the most important variable for the prediction. Overall, serum metabolites perform better than two microbial species when predicting progressive liver disease.

3. Discussion

Host and microbiota-derived metabolites in the gut lumen translocate to the liver through the portal vein. Gut barrier dysfunction was found in patients with ALD, which facilitates the translocation of host and microbiota-derived metabolites to the portal vein and systemic circulation. In this study, we performed integrated analysis of metabolomics and metagenomics to identify correlated multi-omics features in patients with ALD. With the implementation of DIABLO, the process of revealing correlated microbes with fecal or serum metabolites is facilitated in our study. This is further used to predict the progression of ALD simply based upon selected microbes and metabolites using the random forest model.
As one of the most popular ensemble techniques of classification, random forest has emerged as a potential tool for clinical decision making, which typically uses decision trees as base classifiers and “combines” them in an iterative fashion. At each iteration, a new decision tree is trained with respect to the misclassification error obtained from the last iteration, and the iterative procedure stops when the reduction in the misclassification error is below a pre-assigned value [26].
Glutamic acid was selected as the most important variable to predict the progressive liver disease in our random forest model, which was increased in the serum of patients with both non-progressive liver disease patients and progressive liver disease, compared to the serum of the control group. In patients with alcohol-associated liver cirrhosis, plasma and ascitic fluid show an elevated concentration of glutamic acid compared to normal controls [27]. An increase in glutamic acid concentration in serum or plasma might contribute to the severity of non-alcoholic fatty liver disease (NAFLD), non-alcoholic steatohepatitis (NASH), and liver fibrosis [28,29]. In contrast to the increase in glutamic acid, the serum levels of glutamine were decreased in patients with non-progressive and progressive liver disease as compared to non-alcoholic controls. Chronic alcohol consumption has been reported to down-regulate the biosynthesis of glutamine [30]. A previous study found lower plasma glutamine levels in patients with alcohol-associated liver disease as compared to non-alcoholic liver disease controls [31]. A glutamine-supplemented diet prevents ethanol-induced liver injury in a mouse model [32,33].
An intermediate product of tryptophan degradation, 3-hydroxyanthranilic acid, was decreased in the serum of both non-progressive liver disease and progressive liver disease patients in our study. The tryptophan metabolism rate is low due to insufficient vitamins, which potentially results in low 3-hydroxyanthranilic acid production in the serum of patients with severe liver disease [34]. Similar to 3-hydroxyanthranilic acid, kynurenic acid is also a key intermediate product of tryptophan degradation [35]. Here, serum kynurenic acid showed the same decrease in both patient groups.
Linolenic acid belongs to the omega-3 (n-3) polyunsaturated fatty acids (PUFAs) family. In our study, compared to the control group, a decreased linolenic acid level was found in the feces of both non-progressive liver disease patients and progressive liver disease patients. Previous findings have reported a negative correlation between the concentration of linolenic acid and the severity of cirrhosis in patients [36]. Consuming a linolenic acid-rich diet may act as an effective way of preventing ALD [37,38].
Among the microbial species that showed a correlation with fecal or serum metabolites in our study, Coprococcus sp. ART55-1 and Lachnospiraceae bacterium 8_1_57FAA were significantly enriched in control subjects. Coprococcus was inversely associated with steatosis in a large-scale study of 1355 adults [39]. Lachnospiraceae bacterium is known as one of the most dominant bacteria taxa present in the human gut microbiota [40]. A previous finding reported a decreased abundance level in Lachnospiraceae in the feces of alcoholic hepatitis patients compared to healthy controls and heavy-drinking subjects [41]. In a study about chronic hepatitis B virus (HBV), the abundance of Lachnospiraceae was significantly reduced in HBV patients who consumed alcohol as compared to HBV patients who did not [42]. In addition, Lachnospiraceae has also been reported to be correlated with lung diseases and HIV [43,44].
Our study design is cross-sectional in nature, which aims at investigating the metabolites and microbial species that potentially contribute to the development of progressive alcohol-associated liver disease in ALD patients. Unlike longitudinal studies, our data and patient information were gathered at a single timepoint. With such data structure, a significant association between metabolites and microbial species can be easily identified in a short amount of time [45]. However, the causal relationship remains unknown and requires further investigation. Due to the sample availability, the sample size of this study is relatively small. The findings from this study need to be validated in a larger patient cohort.
In conclusion, we performed an integrated analysis of metabolomics and metagenomics in ALD patients, revealing multiple correlated metabolites and gut microbes. Correlated serum metabolites and microbes show great potential for the prediction of progressive liver disease. The key metabolites and gut microbes identified in our findings could be used in clinical practice to predict the progression of liver disease, which is helpful for patient stratification and possibly for the development of treatment strategies. The findings in the present study provide a solid foundation for future studies to investigate the mechanisms behind such correlations and their contribution to the progression of ethanol-induced liver disease in preclinical models. The research approach presented in this study could serve as a starting point for further longitudinal studies and the evaluation of therapeutic options for ALD.

4. Materials and Methods

4.1. Patients

A total of 31 patients who met the Diagnostic and Statistical Manual of Mental Disorders, Fourth Edition criteria, were recruited for the study. The patients consumed alcohol (>60 g/day) for more than one year and were actively drinking until the day of admission for detoxification. Based on clinical parameters, patients were split into two groups. Sixteen patients were defined as having non-progressive liver disease (minimal liver injury and simple steatosis), with normal ALT/AST (<40 U/L), liver stiffness < 7.6 kPa, and CAP < 250 dB/m (minimal liver injury). A CAP greater than 250 dB/m was allowed if all other criteria were normal. Fifteen patients were defined as having progressive liver disease (steatohepatitis and steatofibrosis), with increased ALT/AST (>40 U/L) and one or more of the following parameters: liver stiffness > 7.6 kPa (significant fibrosis), and/or CAP > 250 dB/m. CK18-M65 blood levels with a 400 U/L cut-off were used to support the classification of non-progressive and progressive ALD [46]. Seven non-alcoholic controls were recruited who consumed less than 20 g of alcohol per day. Controls were matched for gender, age, and BMI. During the two months preceding enrollment, patients and control subjects did not take immunosuppressive medication or antibiotics. The study protocol was approved by the human research and ethical committee of the Université Catholique de Louvain, Brussels, Belgium (B403201422657). Written informed consent was obtained from all patients and control subjects after the nature and possible consequences of the studies were explained.

4.2. Untargeted Metabolomics

The serum and fecal metabolome from 38 subjects were analyzed by gas chromatography–time of flight mass spectrometry (GC–TOF MS) and hydrophilic interaction liquid chromatography (HILIC) with quadrupole orbital ion trap high field mass spectrometry (Q-Exactive HF MS). Sample extraction, data acquisition, and data processing were performed as described in our previous study [47]. Briefly, ChromaTOF version 4.50 and Binbase version 5.0.3 were used for GC-MS data processing [48]. For LC-MS raw data, MS-DIAL [49] and MS-FLO [50] were used for LC-MS data processing. For the HILIC dataset, retention time-m/z libraries and the MS/MS spectra database were used for compound identification, which were uploaded to MassBank of North America.

4.3. Shotgun Metagenomics

DNA was extracted from stool samples collected from the same 38 subjects. DNA extraction and library preparation were performed as described previously [51]. Shot-gun metagenomics sequencing was performed on Illumina HiSeq 4000 generating 150 bp paired-end reads. KneadData version 0.7.2 was used for the quality control of raw sequencing data. Metagenomic Phylogenetic Analysis 2 (MetaPhlAn2) version 2.7.7 [52] was used for the profiling the composition of microbial communities. HMP Unified Metabolic Analysis Network 2 (HUMAnN2) version 0.11.1 was used for the profiling of microbial pathways [53]. The MetaCyc database was used for microbial pathway analysis [54].

4.4. Integrative Analysis of Microbiota and Metabolomics Data

An integrative metagenomics and metabolomics analysis was performed using mixOmics (version 6.14.1) [25,55], which is able to achieve a similar performance with improved insights in prediction compared to other state-of-the-art models [56]. The design matrix for both fecal metabolites with microbial species (0.15) and serum metabolites with microbial species (0.01) was refined according to the Projection to Latent Structure (PLS) model correlation. The Data Integration Analysis for Biomarker discovery using a Latent component method for Omics studies (DIABLO) model was fitted to our data with a 10-fold cross-validation repeated 10 times and then tuned with the tune.block.splsda() method. The DIABLO framework is designed for multi-omics analysis for sample group discrimination and class prediction to identify novel biomarkers [56]. We used plotDiablo(), plotIndiv(), and plotArrow() with default parameters for data visualization. A circos plot was generated using circosPlot() with a cut-off value of 0.6.

4.5. Statistical Analysis

R (version 4.0.2) was used for the statistical analysis. The Kruskal–Wallis test was used to calculate the significance between three groups of metabolomics data, and the Mann–Whitney Wilcoxon test was used to calculate the significance between the two groups. LEfSe was used to determine the microbial species most likely to explain the difference between three groups [57]. The H2O platform (https://www.h2o.ai, accessed on 6 September 2021) was used to build the random forest model for predicting progressive liver disease using correlated metabolites and microbial species. The datasets were split into training and test datasets (80:20 stratified splits). The model was tuned by performing stratified 5-fold cross-validation on the training set.

Supplementary Materials

The following are available online at https://www.mdpi.com/article/10.3390/metabo11110766/s1, Table S1: Relative abundance of microbial pathways.

Author Contributions

Formal analysis, Y.Z. and B.G.; data curation, B.G.; writing—original draft preparation, B.G. and Y.Z.; writing—review and editing, N.G., W.S., B.S. and P.S.; visualization, Y.Z.; supervision, B.S.; project administration, P.S.; funding acquisition, B.S. All authors have read and agreed to the published version of the manuscript.

Funding

This study was supported in part by NIH grants R01 AA24726, R37 AA020703, U01 AA026939, and U01 AA026939-04S1; by Award Number BX004594 from the Biomedical Laboratory Research & Development Service of the VA Office of Research and Development; and a Biocodex Microbiota Foundation Grant (to B.S.) and services provided by NIH centers P30 DK120515 and P50 AA011999.

Institutional Review Board Statement

The study protocol was approved by the human research and ethical committee of the Université Catholique de Louvain, Brussels, Belgium (B403201422657).

Informed Consent Statement

Written informed consent was obtained from all patients and control subjects after the nature and possible consequences of the studies were explained.

Data Availability Statement

The sequencing data can be found in the BioProject database (accession: PRJNA613834, https://www.ncbi.nlm.nih.gov/Traces/study/?acc=PRJNA613834).

Acknowledgments

We acknowledge the High-Performance Computing Center of Nanjing University of Information Science & Technology for their support of this work.

Conflicts of Interest

B.S. has consulted for Ferring Research Institute, Gelesis, HOST Therabiomics, Intercept Pharmaceuticals, Mabwell Therapeutics, Patara Pharmaceuticals, and Takeda. B.S.’s institution, UC San Diego, has received research support from Axial Biotherapeutics, BiomX, CymaBay Therapeutics, NGM Biopharmaceuticals, Prodigy Biotech and Synlogic Operating Company. B.S. is the founder of Nterica Bio. UC San Diego and has filed several patents with B.S. as an inventor related to this work.

References

  1. O’Shea, R.S.; Dasarathy, S.; McCullough, A.J. Alcoholic Liver Disease. Hepatology 2010, 51, 307–328. [Google Scholar] [CrossRef]
  2. Seitz, H.K.; Bataller, R.; Cortez-Pinto, H.; Gao, B.; Gual, A.; Lackner, C.; Mathurin, P.; Mueller, S.; Szabo, G.; Tsukamoto, H. Alcoholic Liver Disease. Nat. Rev. Dis. Primers 2018, 4, 1–22. [Google Scholar] [CrossRef] [PubMed]
  3. Wang, F.-S.; Fan, J.-G.; Zhang, Z.; Gao, B. The Global Burden of Liver Disease: The Major Impact of China. Hepatology 2014, 60, 2099–2108. [Google Scholar] [CrossRef]
  4. Bala, S.; Marcos, M.; Gattu, A.; Catalano, D.; Szabo, G. Acute Binge Drinking Increases Serum Endotoxin and Bacterial DNA Levels in Healthy Individuals. PLoS ONE 2014, 9, e96864. [Google Scholar] [CrossRef]
  5. Voigt, R.M.; Forsyth, C.B.; Shaikh, M.; Zhang, L.; Raeisi, S.; Aloman, C.; Preite, N.Z.; Donohue, T.M.; Fogg, L.; Keshavarzian, A. Diurnal Variations in Intestinal Barrier Integrity and Liver Pathology in Mice: Implications for Alcohol Binge. Am. J. Physiol. Gastrointest. Liver Physiol. 2018, 314, G131–G141. [Google Scholar] [CrossRef]
  6. Bull-Otterson, L.; Feng, W.; Kirpich, I.; Wang, Y.; Qin, X.; Liu, Y.; Gobejishvili, L.; Joshi-Barve, S.; Ayvaz, T.; Petrosino, J.; et al. Metagenomic Analyses of Alcohol Induced Pathogenic Alterations in the Intestinal Microbiome and the Effect of Lactobacillus Rhamnosus GG Treatment. PLoS ONE 2013, 8, e53028. [Google Scholar] [CrossRef] [PubMed]
  7. Mutlu, E.A.; Gillevet, P.M.; Rangwala, H.; Sikaroodi, M.; Naqvi, A.; Engen, P.A.; Kwasny, M.; Lau, C.K.; Keshavarzian, A. Colonic Microbiome Is Altered in Alcoholism. Am. J. Physiol. Gastrointest. Liver Physiol. 2012, 302, G966–G978. [Google Scholar] [CrossRef]
  8. Couch, R.D.; Dailey, A.; Zaidi, F.; Navarro, K.; Forsyth, C.B.; Mutlu, E.; Engen, P.A.; Keshavarzian, A. Alcohol Induced Alterations to the Human Fecal VOC Metabolome. PLoS ONE 2015, 10, e0119362. [Google Scholar] [CrossRef] [Green Version]
  9. Puri, P.; Liangpunsakul, S.; Christensen, J.E.; Shah, V.H.; Kamath, P.S.; Gores, G.J.; Walker, S.; Comerford, M.; Katz, B.; Borst, A.; et al. The Circulating Microbiome Signature and Inferred Functional Metagenomics in Alcoholic Hepatitis. Hepatology 2018, 67, 1284–1302. [Google Scholar] [CrossRef] [Green Version]
  10. Yang, A.-M.; Inamine, T.; Hochrath, K.; Chen, P.; Wang, L.; Llorente, C.; Bluemel, S.; Hartmann, P.; Xu, J.; Koyama, Y.; et al. Intestinal Fungi Contribute to Development of Alcoholic Liver Disease. J. Clin. Investig. 2017, 127, 2829–2841. [Google Scholar] [CrossRef] [Green Version]
  11. Tuomisto, S.; Pessi, T.; Collin, P.; Vuento, R.; Aittoniemi, J.; Karhunen, P.J. Changes in Gut Bacterial Populations and Their Translocation into Liver and Ascites in Alcoholic Liver Cirrhotics. BMC Gastroenterol. 2014, 14, 40. [Google Scholar] [CrossRef] [Green Version]
  12. Dubinkina, V.B.; Tyakht, A.V.; Odintsova, V.Y.; Yarygin, K.S.; Kovarsky, B.A.; Pavlenko, A.V.; Ischenko, D.S.; Popenko, A.S.; Alexeev, D.G.; Taraskina, A.Y.; et al. Links of Gut Microbiota Composition with Alcohol Dependence Syndrome and Alcoholic Liver Disease. Microbiome 2017, 5, 141. [Google Scholar] [CrossRef]
  13. Forsyth, C.B.; Farhadi, A.; Jakate, S.M.; Tang, Y.; Shaikh, M.; Keshavarzian, A. Lactobacillus GG Treatment Ameliorates Alcohol-Induced Intestinal Oxidative Stress, Gut Leakiness, and Liver Injury in a Rat Model of Alcoholic Steatohepatitis. Alcohol 2009, 43, 163–172. [Google Scholar] [CrossRef] [PubMed] [Green Version]
  14. Wang, Y.; Kirpich, I.; Liu, Y.; Ma, Z.; Barve, S.; McClain, C.J.; Feng, W. Lactobacillus Rhamnosus GG Treatment Potentiates Intestinal Hypoxia-Inducible Factor, Promotes Intestinal Integrity and Ameliorates Alcohol-Induced Liver Injury. Am. J. Pathol. 2011, 179, 2866–2875. [Google Scholar] [CrossRef] [PubMed]
  15. Kirpich, I.A.; Solovieva, N.V.; Leikhter, S.N.; Shidakova, N.A.; Lebedeva, O.V.; Sidorov, P.I.; Bazhukova, T.A.; Soloviev, A.G.; Barve, S.S.; McClain, C.J.; et al. Probiotics Restore Bowel Flora and Improve Liver Enzymes in Human Alcohol-Induced Liver Injury: A Pilot Study. Alcohol 2008, 42, 675–682. [Google Scholar] [CrossRef] [PubMed] [Green Version]
  16. Stadlbauer, V.; Mookerjee, R.P.; Hodges, S.; Wright, G.A.K.; Davies, N.A.; Jalan, R. Effect of Probiotic Treatment on Deranged Neutrophil Function and Cytokine Responses in Patients with Compensated Alcoholic Cirrhosis. J. Hepatol. 2008, 48, 945–951. [Google Scholar] [CrossRef] [PubMed]
  17. Han, S.H.; Suk, K.T.; Kim, D.J.; Kim, M.Y.; Baik, S.K.; Kim, Y.D.; Cheon, G.J.; Choi, D.H.; Ham, Y.L.; Shin, D.H.; et al. Effects of Probiotics (Cultured Lactobacillus Subtilis/Streptococcus Faecium) in the Treatment of Alcoholic Hepatitis: Randomized-Controlled Multicenter Study. Eur. J. Gastroenterol. Hepatol. 2015, 27, 1300–1306. [Google Scholar] [CrossRef] [PubMed]
  18. Harada, S.; Takebayashi, T.; Kurihara, A.; Akiyama, M.; Suzuki, A.; Hatakeyama, Y.; Sugiyama, D.; Kuwabara, K.; Takeuchi, A.; Okamura, T.; et al. Metabolomic Profiling Reveals Novel Biomarkers of Alcohol Intake and Alcohol-Induced Liver Injury in Community-Dwelling Men. Env. Health Prev. Med. 2016, 21, 18–26. [Google Scholar] [CrossRef] [Green Version]
  19. Hartmann, P.; Hochrath, K.; Horvath, A.; Chen, P.; Seebauer, C.T.; Llorente, C.; Wang, L.; Alnouti, Y.; Fouts, D.E.; Stärkel, P.; et al. Modulation of the Intestinal Bile Acid/Farnesoid X Receptor/Fibroblast Growth Factor 15 Axis Improves Alcoholic Liver Disease in Mice. Hepatology 2018, 67, 2150–2166. [Google Scholar] [CrossRef]
  20. Kang, D.J.; Hylemon, P.B.; Gillevet, P.M.; Sartor, R.B.; Betrapally, N.S.; Kakiyama, G.; Sikaroodi, M.; Takei, H.; Nittono, H.; Zhou, H.; et al. Gut Microbial Composition Can Differentially Regulate Bile Acid Synthesis in Humanized Mice. Hepatol. Commun. 2017, 1, 61–70. [Google Scholar] [CrossRef]
  21. Bajaj, J.S.; Kakiyama, G.; Zhao, D.; Takei, H.; Fagan, A.; Hylemon, P.; Zhou, H.; Pandak, W.M.; Nittono, H.; Fiehn, O.; et al. Continued Alcohol Misuse in Human Cirrhosis Is Associated with an Impaired Gut–Liver Axis. Alcohol. Clin. Exp. Res. 2017, 41, 1857–1865. [Google Scholar] [CrossRef]
  22. Brandl, K.; Hartmann, P.; Jih, L.J.; Pizzo, D.P.; Argemi, J.; Ventura-Cots, M.; Coulter, S.; Liddle, C.; Ling, L.; Rossi, S.J.; et al. Dysregulation of Serum Bile Acids and FGF19 in Alcoholic Hepatitis. J. Hepatol. 2018, 69, 396–405. [Google Scholar] [CrossRef]
  23. Ciocan, D.; Voican, C.S.; Wrzosek, L.; Hugot, C.; Rainteau, D.; Humbert, L.; Cassard, A.-M.; Perlemuter, G. Bile Acid Homeostasis and Intestinal Dysbiosis in Alcoholic Hepatitis. Aliment Pharm. 2018, 48, 961–974. [Google Scholar] [CrossRef]
  24. Kakiyama, G.; Hylemon, P.B.; Zhou, H.; Pandak, W.M.; Heuman, D.M.; Kang, D.J.; Takei, H.; Nittono, H.; Ridlon, J.M.; Fuchs, M.; et al. Colonic Inflammation and Secondary Bile Acids in Alcoholic Cirrhosis. Am. J. Physiol. Gastrointest. Liver Physiol. 2014, 306, G929–G937. [Google Scholar] [CrossRef] [PubMed] [Green Version]
  25. Rohart, F.; Gautier, B.; Singh, A.; Lê Cao, K.-A. MixOmics: An R Package for ’omics Feature Selection and Multiple Data Integration. PLoS Comput. Biol. 2017, 13, e1005752. [Google Scholar] [CrossRef] [Green Version]
  26. Computer Science & Engineering &GZSCCET Bhatinda, Punjab, India; Goel, E.; Abhilasha, E. Random Forest: A Review. IJARCSSE 2017, 7, 251–257. [Google Scholar] [CrossRef]
  27. Vannucchi, H.; Marchini, J.S.; Padovan, G.J.; dos-Santos, J.E.; Dutra-de-Oliveira, J.E. Amino Acid Patterns in the Plasma and Ascitic Fluid of Cirrhotic Patients. Braz. J. Med. Biol. Res. 1985, 18, 465–470. [Google Scholar]
  28. Hasegawa, T.; Iino, C.; Endo, T.; Mikami, K.; Kimura, M.; Sawada, N.; Nakaji, S.; Fukuda, S. Changed Amino Acids in NAFLD and Liver Fibrosis: A Large Cross-Sectional Study without Influence of Insulin Resistance. Nutrients 2020, 12, 1450. [Google Scholar] [CrossRef] [PubMed]
  29. Gaggini, M.; Carli, F.; Rosso, C.; Buzzigoli, E.; Marietti, M.; Della Latta, V.; Ciociaro, D.; Abate, M.L.; Gambino, R.; Cassader, M.; et al. Altered Amino Acid Concentrations in NAFLD: Impact of Obesity and Insulin Resistance. Hepatology 2018, 67, 145–158. [Google Scholar] [CrossRef] [Green Version]
  30. Choi, W.-M.; Kim, H.-H.; Kim, M.-H.; Cinar, R.; Yi, H.-S.; Eun, H.S.; Kim, S.-H.; Choi, Y.J.; Lee, Y.-S.; Kim, S.Y.; et al. Glutamate Signaling in Hepatic Stellate Cells Drives Alcoholic Steatosis. Cell Metab. 2019, 30, 877–889.e7. [Google Scholar] [CrossRef] [PubMed]
  31. Tominaga, T.; Suzuki, H.; Mizuno, H.; Kouno, M.; Suzuki, M.; Kato, Y.; Sato, A.; Okabe, K.; Miyashita, M. Clinical Significance of Measuring Plasma Concentrations of Glutamine and Glutamate in Alcoholic Liver Diseases. Alcohol Alcohol. Suppl. 1993, 1A, 103–109. [Google Scholar] [CrossRef] [PubMed]
  32. Huang, H.; Lin, Z.; Zeng, Y.; Lin, X.; Zhang, Y. Probiotic and Glutamine Treatments Attenuate Alcoholic Liver Disease in a Rat Model. Exp. Med. 2019, 18, 4733–4739. [Google Scholar] [CrossRef] [PubMed] [Green Version]
  33. Chaudhry, K.K.; Shukla, P.K.; Mir, H.; Manda, B.; Gangwar, R.; Yadav, N.; McMullen, M.; Nagy, L.E.; Rao, R. Glutamine Supplementation Attenuates Ethanol-Induced Disruption of Apical Junctional Complexes in Colonic Epithelium and Ameliorates Gut Barrier Dysfunction and Fatty Liver in Mice. J. Nutr. Biochem. 2016, 27, 16–26. [Google Scholar] [CrossRef] [Green Version]
  34. Rossouw, J.E.; Labadarios, D.; Davis, M.; Williams, R. The Degradation of Tryptophan in Severe Liver Disease. Int. J. Vitam. Nutr. Res. 1978, 48, 281–289. [Google Scholar]
  35. Zhou, Q.; Shi, Y.; Chen, C.; Wu, F.; Chen, Z. A Narrative Review of the Roles of Indoleamine 2,3-Dioxygenase and Tryptophan-2,3-Dioxygenase in Liver Diseases. Ann. Transl. Med. 2021, 9, 174. [Google Scholar] [CrossRef]
  36. Ginanni Corradini, S.; Zerbinati, C.; Maldarelli, F.; Palmaccio, G.; Parlati, L.; Bottaccioli, A.G.; Molinaro, A.; Poli, E.; Boaz, M.; Serviddio, G.; et al. Plasma Fatty Acid Lipidome Is Associated with Cirrhosis Prognosis and Graft Damage in Liver Transplantation. Am. J. Clin. Nutr. 2014, 100, 600–608. [Google Scholar] [CrossRef] [Green Version]
  37. Wang, M.; Zhang, X.-J.; Feng, K.; He, C.; Li, P.; Hu, Y.-J.; Su, H.; Wan, J.-B. Dietary α-Linolenic Acid-Rich Flaxseed Oil Prevents against Alcoholic Hepatic Steatosis via Ameliorating Lipid Homeostasis at Adipose Tissue-Liver Axis in Mice. Sci. Rep. 2016, 6, 26826. [Google Scholar] [CrossRef] [PubMed] [Green Version]
  38. Zhang, X.; Wang, H.; Yin, P.; Fan, H.; Sun, L.; Liu, Y. Flaxseed Oil Ameliorates Alcoholic Liver Disease via Anti-Inflammation and Modulating Gut Microbiota in Mice. Lipids Health Dis. 2017, 16, 44. [Google Scholar] [CrossRef] [Green Version]
  39. Alferink, L.J.M.; Radjabzadeh, D.; Erler, N.S.; Vojinovic, D.; Medina-Gomez, C.; Uitterlinden, A.G.; de Knegt, R.J.; Amin, N.; Ikram, M.A.; Janssen, H.L.A.; et al. Microbiomics, Metabolomics, Predicted Metagenomics, and Hepatic Steatosis in a Population-Based Study of 1,355 Adults. Hepatology 2021, 73, 968–982. [Google Scholar] [CrossRef]
  40. Biagi, E.; Franceschi, C.; Rampelli, S.; Severgnini, M.; Ostan, R.; Turroni, S.; Consolandi, C.; Quercia, S.; Scurti, M.; Monti, D.; et al. Gut Microbiota and Extreme Longevity. Curr. Biol. 2016, 26, 1480–1485. [Google Scholar] [CrossRef] [Green Version]
  41. Smirnova, E.; Puri, P.; Muthiah, M.D.; Daitya, K.; Brown, R.; Chalasani, N.; Liangpunsakul, S.; Shah, V.H.; Gelow, K.; Siddiqui, M.S.; et al. Fecal Microbiome Distinguishes Alcohol Consumption from Alcoholic Hepatitis but Does Not Discriminate Disease Severity. Hepatology 2020, 72, 271–286. [Google Scholar] [CrossRef]
  42. Deng, Y.-D.; Peng, X.-B.; Zhao, R.-R.; Ma, C.-Q.; Li, J.-N.; Yao, L.-Q. The Intestinal Microbial Community Dissimilarity in Hepatitis B Virus-Related Liver Cirrhosis Patients with and without at Alcohol Consumption. Gut Pathog. 2019, 11, 58. [Google Scholar] [CrossRef] [PubMed]
  43. San-Juan-Vergara, H.; Zurek, E.; Ajami, N.J.; Mogollon, C.; Peña, M.; Portnoy, I.; Vélez, J.I.; Cadena-Cruz, C.; Diaz-Olmos, Y.; Hurtado-Gómez, L.; et al. A Lachnospiraceae-Dominated Bacterial Signature in the Fecal Microbiota of HIV-Infected Individuals from Colombia, South America. Sci. Rep. 2018, 8, 4479. [Google Scholar] [CrossRef] [PubMed] [Green Version]
  44. Bowerman, K.L.; Rehman, S.F.; Vaughan, A.; Lachner, N.; Budden, K.F.; Kim, R.Y.; Wood, D.L.A.; Gellatly, S.L.; Shukla, S.D.; Wood, L.G.; et al. Disease-Associated Gut Microbiome and Metabolome Changes in Patients with Chronic Obstructive Pulmonary Disease. Nat. Commun. 2020, 11, 5886. [Google Scholar] [CrossRef]
  45. Wang, X.; Cheng, Z. Cross-Sectional Studies: Strengths, Weaknesses, and Recommendations. Chest 2020, 158, S65–S71. [Google Scholar] [CrossRef] [PubMed]
  46. Maccioni, L.; Gao, B.; Leclercq, S.; Pirlot, B.; Horsmans, Y.; Timary, P.D.; Leclercq, I.; Fouts, D.; Schnabl, B.; Stärkel, P. Intestinal Permeability, Microbial Translocation, Changes in Duodenal and Fecal Microbiota, and Their Associations with Alcoholic Liver Disease Progression in Humans. Gut Microbes 2020, 12, 1782157. [Google Scholar] [CrossRef]
  47. Gao, B.; Lue, H.-W.; Podolak, J.; Fan, S.; Zhang, Y.; Serawat, A.; Alumkal, J.J.; Fiehn, O.; Thomas, G.V. Multi-Omics Analyses Detail Metabolic Reprogramming in Lipids, Carnitines, and Use of Glycolytic Intermediates between Prostate Small Cell Neuroendocrine Carcinoma and Prostate Adenocarcinoma. Metabolites 2019, 9, 82. [Google Scholar] [CrossRef] [Green Version]
  48. Skogerson, K.; Wohlgemuth, G.; Barupal, D.K.; Fiehn, O. The Volatile Compound BinBase Mass Spectral Database. BMC Bioinform. 2011, 12, 321. [Google Scholar] [CrossRef] [Green Version]
  49. Tsugawa, H.; Cajka, T.; Kind, T.; Ma, Y.; Higgins, B.; Ikeda, K.; Kanazawa, M.; VanderGheynst, J.; Fiehn, O.; Arita, M. MS-DIAL: Data-Independent MS/MS Deconvolution for Comprehensive Metabolome Analysis. Nat. Methods 2015, 12, 523–526. [Google Scholar] [CrossRef]
  50. DeFelice, B.C.; Mehta, S.S.; Samra, S.; Čajka, T.; Wancewicz, B.; Fahrmann, J.F.; Fiehn, O. Mass Spectral Feature List Optimizer (MS-FLO): A Tool to Minimize False Positive Peak Reports in Untargeted Liquid Chromatography–Mass Spectroscopy (LC-MS) Data Processing. Anal. Chem. 2017, 89, 3250–3255. [Google Scholar] [CrossRef]
  51. Gao, B.; Emami, A.; Zhou, R.; Lang, S.; Duan, Y.; Wang, Y.; Jiang, L.; Loomba, R.; Brenner, D.; Stärkel, P.; et al. Functional Microbial Responses to Alcohol Abstinence in Patients with Alcohol Use Disorder. Front. Physiol. 2020, 11. [Google Scholar] [CrossRef] [PubMed] [Green Version]
  52. Truong, D.T.; Franzosa, E.A.; Tickle, T.L.; Scholz, M.; Weingart, G.; Pasolli, E.; Tett, A.; Huttenhower, C.; Segata, N. MetaPhlAn2 for Enhanced Metagenomic Taxonomic Profiling. Nat. Methods 2015, 12, 902–903. [Google Scholar] [CrossRef] [PubMed]
  53. Franzosa, E.A.; McIver, L.J.; Rahnavard, G.; Thompson, L.R.; Schirmer, M.; Weingart, G.; Lipson, K.S.; Knight, R.; Caporaso, J.G.; Segata, N.; et al. Species-Level Functional Profiling of Metagenomes and Metatranscriptomes. Nat. Methods 2018, 15, 962–968. [Google Scholar] [CrossRef] [PubMed]
  54. Caspi, R.; Billington, R.; Keseler, I.M.; Kothari, A.; Krummenacker, M.; Midford, P.E.; Ong, W.K.; Paley, S.; Subhraveti, P.; Karp, P.D. The MetaCyc Database of Metabolic Pathways and Enzymes—A 2019 Update. Nucleic Acids Res. 2020, 48, D445–D453. [Google Scholar] [CrossRef] [Green Version]
  55. Lê Cao, K.-A.; González, I.; Déjean, S. IntegrOmics: An R Package to Unravel Relationships between Two Omics Datasets. Bioinformatics 2009, 25, 2855–2856. [Google Scholar] [CrossRef] [PubMed] [Green Version]
  56. Singh, A.; Shannon, C.P.; Gautier, B.; Rohart, F.; Vacher, M.; Tebbutt, S.J.; Lê Cao, K.-A. DIABLO: An Integrative Approach for Identifying Key Molecular Drivers from Multi-Omics Assays. Bioinformatics 2019, 35, 3055–3062. [Google Scholar] [CrossRef]
  57. Segata, N.; Izard, J.; Waldron, L.; Gevers, D.; Miropolsky, L.; Garrett, W.S.; Huttenhower, C. Metagenomic Biomarker Discovery and Explanation. Genome Biol. 2011, 12, R60. [Google Scholar] [CrossRef] [Green Version]
Figure 1. Microbial species, fecal and serum metabolites in ALD patients: (A) significant microbial species; (B) volcano plot of fecal metabolites; (C) volcano plot of serum metabolites. G1: non-alcoholic control subjects; G2: patients with alcohol-associated non-progressive liver disease; G3: patients with alcohol-associated progressive liver disease. FDR: false discovery rate.
Metabolites 11 00766 g001
Figure 2. Correlated fecal metabolites and microbial species: (A) The overall correlation between fecal metabolites and microbial species is 0.77. (B) Similarities (points are clustered) and dissimilarities between samples and groups. Samples are represented as points placed according to their projection in the smaller subspace spanned by microbial species and serum metabolites. (C) Agreement between microbial species and fecal metabolites. Each arrow corresponds to one sample. The start of the arrow indicates the location of the sample in the microbial species plot, and the tip is the location of the sample in the fecal metabolites plot. Short arrows indicate if both data sets strongly agree, and long arrows indicate a disagreement between two data sets. (D) Correlations between variables of serum metabolites and microbial species. Cut-off is set to 0.6. A black line indicates a negative correlation; an orange line indicates a positive correlation. G1: non-alcoholic control subjects; G2: patients with alcohol-associated non-progressive liver disease; G3: patients with alcohol-associated progressive liver disease.
Metabolites 11 00766 g002
Figure 3. Correlated serum metabolites and microbial species. (A) The overall correlation between serum metabolites and microbial species is 0.71. (B) Similarities (points are clustered) and dissimilarities between samples and groups. Samples are represented as points placed according to their projection in the smaller subspace spanned by microbial species and serum metabolites. (C) Agreement between microbial species and serum metabolites. Each arrow corresponds to one sample. The start of the arrow indicates the location of the sample in the microbial species plot, and the tip is the location of the sample in the serum metabolites plot. Short arrows indicate if both data sets strongly agree, and long arrows indicate a disagreement between two data sets. (D) Correlations between variables of serum metabolites and microbial species. Cut-off is set to 0.6. A black line indicates a negative correlation; an orange line indicates a positive correlation. G1: non-alcoholic control subjects; G2: patients with alcohol-associated non-progressive liver disease; G3: patients with alcohol-associated progressive liver disease.
Metabolites 11 00766 g003
Figure 4. Changes in correlated metabolites and microbial species in three groups. (A) Fecal metabolites. (B) Serum metabolites. G1: non-alcoholic control subjects; G2: patients with alcohol-associated non-progressive liver disease; G3: patients with alcohol-associated progressive liver disease. ns: p > 0.05; *: p < 0.05; **: p < 0.01; ***: p < 0.001; ****: p < 0.0001.
Metabolites 11 00766 g004
Figure 5. Prediction of progressive liver disease using random forest model. (A) Prediction of progressive alcohol-associated liver disease using correlated fecal metabolites and microbial species. (B) Variable importance of correlated fecal metabolites and microbial species. (C) Prediction of progressive liver disease using correlated serum metabolites and microbial species. (D) Variable importance of serum metabolites and microbial species.
Metabolites 11 00766 g005
Table 1. Subject characteristics.
Non-Alcoholic ControlsNon-Progressive
Alcohol-Associated Liver Disease
Progressive Alcohol-Associated Liver
Disease
p-Value
Clinical parameter
Total n71615
Age, years, n = 3852 (37–71)37 (27–58)42 (28–59)0.096
Body Mass Index (BMI), kg/m2, n = 3823 (19–29)22 (19–31)24 (18–31)0.437
Gender (male), n (%), n = 386 (86)11 (69)13 (87)0.421
Laboratory parameter
Albumin (g/dL), n = 27 4.7 (4.2–5.2)4.8 (3.9–5.2)0.519
ALT (U/L), n = 31 19.5 (11–37)77 (37–184)<0.001
AST (U/L), n = 31 25.5 (15–36)78 (46–283)<0.001
Total bilirubin (mg/dL), n = 28 0.3 (0.2–1.1)0.5 (0.3–0.8)0.049
GGT (U/L), n = 28 31 (4–213)121 (11–952)0.021
Platelet counts (×109/L), n = 27 268 (165–339)222 (21–434)0.286
Creatinine (mg/dL), n = 28 0.8 (0.5–0.95)0.8 (0.6–1.2)0.433
International normalized ratio, n = 28 1.0 (0.9–1.2)0.9 (0.8–1.0)0.128
Fibroscan (kpa), n = 30 4.9 (3.1–6.8)6.1 (3.9–7.0)0.262
CAP, (dB/m), n = 31
CAP > 250 dB/m, n (%)
254.5 (148–325)
9 (56)
311 (222–381)
15 (93)
0.001
CK18-M65 (U/L), n = 30 332 (158–616)592 (316–1576)<0.001
Note: Values are presented as median and range in parentheses ( ). The number of patients for which the respective data were available is indicated in the first column. In blank cells, patients from the respective group were not counted due to missing numbers. Kruskal–Wallis test was used for three group comparisons. Pairwise comparisons were performed using Tukey and Kramer (Nemenyi) test with Tukey-Dist approximation for independent samples. Mann–Whitney test was used for two group comparisons. Bold font indicates significance (p-value < 0.05). ALT, alanine aminotransferase; AST, aspartate aminotransferase; GGT, gamma-glutamyl-transferase; CAP, controlled attenuation parameter.
Table 2. Correlation between fecal metabolites and microbial species.
Acidaminococcus fermentansLachnospiraceae bacterium 8_1_57FAACoprococcus sp. ART55/1
3-methylglutarylcarnitine0.55130.54460.6061
carbamazepine0.57290.55930.6227
phenylalanine−0.5991−0.5645−0.6292
linolenic acid0.66710.62460.6963
cystine0.60080.53930.6021
Note: Calculated based on similarity matrix; cut-off 0.6.
Table 3. Correlation between serum metabolites and microbial species.
Odoribacter splanchnicusCoprococcus sp. ART55/1
(R)-butyrylcarnitine0.59750.6111
2-O-methylcytidine0.65200.6606
3-hydroxyanthranilic acid0.60650.6182
glutamine0.66290.6681
guanosine0.61600.6256
inosine0.63760.6481
kynurenic acid0.62910.6404
glutamic acid−0.6085−0.6075
Note: Calculated based on similarity matrix; cut-off 0.6.
Publisher’s Note: MDPI stays neutral with regard to jurisdictional claims in published maps and institutional affiliations.

