
Could Reducing Body Fatness Reduce the Risk of Aggressive Prostate Cancer via the Insulin Signalling Pathway? A Systematic Review of the Mechanistic Pathway

 , ,
, ,  ,
,
Abstract
: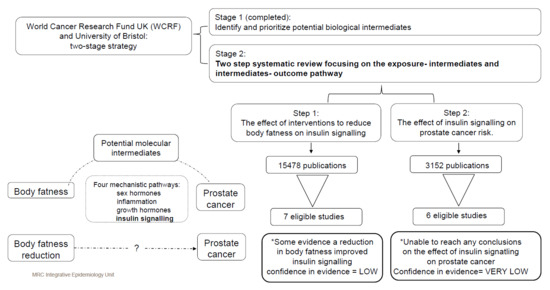
1. Introduction
2. Material and Methods
2.1. PICO Questions
2.2. Standards of Reporting
2.3. Inclusion and Exclusion Criteria
2.3.1. Body Fatness–Insulin Signalling-Specific Criteria
2.3.2. Insulin Signalling–PCa-Specific Criteria
2.4. Data Collection and Analysis
2.4.1. Search Methods
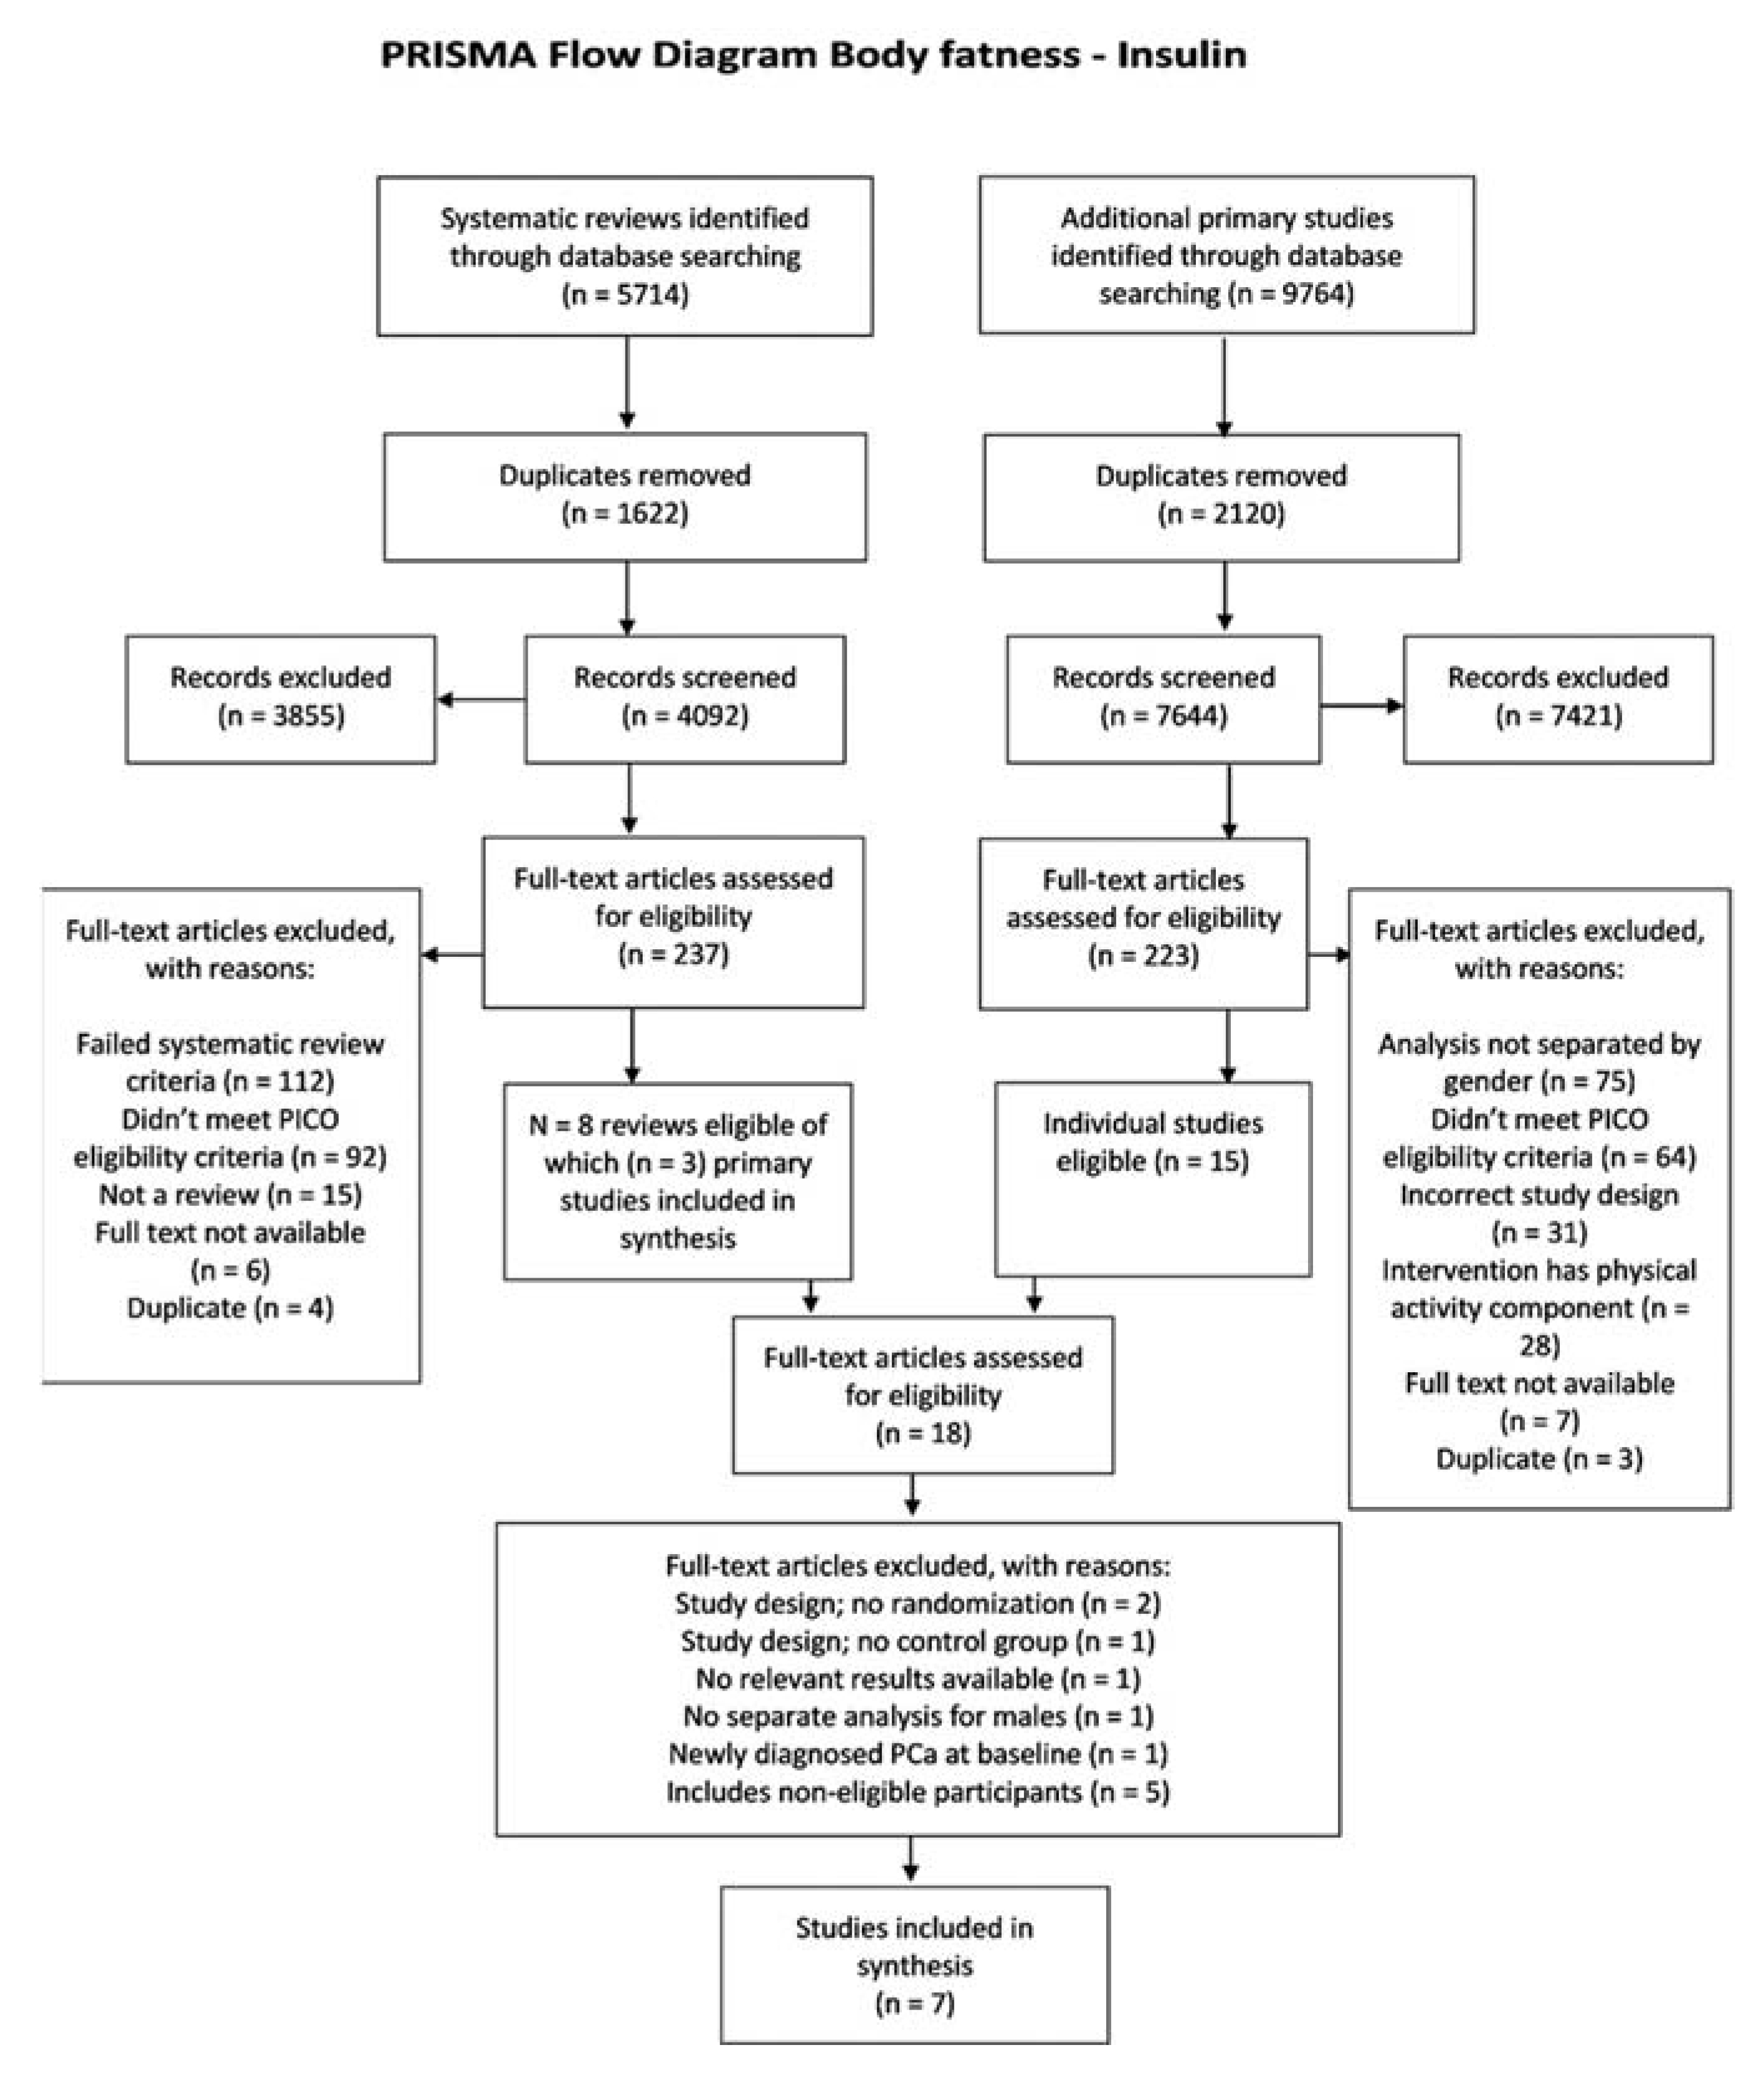
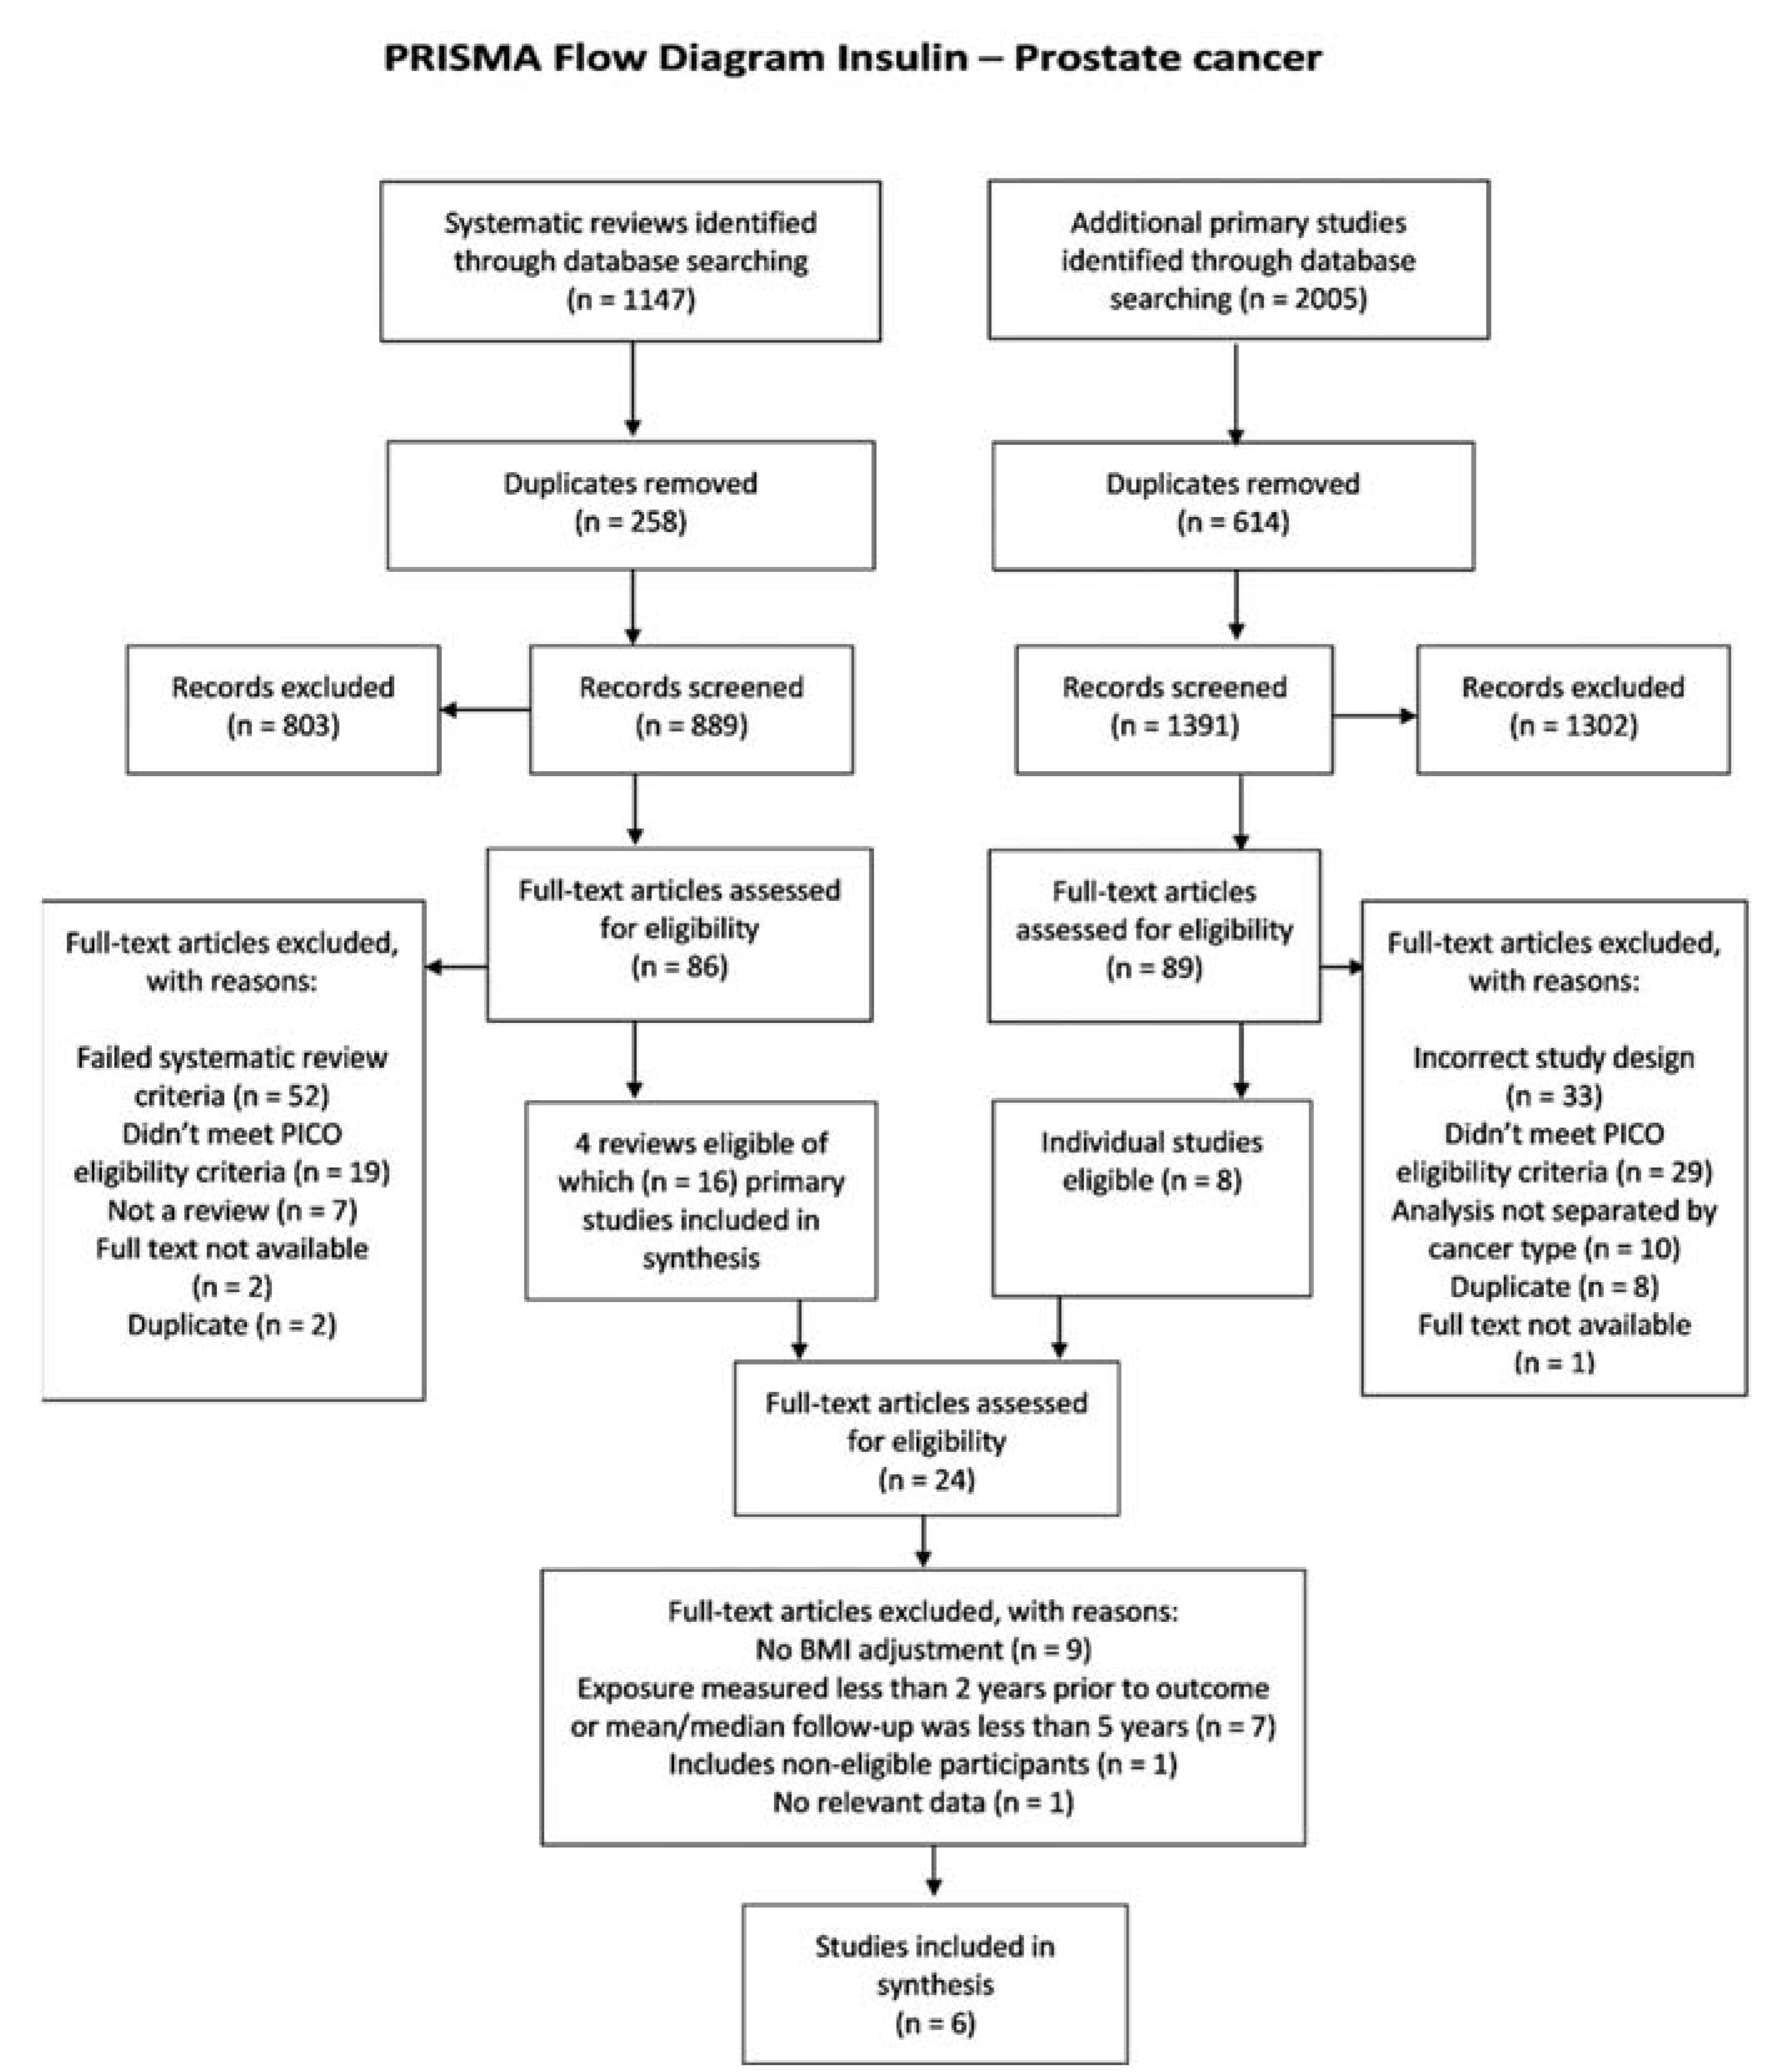
2.4.2. Identification and Selection of Studies
2.4.3. Data Extraction and Management
2.4.4. Data/Statistical Analysis
2.4.5. Subgroup Analyses
2.5. Assessment of Methodological Quality of Included Studies
2.6. Overall Assessment of the Strength of the Evidence: GRADE
3. Results
3.1. Body Fatness–Insulin Association Studies
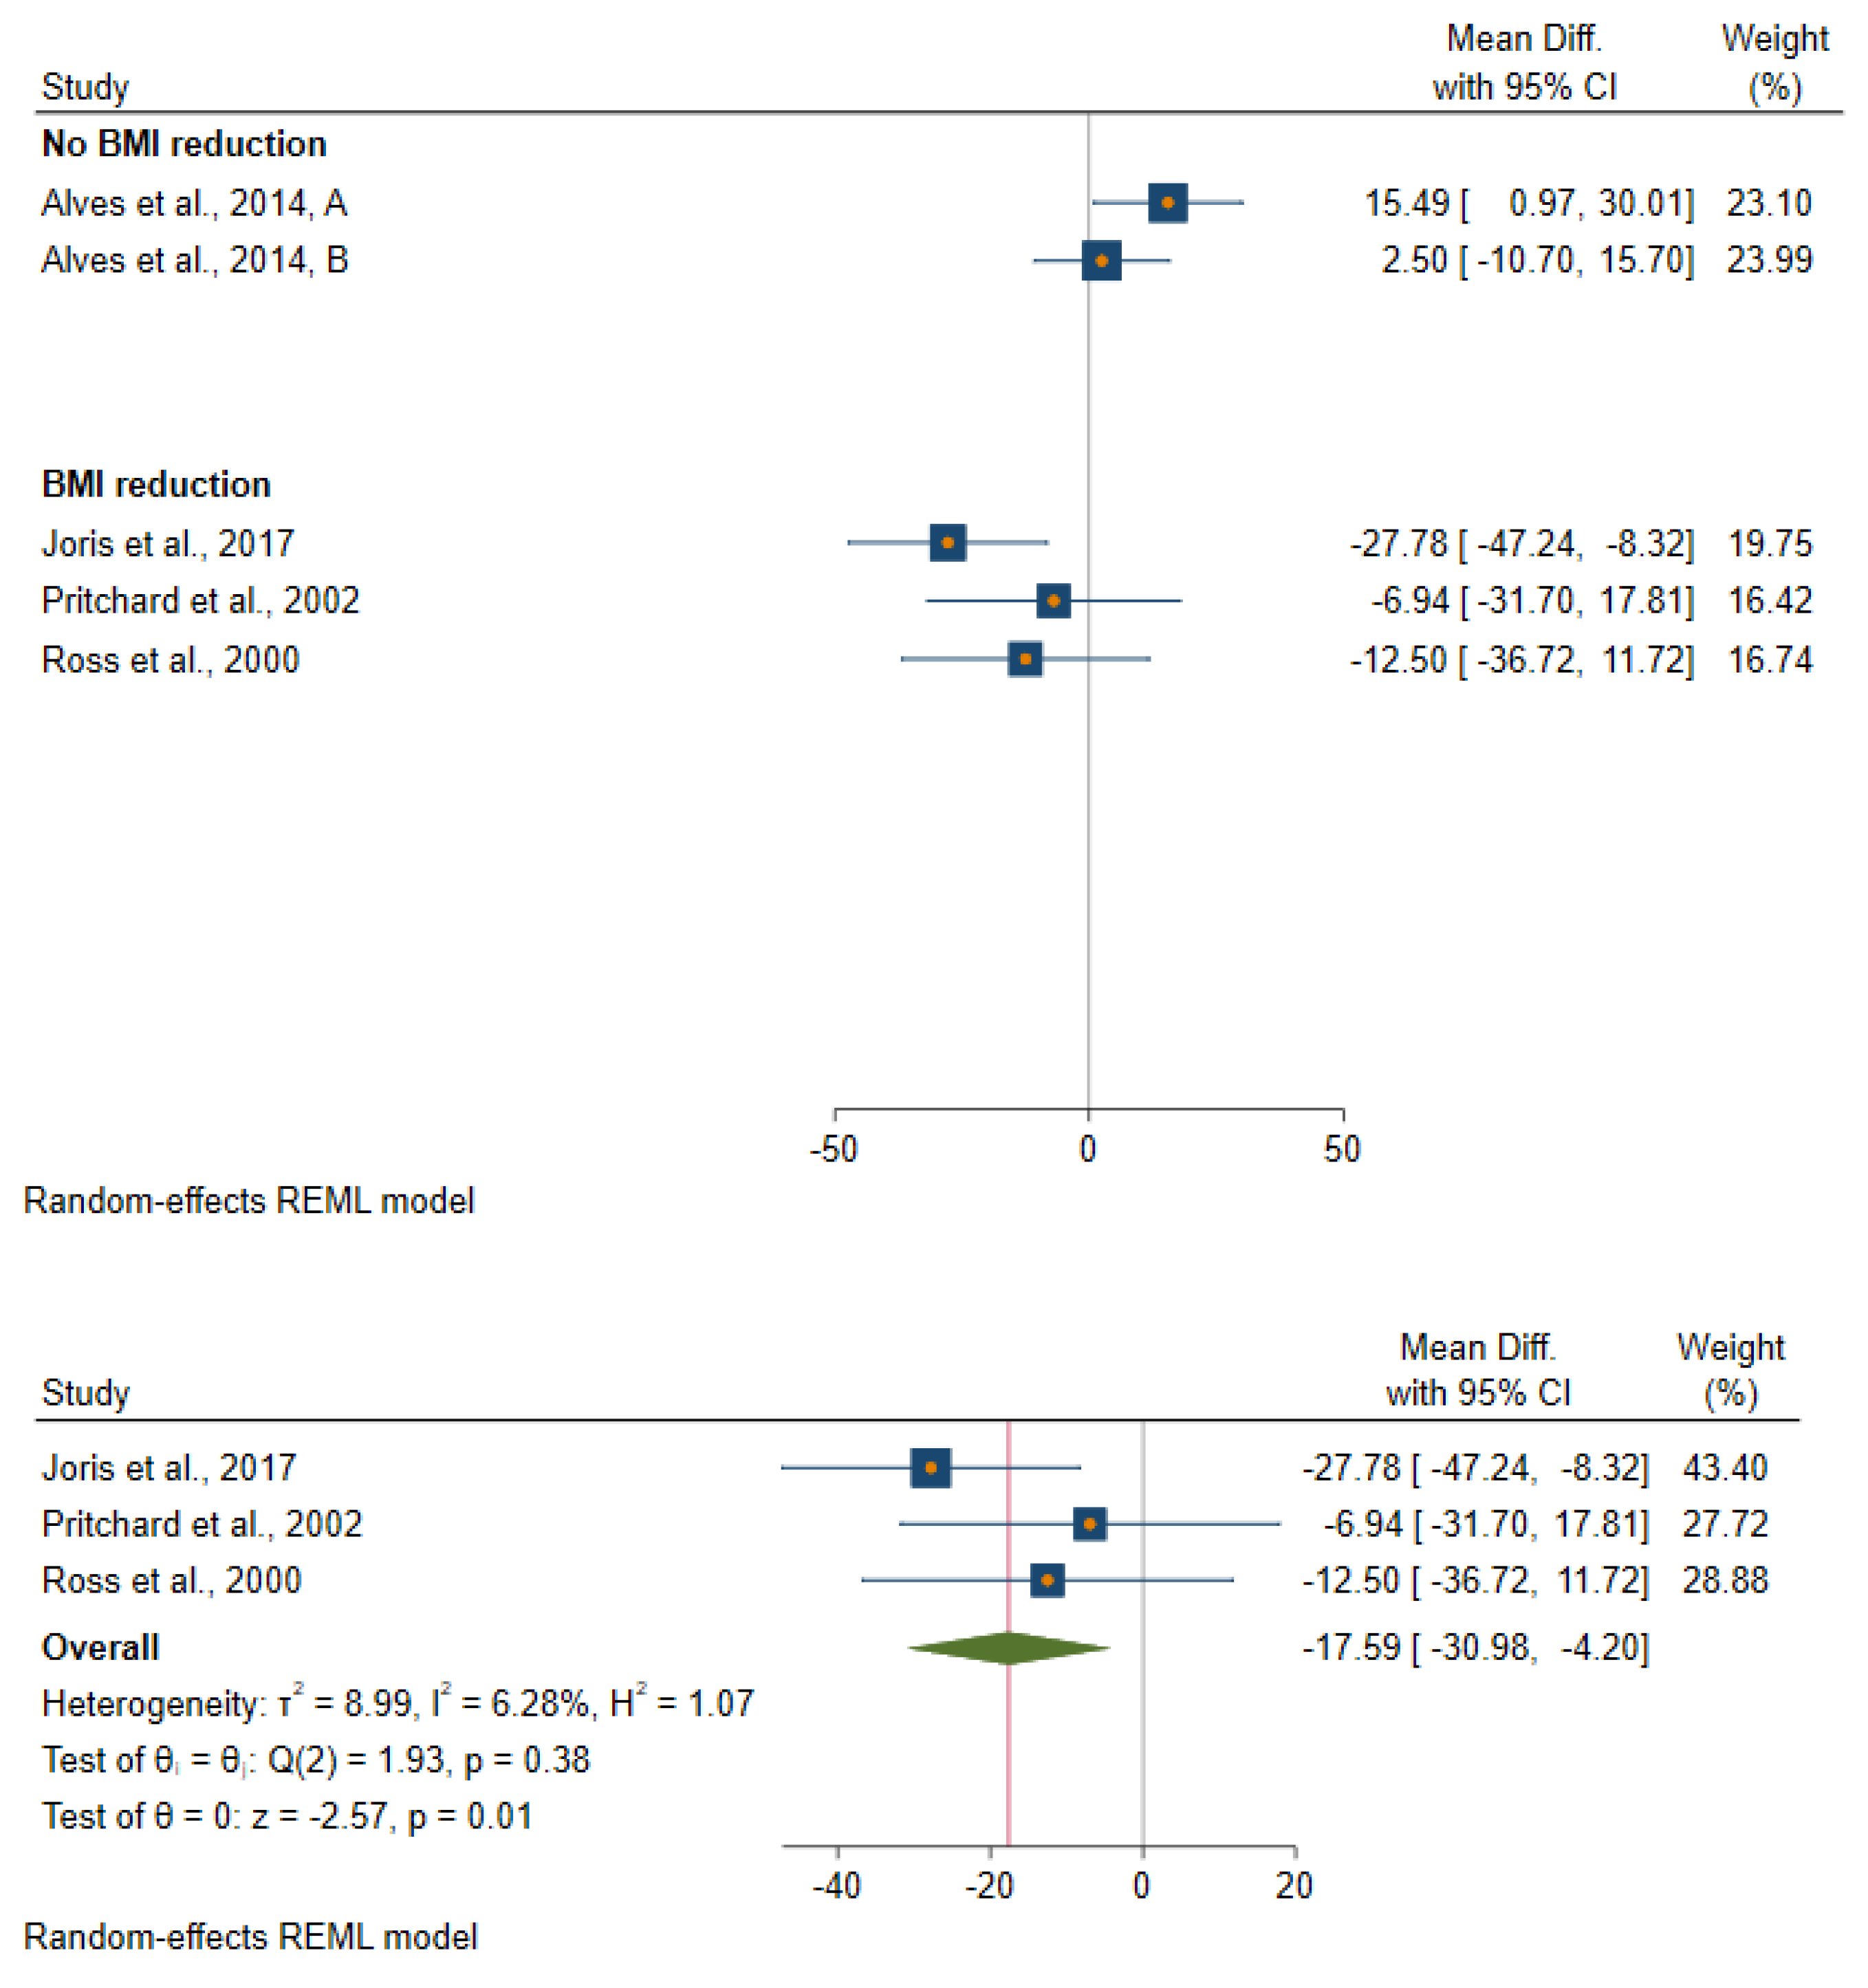
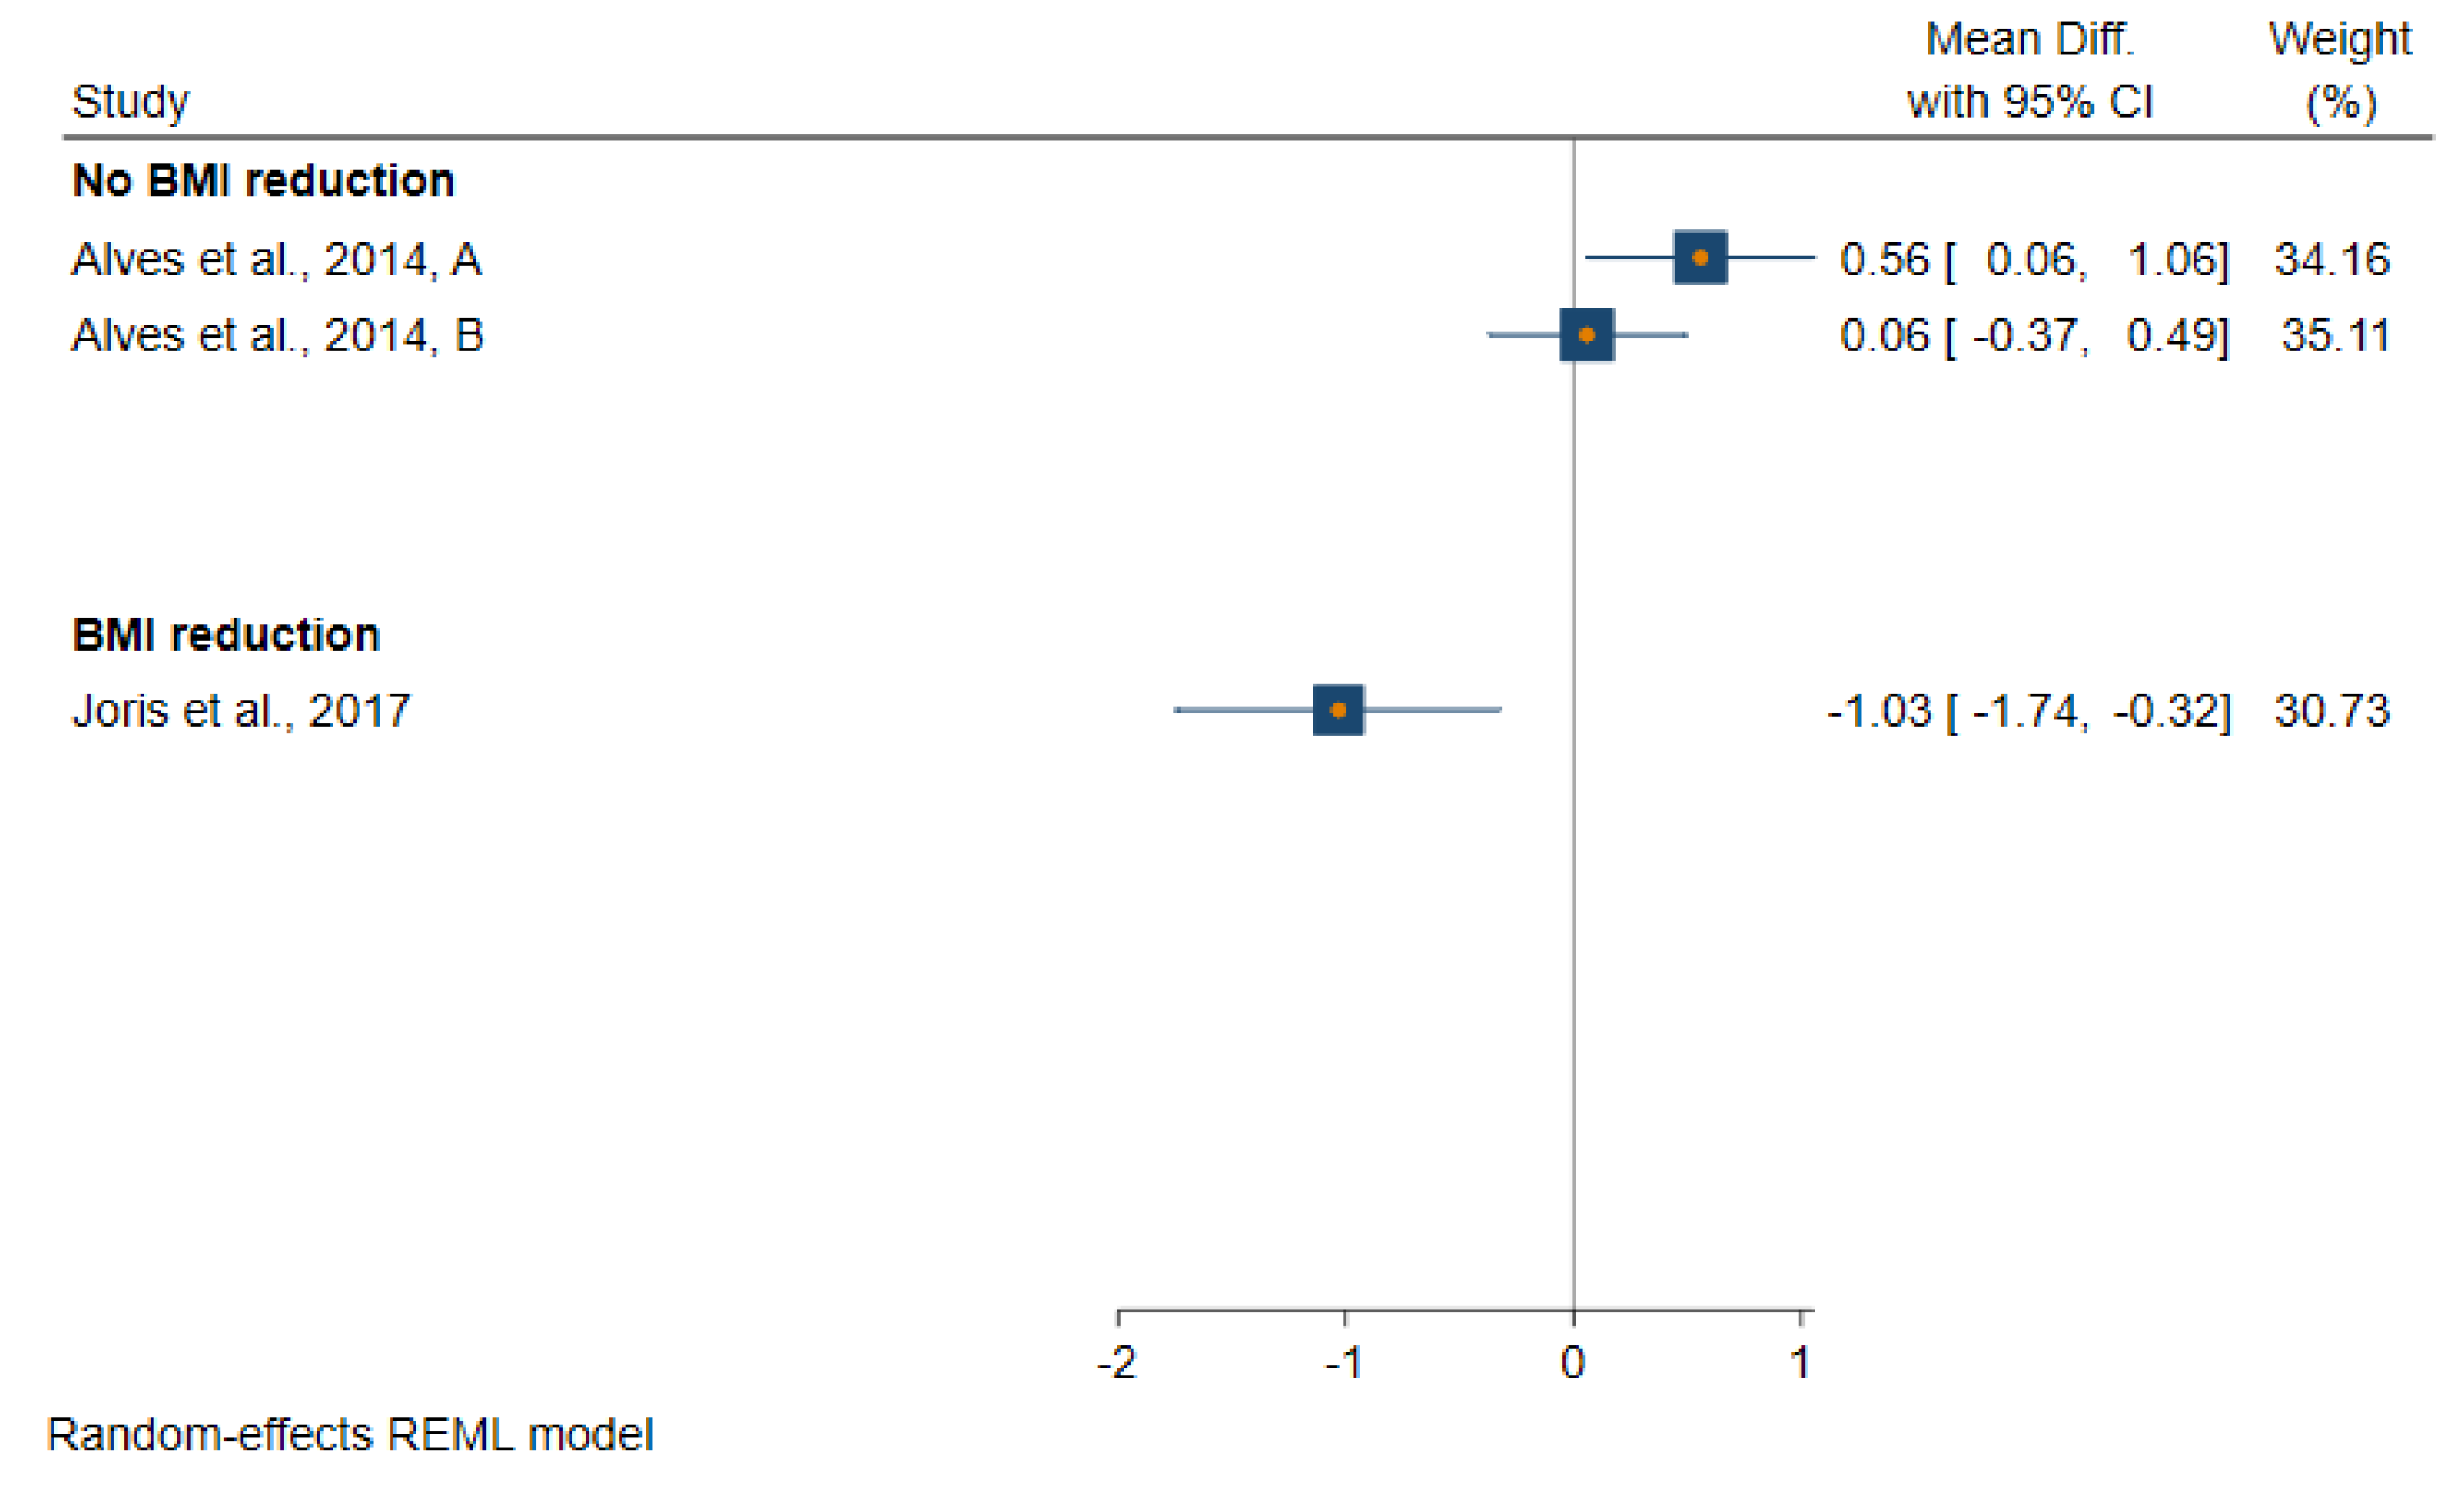
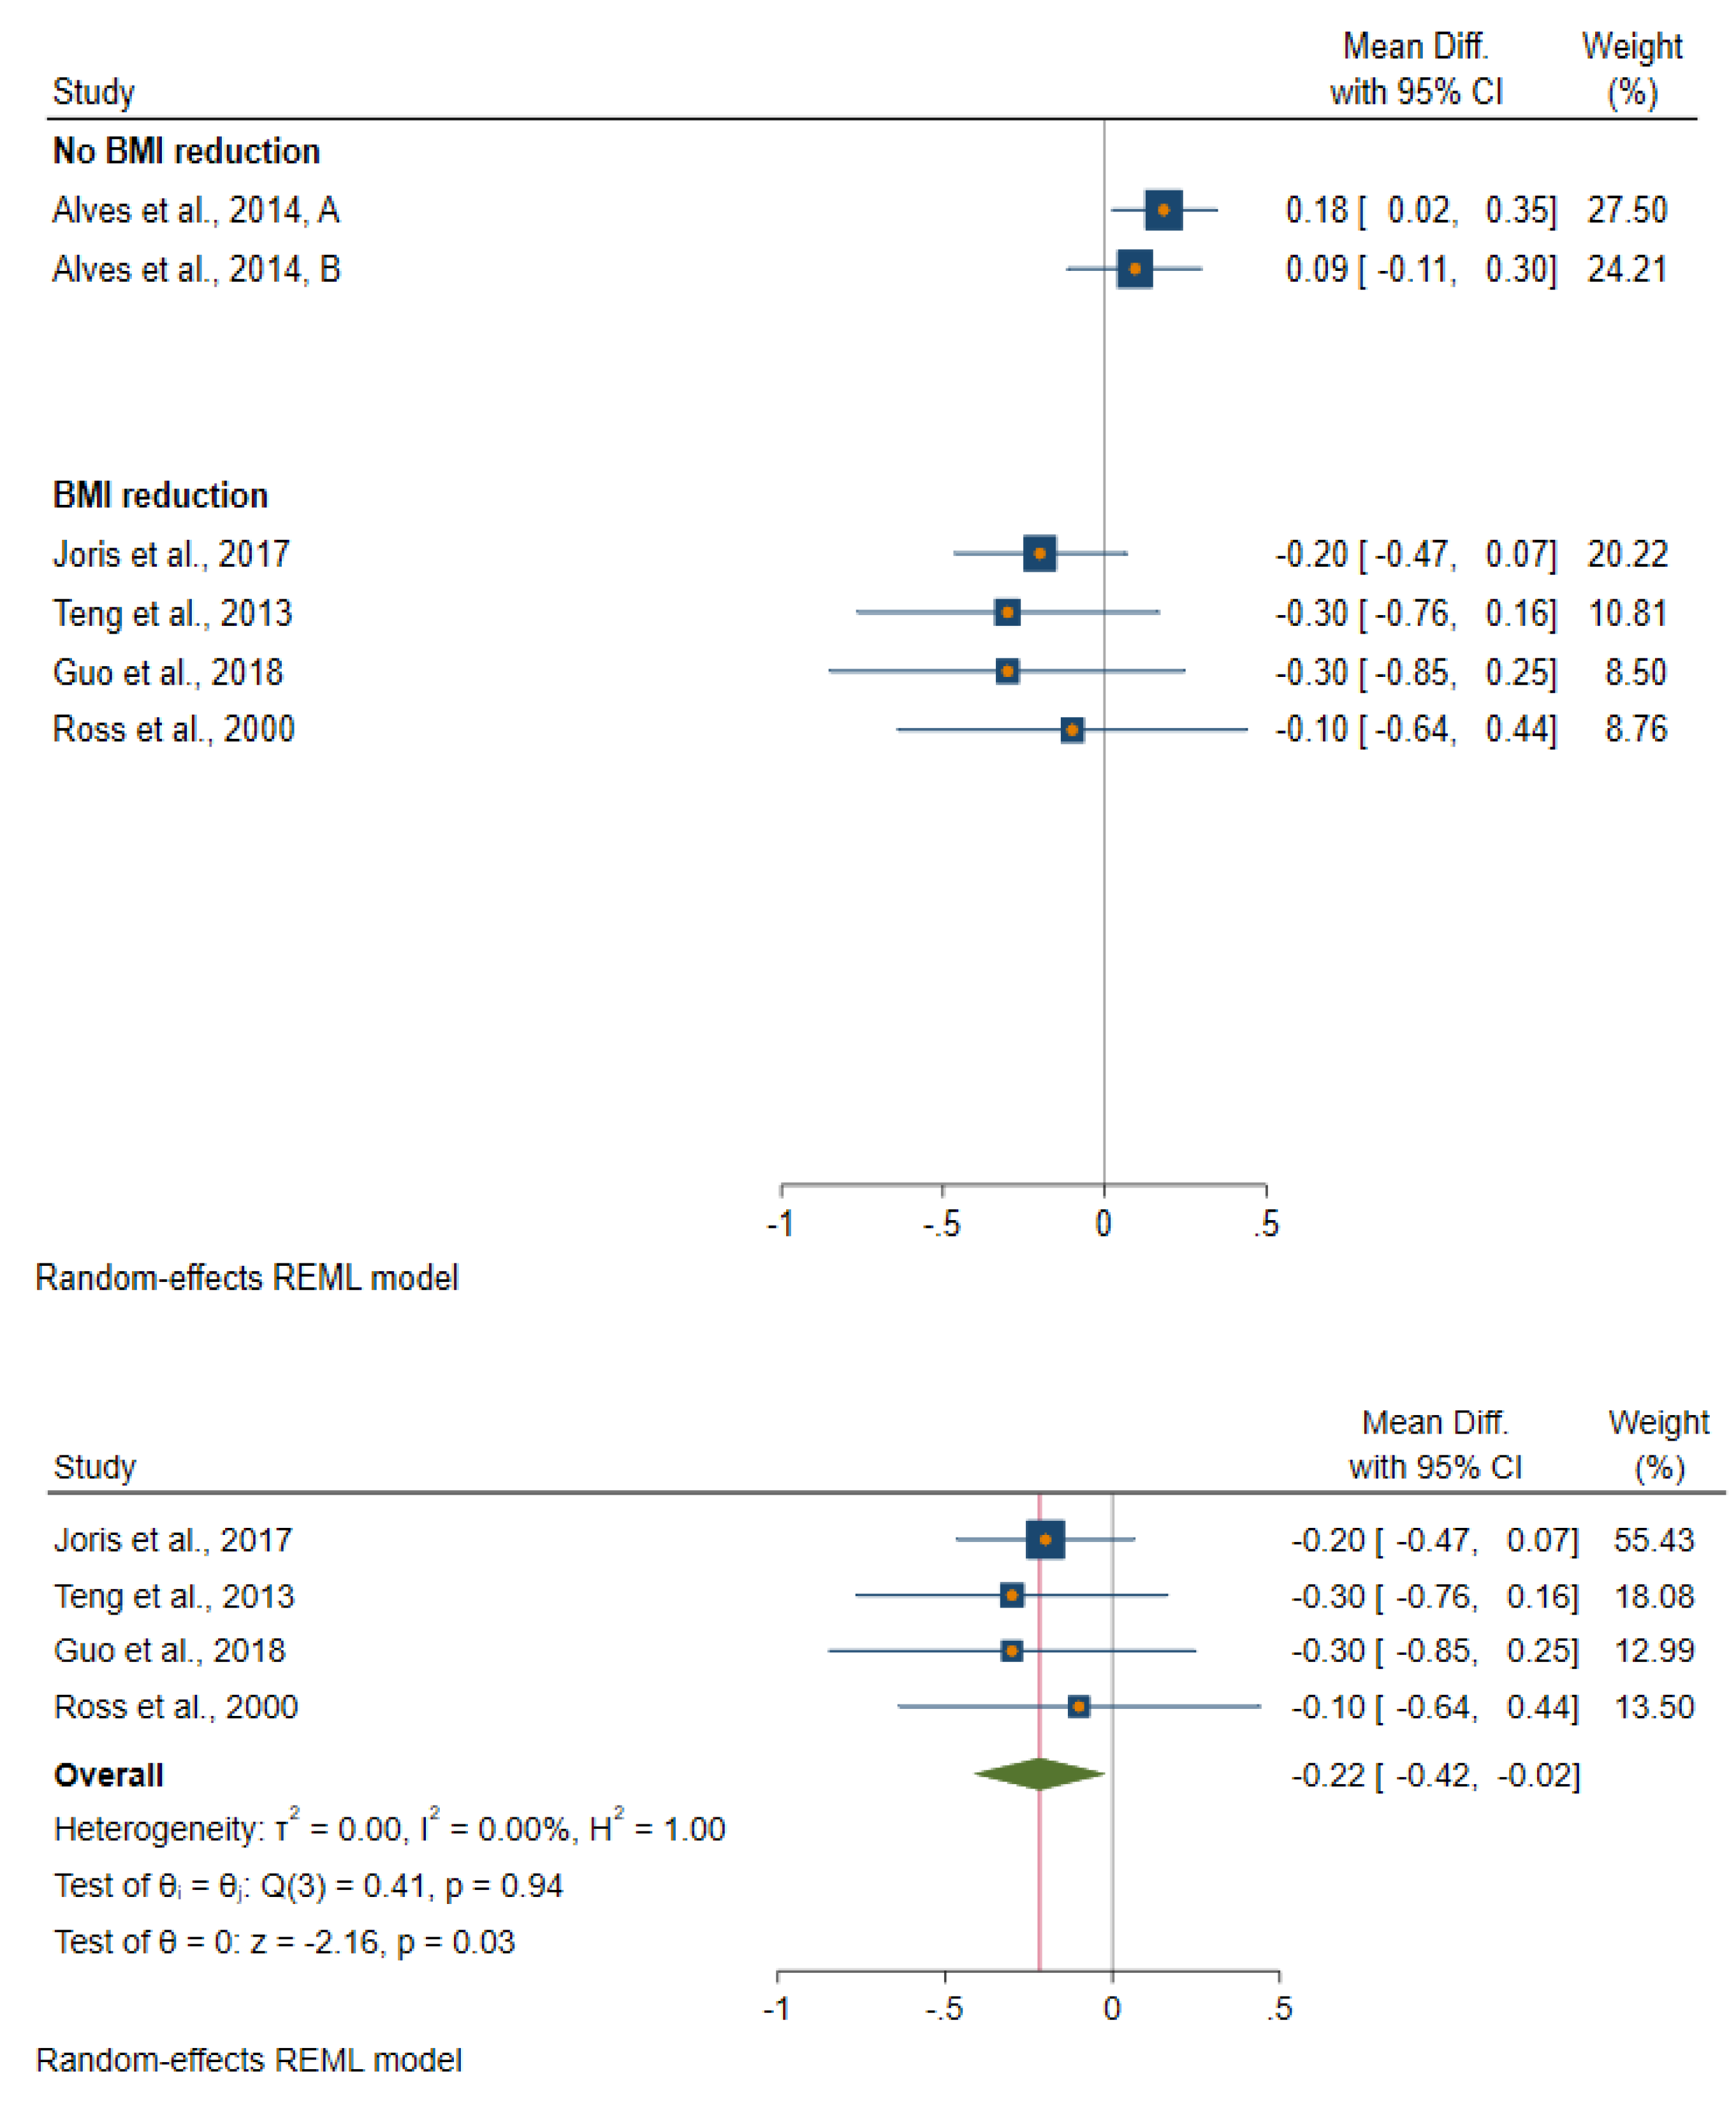
3.2. Effect of Reduction in Body Fatness on Biomarkers of Insulin Sensitivity
3.3. Insulin–Prostate Association Cancer Studies
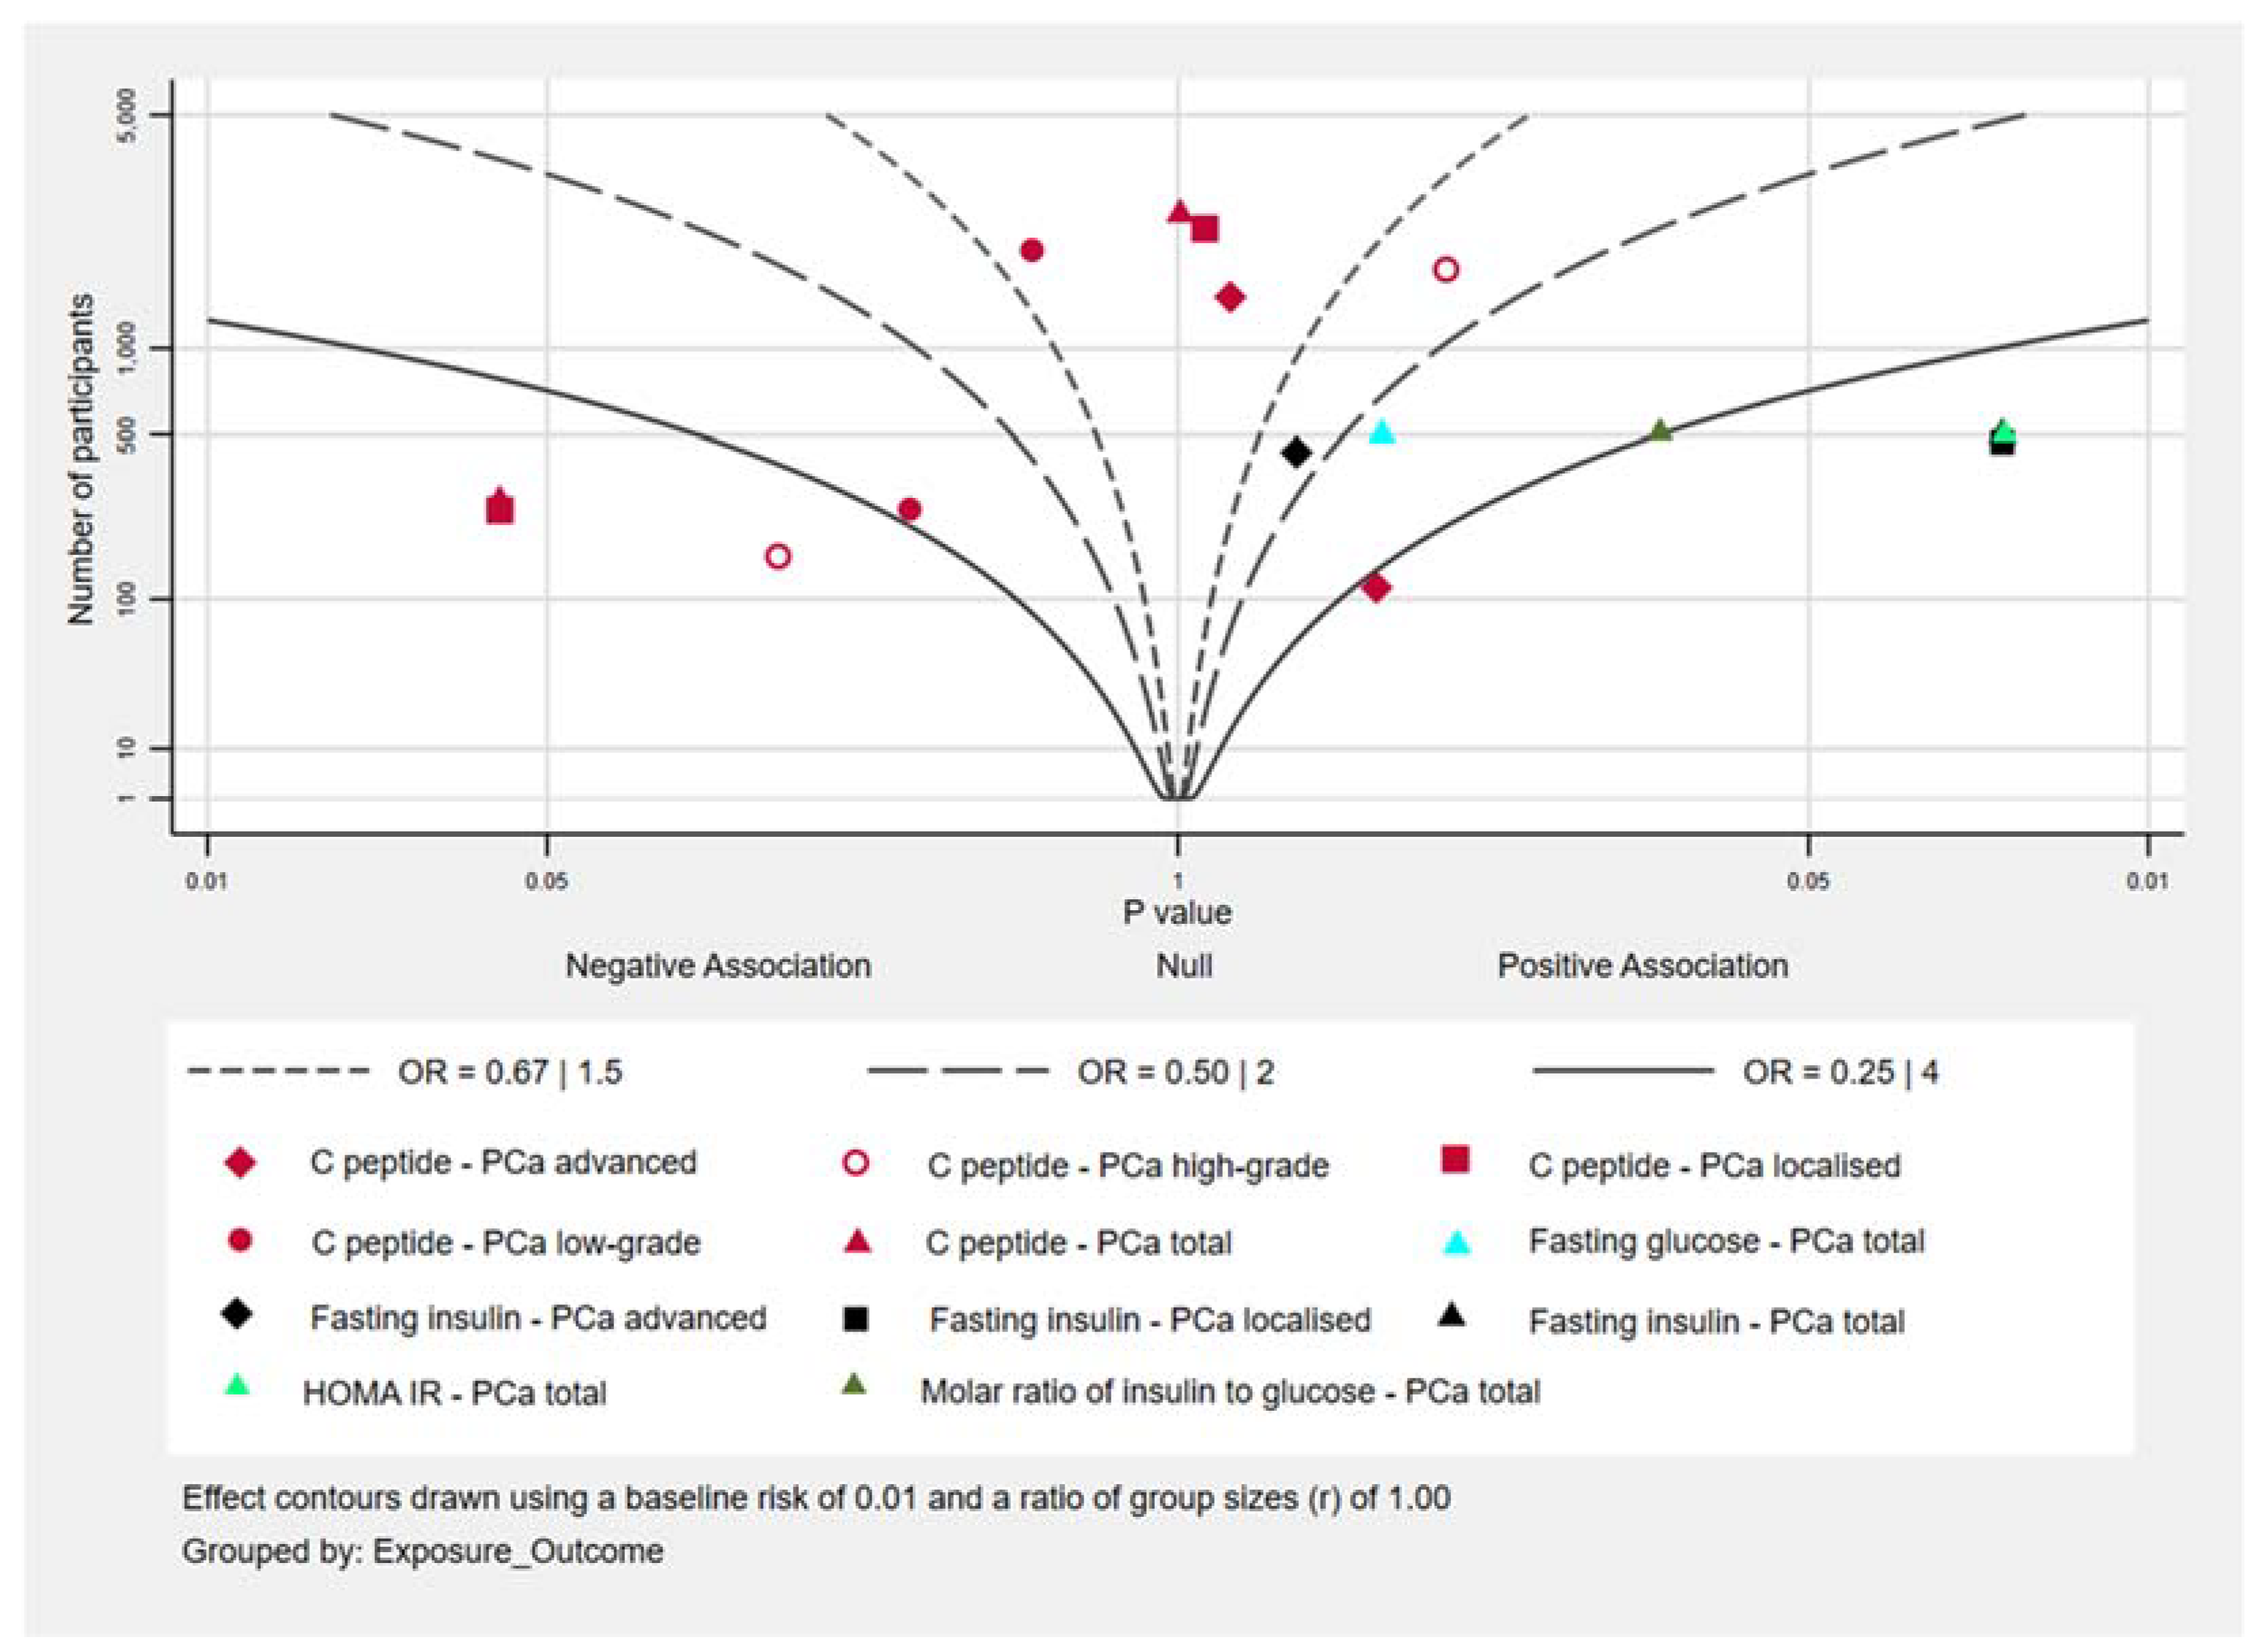
3.4. Associations between Biomarkers of Insulin Sensitivity and PCa Risk
4. Discussion
4.1. Overall Findings
4.2. Strengths and Limitations of Our Review
5. Conclusions
Supplementary Materials
Author Contributions
Funding
Data Availability Statement
Conflicts of Interest
References
- Rawla, P. Epidemiology of Prostate Cancer. World J. Oncol. 2019, 10, 63–89. [Google Scholar] [CrossRef] [PubMed] [Green Version]
- Bray, F.; Me, J.F.; Soerjomataram, I.; Siegel, R.L.; Torre, L.A.; Jemal, A. Global cancer statistics 2018: GLOBOCAN estimates of incidence and mortality worldwide for 36 cancers in 185 countries. CA Cancer J. Clin. 2018, 68, 394–424. [Google Scholar] [CrossRef] [Green Version]
- Hsing, A.W.; Chokkalingam, A.P. Prostate cancer epidemiology. Front. Biosci. J. Virtual Libr. 2006, 11, 1388–1413. [Google Scholar] [CrossRef]
- Byers, T.; Sedjo, R.L. Body fatness as a cause of cancer: Epidemiologic clues to biologic mechanisms. Endocr.-Relat. Cancer 2015, 22, R125–R134. [Google Scholar] [CrossRef]
- Lauby-Secretan, B.; Scoccianti, C.; Loomis, D.; Grosse, Y.; Bianchini, F.; Straif, K. Body Fatness and Cancer—Viewpoint of the IARC Working Group. N. Engl. J. Med. 2016, 375, 794–798. [Google Scholar] [CrossRef] [Green Version]
- Pearson-Stuttard, J.; Zhou, B.; Kontis, V.; Bentham, J.; Gunter, M.J.; Ezzati, M. Worldwide burden of cancer attributable to diabetes and high body-mass index: A comparative risk assessment. Lancet Diabetes Endocrinol. 2018, 6, e6–e15. [Google Scholar] [CrossRef]
- Cao, Y.; Ma, J. Body Mass Index, Prostate Cancer–Specific Mortality, and Biochemical Recurrence: A Systematic Review and Meta-analysis. Cancer Prev. Res. 2011, 4, 486–501. [Google Scholar] [CrossRef] [Green Version]
- Bassett, J.K.; Severi, G.; Baglietto, L.; MacInnis, R.J.; Hoang, H.N.; Hopper, J.L. English, D.R., & Giles, G.G.. Weight change and prostate cancer incidence and mortality. Int. J. Cancer 2012, 131, 1711–1719. [Google Scholar]
- Strom, S.S.; Wang, X.; Pettaway, C.A.; Logothetis, C.J.; Yamamura, Y.; Do, K.A.; Babaian, R.J.; Troncoso, P. Obesity, weight gain, and risk of bio-chemical failure among prostate cancer patients following prostatectomy. Clin. Cancer Res. 2005, 11, 6889–6894. [Google Scholar]
- MacInnis, R.J.; English, D. Body size and composition and prostate cancer risk: Systematic review and meta-regression analysis. Cancer Causes Control. 2006, 17, 989–1003. [Google Scholar] [CrossRef]
- NCD Risk Factor Collaboration (NCD-RisC). Trends in adult body-mass index in 200 countries from 1975 to 2014: A pooled analysis of 1698 population-based measurement studies with 19.2 million participants. Lancet 2016, 387, 1377–1396. [Google Scholar] [CrossRef] [Green Version]
- Lewis, S.J.; Gardner, M.; Higgins, J.; Holly, J.M.; Gaunt, T.R.; Perks, C.M.; Turner, S.D.; Rinaldi, S.; Thomas, S.; Harrison, S.; et al. Developing the WCRF International/University of Bristol Methodology for Identifying and Carrying Out Systematic Reviews of Mechanisms of Exposure-Cancer Associations. Cancer Epidemiol. Biomark. Prev. 2017, 26, 1667–1675. [Google Scholar] [CrossRef] [Green Version]
- Kaaks, R.; Lukanova, A. Energy balance and cancer: The role of insulin and insulin-like growth factor-I. Proc. Nutr. Soc. 2001, 60, 91–106. [Google Scholar] [CrossRef] [Green Version]
- Kahn, B.B.; Flier, J.S. Obesity and insulin resistance. J. Clin. Investig. 2000, 106, 473–481. [Google Scholar] [CrossRef] [Green Version]
- Everson, S.; Glodberg, D.E.; Helmrich, S.P.; Lakka, T.; Lynch, J.W.; Kaplan, G.A.; Salonen, J.T. Weight Gain and the Risk of Developing Insulin Resistance Syndrome. Diabetes Care 1998, 21, 1637–1643. [Google Scholar] [CrossRef]
- Chang, Y.; Sung, E.; Yun, K.E.; Jung, H.-S.; Kim, C.-W.; Kwon, M.-J.; Cho, S.-I.; Ryu, S. Weight Change as a Predictor of Incidence and Remission of Insulin Resistance. PLoS ONE 2013, 8, e63690. [Google Scholar] [CrossRef]
- Arcidiacono, B.; Iiritano, S.; Nocera, A.; Possidente, K.; Nevolo, M.T.; Ventura, V.; Foti, D.; Chiefari, E.; Brunetti, A. Insulin Resistance and Cancer Risk: An Overview of the Pathogenetic Mechanisms. Exp. Diabetes Res. 2012, 2012, 789174. [Google Scholar] [CrossRef] [Green Version]
- van Dam, R.M. The epidemiology of lifestyle and risk for type 2 diabetes. Eur. J. Epidemiol. 2003, 18, 1115–1125. [Google Scholar] [CrossRef] [PubMed]
- Wells, J.C.K. Body composition and susceptibility to type 2 diabetes: An evolutionary perspective. Eur. J. Clin. Nutr. 2017, 71, 881–889. [Google Scholar] [CrossRef] [PubMed] [Green Version]
- Fogelholm, M. Physical activity, fitness and fatness: Relations to mortality, morbidity and disease risk factors. A systematic review. Obes. Rev. 2010, 11, 202–221. [Google Scholar] [CrossRef] [PubMed]
- Saboori, S.; Rad, E.Y.; Birjandi, M.; Mohiti, S.; Falahi, E. Serum insulin level, HOMA-IR and prostate cancer risk: A systematic review and meta-analysis. Diabetes Metab. Syndr. Clin. Res. Rev. 2019, 13, 110–115. [Google Scholar] [CrossRef] [PubMed]
- Bonovas, S.; Filioussi, K.; Tsantes, A. Diabetes mellitus and risk of prostate cancer: A meta-analysis. Diabetologia 2004, 47, 1071–1078. [Google Scholar] [CrossRef]
- Kasper, J.S.; Giovannucci, E. A meta-analysis of diabetes mellitus and the risk of prostate cancer. Cancer Epidemiol. Biomark. Prev. 2006, 15, 2056–2062. [Google Scholar] [CrossRef] [Green Version]
- Whitburn, J.; Edwards, C.; Sooriakumaran, P. Metformin and Prostate Cancer: A New Role for an Old Drug. Curr. Urol. Rep. 2017, 18, 46. [Google Scholar] [CrossRef] [Green Version]
- International Agency for Research on Cancer. Preamble for Primary Interventions. IARC Handbook of Cancer Prevention 2019. Available online: http://handbooks.iarc.fr/preambles/index.php (accessed on 25 May 2021).
- Basaria, S. Androgen Deprivation Therapy, Insulin Resistance, and Cardiovascular Mortality: An Inconvenient Truth. J. Androl. 2008, 29, 534–539. [Google Scholar] [CrossRef] [PubMed]
- Egger, M.; Smith, G.D.; Schneider, M.; Minder, C. Bias in meta-analysis detected by a simple, graphical test. BMJ 1997, 315, 629–634. [Google Scholar] [CrossRef] [Green Version]
- Harrison, S.; Jones, H.; Martin, R.; Lewis, S.J.; Higgins, J. The albatross plot: A novel graphical tool for presenting results of diversely reported studies in a systematic review. Res. Synth. Methods 2017, 8, 281–289. [Google Scholar] [CrossRef] [Green Version]
- Sterne, J.A.C.; Savović, J.; Page, M.; Elbers, R.G.; Blencowe, N.; Boutron, I.; Cates, C.; Cheng, H.-Y.; Corbett, M.S.; Eldridge, S.M.; et al. RoB 2: A revised tool for assessing risk of bias in randomised trials. BMJ 2019, 366, l4898. [Google Scholar] [CrossRef] [Green Version]
- Guyatt, G.H.; Oxman, A.D.; Vist, G.E.; Kunz, R.; Falck-Ytter, Y.; Alonso-Coello, P.; Schünemann, H.J. GRADE: An emerging consensus on rating quality of evidence and strength of recommendations. BMJ 2008, 336, 924–926. [Google Scholar] [CrossRef] [Green Version]
- Schünemann, H.J.; Cuello, C.; Akl, E.A.; Mustafa, R.A.; Meerpohl, J.J.; Thayer, K.; Morgan, R.L.; Gartlehner, G.; Kunz, R.; Katikireddi, S.V.; et al. GRADE guidelines: 18. How ROBINS-I and other tools to assess risk of bias in nonrandomized studies should be used to rate the certainty of a body of evidence. J. Clin. Epidemiol. 2019, 111, 105–114. [Google Scholar] [CrossRef] [PubMed] [Green Version]
- Alves, R.D.M.; De Oliveira, F.C.E.; Hermsdorff, H.H.M.; Abete, I.; Zulet, M.A.; Martínez, J.A.; Bressan, J. Eating carbohydrate mostly at lunch and protein mostly at dinner within a covert hypocaloric diet influences morning glucose homeostasis in overweight/obese men. Eur. J. Nutr. 2014, 53, 49–60. [Google Scholar] [CrossRef] [PubMed]
- Guo, X.; Xu, Y.; He, H.; Cai, H.; Zhang, J.; Li, Y.; Yan, X.; Zhang, M.; Zhang, N.; Maddela, R.L.; et al. Effects of a Meal Replacement on Body Composition and Metabolic Parameters among Subjects with Overweight or Obesity. J. Obes. 2018, 2018, 2837367. [Google Scholar] [CrossRef] [PubMed] [Green Version]
- Joris, P.J.; Plat, J.; Kusters, Y.H.; Houben, A.J.; DA Stehouwer, C.; Schalkwijk, C.G.; Mensink, R.P. Diet-induced weight loss improves not only cardiometabolic risk markers but also markers of vascular function: A randomized controlled trial in abdominally obese men. Am. J. Clin. Nutr. 2017, 105, 23–31. [Google Scholar] [CrossRef] [Green Version]
- Katzel, L.I.; Bleecker, E.R.; Rogus, E.M.; Goldberg, A.P. Sequential effects of arobic exercise training and weight loss on risk factors for coronary disease in healthy, obese middle-aged and older men. Metabolism 1997, 46, 1441–1447. [Google Scholar] [CrossRef]
- Pritchard, J.E.; Nowson, C.A.; Billington, T.; Wark, J.D. Benefits of a year-long workplace weight loss program on cardiovascular risk factors. Nutr. Diet. 2002, 59, 87–96. [Google Scholar]
- Ross, R.; Dagnone, D.; Jones, P.J.; Smith, H.; Paddags, A.; Hudson, R.; Janssen, I. Reduction in Obesity and Related Comorbid Conditions after Diet-Induced Weight Loss or Exercise-Induced Weight Loss in Men. Ann. Intern. Med. 2000, 133, 92–103. [Google Scholar] [CrossRef]
- Teng, N.I.M.F.; Shahar, S.; Rajab, N.F.; Manaf, Z.A.; Johari, M.H.; Ngah, W.Z.W. Improvement of metabolic parameters in healthy older adult men following a fasting calorie restriction intervention. Aging Male 2013, 16, 177–183. [Google Scholar] [CrossRef]
- Albanes, D.; Weinstein, S.J.; Wright, M.; Männistö, S.; Limburg, P.J.; Snyder, K.; Virtamo, J. Serum Insulin, Glucose, Indices of Insulin Resistance, and Risk of Prostate Cancer. J. Natl. Cancer Inst. 2009, 101, 1272–1279. [Google Scholar] [CrossRef] [PubMed] [Green Version]
- Darbinian, J.A.; Ferrara, A.; Van Den Eeden, S.K.; Quesenberry, C.P.; Fireman, B.; Habel, L. Glycemic Status and Risk of Prostate Cancer. Cancer Epidemiol. Biomark. Prev. 2008, 17, 628–635. [Google Scholar] [CrossRef] [Green Version]
- Dickerman, B.A.; Torfadottir, J.E.; Valdimarsdottir, U.A.; Wilson, K.M.; Steingrimsdottir, L.; Aspelund, T.; Batista, J.L.; Fall, K.; Giovannucci, E.; Sigurdardottir, L.G.; et al. Midlife metabolic factors and prostate cancer risk in later life. Int. J. Cancer 2018, 142, 1166–1173. [Google Scholar] [CrossRef] [Green Version]
- Lai, G.Y.; Helzlsouer, K.J.; Clipp, S.L.; Rifai, N.; Platz, E.A. Association between C-Peptide Concentration and Prostate Cancer Incidence in the CLUE II Cohort Study. Cancer Prev. Res. 2010, 3, 1334–1341. [Google Scholar] [CrossRef] [PubMed] [Green Version]
- Lai, G.Y.; Giovannucci, E.L.; Pollak, M.N.; Peskoe, S.B.; Stampfer, M.J.; Willett, W.C.; Platz, E.A. Association of C-peptide and leptin with prostate cancer incidence in the Health Professionals Follow-up Study. Cancer Causes Control. 2014, 25, 625–632. [Google Scholar] [CrossRef] [PubMed] [Green Version]
- Marrone, M.T.; Selvin, E.; Barber, J.R.; Platz, E.A.; Joshu, C.E. Hyperglycemia, Classified with Multiple Biomarkers Simultaneously in Men without Diabetes, and Risk of Fatal Prostate Cancer. Cancer Prev. Res. 2019, 12, 103–112. [Google Scholar] [CrossRef] [PubMed] [Green Version]


| Author (Date) | Country of Origin | Adiposity Status 1 | Ethnicity | Number of Participants: (Intervention/Control) | Age of Participants 2: (Intervention/Control) | Intervention Group | Control Group | Outcome Measured |
|---|---|---|---|---|---|---|---|---|
| Ross R (2000) | Canada | Obese men-BMI >27 kg/m2 | NA | 22 (14/8) | 42.6 (9.7)/46.0 (10.9) | Baseline period: Weight maintenance diet (4–5 weeks) | Fasting glucose | |
| Diet-induced weight loss group: Reduction in isocaloric diet by 700 kcal/d to achieve a weight loss of 0.6kg/week. Free-living participants (self-selected foods. Weekly 1 h seminars with dietitian. Participants kept daily food records, reviewed by the dietitian. | Body weight maintenance group: Participants asked to maintain their body weight throughout the study period. Free-living participants (self-selected foods. Weekly 1 h seminars with dietitian. Participants kept daily food records, reviewed by the dietitian. | |||||||
| Fasting insulin | ||||||||
| OGTT glucose (2 h) | ||||||||
| OGTT insulin (2 h) | ||||||||
| Glucose disposal rate | ||||||||
| Glucose disposal (Oxidative fraction) | ||||||||
| Glucose disposal (Nonoxidative fraction) | ||||||||
| Intervention period: 12 weeks | ||||||||
| Teng NIMF (2013) | Malaysia | BMI: 23.0- 29.9 kg/m2; range | Malay | 56 (28/28) | 59.6 (5.4)/59.1 (6.2) | Baseline period: No, but eligible subjects should not have practiced Muslim Sunnah fasting or have changed their dietary pattern three months before the study. | Fasting glucose | |
| Fasting calorie restriction (FCR) group: Reduction of 300–500 kcal/d combined with 2 days/week of Muslim Sunnah Fasting. During fasting day: a light meal before sunrise (Sahur), no food and drink during the day (approximately for 13 h) and a complete meal after sunset (Iftar). Subjects provided with seven-day food menu guidelines. Weekly telephone-call to obtain information regarding subjects’ dietary intake and to ensure compliance. Fasting log book and food diaries were provided during each assessment meeting. | Maintenance group: Participants were asked to maintain their present lifestyle. | |||||||
| Intervention period: 12 weeks | ||||||||
| Pritchard J (2002) | Australia | Overweight men-BMI: 29.0 (2.6) kg/m2; mean (SD) | Australian | 24 [12 (10 available at baseline)/12 (2 available at baseline)] | 43.4 (5.7)/43.4 (5.7) | Baseline period: No | Fasting insulin | |
| Low-fat (25% of dietary energy) diet group: The intervention was personalised according to the subject’s usual dietary pattern and using the National Heart Foundation booklet, The Weight Loss Guide. Compliance was monitored from food diaries and measurement of weight at monthly sessions. | Maintenance group: Participants were instructed to maintain their pre-study dietary and activity patterns, monitored at monthly measurement sessions similar to those of the intervention group. | |||||||
| Intervention period: 48 weeks | ||||||||
| Katzel LI (1995) | USA | Obese men-BMI: 30.0 (1.0) kg/m2; mean [Standard error of the mean (SEM)] | 96% white (whole sample) | 62 (44/18) | 61.0 (1.0)/60.0 (1.0); mean [Standard error of the mean (SEM)] | Baseline period: Isoenergetic American Heart Association (AHA) phase I diet (3 months) | Fasting glucose | |
| Diet-induced weight loss group: Instructed to reduce energy intake by 1260 to 2100 kJ (300 to 500 kcal) per day. Goal was to decrease body weight by more than 10% during a 9 month period. Weekly group weight loss sessions. Food records were reviewed to ensure compliance to the diet. | Body weight maintenance group: Instructed not to lose weight or change their diets or level of physical activity. Weekly 1 h dietary counselling meetings to ensure compliance to the protocol. | |||||||
| Fasting insulin | ||||||||
| OGTT glucose (2 h) | ||||||||
| OGTT insulin (2 h) | ||||||||
| Intervention period: 36 weeks | ||||||||
| Joris PJ (2016) | NA; Netherlands | Abdominally obese men-Waist circumference: 102–110 cm; range | Caucasian | 49 (23/26) | 52.4 (46.8-61.7)/52.0 (45.4-61.1); median (Q1-Q3) | Baseline period: Measurements of abdominally obese men were balanced (18 months) | Fasting glucose | |
| Diet-induced weight loss group: Calorie-restricted diet for 6 weeks to obtain a waist circumference <102 cm followed by a weight-maintenance period of 2 weeks. Visited a research dietitian weekly (12 times in total) and consumed a very-low-calorie diet (VLCD) for >=4 weeks under strict guidance. If the waist circumference was still >102 cm after 4 weeks, the VLCD was continued for another week. The VLCD was supplied in powder sachets that had to be dissolved in water. Three sachets to be consumed daily. Participants were allowed to eat 250 g vegetables or fruit/day. After the VLCD period, subjects were prescribed a mixed, solid, calorie-restricted diet. | Body weight maintenance group: Maintained their habitual diet, physical activity levels, and use of alcohol throughout the total study period. Visited a research dietitian on 2 occasions. | |||||||
| Fasting insulin | ||||||||
| C-peptide | ||||||||
| HOMA-IR | ||||||||
| Intervention period: 8 weeks (a calorie-restricted diet for 6 weeks to obtain a waist circumference <102 cm followed by a weight-maintenance period of 2 weeks) | ||||||||
| Guo X (2018) | China | Overweight/obese men-BMI > 24 kg/m2 | Chinese | 80 (42/38) | 38.9 (6.5)/38.0 (6.6) | Baseline period: No | Fasting glucose | |
| Meal replacement with mild caloric restriction group: Consumed one liquid meal replacement which contained 388 kcal in total energy at dinner time during the intervention. Individuals were advised to continue their regular physical activity regimen. Dietary habits were assessed through a self-administered 77-item Food Frequency Questionnaire (FFQ) at the first and last visit (12th week). | Routine diet group: Followed a routine Chinese dinner as before. Individuals were advised to continue their regular physical activity regimen. | |||||||
| Intervention period: 12 weeks | ||||||||
| Alves RDM (2014) | Brazil and Spain | Overweight/obese men-BMI: 30.1 (2.8) kg/m2; mean (SD) | NA | 39 (21/18) | 29.3 (7.3)/31.4 (7.6) | Baseline period: Weight-maintaining diet (3 days) | Fasting glucose | |
| Hypocaloric diet (~10% of caloric restriction)-Diurnal carbohydrate/nocturnal protein (DCNP) group: Received a prescription of a high-carbohydrate/low-protein lunch (69.3 and 7.2%, respectively) and a high-protein/low-carbohydrate dinner (41.7 and 18.8%, respectively). Subjects were asked to maintain habitual physical activity. Subject received nutritional advice and education from registered dietitians. Instructed to use an exchange-based self-selected food list, which assigned foods into categories according to their macronutrient composition. Subjects provided two 3-day food records (2 week days and 1 weekend day | Macronutrient-balanced group: Macronutrient-balanced lunch and dinner (18.0% protein, 46.8% carbohydrate, 35.2% fat). | |||||||
| Fasting insulin | ||||||||
| HOMA-IR | ||||||||
| Intervention period: 8 weeks | ||||||||
| Alves RDM (2014) | Brazil and Spain | Overweight/obese men-BMI: 30.1 (2.8) kg/m2; mean (SD) | NA | 37 (19/18) | 29.5 (7.5)/31.4 (7.6) | As Alves et al. (2014a) above except the lunch and dinner in the intervention group were reversed. | ||
| Case–Control Studies Nested in a Prospective Cohort | ||||||||||
|---|---|---|---|---|---|---|---|---|---|---|
| Author (Date) | Country of Origin | Study Name | Source of Participants | Duration of Follow-Up 1 | Ethnicity | Number of Participants (Cases/Controls) | Age 2 of Participants at Baseline (Cases/Controls) | Exposure Measured | Outcomes Assessed | Adjustment Variables |
| Lai GY (2010) | USA | CLUE II cohort | General population | 5.6 years (mean), (range: 0.3–12.1 years) | Majority White Americans; 2.3% African Americans (cases and controls) | 139/139 | 64.6 (9.0)/64.6 (9.0) | C-peptide | PCa total | BMI (overweight: 25-29.9, obese: ≥30, normal: <25 kg/m2), family history of prostate cancer (yes, missing, no) |
| 127/127 | PCa, localised | |||||||||
| 57/57 | PCa, advanced | |||||||||
| 128/128 | PCa, low-grade | |||||||||
| 80/80 | PCa, high-grade | |||||||||
| Lai GY (2014) | USA | Health Professionals Follow-Up Study (HPFS) | Occupational group (health professionals) | 5.4 years (median) (IQR: 3.1–7.7 years) | White Americans (cases: 94.2%, controls: 92.9%) | 1314/1314 | 64.2 (40.0-75.0)/64.2 (40.0-75.0); mean (range) | C-peptide | PCa total | BMI (kg/m2, continuous), history of diabetes |
| 1064/1314 | PCa, localised | BMI (kg/m2, continuous), history of diabetes, height (in, continuous), first degree family history of prostate cancer, vigorous physical activity (MET-hrs/wk, continuous), smoking in the past 10 years, history of vasectomy, total energy intake (kcal/day, continuous), alcohol intake (g/day), energy-adjusted intake of calcium (mg/day), alpha-linolenic acid (g/day), lycopene (μg/day), fructose (g/day), cumulative updated intake (1986–1994) of red meat and fish (servings/week), use of a vitamin E or selenium supplement | ||||||||
| 156/1314 | PCa, advanced | |||||||||
| 736/1314 | PCa, low-grade | |||||||||
| 477/1314 | PCa, high-grade | |||||||||
| Albanes D (2009) | Finland | Alpha-Tocopherol, Beta-Carotene Cancer Prevention (ATBC) Study | General population | 9.2 years (mean), (range: 5–12 years) | Finnish | 100/400 | 59.0 (4.6)/56.4 (5.0) | Fasting insulin | PCa total | Age (years), BMI (kg/m2) |
| 69/400 | PCa, localised | |||||||||
| 30/400 | PCa, advanced | |||||||||
| 100/400 | Fasting glucose | PCa total | ||||||||
| 100/400 | Molar ratio of insulin to glucose | |||||||||
| 100/400 | HOMA-IR | |||||||||
| Prospective cohorts | ||||||||||
| Author (Date) | Country of Origin | Study Name | Source of Participants | Duration of Follow-Up | Ethnicity | Number of Participants (Cases/Total) | Age of Participants at Baseline | Exposure Measured | Outcomes Assessed | Adjusted Variables |
| 152/1492 | HOMA-IR | |||||||||
| 75/1215 | HbA1c (%) | |||||||||
| 152/1,493 | Fasting insulin | |||||||||
| Dickerman BA (2018) | Iceland | The Reykjavik Study | General population | 25 years (mean) | Icelandic | 1061/9097 | 52.0; median | Fasting glucose | PCa total | Entry age (linear and quadratic terms) and stage (categorical) of cohort entry (1967–68, 1970–71, 1974–76, 1979–81, 1985–87), family history of prostate cancer (yes, no), smoking status (never, former, current), regular check-ups (yes, no), attained education (primary, secondary, college, university), height (quartiles), BMI (<25.0, 25.0–29.9, ≥30 kg/m2) |
| 374/9097 | PCa, high-grade | |||||||||
| 145/9097 | PCa, advanced | |||||||||
| 336/9097 | PCa mortality | |||||||||
| Marrone MT (2019) | USA | The Atherosclerosis Risk in Communities (ARIC) Study | General population | 22 years (max) | 27% African American | 626/4127 | 48.0–67.0; range | Fasting glucose | PCa total | Age (continuous, visit 2), joint categories for race and field centre (White from Minnesota; White from Washington Co. or Forsyth Co.; Black from Jackson; Black from Washington Co. or Forsyth Co.), BMI (kg/m2, continuous, visit 2), waist circumference (cm, continuous, visit 2), education (<high school, high school with some college, college graduate), cigarette smoking status (current/former smoker who quit <10 years ago; former smoker who quit ≥10 years ago, never smoker, visit 2) |
| 64/4689 | PCa, advanced | |||||||||
| 59/4694 | PCa mortality | |||||||||
| 626/4127 | HbA1c (%) | PCa total | ||||||||
| 64/4689 | PCa, advanced | |||||||||
| 59/4694 | PCa mortality | |||||||||
| Darbinian JA (2008) | NA; USA | Kaiser Permanente Medical Care Program | General population | 18.4 years (median) | White: 78.6%; Black: 13.2%; Asian: 4.4%; Other: 3.8% | 2554/* | 48.0 (35.0–80.0); median (range) | Glucose tolerance | PCa total | Glycaemic status (serum glucose levels measured 1 h after ingestion of 75 g oral glucose challenge among MHC examination participants who did not self-report history of diabetes or as diabetes per self-report (at MHC examination) of either physician diagnosis or diabetes-related medication usage during past year or two), year of MHC examination (<55, ≥55), race/ethnicity (White, African American), BMI per the WHO classification (<25, ≥25 kg/m2) |
| 1727/* | PCa, localised | |||||||||
| 642/* | PCa, regional (stages 2–5), distant (stage 7) | |||||||||
Publisher’s Note: MDPI stays neutral with regard to jurisdictional claims in published maps and institutional affiliations. |
© 2021 by the authors. Licensee MDPI, Basel, Switzerland. This article is an open access article distributed under the terms and conditions of the Creative Commons Attribution (CC BY) license (https://creativecommons.org/licenses/by/4.0/).
Share and Cite
James, R.; Dimopoulou, O.; Martin, R.M.; Perks, C.M.; Kelly, C.; Mathias, L.; Brugger, S.; Higgins, J.P.T.; Lewis, S.J. Could Reducing Body Fatness Reduce the Risk of Aggressive Prostate Cancer via the Insulin Signalling Pathway? A Systematic Review of the Mechanistic Pathway. Metabolites 2021, 11, 726. https://doi.org/10.3390/metabo11110726
James R, Dimopoulou O, Martin RM, Perks CM, Kelly C, Mathias L, Brugger S, Higgins JPT, Lewis SJ. Could Reducing Body Fatness Reduce the Risk of Aggressive Prostate Cancer via the Insulin Signalling Pathway? A Systematic Review of the Mechanistic Pathway. Metabolites. 2021; 11(11):726. https://doi.org/10.3390/metabo11110726
Chicago/Turabian StyleJames, Rachel, Olympia Dimopoulou, Richard M. Martin, Claire M. Perks, Claire Kelly, Louise Mathias, Stefan Brugger, Julian P. T. Higgins, and Sarah J. Lewis. 2021. "Could Reducing Body Fatness Reduce the Risk of Aggressive Prostate Cancer via the Insulin Signalling Pathway? A Systematic Review of the Mechanistic Pathway" Metabolites 11, no. 11: 726. https://doi.org/10.3390/metabo11110726
APA StyleJames, R., Dimopoulou, O., Martin, R. M., Perks, C. M., Kelly, C., Mathias, L., Brugger, S., Higgins, J. P. T., & Lewis, S. J. (2021). Could Reducing Body Fatness Reduce the Risk of Aggressive Prostate Cancer via the Insulin Signalling Pathway? A Systematic Review of the Mechanistic Pathway. Metabolites, 11(11), 726. https://doi.org/10.3390/metabo11110726