
Differences of Phenylalanine Concentrations in Dried Blood Spots and in Plasma: Erythrocytes as a Neglected Component for This Observation

 , , and
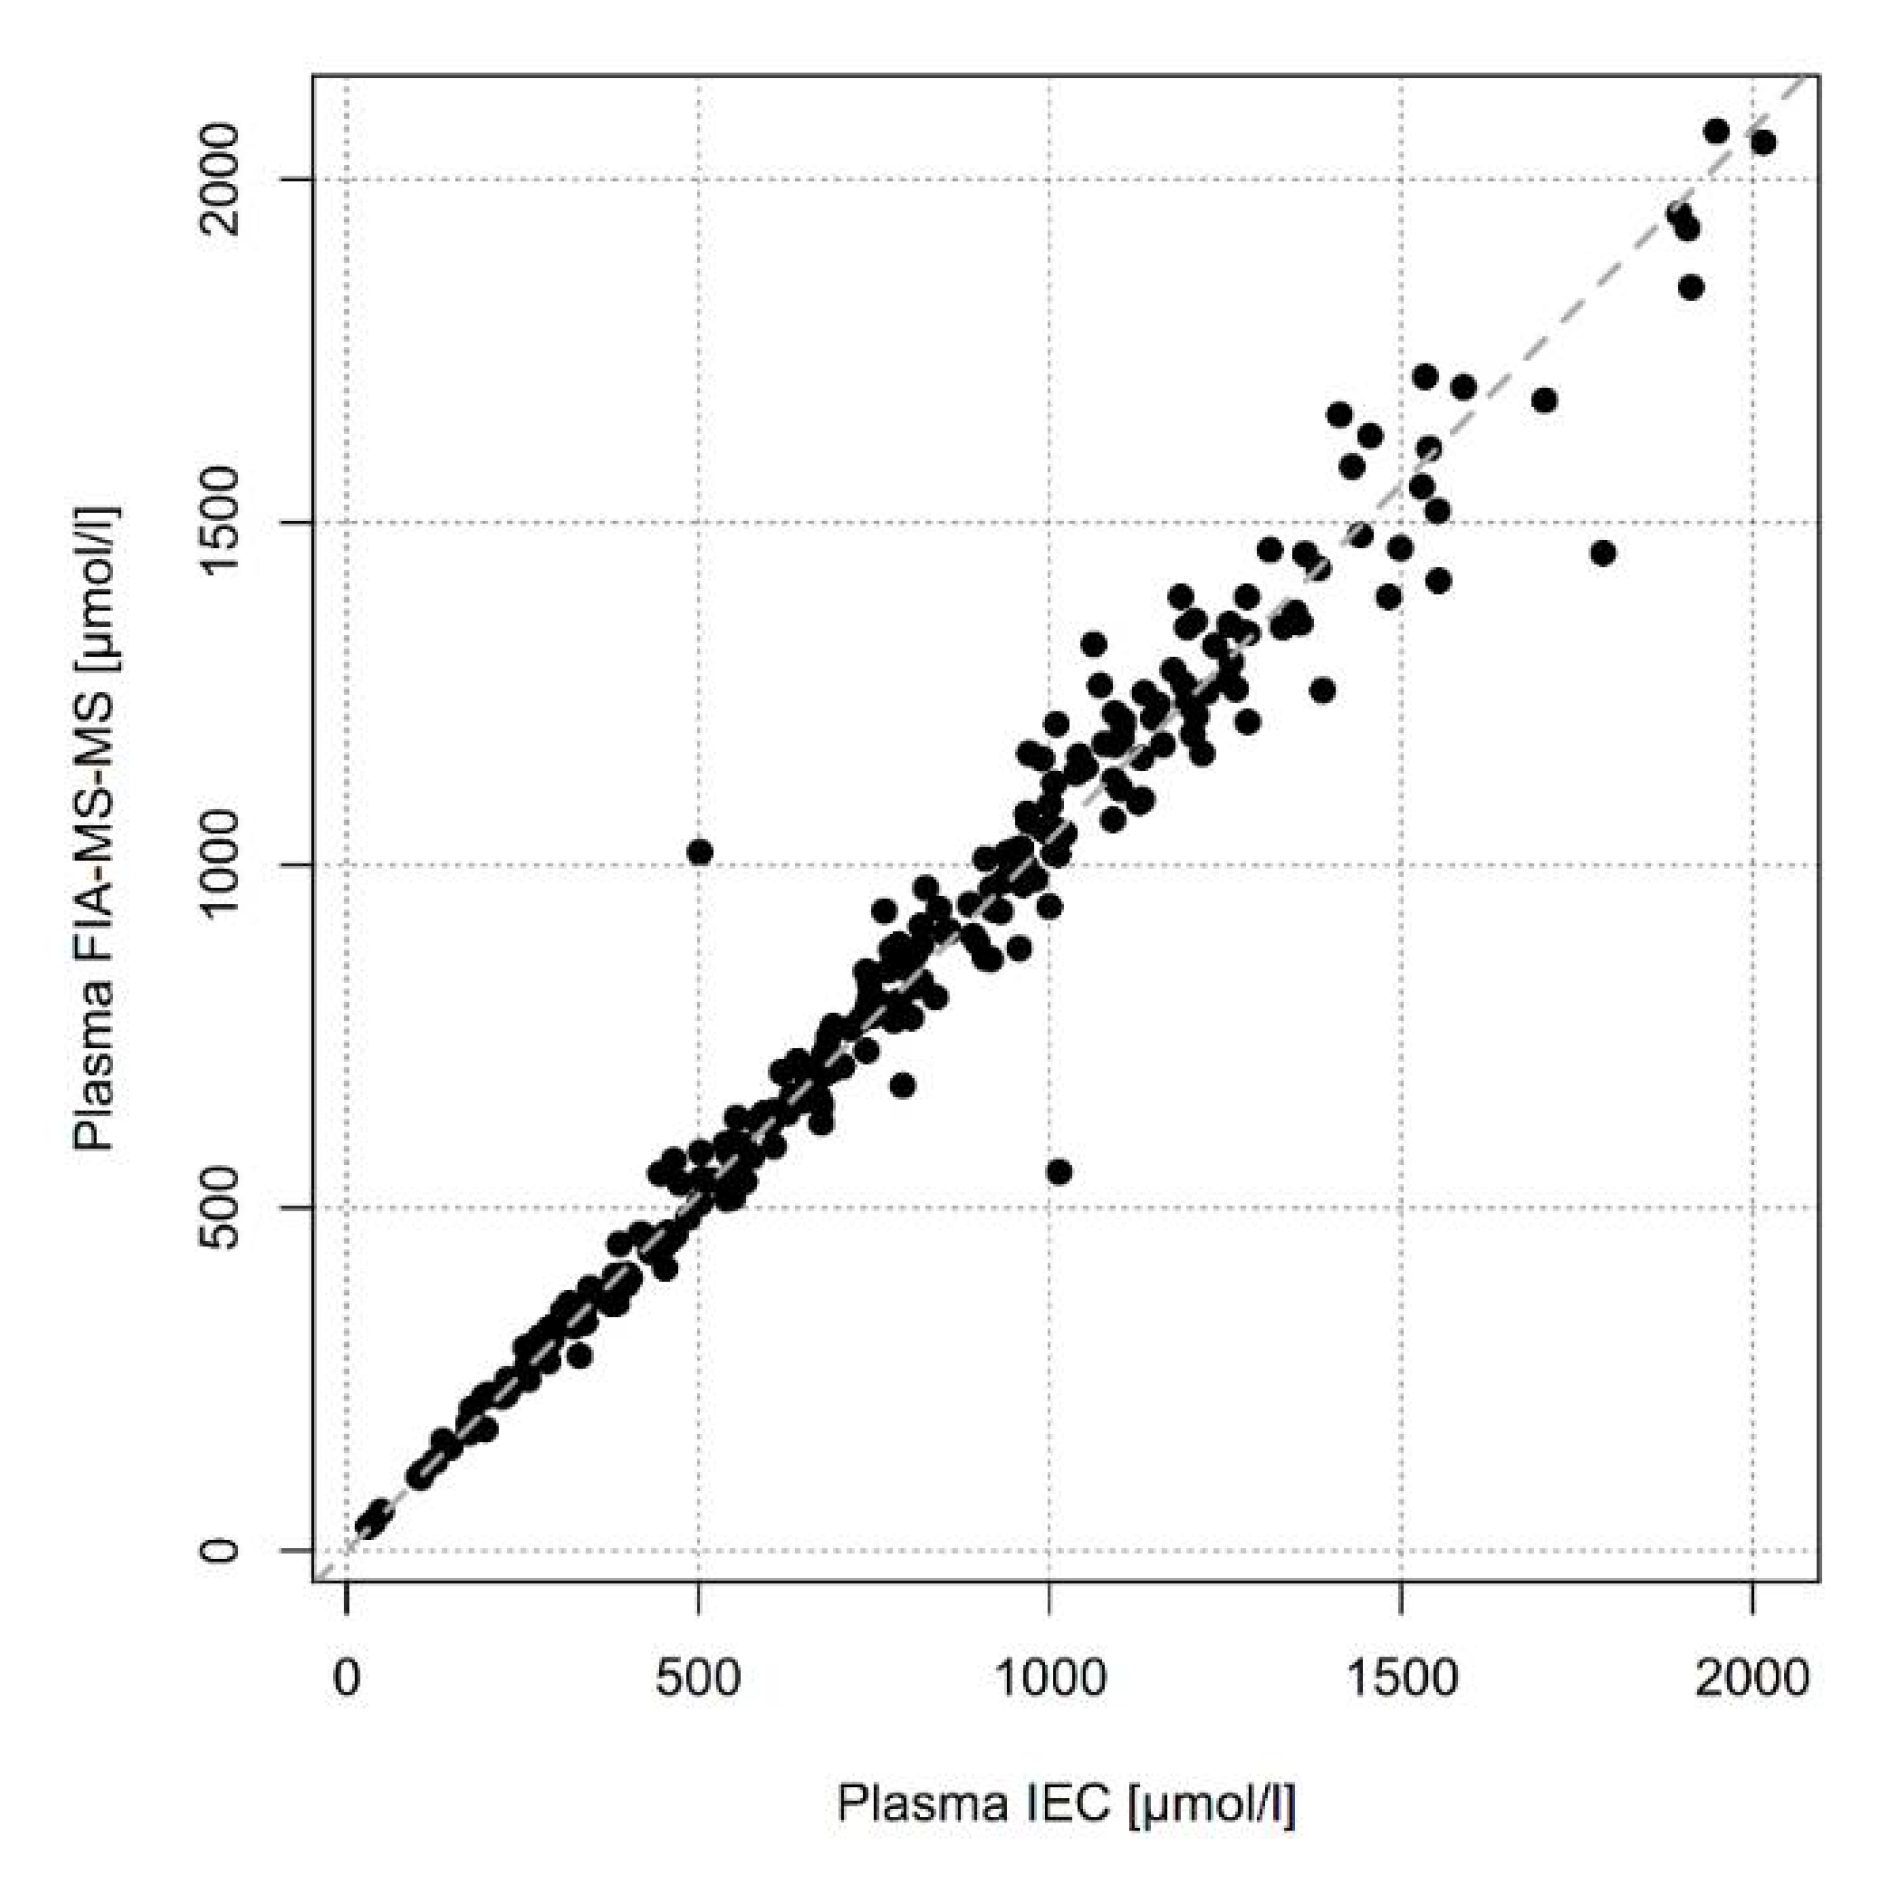
Abstract
:1. Introduction
2. Results
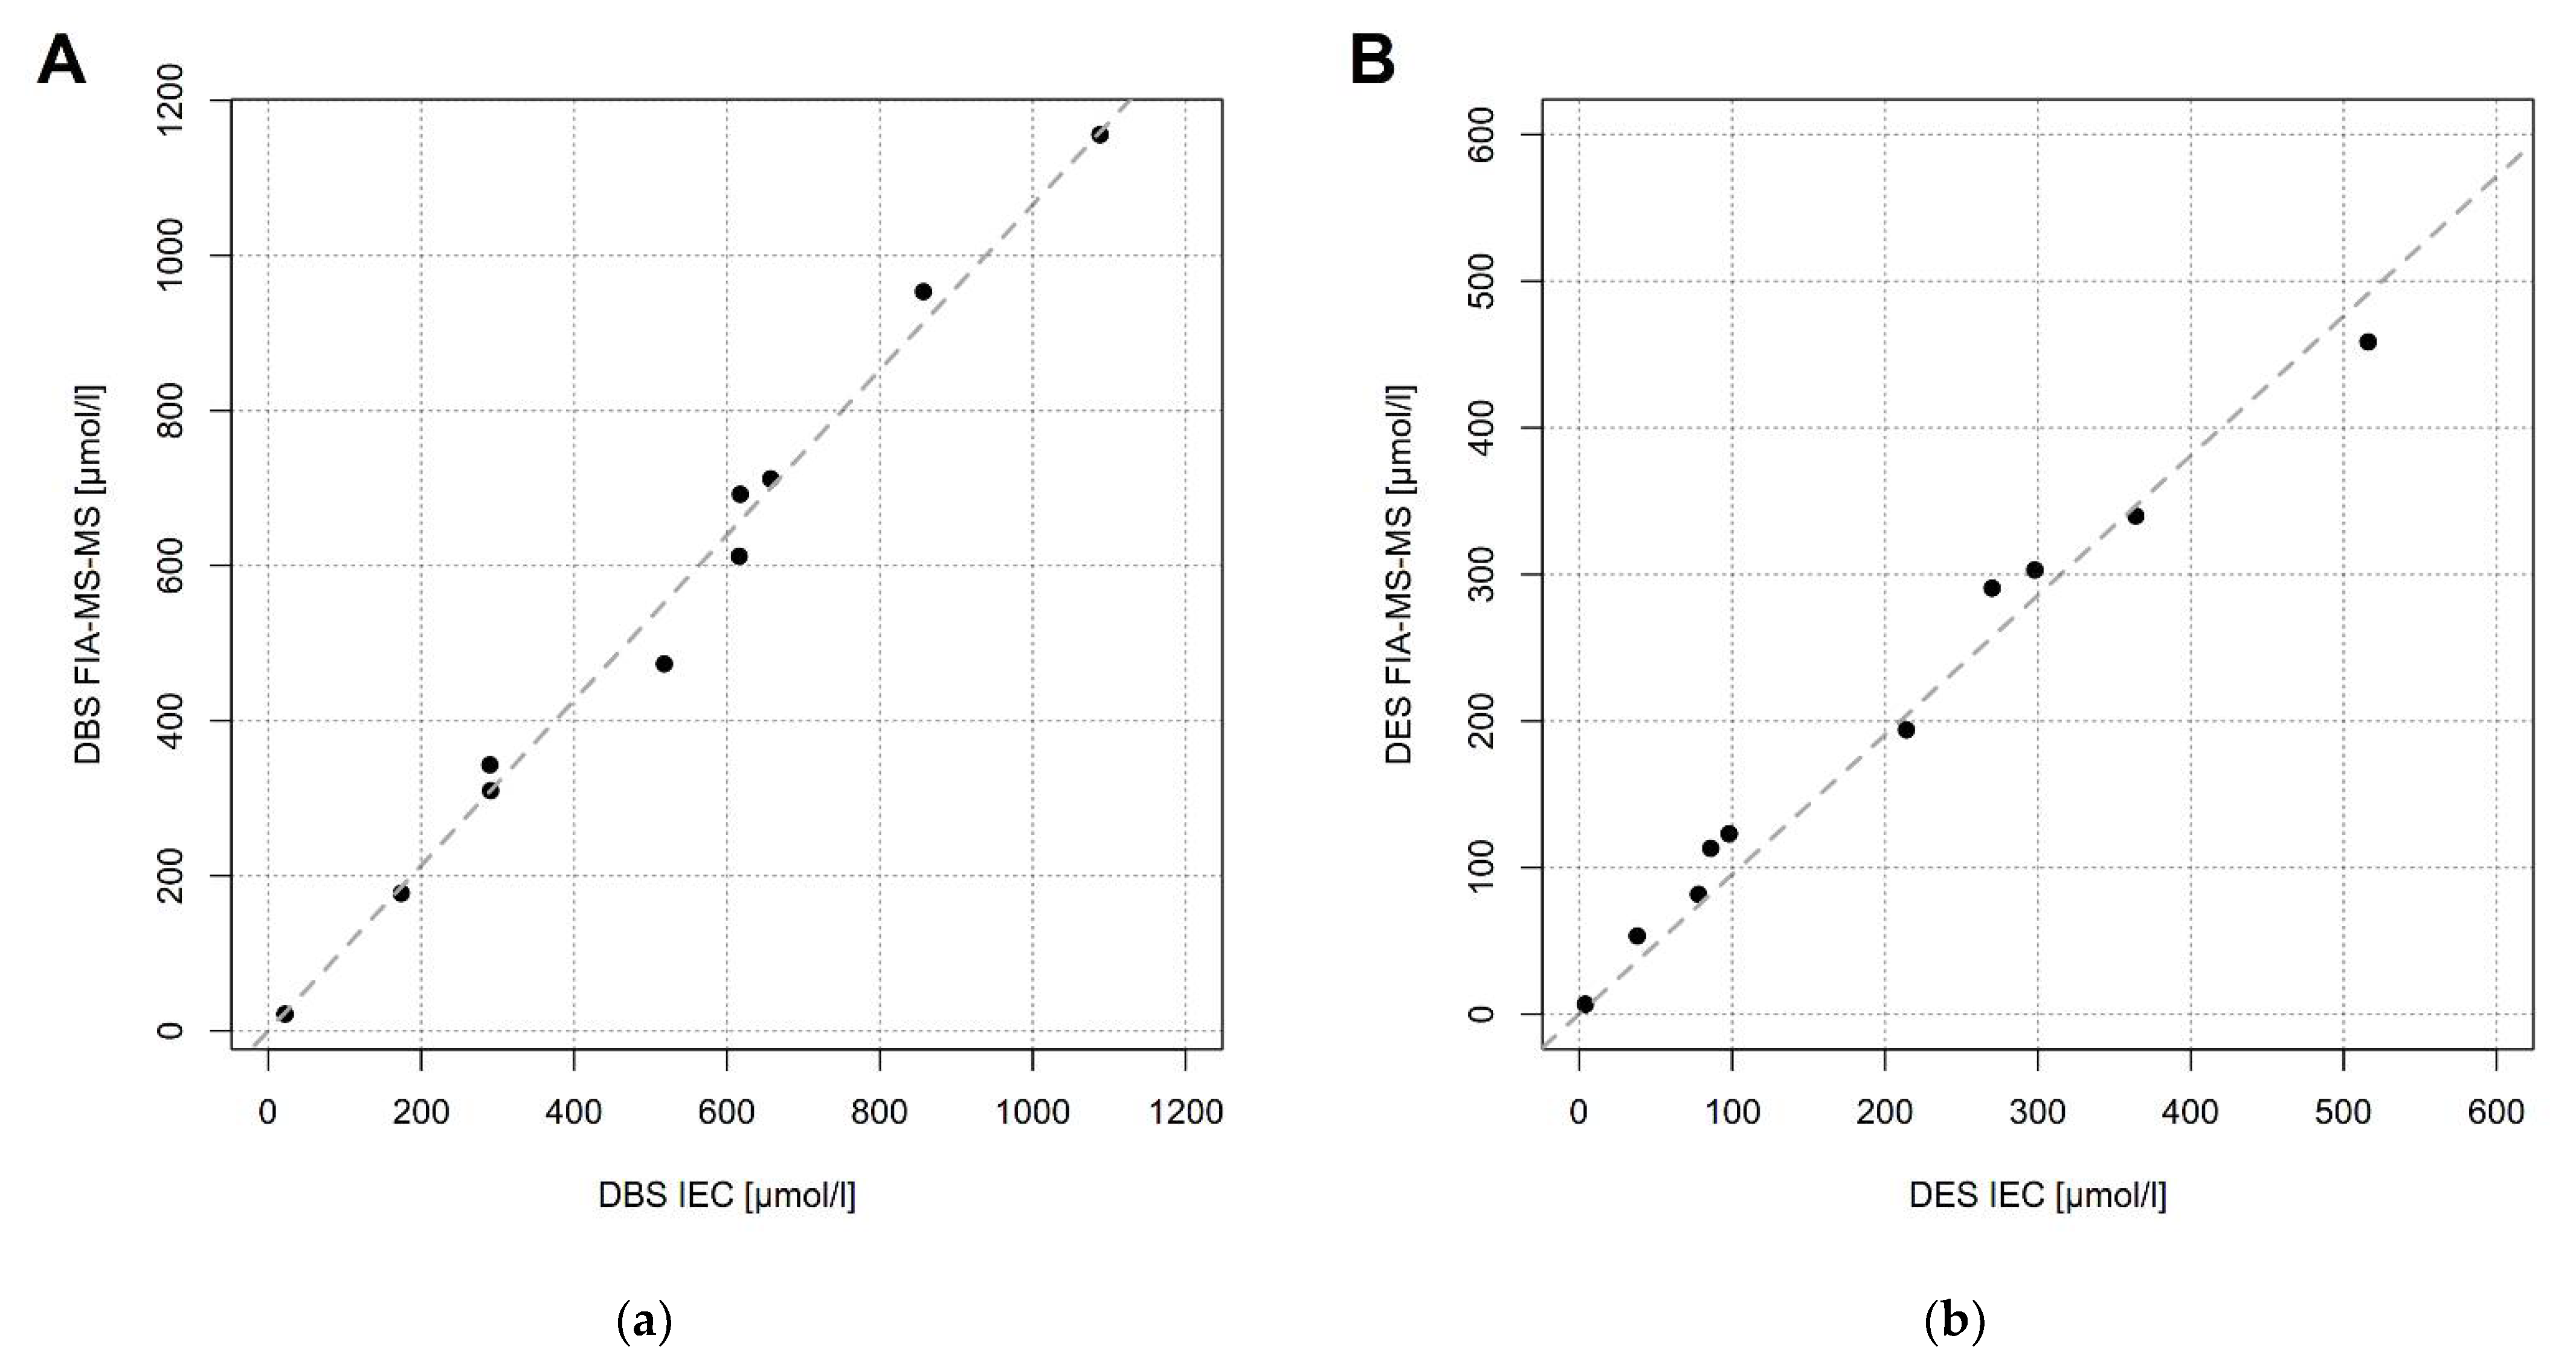
2.1. Comparison of Methods (IEC and FIA-MS-MS)
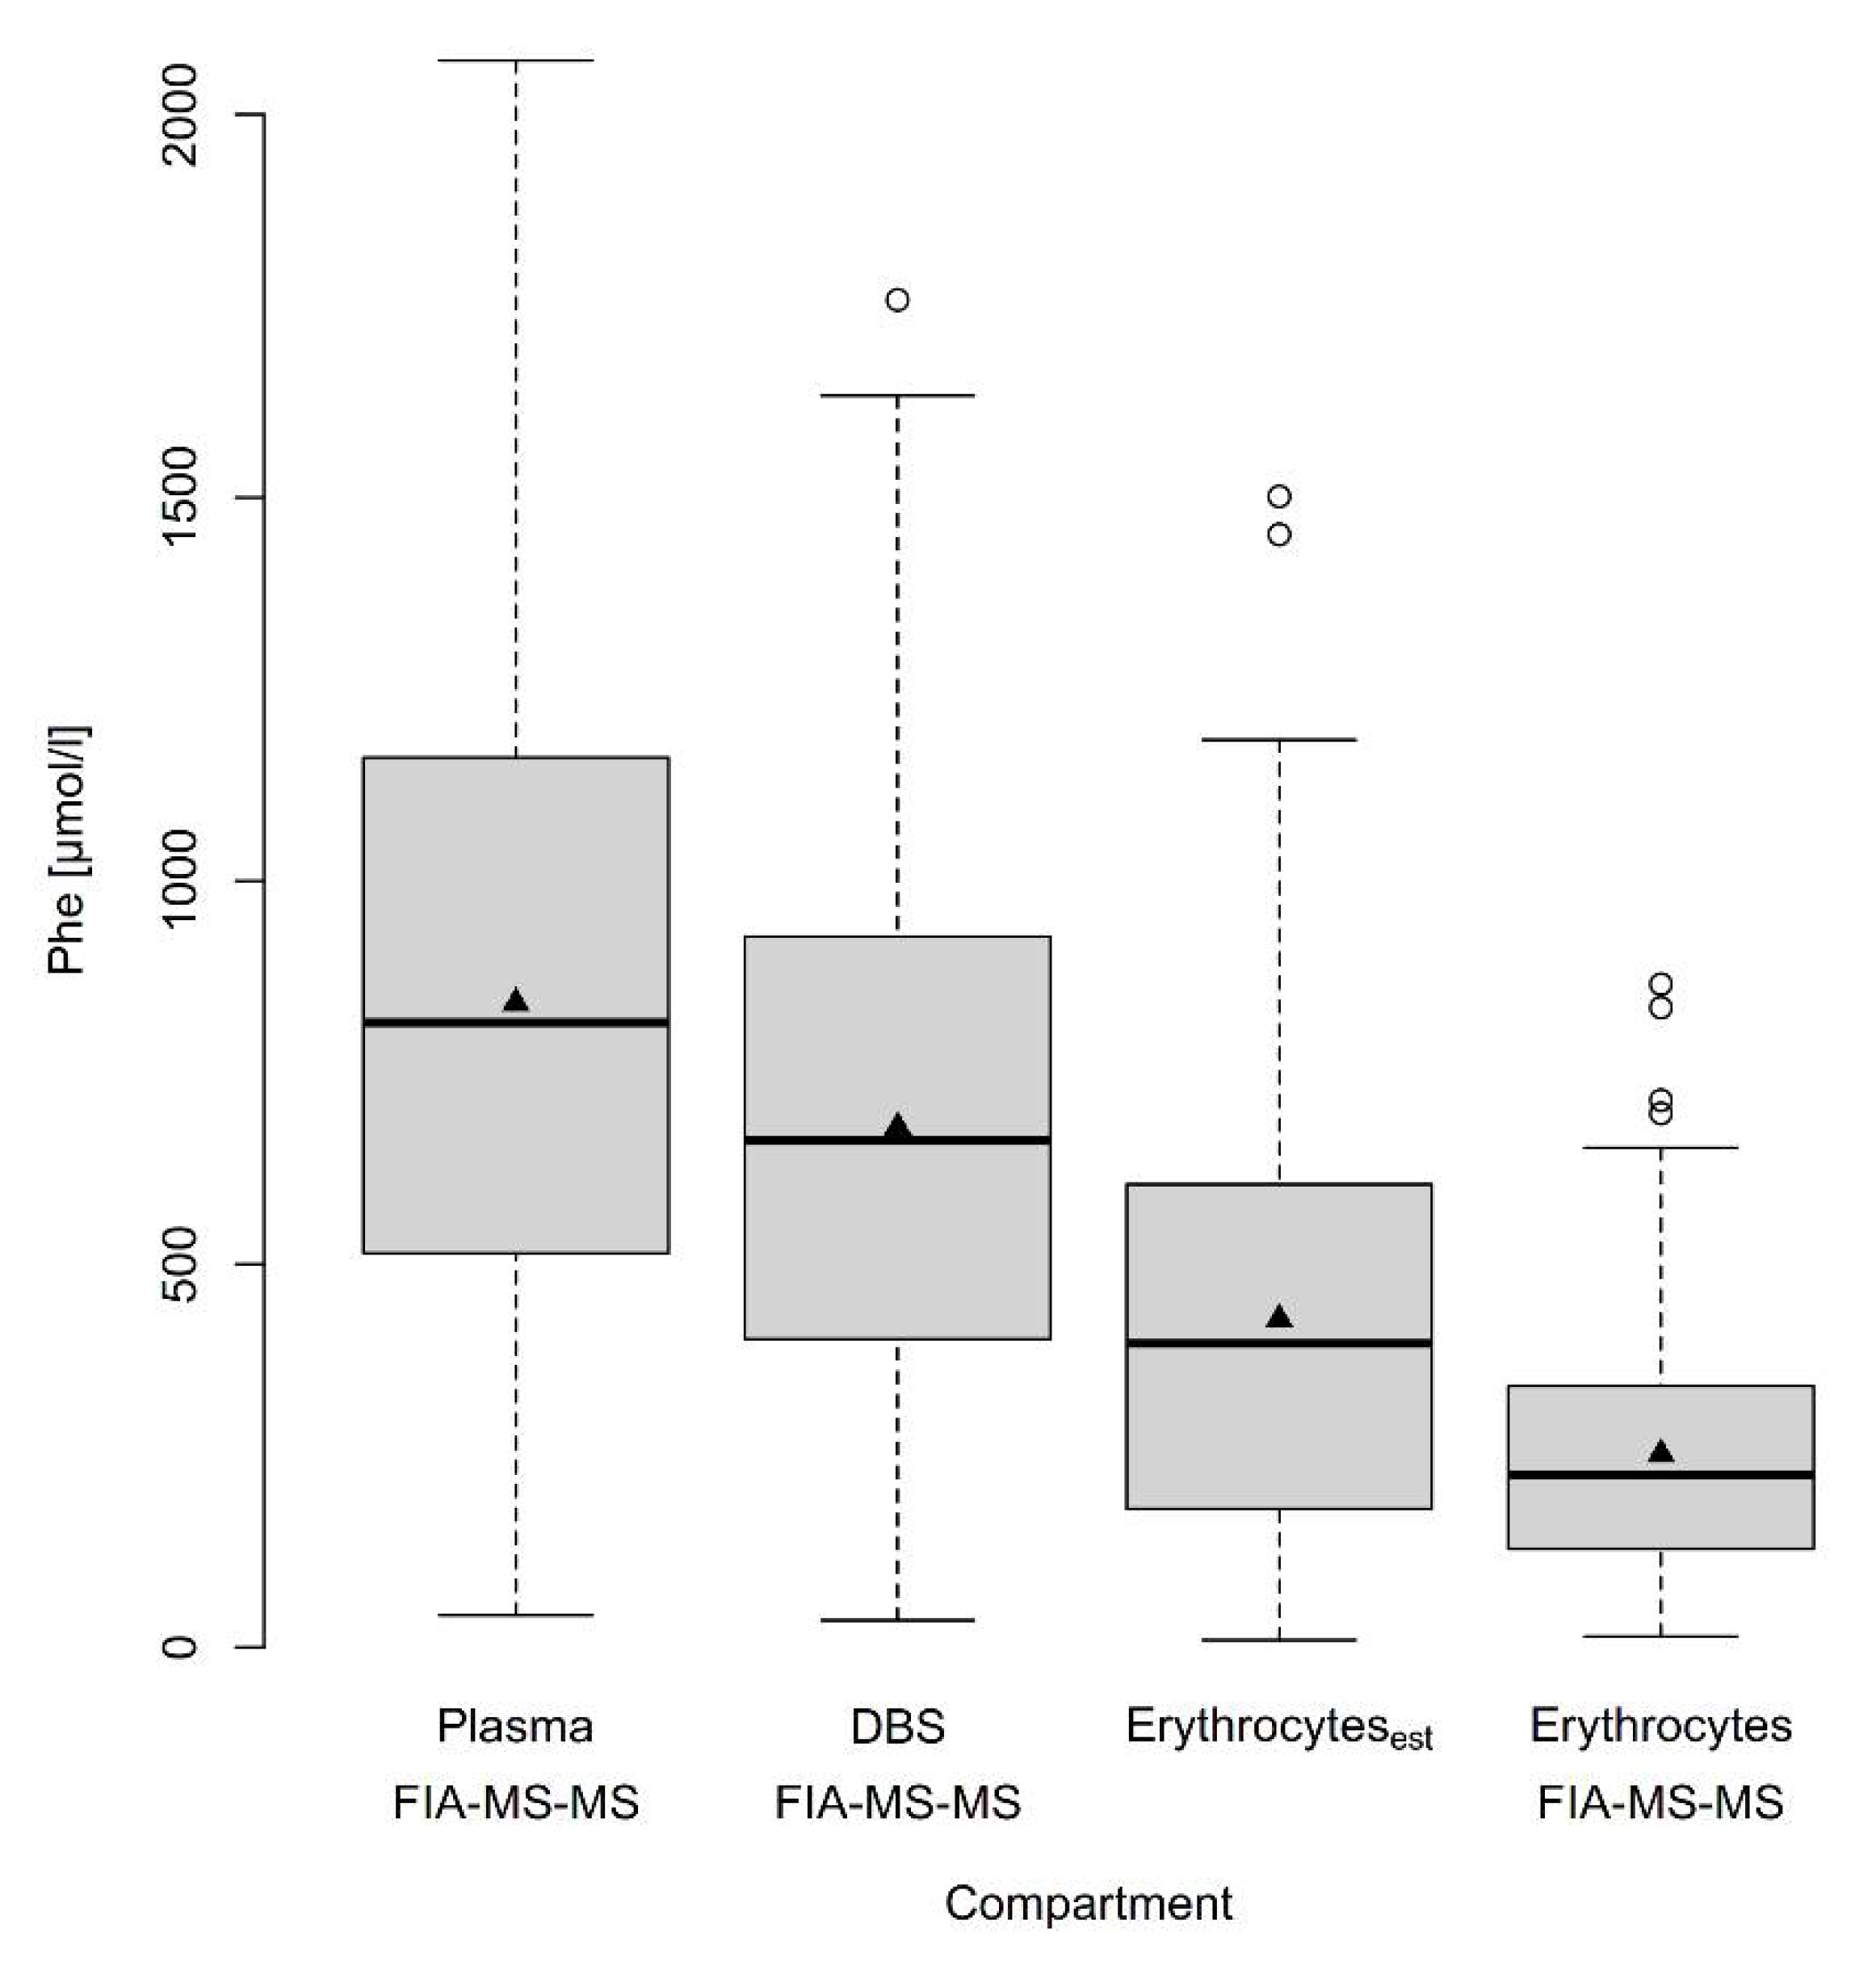
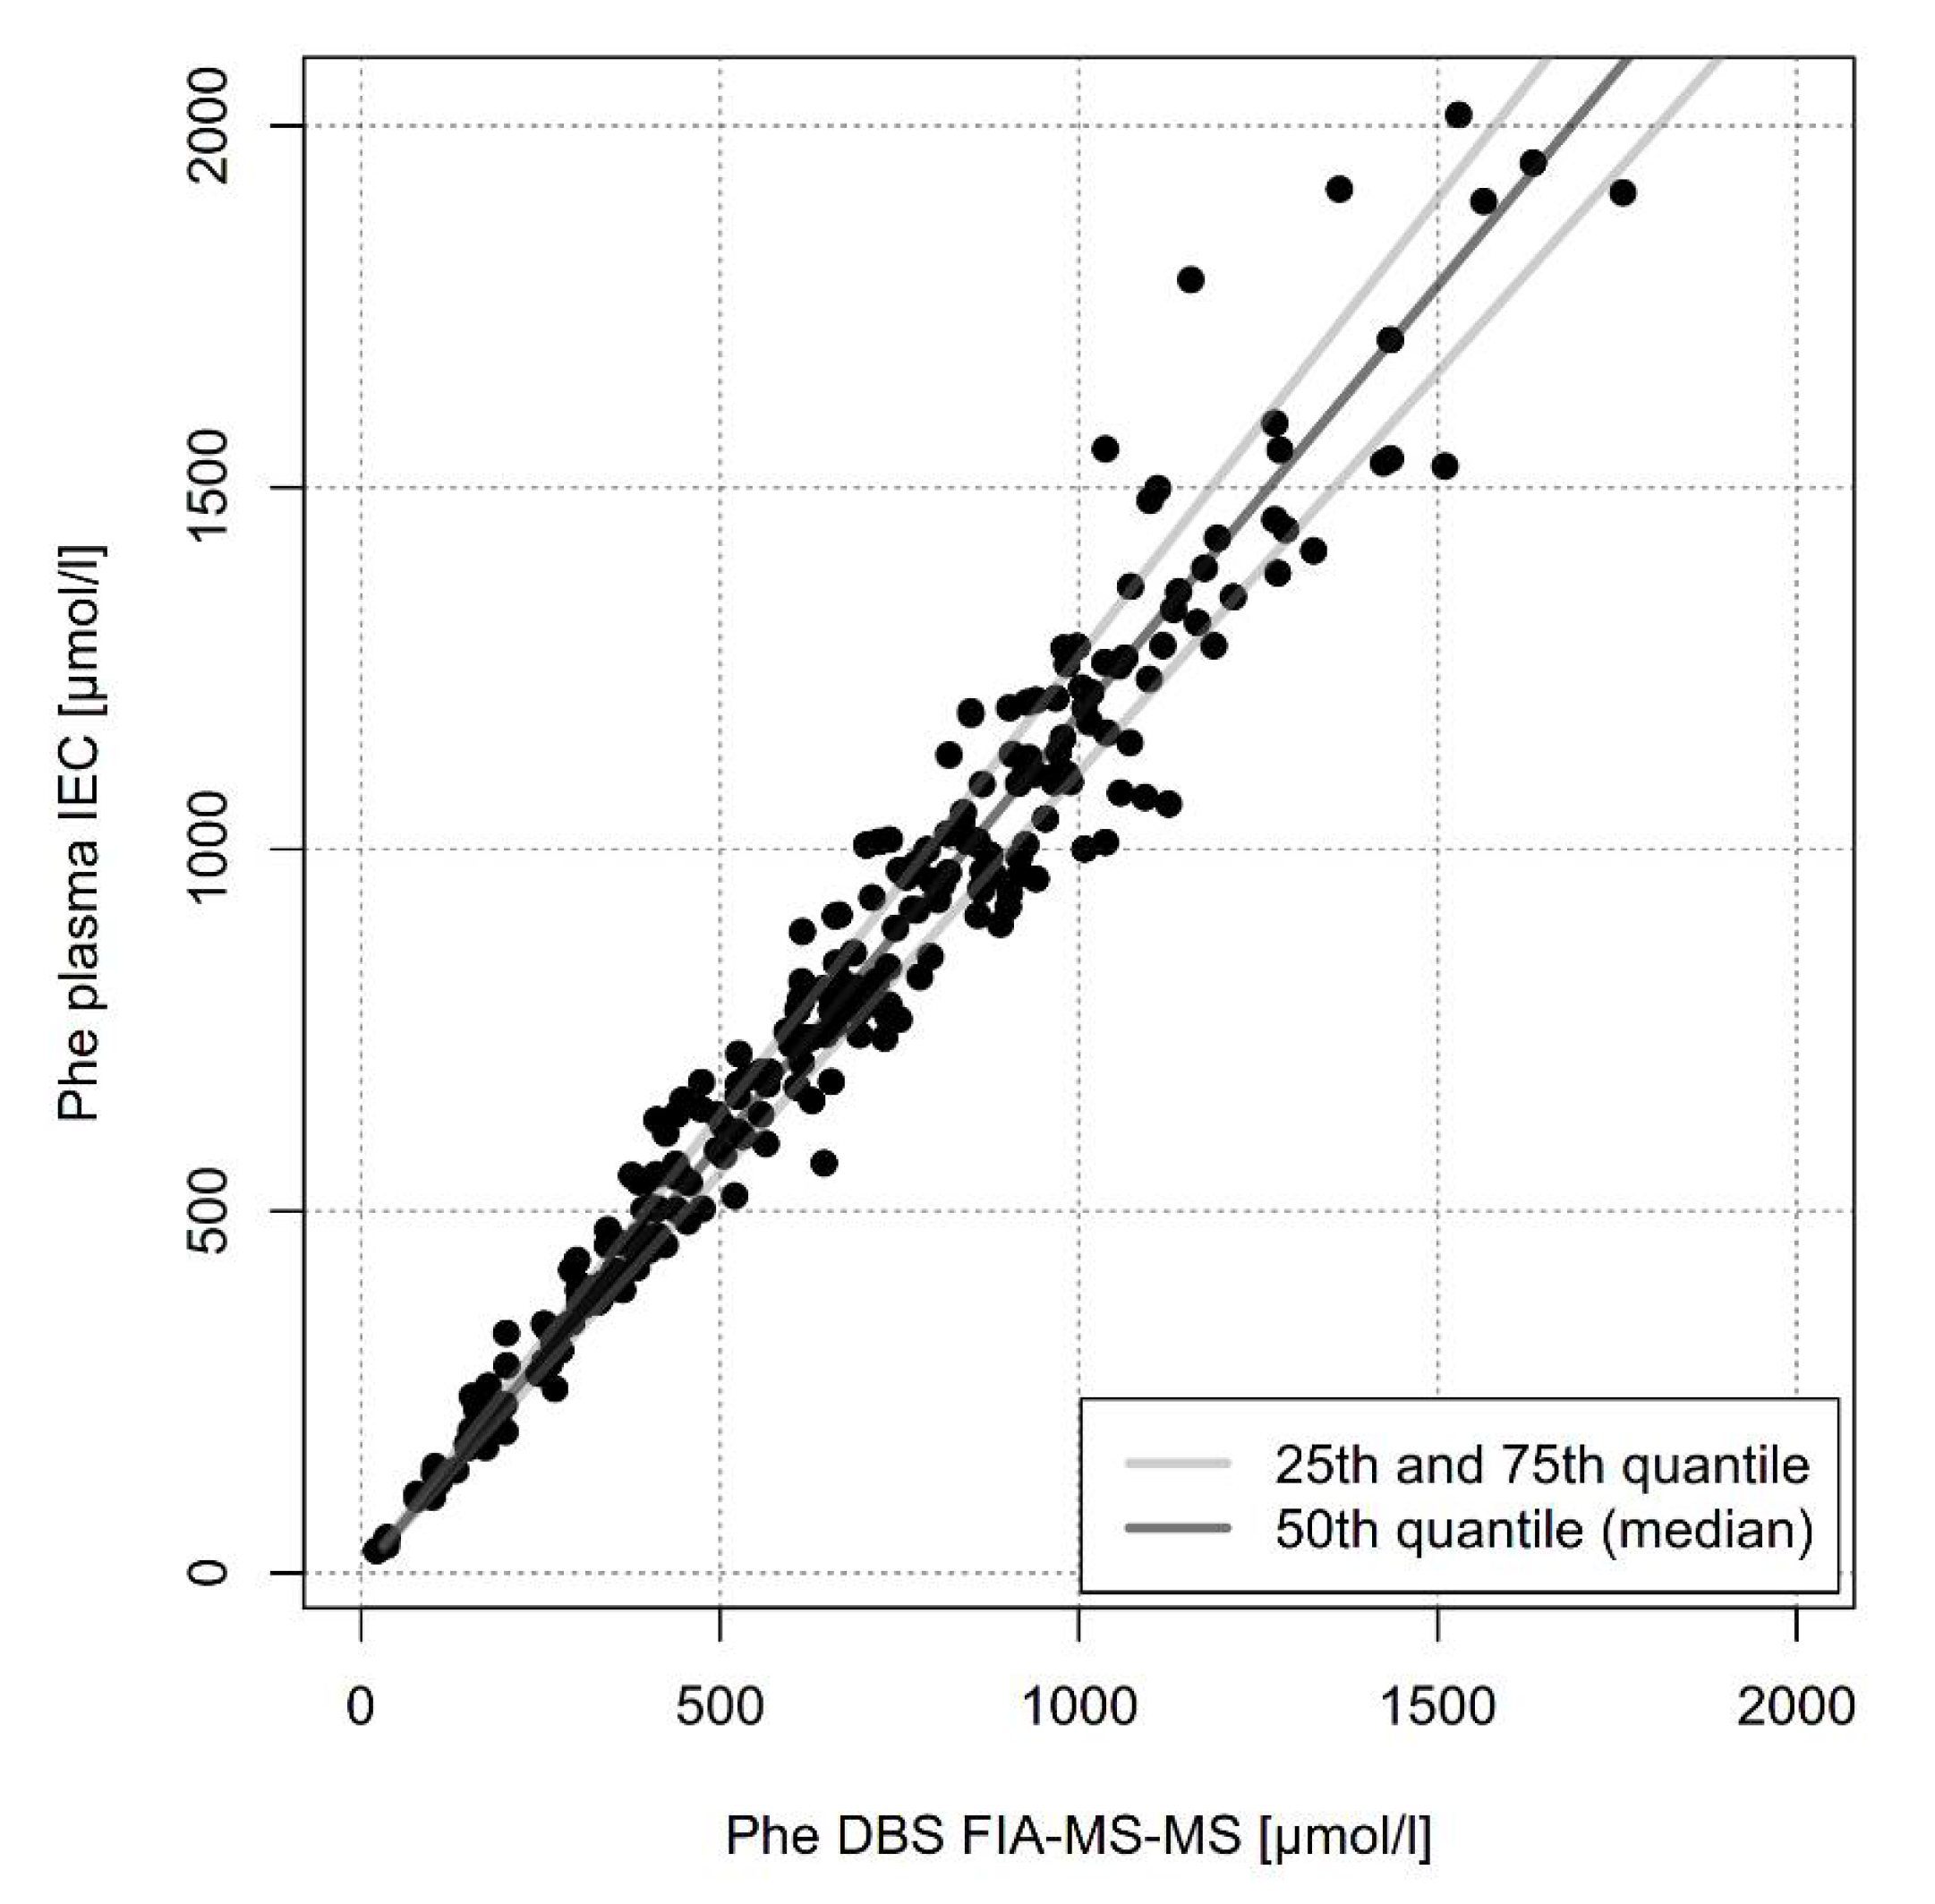
2.2. Comparison of Phe Concentrations in Different Blood Compartments by One Method
3. Discussion
4. Materials and Methods
4.1. Subjects
4.2. Measurement of Phenylalanine in Dried Blood, Dried Erythrocytes and Dried Plasma Using FIA-MS/MS
4.3. Measurement of Phenylalanine in Dried Blood, Dried Erythrocytes and Liquid Plasma Using Ion Exchange Chromatography (IEC)
4.4. Measurement of Hematocrit
4.5. Statistical Analysis
5. Conclusions
Supplementary Materials
Author Contributions
Funding
Institutional Review Board Statement
Informed Consent Statement
Data Availability Statement
Acknowledgments
Conflicts of Interest
References
- Blau, N.; van Spronsen, F.J.; Levy, H.L. Phenylketonuria. Lancet 2010, 376, 1417–1427. [Google Scholar] [CrossRef]
- Blau, N.; MacDonald, A.; van Spronsen, F. There is no doubt that the early identification of PKU and prompt and continuous intervention prevents mental retardation in most patients. Mol. Genet. Metab. 2011, 104 (Suppl. 1), S1. [Google Scholar] [CrossRef] [PubMed]
- Singh, R.H.; Rohr, F.; Frazier, D.; Cunningham, A.; Mofidi, S.; Ogata, B.; Splett, P.L.; Moseley, K.; Huntington, K.; Acosta, P.B.; et al. Recommendations for the nutrition management of phenylalanine hydroxylase deficiency. Genet. Med. Off. J. Am. Coll. Med. Genet. 2014, 16, 121–131. [Google Scholar] [CrossRef] [Green Version]
- Groselj, U.; Murko, S.; Zerjav Tansek, M.; Kovac, J.; Trampus Bakija, A.; Repic Lampret, B.; Battelino, T. Comparison of tandem mass spectrometry and amino acid analyzer for phenylalanine and tyrosine monitoring--implications for clinical management of patients with hyperphenylalaninemia. Clin. Biochem. 2015, 48, 14–18. [Google Scholar] [CrossRef] [PubMed]
- Stroup, B.M.; Held, P.K.; Williams, P.; Clayton, M.K.; Murali, S.G.; Rice, G.M.; Ney, D.M. Clinical relevance of the discrepancy in phenylalanine concentrations analyzed using tandem mass spectrometry compared with ion-exchange chromatography in phenylketonuria. Mol. Genet. Metab. Rep. 2016, 6, 21–26. [Google Scholar] [CrossRef]
- van Vliet, K.; van Ginkel, W.G.; van Dam, E.; de Blaauw, P.; Koehorst, M.; Kingma, H.A.; van Spronsen, F.J.; Heiner-Fokkema, M.R. Dried blood spot versus venous blood sampling for phenylalanine and tyrosine. Orphanet J. Rare Dis. 2020, 15, 82. [Google Scholar] [CrossRef] [PubMed]
- Moat, S.J.; Schulenburg-Brand, D.; Lemonde, H.; Bonham, J.R.; Weykamp, C.W.; Mei, J.V.; Shortland, G.S.; Carling, R.S. Performance of laboratory tests used to measure blood phenylalanine for the monitoring of patients with phenylketonuria. J. Inherit. Metab. Dis. 2020, 43, 179–188. [Google Scholar] [CrossRef] [PubMed]
- van Spronsen, F.J.; van Wegberg, A.M.; Ahring, K.; Belanger-Quintana, A.; Blau, N.; Bosch, A.M.; Burlina, A.; Campistol, J.; Feillet, F.; Gizewska, M.; et al. Key European guidelines for the diagnosis and management of patients with phenylketonuria. Lancet Diabetes Endocrinol. 2017, 5, 743–756. [Google Scholar] [CrossRef] [Green Version]
- Vockley, J.; Andersson, H.C.; Antshel, K.M.; Braverman, N.E.; Burton, B.K.; Frazier, D.M.; Mitchell, J.; Smith, W.E.; Thompson, B.H.; Berry, S.A.; et al. Phenylalanine hydroxylase deficiency: Diagnosis and management guideline. Genet. Med. Off. J. Am. Coll. Med. Genet. 2014, 16, 188–200. [Google Scholar] [CrossRef] [Green Version]
- Hagenfeldt, L.; Arvidsson, A. The distribution of amino acids between plasma and erythrocytes. Clin. Chim. Acta Int. J. Clin. Chem. 1980, 100, 133–141. [Google Scholar] [CrossRef]
- Gregory, C.O.; Yu, C.; Singh, R.H. Blood phenylalanine monitoring for dietary compliance among patients with phenylketonuria: Comparison of methods. Genet. Med. Off. J. Am. Coll. Med. Genet. 2007, 9, 761–765. [Google Scholar] [CrossRef] [Green Version]
- Grunert, S.C.; Brichta, C.M.; Krebs, A.; Clement, H.W.; Rauh, R.; Fleischhaker, C.; Hennighausen, K.; Sass, J.O.; Schwab, K.O. Diurnal variation of phenylalanine and tyrosine concentrations in adult patients with phenylketonuria: Subcutaneous microdialysis is no adequate tool for the determination of amino acid concentrations. Nutr. J. 2013, 12, 60. [Google Scholar] [CrossRef] [PubMed] [Green Version]
- Zori, R.; Thomas, J.A.; Shur, N.; Rizzo, W.B.; Decker, C.; Rosen, O.; Li, M.; Schweighardt, B.; Larimore, K.; Longo, N. Induction, titration, and maintenance dosing regimen in a phase 2 study of pegvaliase for control of blood phenylalanine in adults with phenylketonuria. Mol. Genet. Metab. 2018, 125, 217–227. [Google Scholar] [CrossRef] [PubMed]
- Longo, N.; Zori, R.; Wasserstein, M.P.; Vockley, J.; Burton, B.K.; Decker, C.; Li, M.; Lau, K.; Jiang, J.; Larimore, K.; et al. Long-term safety and efficacy of pegvaliase for the treatment of phenylketonuria in adults: Combined phase 2 outcomes through PAL-003 extension study. Orphanet J. Rare Dis. 2018, 13, 108. [Google Scholar] [CrossRef] [PubMed] [Green Version]
- Longo, N.; Dimmock, D.; Levy, H.; Viau, K.; Bausell, H.; Bilder, D.A.; Burton, B.; Gross, C.; Northrup, H.; Rohr, F.; et al. Evidence- and consensus-based recommendations for the use of pegvaliase in adults with phenylketonuria. Genet. Med. Off. J. Am. Coll. Med. Genet. 2019, 21, 1851–1867. [Google Scholar] [CrossRef] [PubMed] [Green Version]


Publisher’s Note: MDPI stays neutral with regard to jurisdictional claims in published maps and institutional affiliations. |
© 2021 by the authors. Licensee MDPI, Basel, Switzerland. This article is an open access article distributed under the terms and conditions of the Creative Commons Attribution (CC BY) license (https://creativecommons.org/licenses/by/4.0/).
Share and Cite
Haas, D.; Hauke, J.; Schwarz, K.V.; Consalvi, L.; Trefz, F.K.; Blau, N.; Hoffmann, G.F.; Burgard, P.; Garbade, S.F.; Okun, J.G. Differences of Phenylalanine Concentrations in Dried Blood Spots and in Plasma: Erythrocytes as a Neglected Component for This Observation. Metabolites 2021, 11, 680. https://doi.org/10.3390/metabo11100680
Haas D, Hauke J, Schwarz KV, Consalvi L, Trefz FK, Blau N, Hoffmann GF, Burgard P, Garbade SF, Okun JG. Differences of Phenylalanine Concentrations in Dried Blood Spots and in Plasma: Erythrocytes as a Neglected Component for This Observation. Metabolites. 2021; 11(10):680. https://doi.org/10.3390/metabo11100680
Chicago/Turabian StyleHaas, Dorothea, Jana Hauke, Kathrin V. Schwarz, Lucia Consalvi, Friedrich K. Trefz, Nenad Blau, Georg F. Hoffmann, Peter Burgard, Sven F. Garbade, and Jürgen G. Okun. 2021. "Differences of Phenylalanine Concentrations in Dried Blood Spots and in Plasma: Erythrocytes as a Neglected Component for This Observation" Metabolites 11, no. 10: 680. https://doi.org/10.3390/metabo11100680
APA StyleHaas, D., Hauke, J., Schwarz, K. V., Consalvi, L., Trefz, F. K., Blau, N., Hoffmann, G. F., Burgard, P., Garbade, S. F., & Okun, J. G. (2021). Differences of Phenylalanine Concentrations in Dried Blood Spots and in Plasma: Erythrocytes as a Neglected Component for This Observation. Metabolites, 11(10), 680. https://doi.org/10.3390/metabo11100680