Ethyl Pyruvate Increases Post-Ischemic Levels of Mitochondrial Energy Metabolites: A 13C-Labeled Cerebral Microdialysis Study

 ,
,  ,
,  and
and
Abstract
1. Introduction
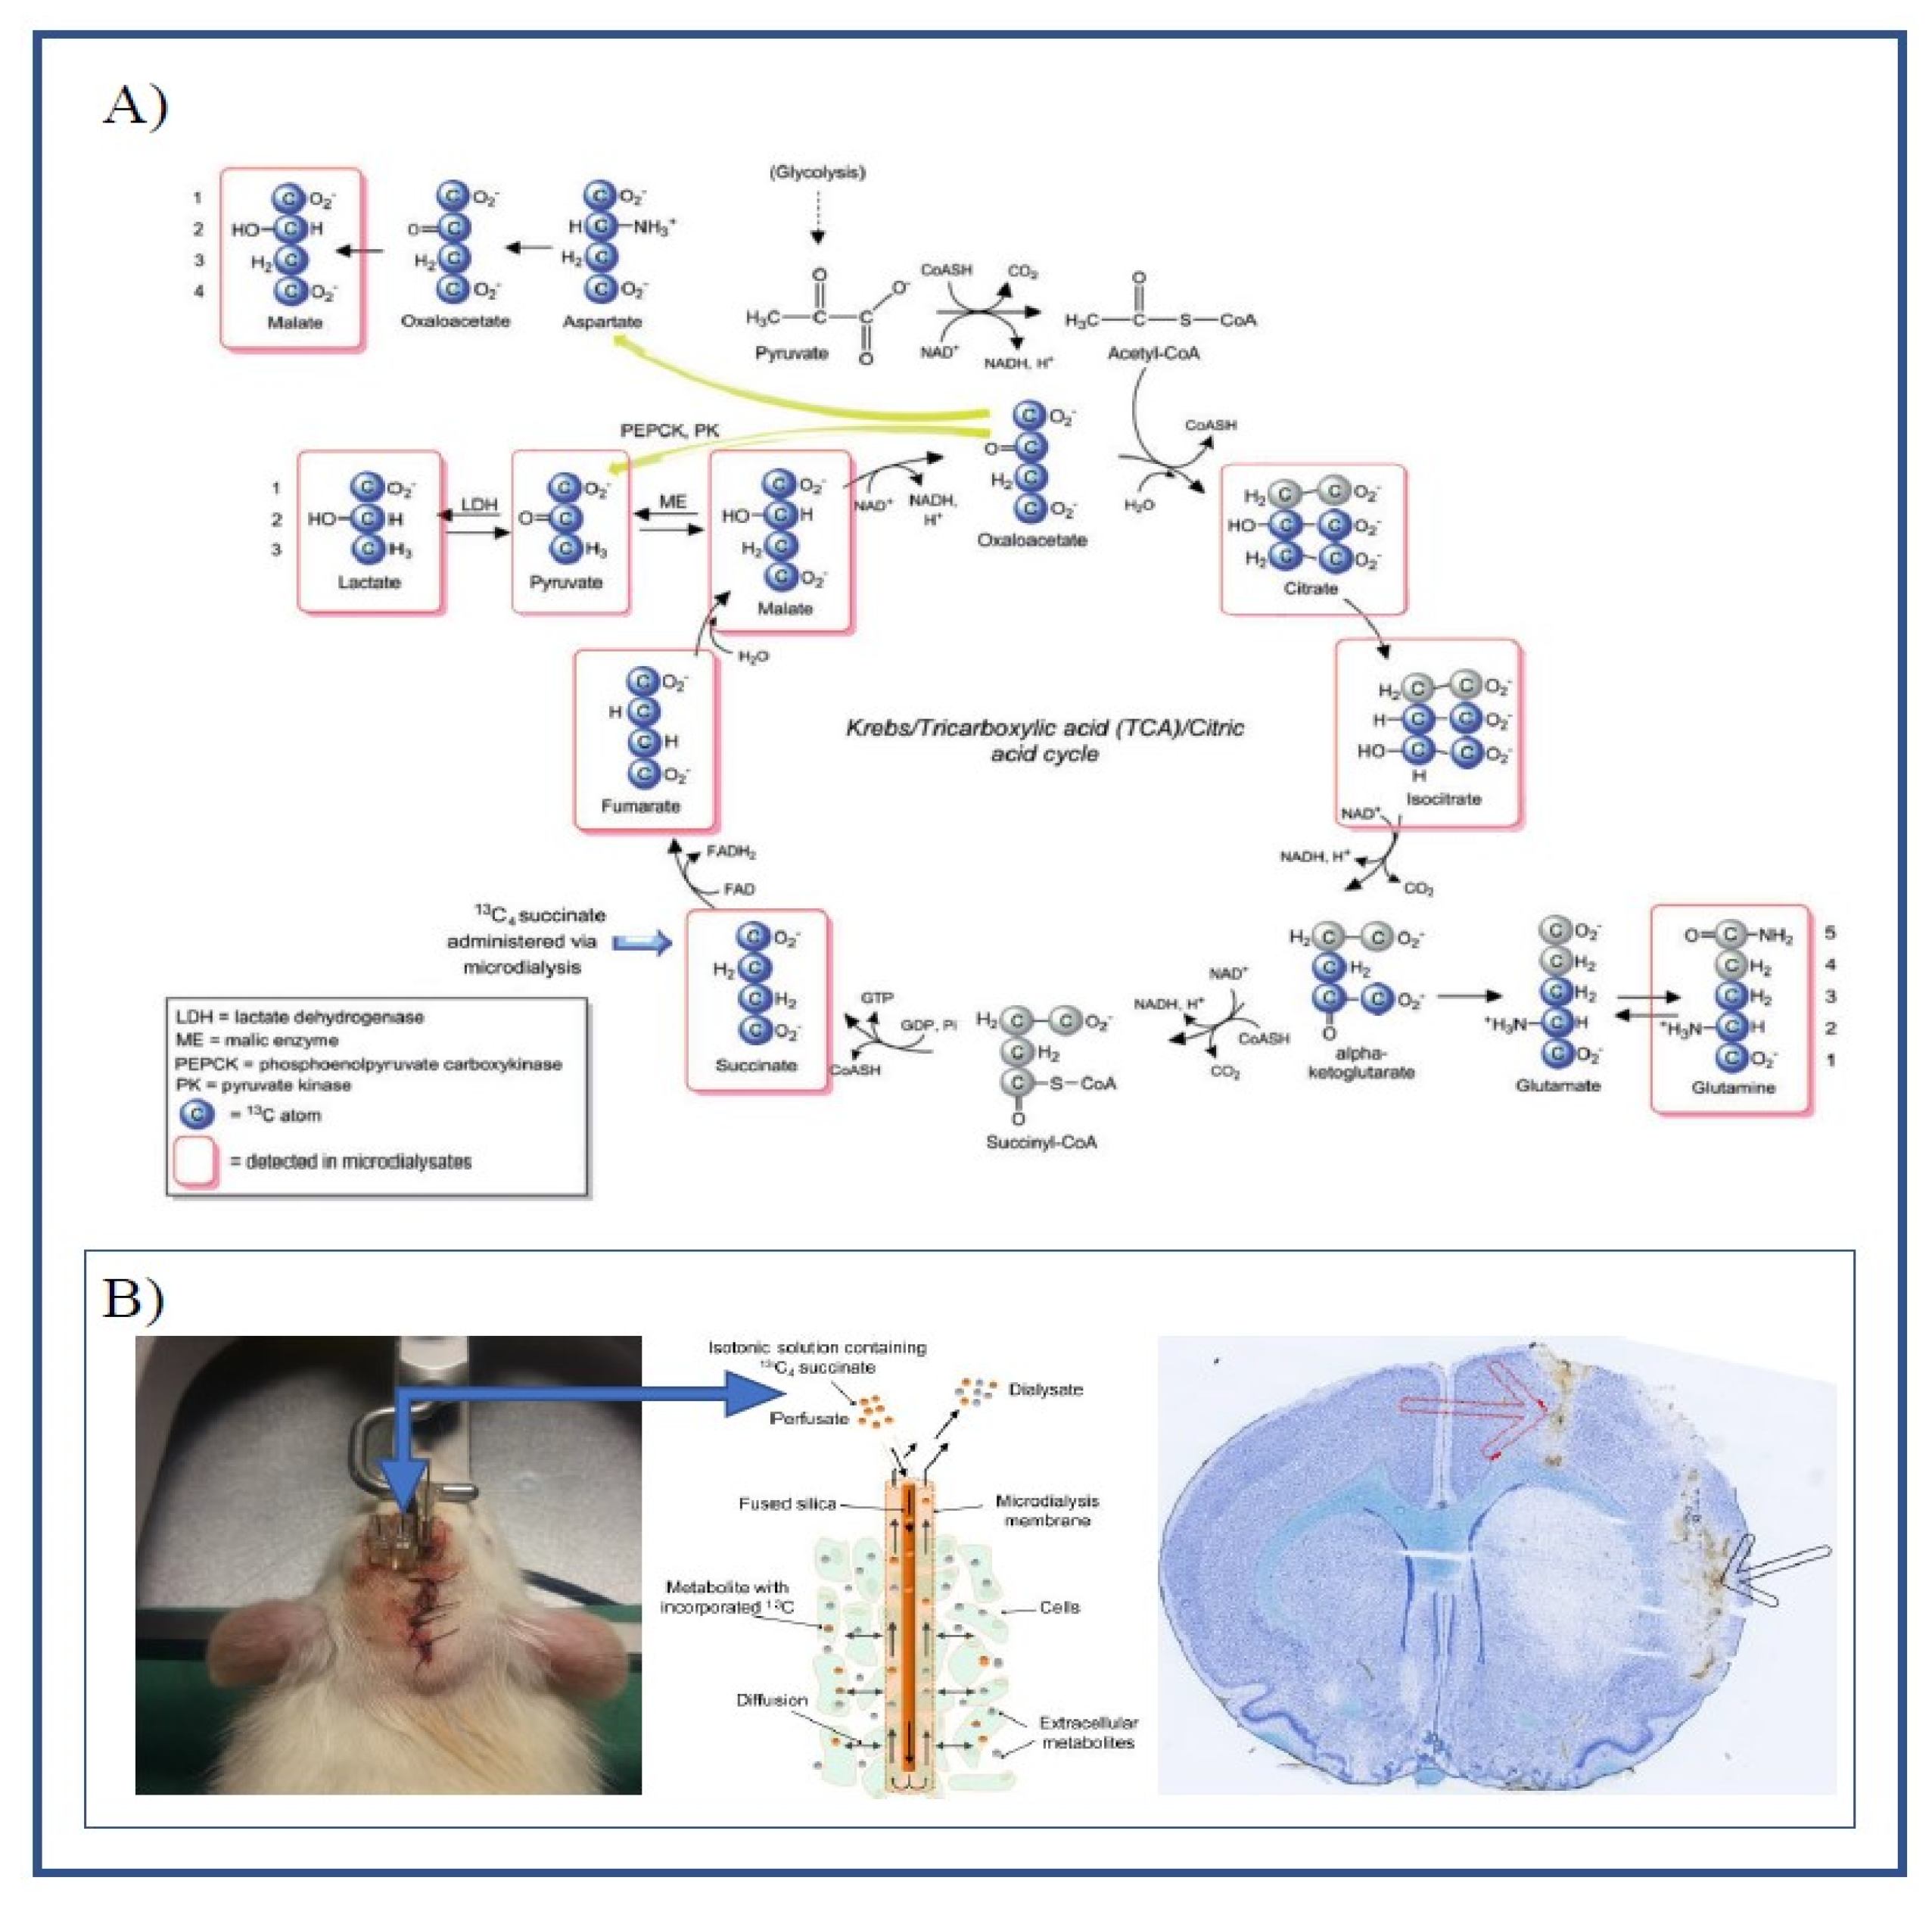
- (a)
- To evaluate microdialysis of TCA metabolites (12C and 13C-labeled) and purine metabolites as tools to study mitochondrial dysfunction in the ET-1 model of cerebral ischemia-reperfusion injury.
- (b)
- To assess whether EP-treatment ameliorates mitochondrial dysfunction (using microdialysis of TCA and purine metabolites) and/or reduces infarct size in the ET-1 rat model.
2. Results
2.1. Labeling Ratio
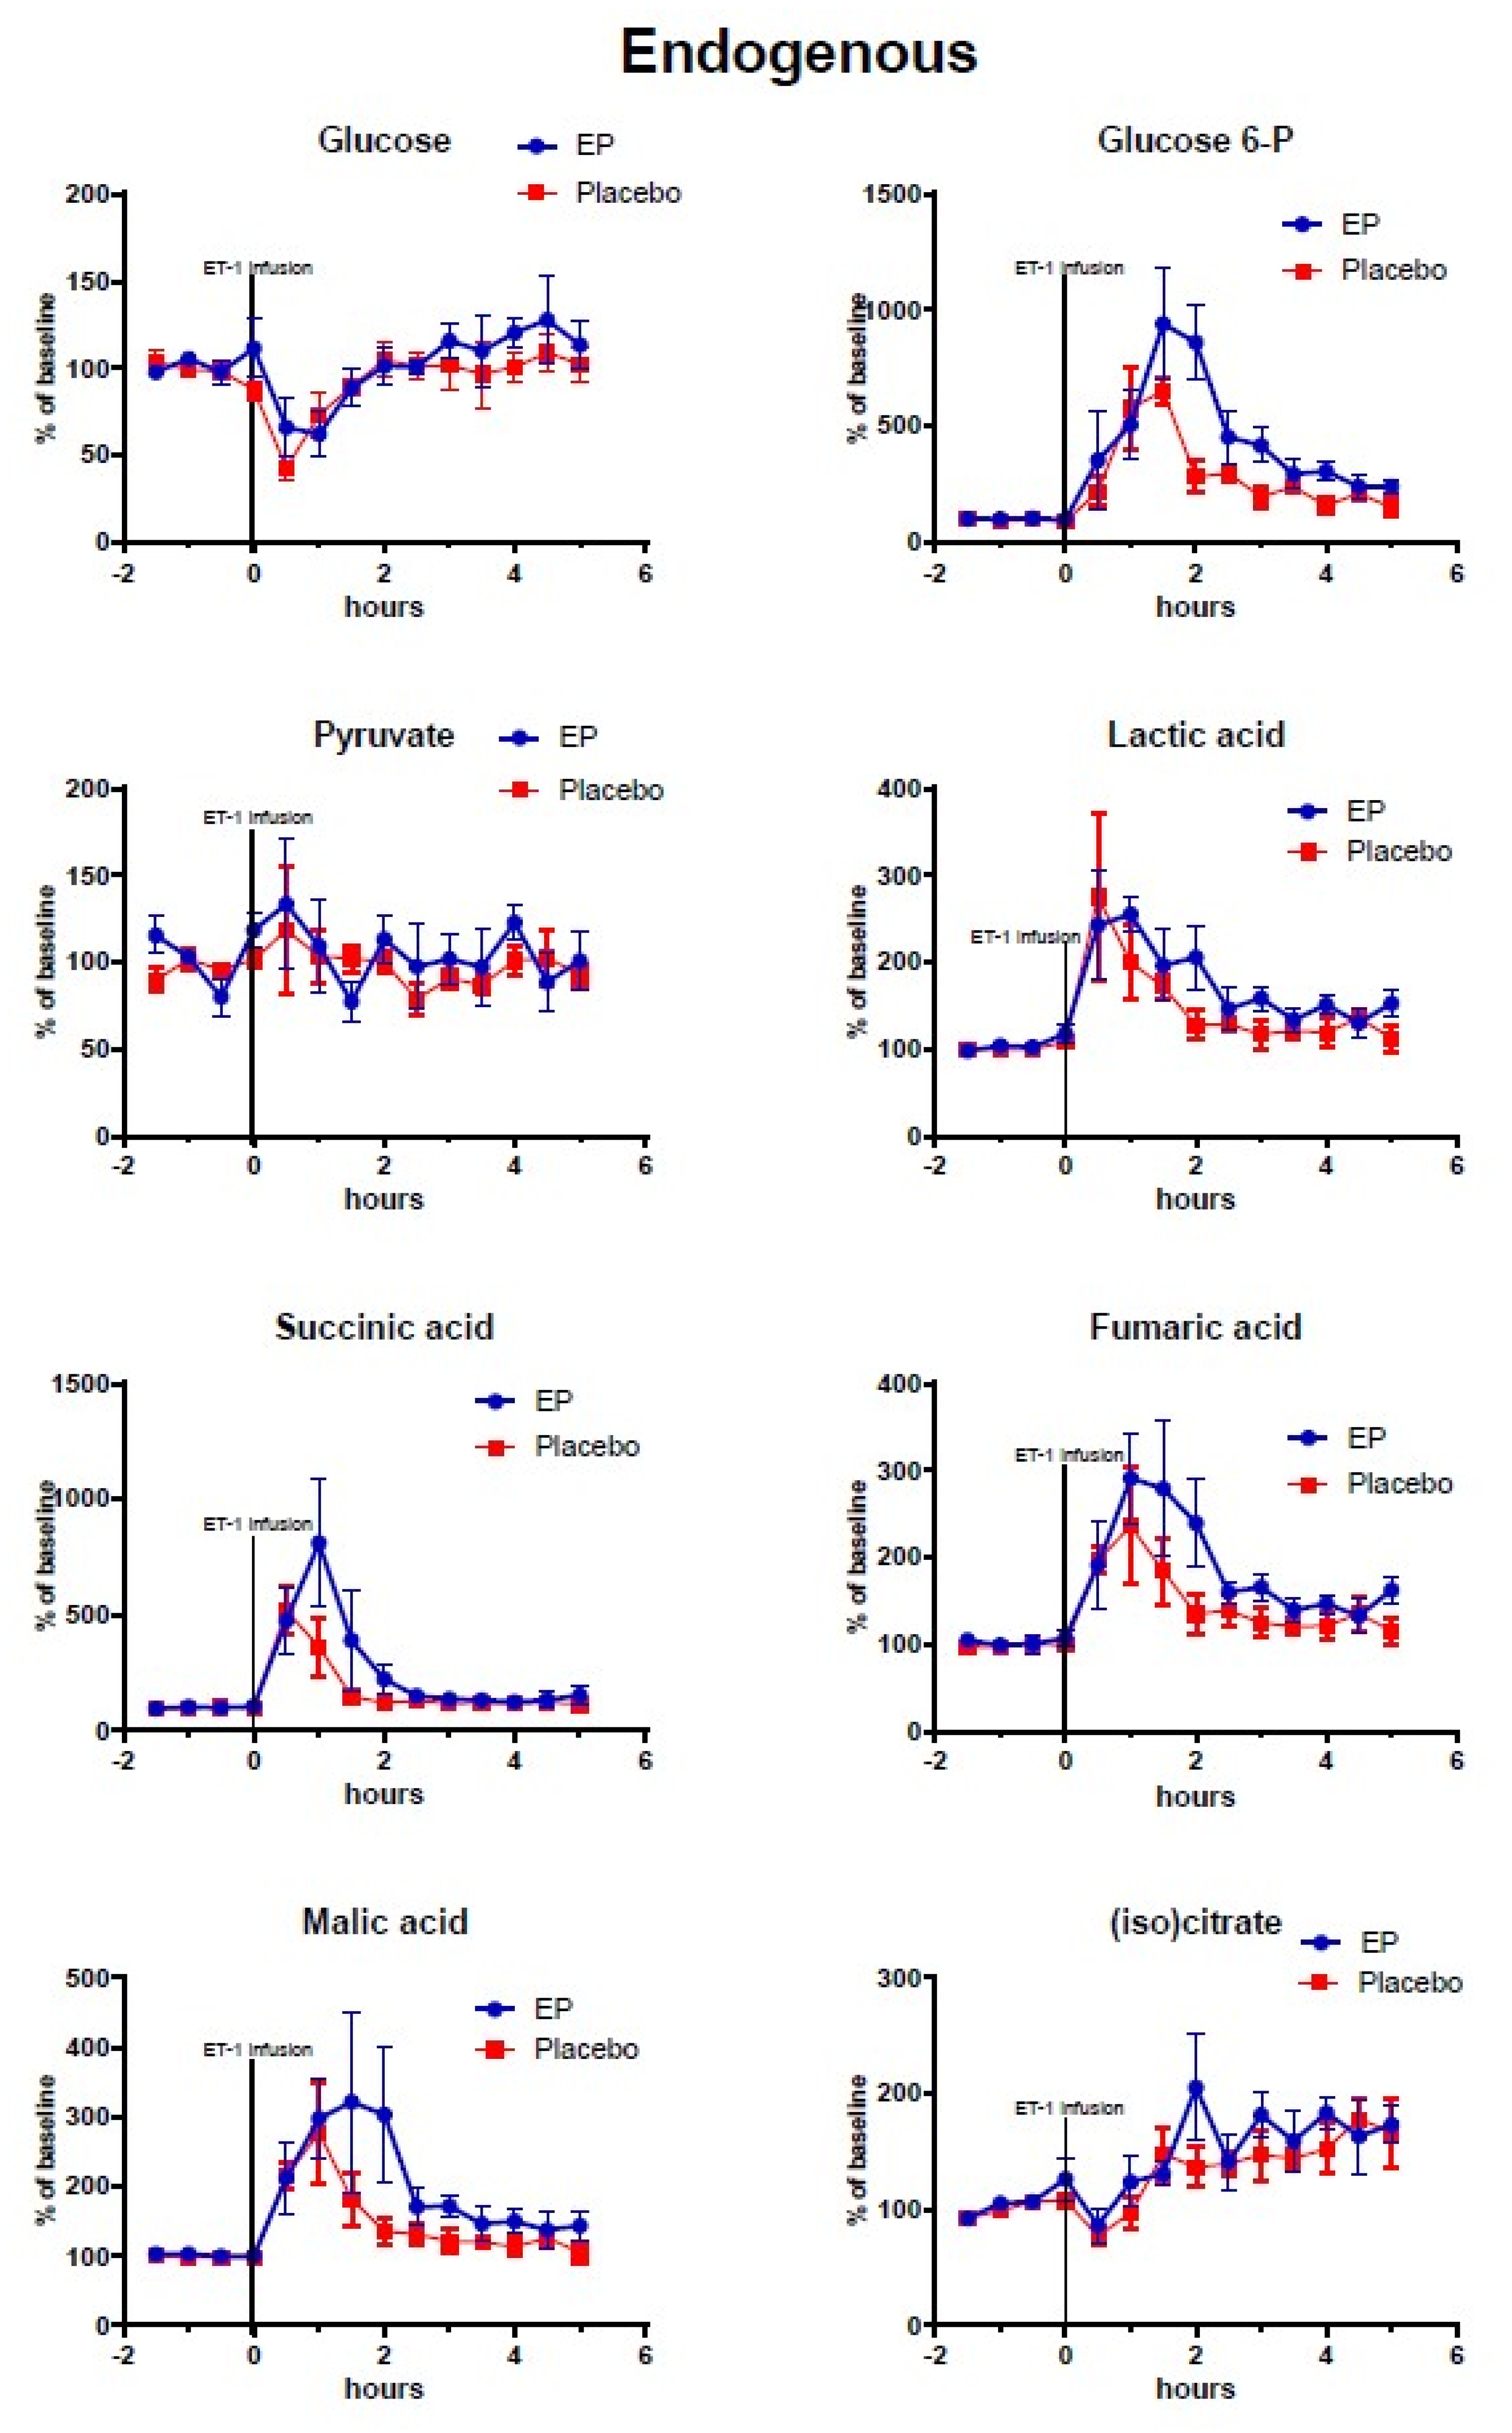
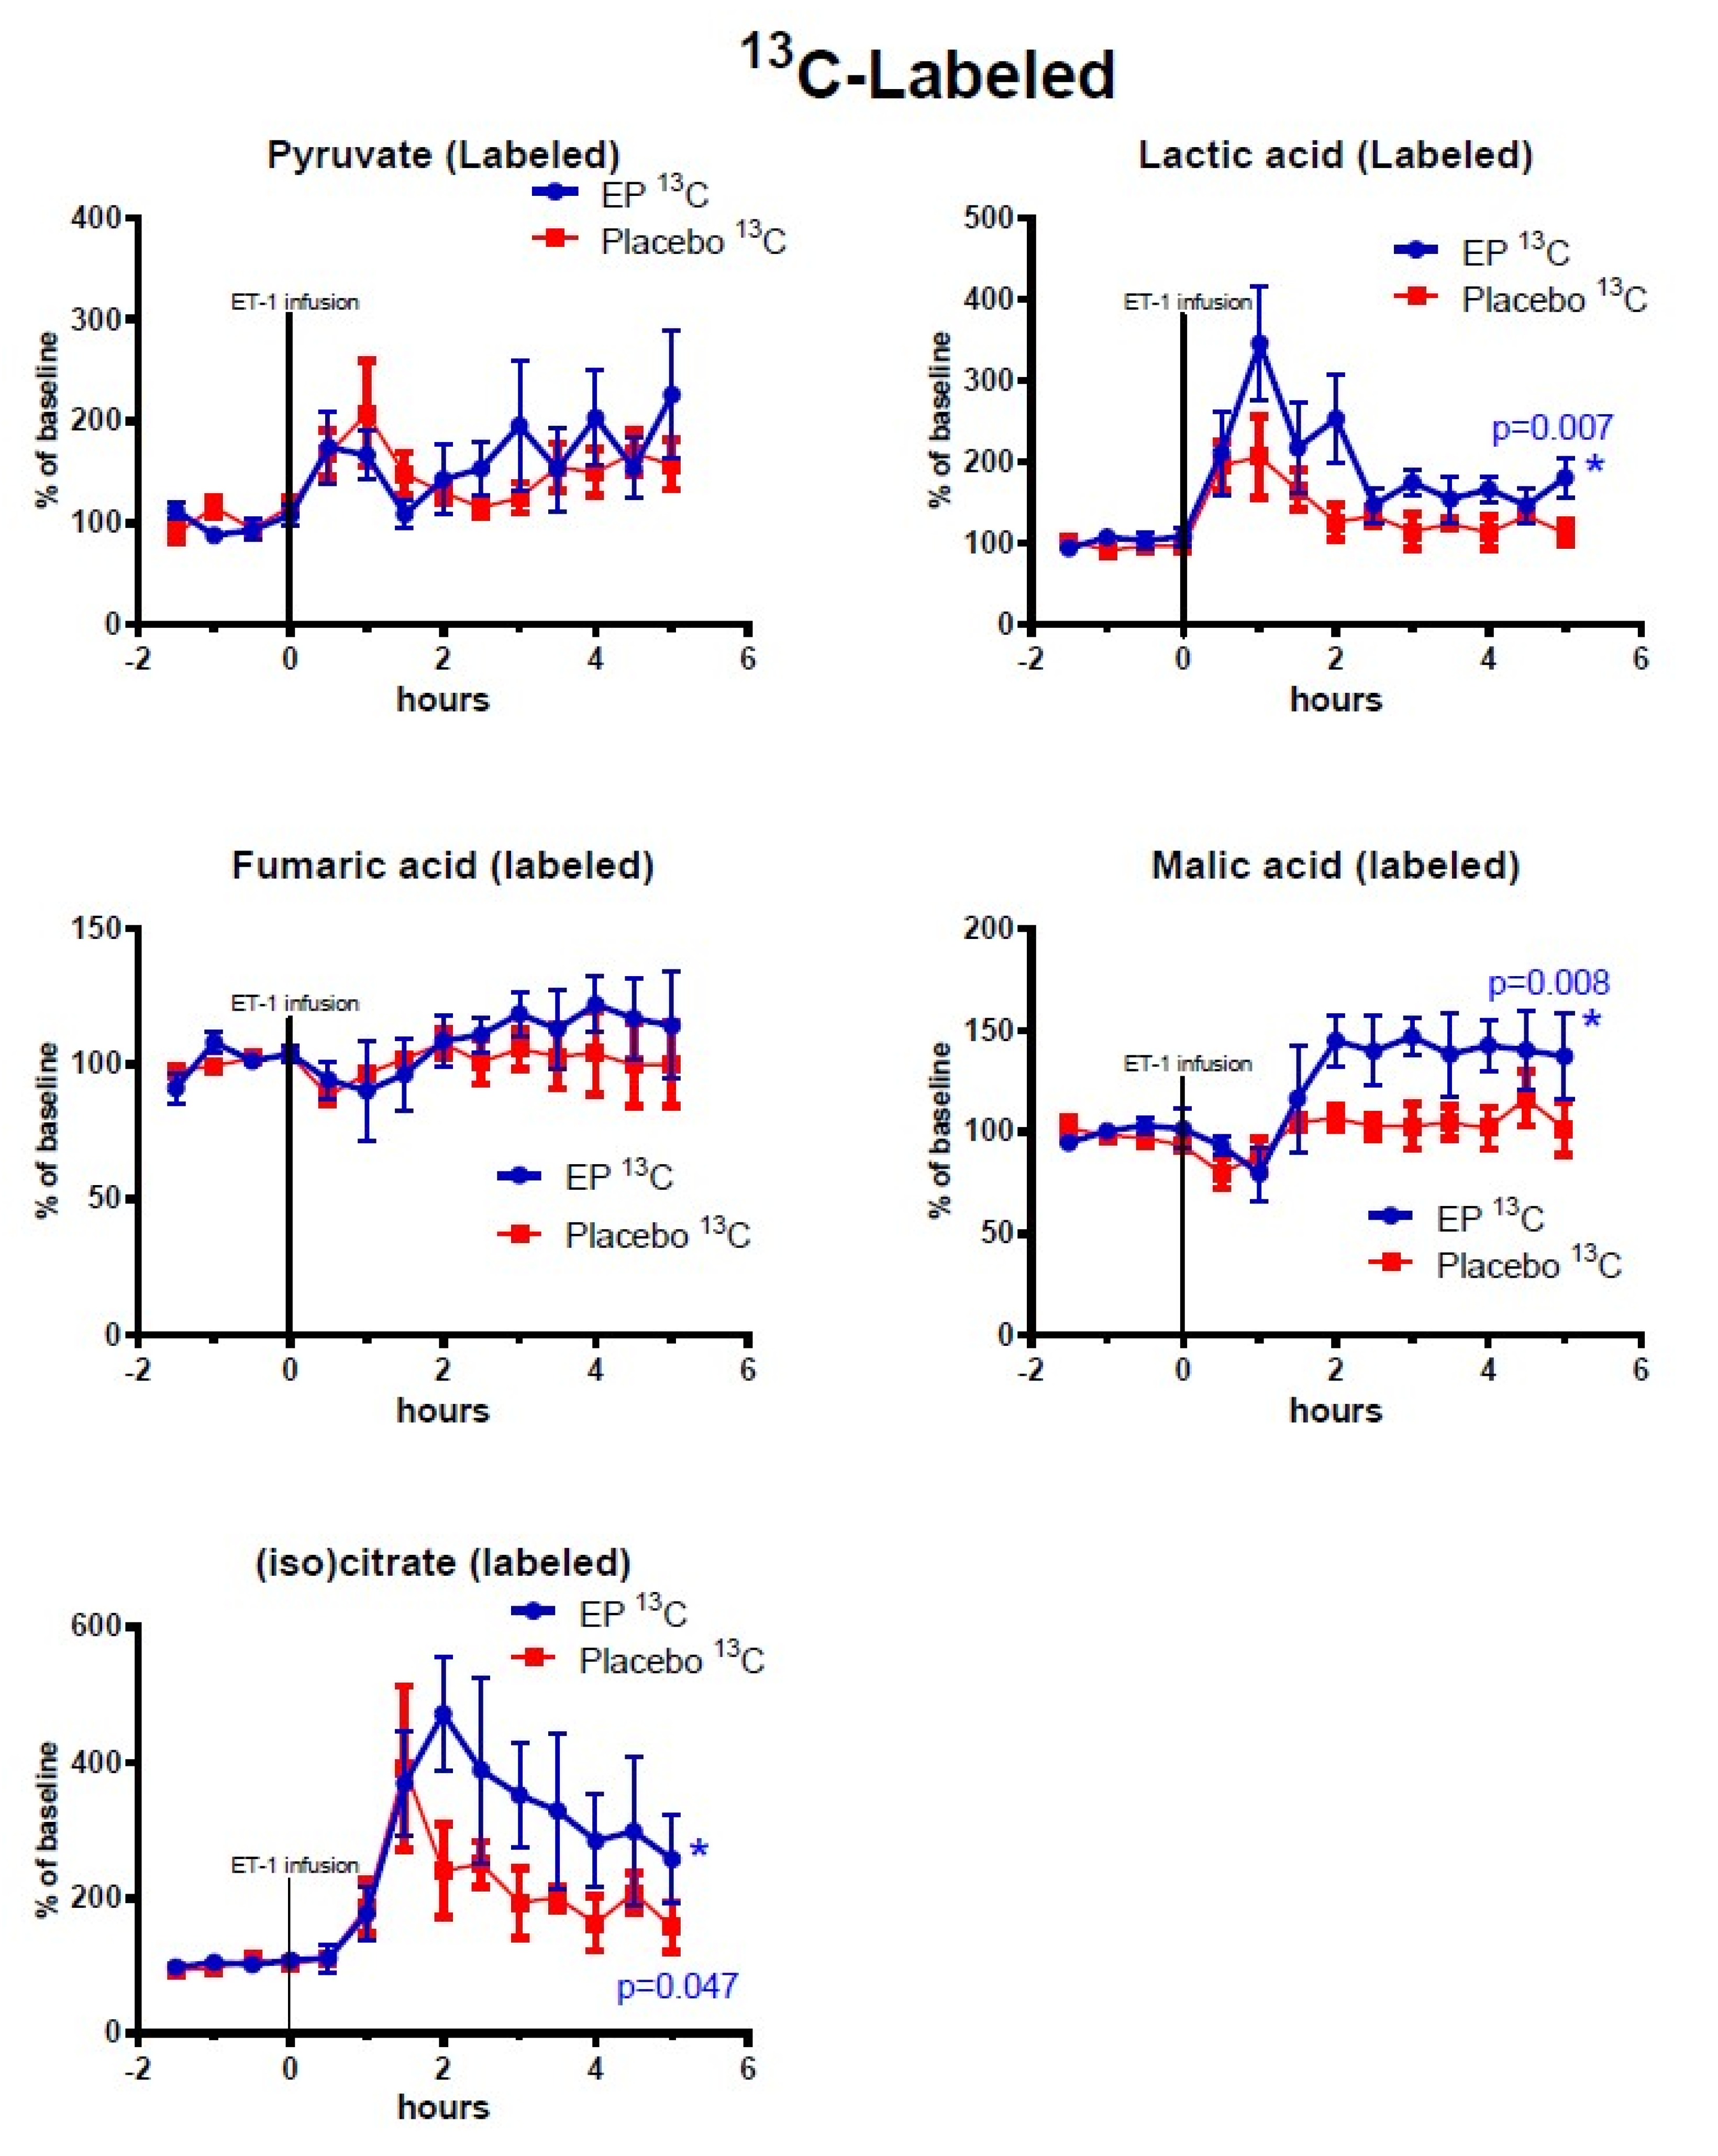
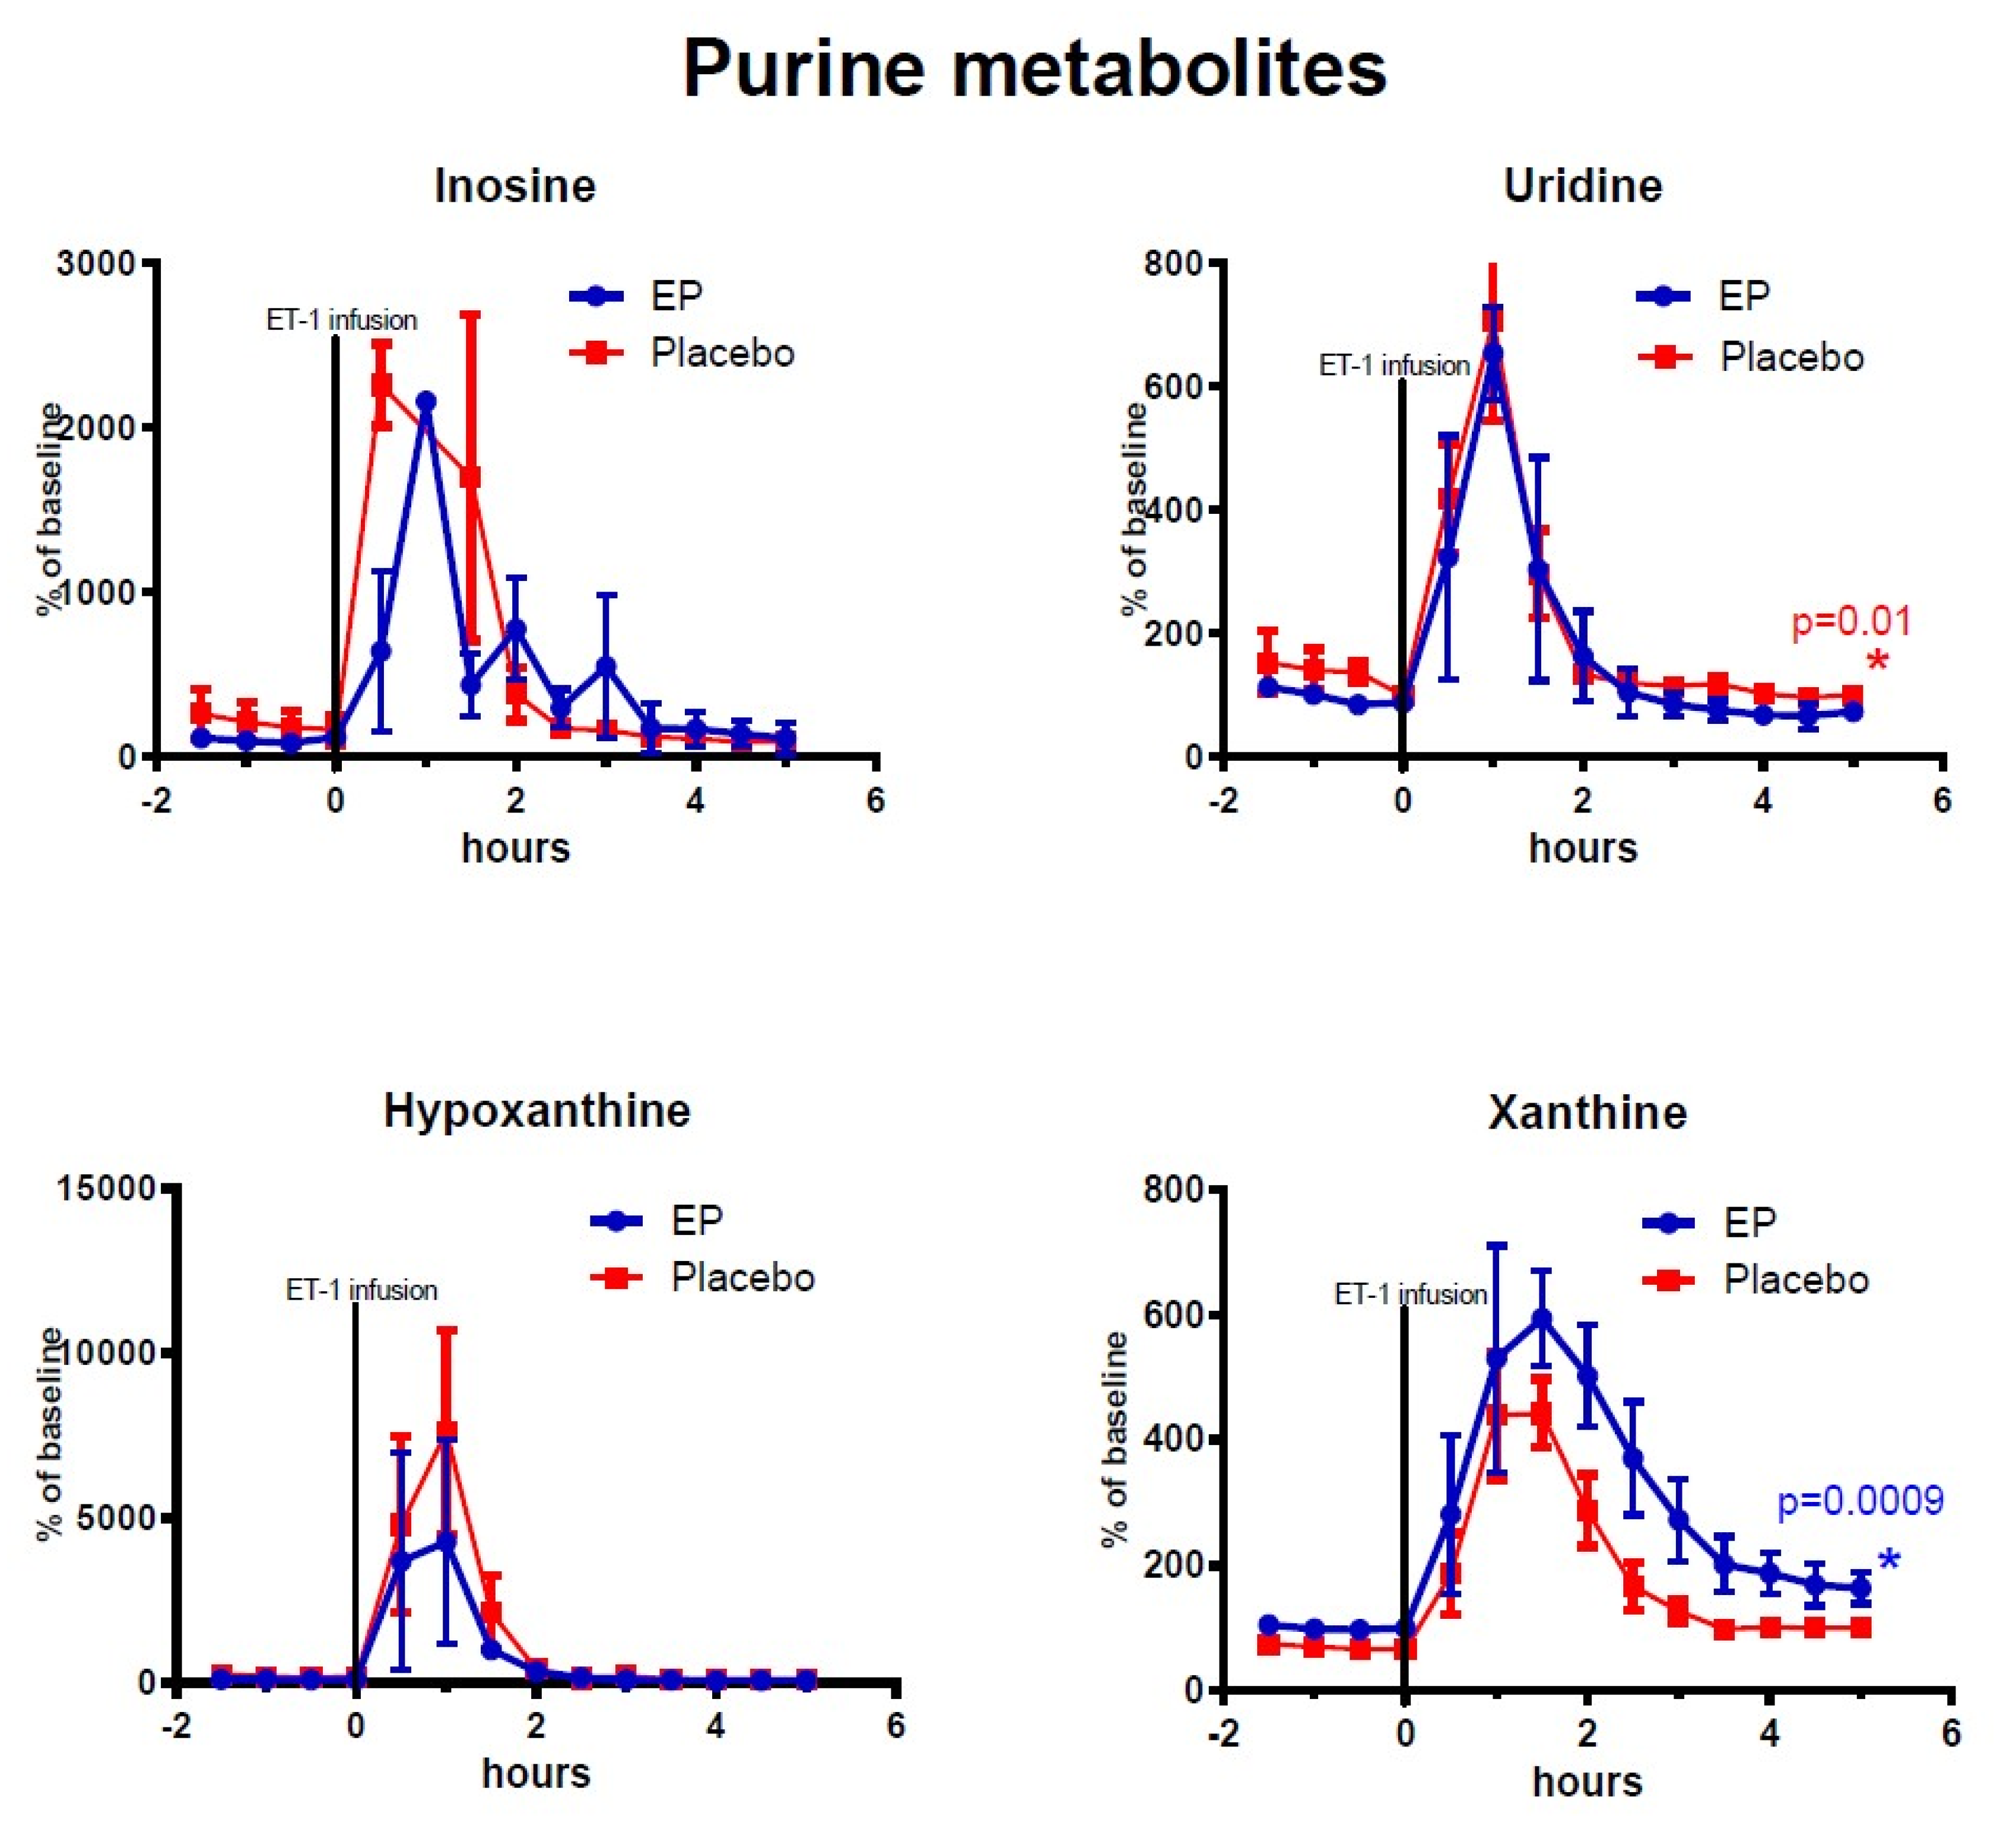
2.2. Cerebral Microdialysis
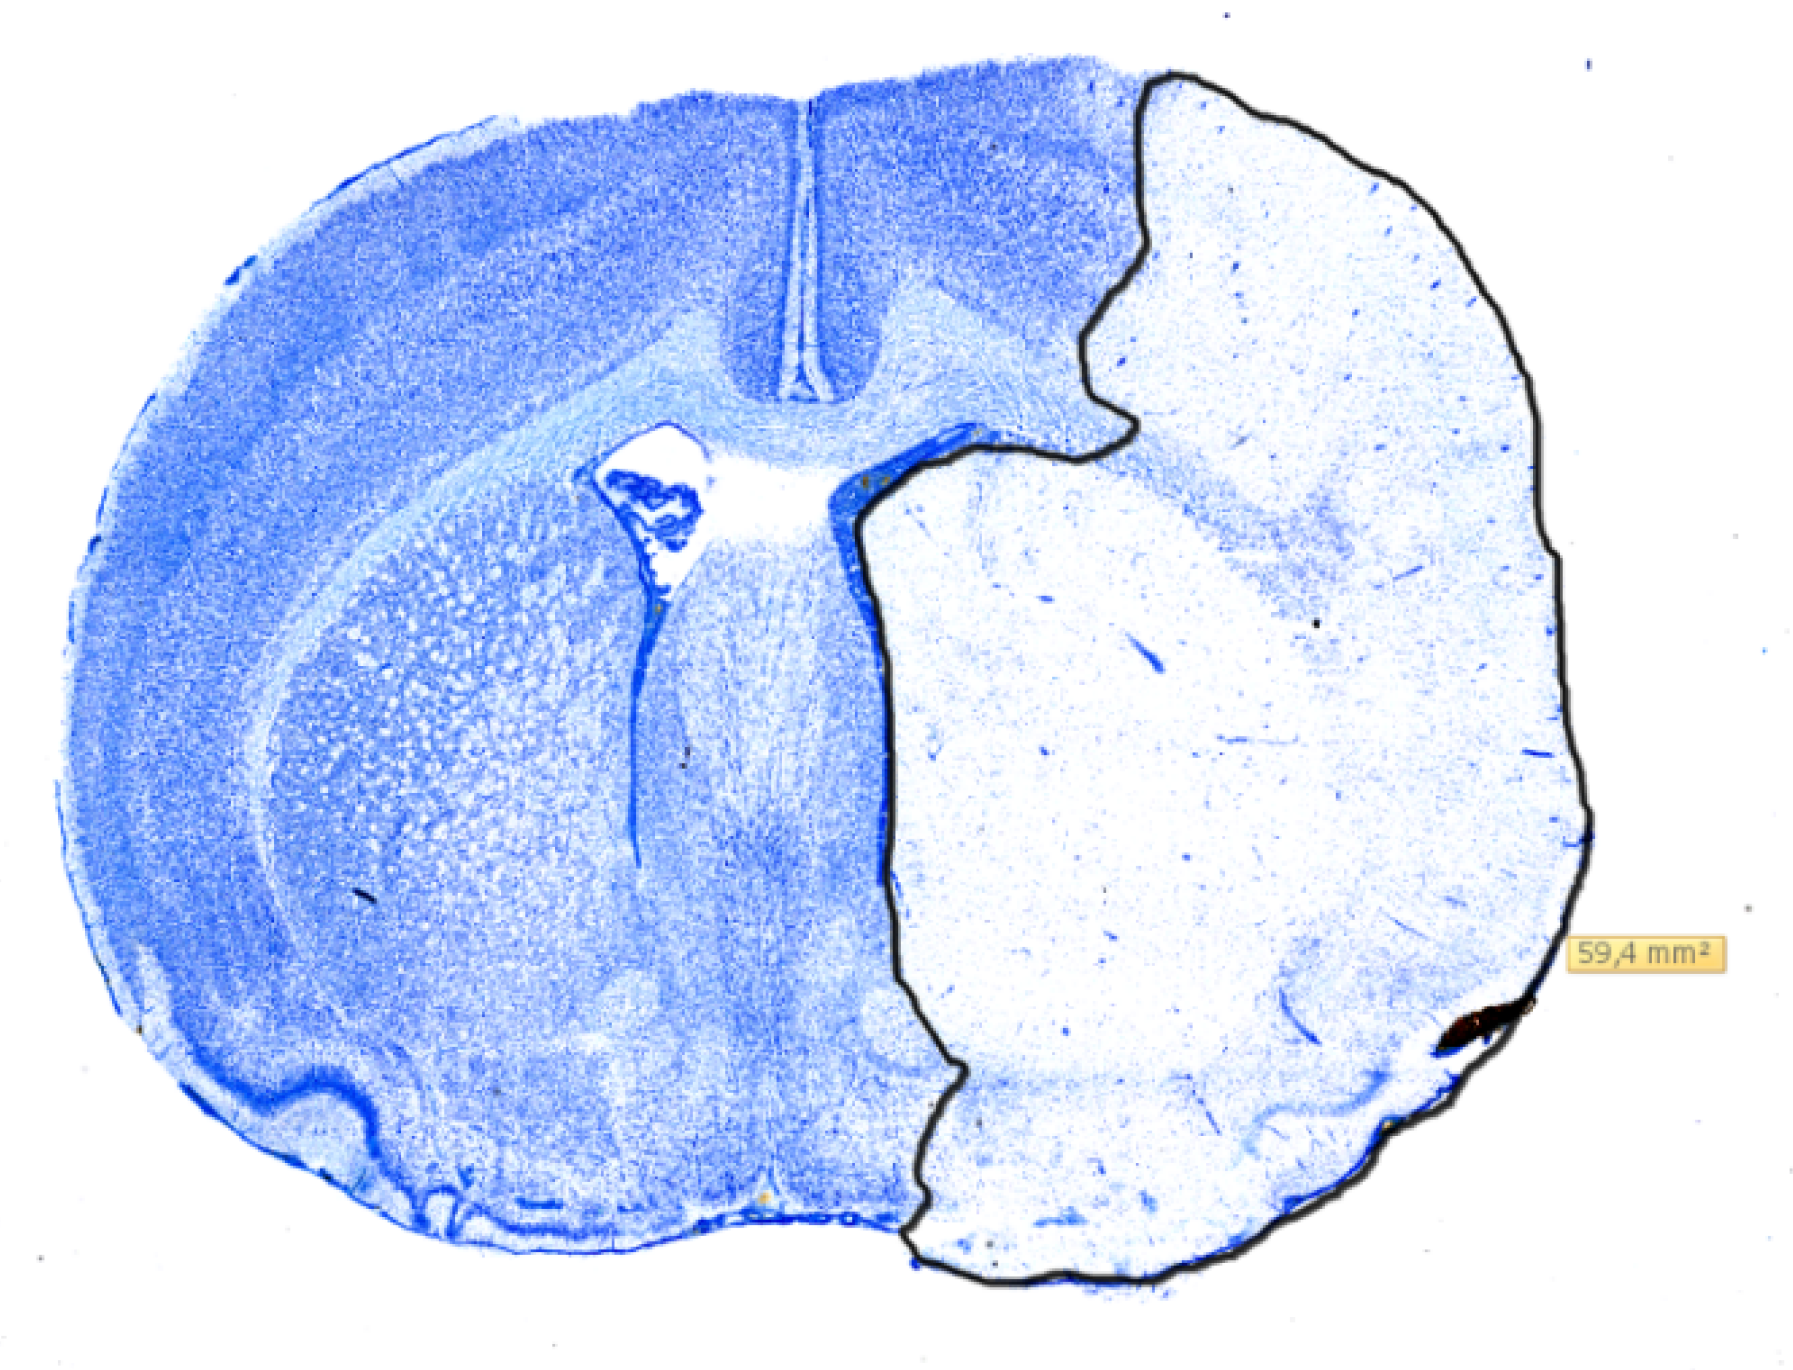
2.3. Histology
3. Discussion
3.1. The ET-1 Model of Focal Transient Cerebral Ischemia and Treatment Effects of Ethyl Pyruvate
3.2. Changes in Purine Derivatives
3.3. Limitations of the Study—Variability of the ET-1 Model in Our Hands
3.4. Clinical Implications of the Monitoring Method and Future Directions
4. Materials and Methods
4.1. Perfusion Fluid Labeling and LC-MS Analysis
4.2. Randomization and Blinded Treatment Administration
4.3. Statistical Analysis
4.4. Infarct Volumetry
5. Conclusions
Author Contributions
Funding
Acknowledgments
Conflicts of Interest
References
- Nordström, C.H. Cerebral microdialysis in TBI-limitations and possibilities. Acta Neurochir. 2017, 159, 2275–2277. [Google Scholar] [CrossRef] [PubMed]
- Jacobsen, A.; Nielsen, T.H.; Nilsson, O.; Schalén, W.; Nordström, C.H. Bedside diagnosis of mitochondrial dysfunction in aneurysmal subarachnoid hemorrhage. Acta Neurol. Scand. 2014, 130, 156–163. [Google Scholar] [CrossRef]
- Nordström, C.H.; Nielsen, T.H.; Schalén, W.; Reinstrup, P.; Ungerstedt, U. Biochemical indications of cerebral ischaemia and mitochondrial dysfunction in severe brain trauma analysed with regard to type of lesion. Acta Neurochir. 2016, 158, 1231–1240. [Google Scholar] [CrossRef] [PubMed]
- Nordström, C.H.; Koskinen, L.O.; Olivecrona, M. Aspects on the Physiological and Biochemical Foundations of Neurocritical Care. Front. Neurol. 2017, 8. [Google Scholar] [CrossRef] [PubMed]
- Kao, C.Y.; Anderzhanova, E.; Asara, J.M.; Wotjak, C.T.; Turck, C.W. Nextgen brain microdialysis: Applying modern metabolomics technology to the analysis of extracellular fluid in the central nervous system. Mol. Neuropsychiatry 2015, 1, 60–67. [Google Scholar] [CrossRef] [PubMed]
- Valtysson, J.; Persson, L.; Hillered, L. Extracellular ischaemia markers in repeated global ischaemia and secondary hypoxaemia monitored by microdialysis in rat brain. Acta Neurochir. 1998, 140, 387–395. [Google Scholar] [CrossRef] [PubMed]
- Hagberg, H.; Andersson, P.; Lacarewicz, J.; Jacobson, I.; Butcher, S.; Sandberg, M. Extracellular adenosine, inosine, hypoxanthine, and xanthine in relation to tissue nucleotides and purines in rat striatum during transient ischemia. J. Neurochem. 1987, 49, 227–231. [Google Scholar] [CrossRef]
- O’Neill, R.; Lowry, J.P. On the significance of brain extracellular uric acid detected with in-vivo monitoring techniques: A review. Behav. Brain Res. 1995, 71, 33–49. [Google Scholar] [CrossRef]
- Pedata, F.; Dettori, I.; Coppi, E.; Melani, A.; Fusco, I.; Corradetti, R.; Pugliese, A.M. Purinergic signalling in brain ischemia. Neuropharmacology 2016, 104, 105–130. [Google Scholar] [CrossRef]
- Havelund, J.F.; Nygaard, K.; Nielsen, T.H.; Nordström, C.H.; Poulsen, F.R.; Færgeman, N.J.; Forsse, A.; Gramsbergen, J.B. In vivo microdialysis of endogenous and 13C-labeled TCA metabolites in rat brain: Reversible and persistent effects of mitochondrial inhibition and transient cerebral ischemia. Metabolites. 2019, 9, 204. [Google Scholar] [CrossRef]
- Minnerup, J.; Sutherland, B.A.; Buchan, A.M.; Kleinschnitz, C. Neuroprotection for stroke: Current status and future perspectives. Int. J. Mol. Sci. 2012, 13, 11753–11772. [Google Scholar] [CrossRef] [PubMed]
- Kao, K.K.; Fink, M.P. The biochemical basis for the anti-inflammatory and cytoprotective actions of ethyl pyruvate and related compounds. Biochem. Pharmacol. 2010, 80, 151–159. [Google Scholar] [CrossRef] [PubMed]
- Zeng, J.; Liu, J.; Yang, G.-Y.; Kelly, M.J.S.; James, T.L.; Litt, L. Exogenous ethyl pyruvate versus pyruvate during metabolic recovery after oxidative stress in neonatal rat cerebrocortical slices. Anesthesiology 2007, 107, 630–640. [Google Scholar] [CrossRef] [PubMed]
- Lee, H.K.; Kim, I.D.; Kim, S.W.; Lee, H.; Park, J.Y.; Yoon, S.H.; Lee, J.K. Anti-inflammatory and anti-excitoxic effects of diethyl oxopropanamide, an ethyl pyruvate bioisoster, exert robust neuroprotective effects in the postischemic brain. Sci. Rep. 2017, 7, 42891. [Google Scholar] [CrossRef]
- Sims, C.A.; Wattanasirichaigoon, S.; Menconi, M.J.; Ajami, A.M.; Fink, M.P. Ringer’s ethyl pyruvate solution ameliorates ischemia/reperfusion-induced intestinal mucosal injury in rats. Crit. Care Med. 2001, 29, 1513–1518. [Google Scholar] [CrossRef]
- Forsse, A.; Nielsen, T.H.; Nygaard, K.; Nordström, C.-H.; Gramsbergen, J.B.; Poulsen, F.R. Cyclosporin A ameliorates cerebral oxidative metabolism and infarct size in the endothelin-1 rat model of transient cerebral ischaemia. Sci. Rep. 2019, 9, 3702. [Google Scholar] [CrossRef] [PubMed]
- Heart, E.A.; Cline, G.W.; Collis, L.P.; Pongratz, R.L.; Gray, J.; Smith, P.J.S. Role for malic enzyme, pyruvate carboxylation, and mitochondrial malate import in glucose-stimulated insulin secretion. Am. J. Physiol. Metab. 2009, 296, E1354–E1362. [Google Scholar] [CrossRef] [PubMed]
- Quijano, C.; Trujillo, M.; Castro, L.; Trostchansky, A. Interplay between oxidant species and energy metabolism. Redox Biol. 2016, 8, 28–42. [Google Scholar] [CrossRef] [PubMed]
- Liu, J.R.; Litt, L.; Segal, M.R.; Kelly, M.J.S.; Pelton, J.G.; Kim, M. Metabolomics of oxidative stress in recent studies of endogenous and exogenously administered intermediate metabolites. Int. J. Mol. Sci. 2011, 12, 6469–6501. [Google Scholar] [CrossRef]
- Cipriani, S.; Desjardins, C.A.; Burdett, T.C.; Xu, Y.; Xu, K.; Schwarzschild, M.A. Protection of dopaminergic cells by urate requires its accumulation in astrocytes. J. Neurochem. 2012, 123, 172–181. [Google Scholar] [CrossRef]
- Tian, M.L.; Zou, Z.; Yuan, H.B.; Wang, C.C.; Zhu, Q.F.; Xu, H.T.; Gao, X.; Shi, X. Uridine 5′-triphosphate (UTP) protects against cerebral ischemia reperfusion injury in rats. Neurosci. Lett. 2009, 465, 55–60. [Google Scholar] [CrossRef] [PubMed]
- Morimoto, K.; Shimizu, H.; Hayakawa, T.; Shimada, N.; Nii, Y.; Masana, Y.; Kato, A.; Mogami, H. Purine catabolites in cerebral interstitial fluid during progression of and recovery from ischemia. Neurol. Med. Chir. (Tokyo) 1991, 31, 129–134. [Google Scholar] [CrossRef] [PubMed]
- Marklund, N.; Östman, B.; Nalmo, L.; Persson, L.; Hillered, L. Hypoxanthine, uric acid and allantoin as indicators of in vivo free radical reactions. Description of a HPLC method and human brain microdialysis data. Acta Neurochir. 2000, 142, 1135–1142. [Google Scholar] [CrossRef]
- Yamamoto, T.; Moriwaki, Y.; Takahashi, S.; Tsutsumi, Z.; Yamakita, J.-I.; Higashino, K. Is the plasma uridine level a marker of the overproduction of uric acid? Metabolism 1997, 46, 801–804. [Google Scholar] [CrossRef]
- Holguin, S.; Martinez, J.; Chow, C.; Wurtman, R. Dietary uridine enhances the improvement in learning and memory produced by administering DHA to gerbils. FASEB J. 2008, 22, 3938–3946. [Google Scholar] [CrossRef]
- Ipata, P.L.; Barsotti, C.; Tozzi, M.G.; Camici, M.; Balestri, F. Metabolic interplay between intra- and extra-cellular uridine metabolism via an ATP driven uridine–UTP cycle in brain. Int. J. Biochem. Cell Boil. 2010, 42, 932–937. [Google Scholar] [CrossRef]
- Macrae, I.M. Preclinical stroke research-advantages and disadvantages of the most common rodent models of focal ischaemia. Br. J. Pharmacol. 2011, 164, 1062–1078. [Google Scholar] [CrossRef] [PubMed]
- Cai, B.; Brunner, M.; Wang, H.; Wang, P.; Deitch, E.A.; Ulloa, L. Ethyl pyruvate improves survival in awake hemorrhage. J. Mol. Med. 2009, 87, 423–433. [Google Scholar] [CrossRef]
- McBride, D.W.; Jacob, C.; Doycheva, D.; Dixon, B.J.; Malaguit, J.; Lekic, T.; Tang, J.; Zhang, J.H. Changes in brain swelling and infarction volume over four days after hypoxia ischemia in neonatal rats. Acta. Neurochir. Suppl. 2016, 121, 111–114. [Google Scholar] [CrossRef] [PubMed]
- Francoeur, C.L.; Mayer, S.A. Management of delayed cerebral ischemia after subarachnoid hemorrhage. Crit. Care 2016, 20, 277. [Google Scholar] [CrossRef]
- Budohoski, K.P.; Guilfoyle, M.; Helmy, A.; Huuskonen, T.; Czosnyka, M.; Kirollos, R.; Menon, D.K.; Pickard, J.D.; Kirkpatrick, P.J. The pathophysiology and treatment of delayed cerebral ischaemia following subarachnoid haemorrhage. J. Neurol. Neurosurg. Psychiatry 2014, 85, 1343–1353. [Google Scholar] [CrossRef] [PubMed]
- Jalloh, I.; Helmy, A.; Howe, D.J.; Shannon, R.J.; Grice, P.; Mason, A.; Gallagher, C.N.; Stovell, M.G.; Van Der Heide, S.; Murphy, M.P.; et al. Focally perfused succinate potentiates brain metabolism in head injury patients. Br. J. Pharmacol. 2016, 37, 2626–2638. [Google Scholar] [CrossRef] [PubMed]


| Metabolite | Labeling Ratio |
|---|---|
| Isocitrate (4 13C, 2 12C) | 0.09 |
| Lactate (3 13C) | 0.0029 |
| Fumarate (4 13C) | 9.64 |
| Pyruvate (3 13C) | 0.06 |
| Malate (4 13C) | 11.43 |
© 2020 by the authors. Licensee MDPI, Basel, Switzerland. This article is an open access article distributed under the terms and conditions of the Creative Commons Attribution (CC BY) license (http://creativecommons.org/licenses/by/4.0/).
Share and Cite
Nygaard, K.H.; Havelund, J.F.; Nielsen, T.H.; Nordström, C.-H.; Færgeman, N.J.; Poulsen, F.R.; Gramsbergen, J.B.; Forsse, A. Ethyl Pyruvate Increases Post-Ischemic Levels of Mitochondrial Energy Metabolites: A 13C-Labeled Cerebral Microdialysis Study. Metabolites 2020, 10, 287. https://doi.org/10.3390/metabo10070287
Nygaard KH, Havelund JF, Nielsen TH, Nordström C-H, Færgeman NJ, Poulsen FR, Gramsbergen JB, Forsse A. Ethyl Pyruvate Increases Post-Ischemic Levels of Mitochondrial Energy Metabolites: A 13C-Labeled Cerebral Microdialysis Study. Metabolites. 2020; 10(7):287. https://doi.org/10.3390/metabo10070287
Chicago/Turabian StyleNygaard, Kevin H., Jesper F. Havelund, Troels H. Nielsen, Carl-Henrik Nordström, Nils. J. Færgeman, Frantz R. Poulsen, Jan Bert Gramsbergen, and Axel Forsse. 2020. "Ethyl Pyruvate Increases Post-Ischemic Levels of Mitochondrial Energy Metabolites: A 13C-Labeled Cerebral Microdialysis Study" Metabolites 10, no. 7: 287. https://doi.org/10.3390/metabo10070287
APA StyleNygaard, K. H., Havelund, J. F., Nielsen, T. H., Nordström, C.-H., Færgeman, N. J., Poulsen, F. R., Gramsbergen, J. B., & Forsse, A. (2020). Ethyl Pyruvate Increases Post-Ischemic Levels of Mitochondrial Energy Metabolites: A 13C-Labeled Cerebral Microdialysis Study. Metabolites, 10(7), 287. https://doi.org/10.3390/metabo10070287