1. Introduction
For testing drug diffusion through physiological barriers, different instruments are available. For topical/transdermal drug delivery, the vertical and horizontal static Franz diffusion cells are widely used. In the last decade, however, many dynamic systems have also been developed. In these microfluidic devices, microchannels are fabricated and continuous perfusion is provided to mimic the fluid flow in the living tissue. This fluid flow results from capillary microcirculation, lymph microcirculation, and the movement of extracellular fluids. In the traditional method of microdialysis, diffusion also occurs in the target tissue, where the microdialysis probes are implanted [
1]. A molecular exchange takes place through the semipermeable membrane of the probe in the extracellular matrix in the direction of the concentration gradient. The recovery of the system for a certain molecule depends on several factors, including the flow rate of the perfusion fluid, which can be an artificial cerebrospinal fluid or artificial peripheral perfusion fluid (both fluids are water-based salt solutions); the temperature; and the diffusion surface. A lower flow rate results in higher recovery of the test compounds and increasing the flow rate leads to an exponential reduction in the probe relative recovery. Therefore, in an optimal microdialysis setup, a 0.5–2.0 µL/min flow rate [
2,
3] is applied to reach the maximum solute concentrations in the dialysate samples and leave enough time for the molecular dynamic movements and the diffusion of the test compound. On the other hand, under physiological conditions, the blood flow rate is the highest in the arteries (3–26 mL/min, depending on the diameter of the blood vessels), followed by the veins (1.2–4.8 mL/min), and is the slowest in microcirculation, where the diameter of the blood microvessels in humans is 5–10 µm [
4]. The capillaries present the highest cross-sectional surface for fluid perfusion in the body.
The currently available organ-on-a-chip or skin-on-a-chip systems apply different perfusion flow rates depending on the microchannel design and the placement and integration of cells or ex vivo tissues in the devices [
5,
6,
7,
8,
9]. To achieve physiologically relevant conditions, the shear stress on the channel wall and cells and the tissue preparations should be considered. In organ-on-a-chip microfluidic systems, cell cultures or human tissues like skin can be integrated into the device under physiological conditions. The systems can be designed with different complexities using one or more cell types and mimicking physiological or pathological conditions (e.g., accelerated aging, etc.). Also, the size of these micronized testing platforms makes it possible to reduce the amount of consumables, cells, tissues, test articles, etc. The relatively low cost and ease of manufacturing make this technology attractive for research purposes. The key considerations in designing in vitro microfluidic devices for drug testing are the (1) selection of cell types or tissue preparations for testing, (2) optimization of the design of the microfluidic channels, (3) optimization of the raw materials selected for the construction of the microfluid device, (4) selection of the best manufacturing technology, and (5) adjustment of the conditions like temperature, flow rate, shear forces on the cells or tissues, medium composition, oxygen content, etc., to produce physiological conditions.
In the current study, three different devices were compared and tested from a fluid dynamics point of view. Two skin-on-a-chip devices (single-channel and triple-channel setups) were developed in-house by our institution, and one was purchased from IVTech Srl (LiveBox2) (Ospedaletto, Italy) [
10,
11,
12]. To design better testing platforms and optimize those currently used, various flow rates were experimentally investigated, and mathematical simulations and computational fluid dynamic calculations were performed. The aim of this study was to determine the best testing conditions for topical drug delivery in various diffusion chambers. To evaluate the degree of diffusion of a 2% caffeine-containing cream, a hydrophilic model formulation was utilized on the surface of the synthetic membranes (cellulose-acetate and polyester), excised rat skins, and 3% alginate scaffolds. The alginate will be used in later experiments as a bioink scaffold for the 3D bioprinting of artificial human epidermis. The current series of experiments were conducted to optimize the conditions for future human skin 3D bioprinting studies.
3. Results
3.1. Viscosity and Particle Size Distribution
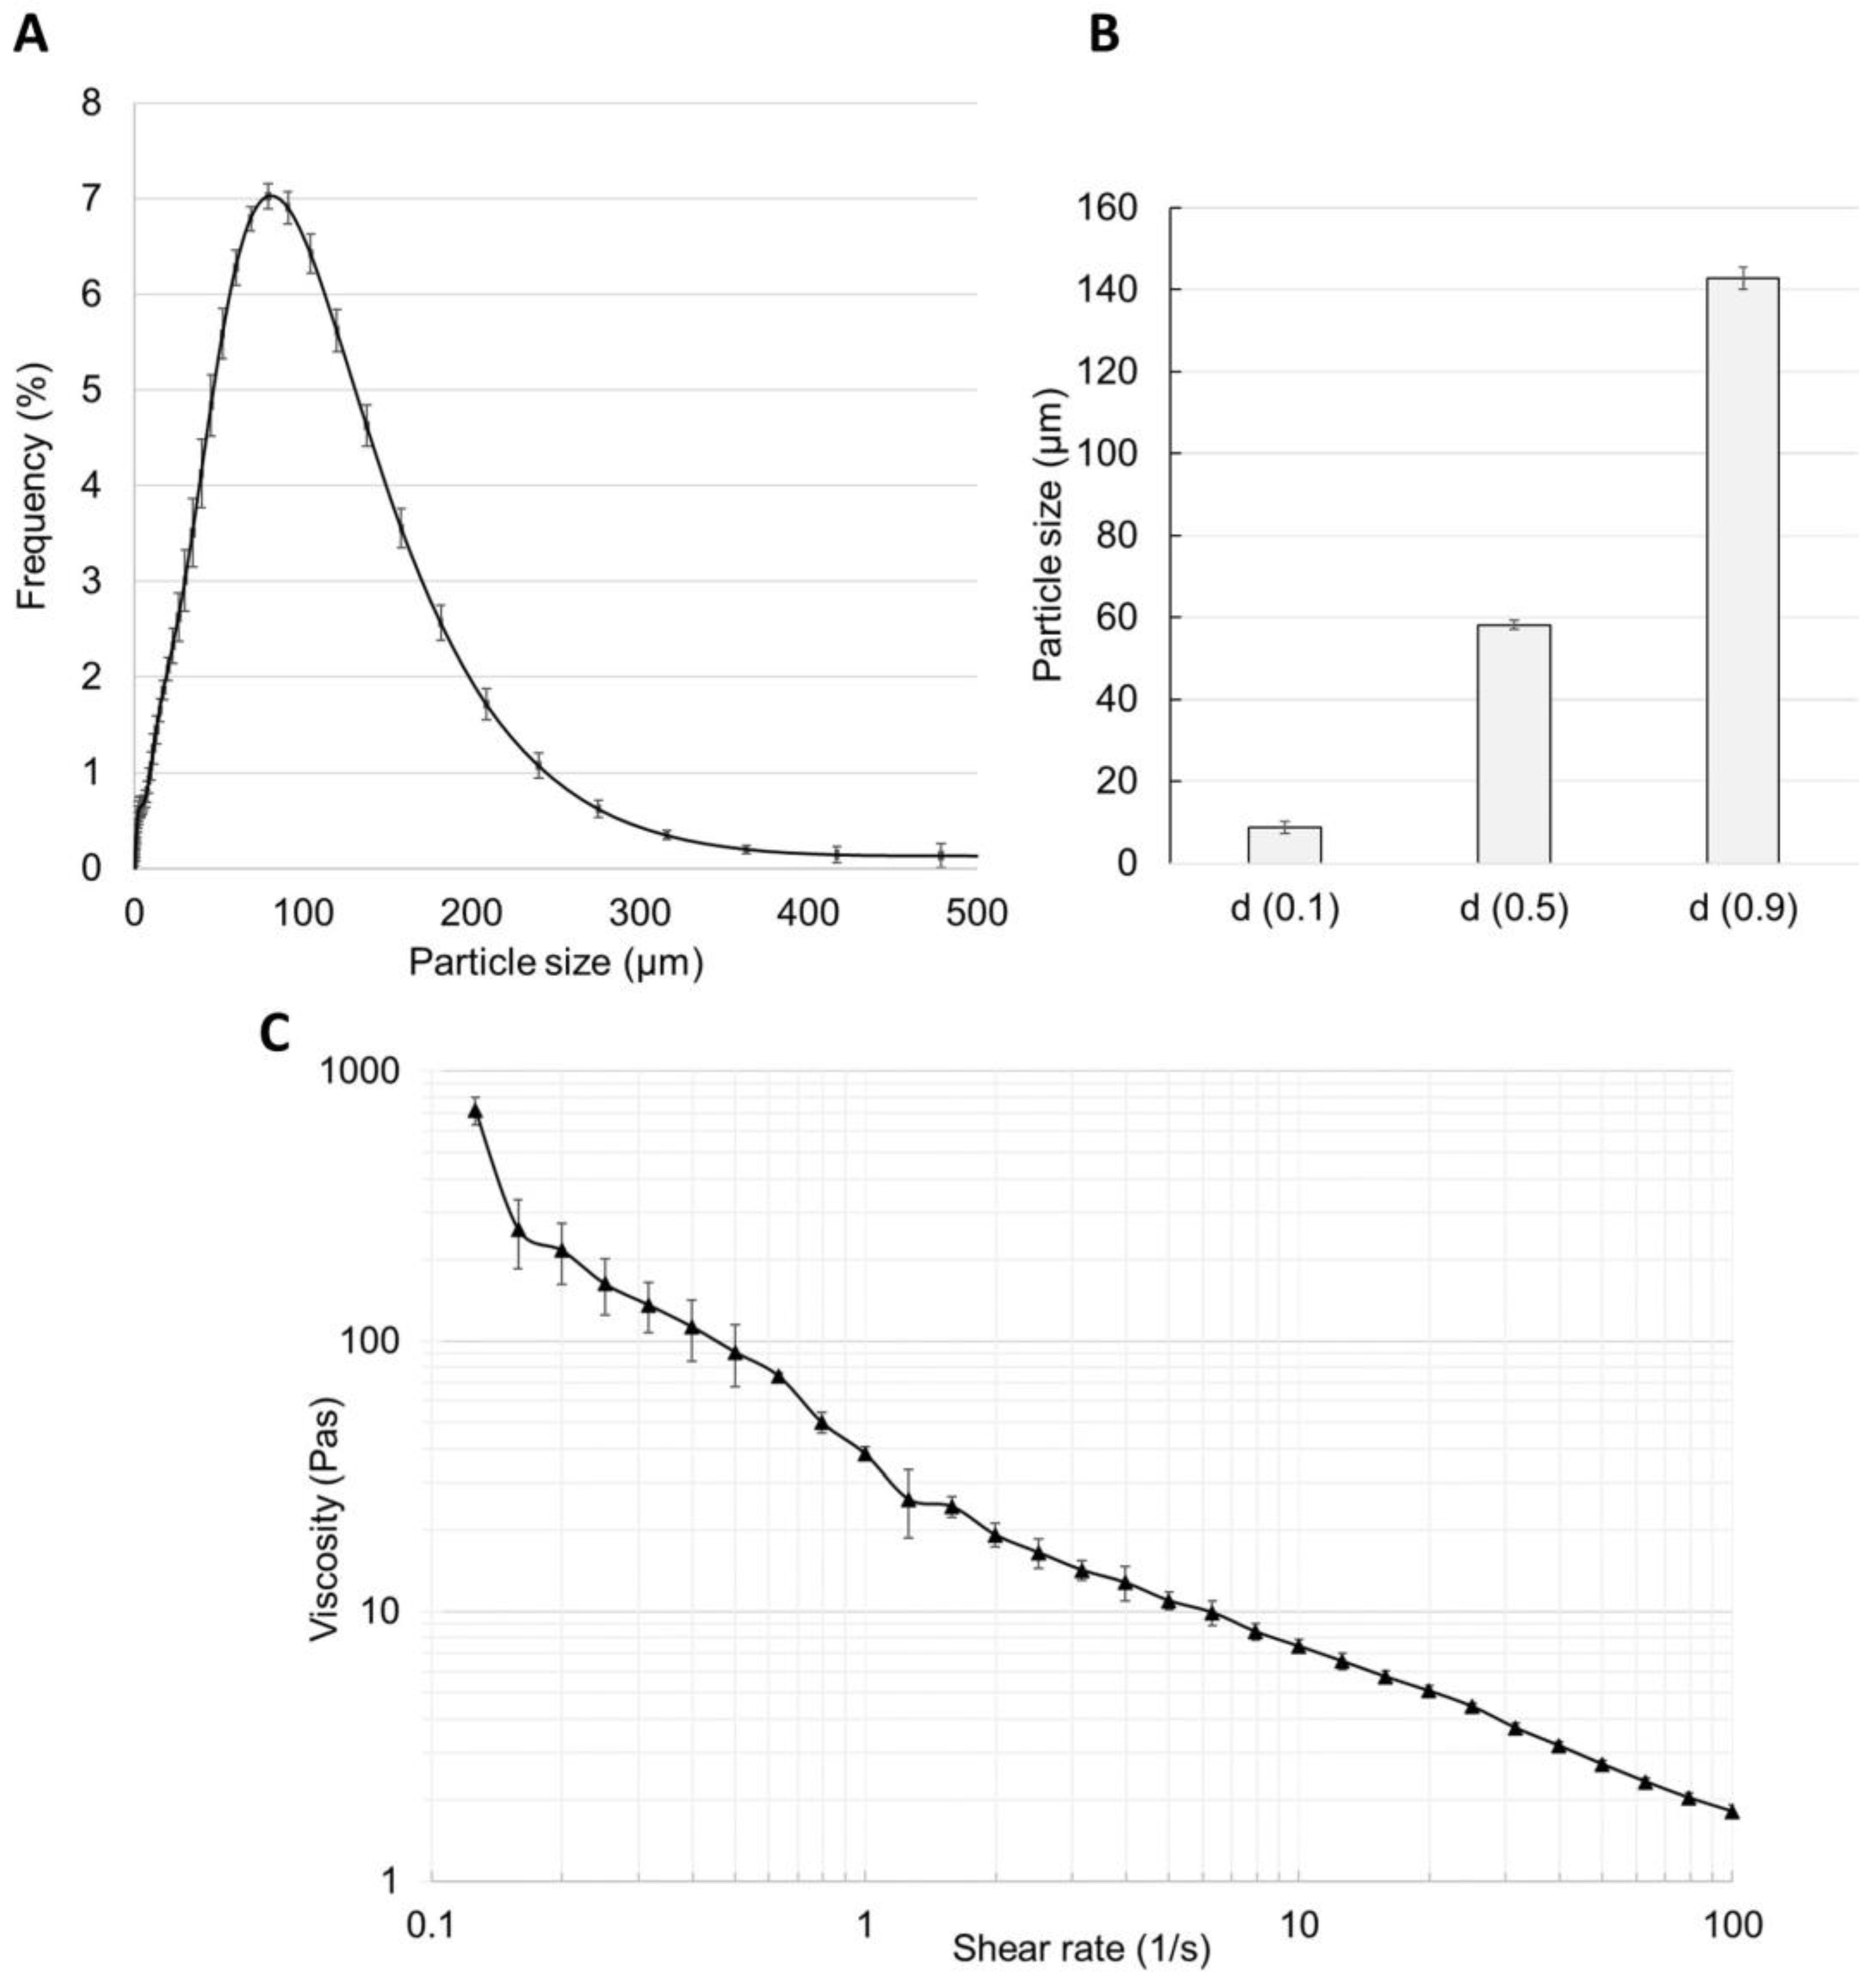
The particle size distribution study showed a homogenous composition of the 2% caffeine cream, which is presented in
Figure 4A,B. In total, 90% of the particles appeared to be 140 μm in size and only one peak could be seen in the frequency curve. The viscosity of the cream was determined at different shear rates from 0.1 to 100/s (
Figure 4C), and it showed an almost linear inverse relationship with the increasing shear rate (from 800 to 2 Pa·s) due to the shear-thinning behavior of the cream.
3.2. Diffusion of Caffeine through Polyester (PET) Membrane, Cellulose Acetate (CA) Membrane, Excised Rat Skin, and Alginate Scaffold
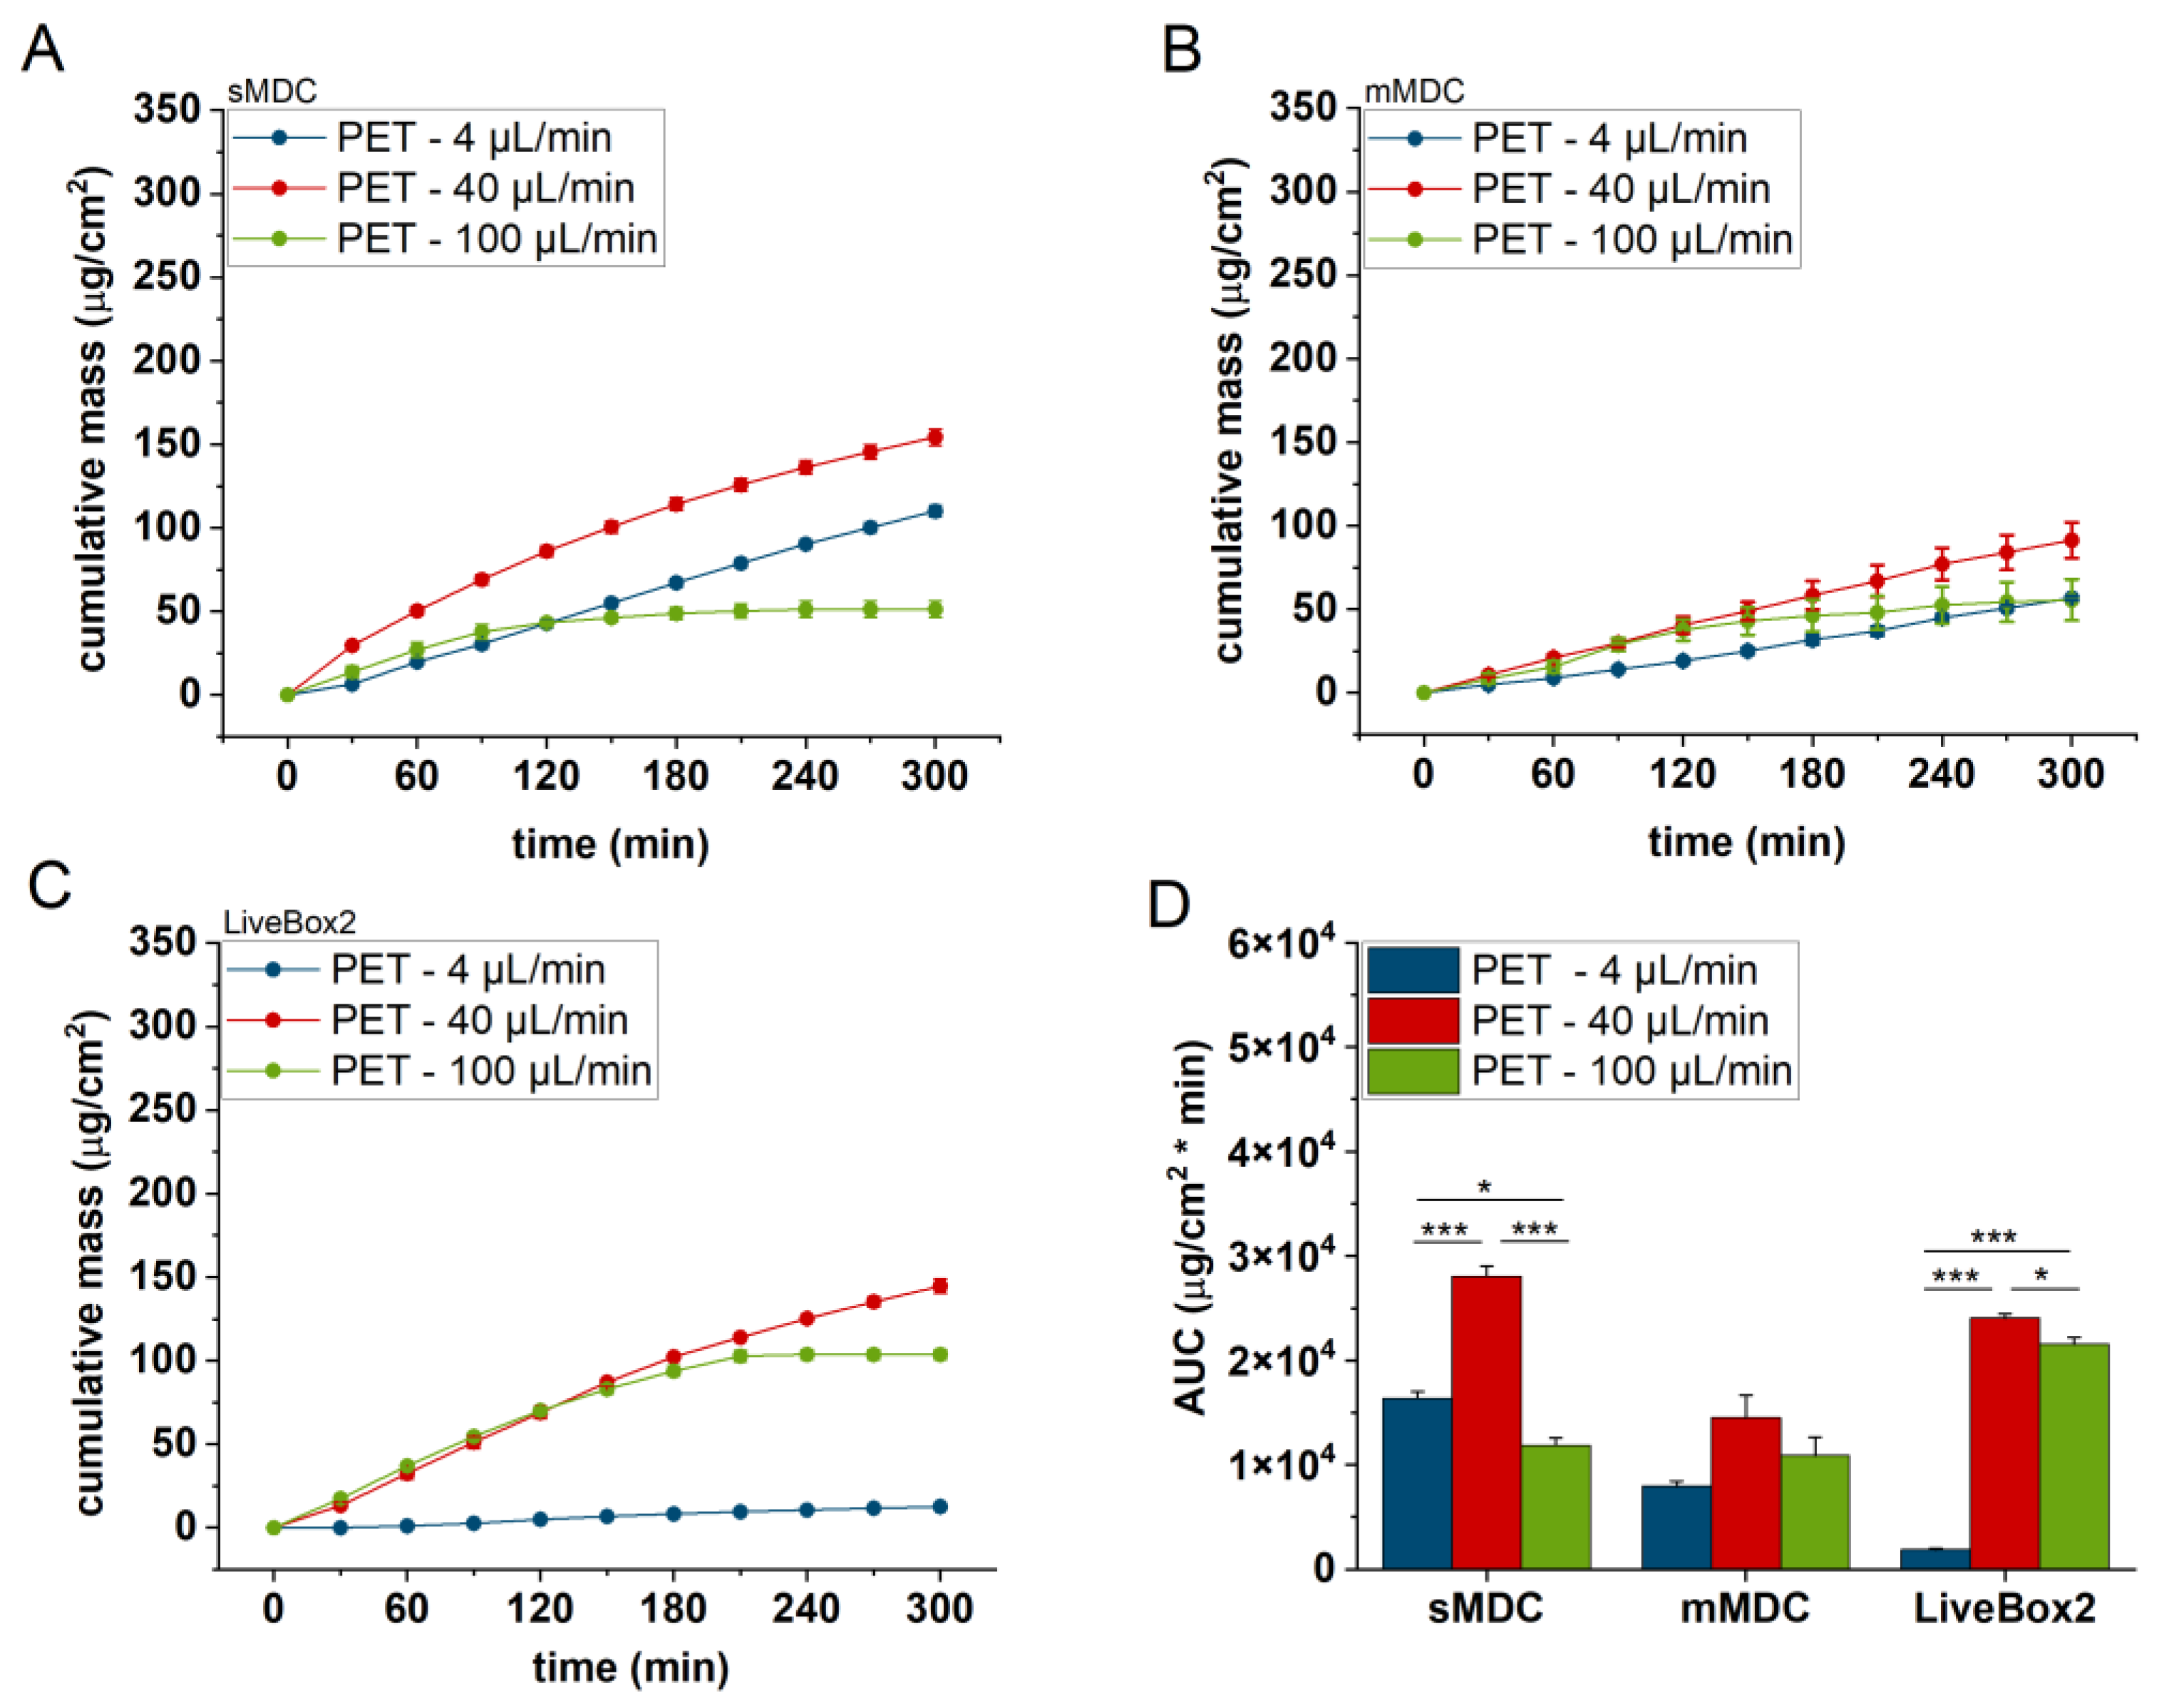
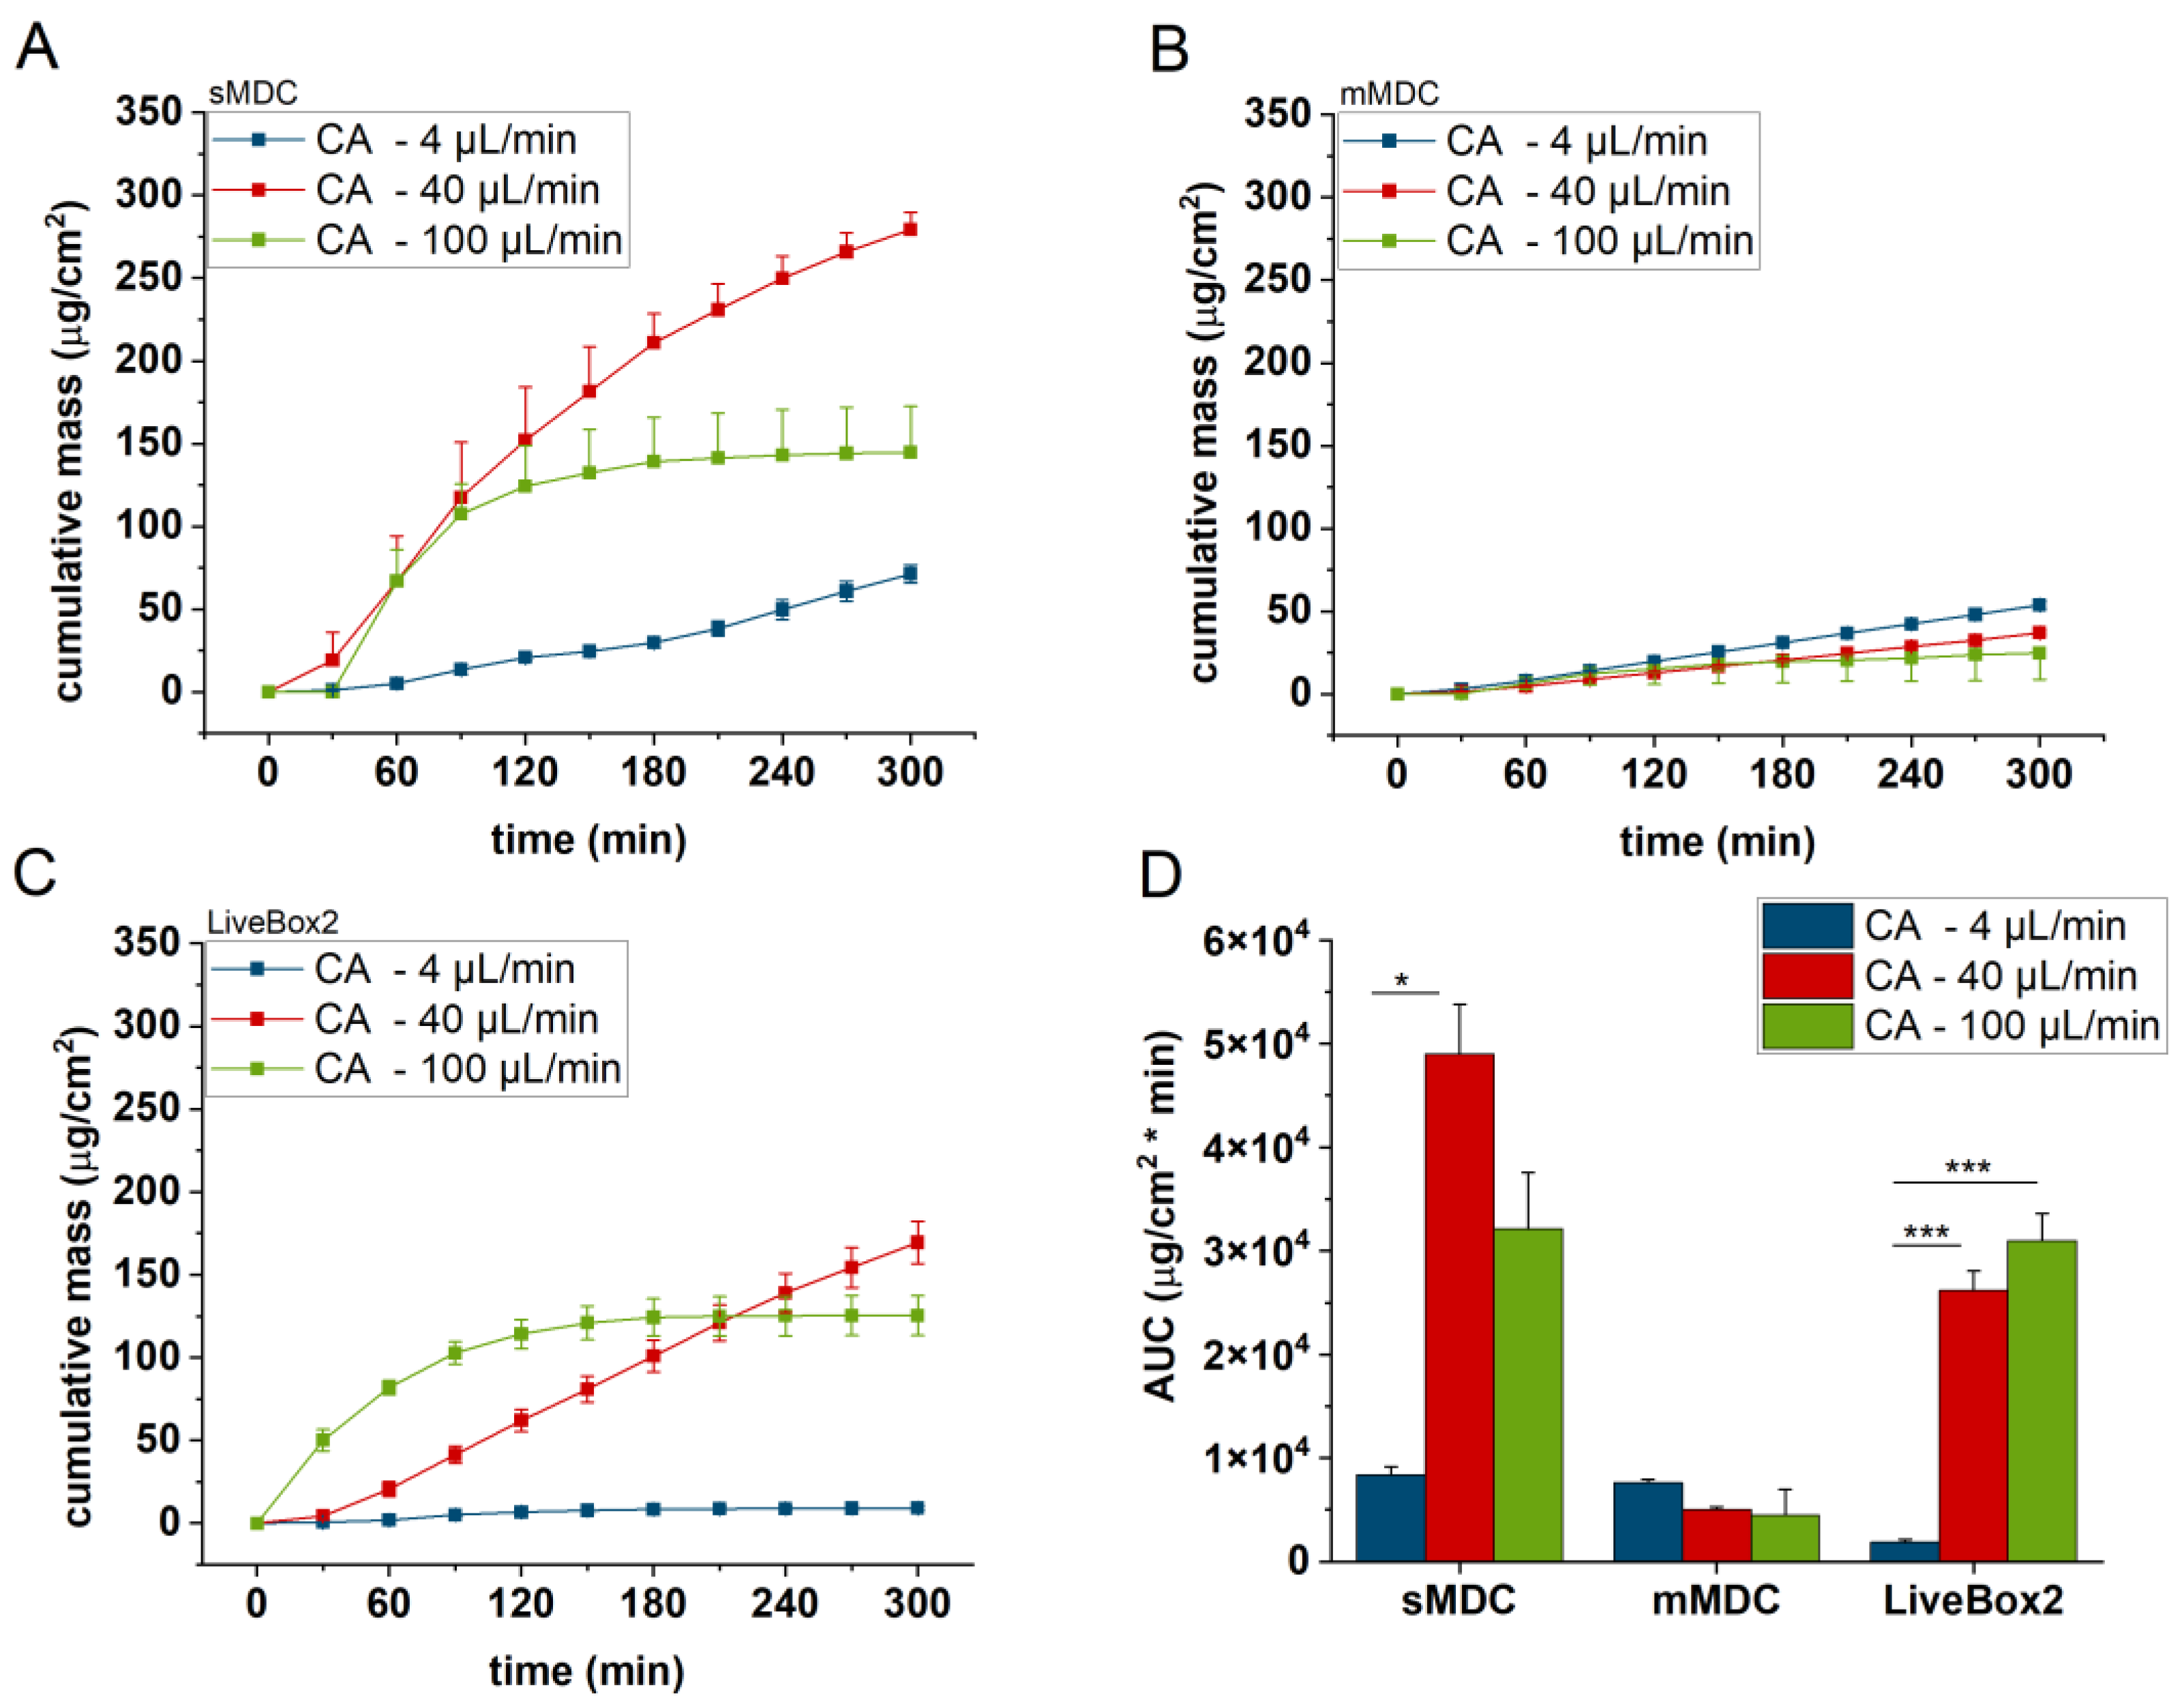
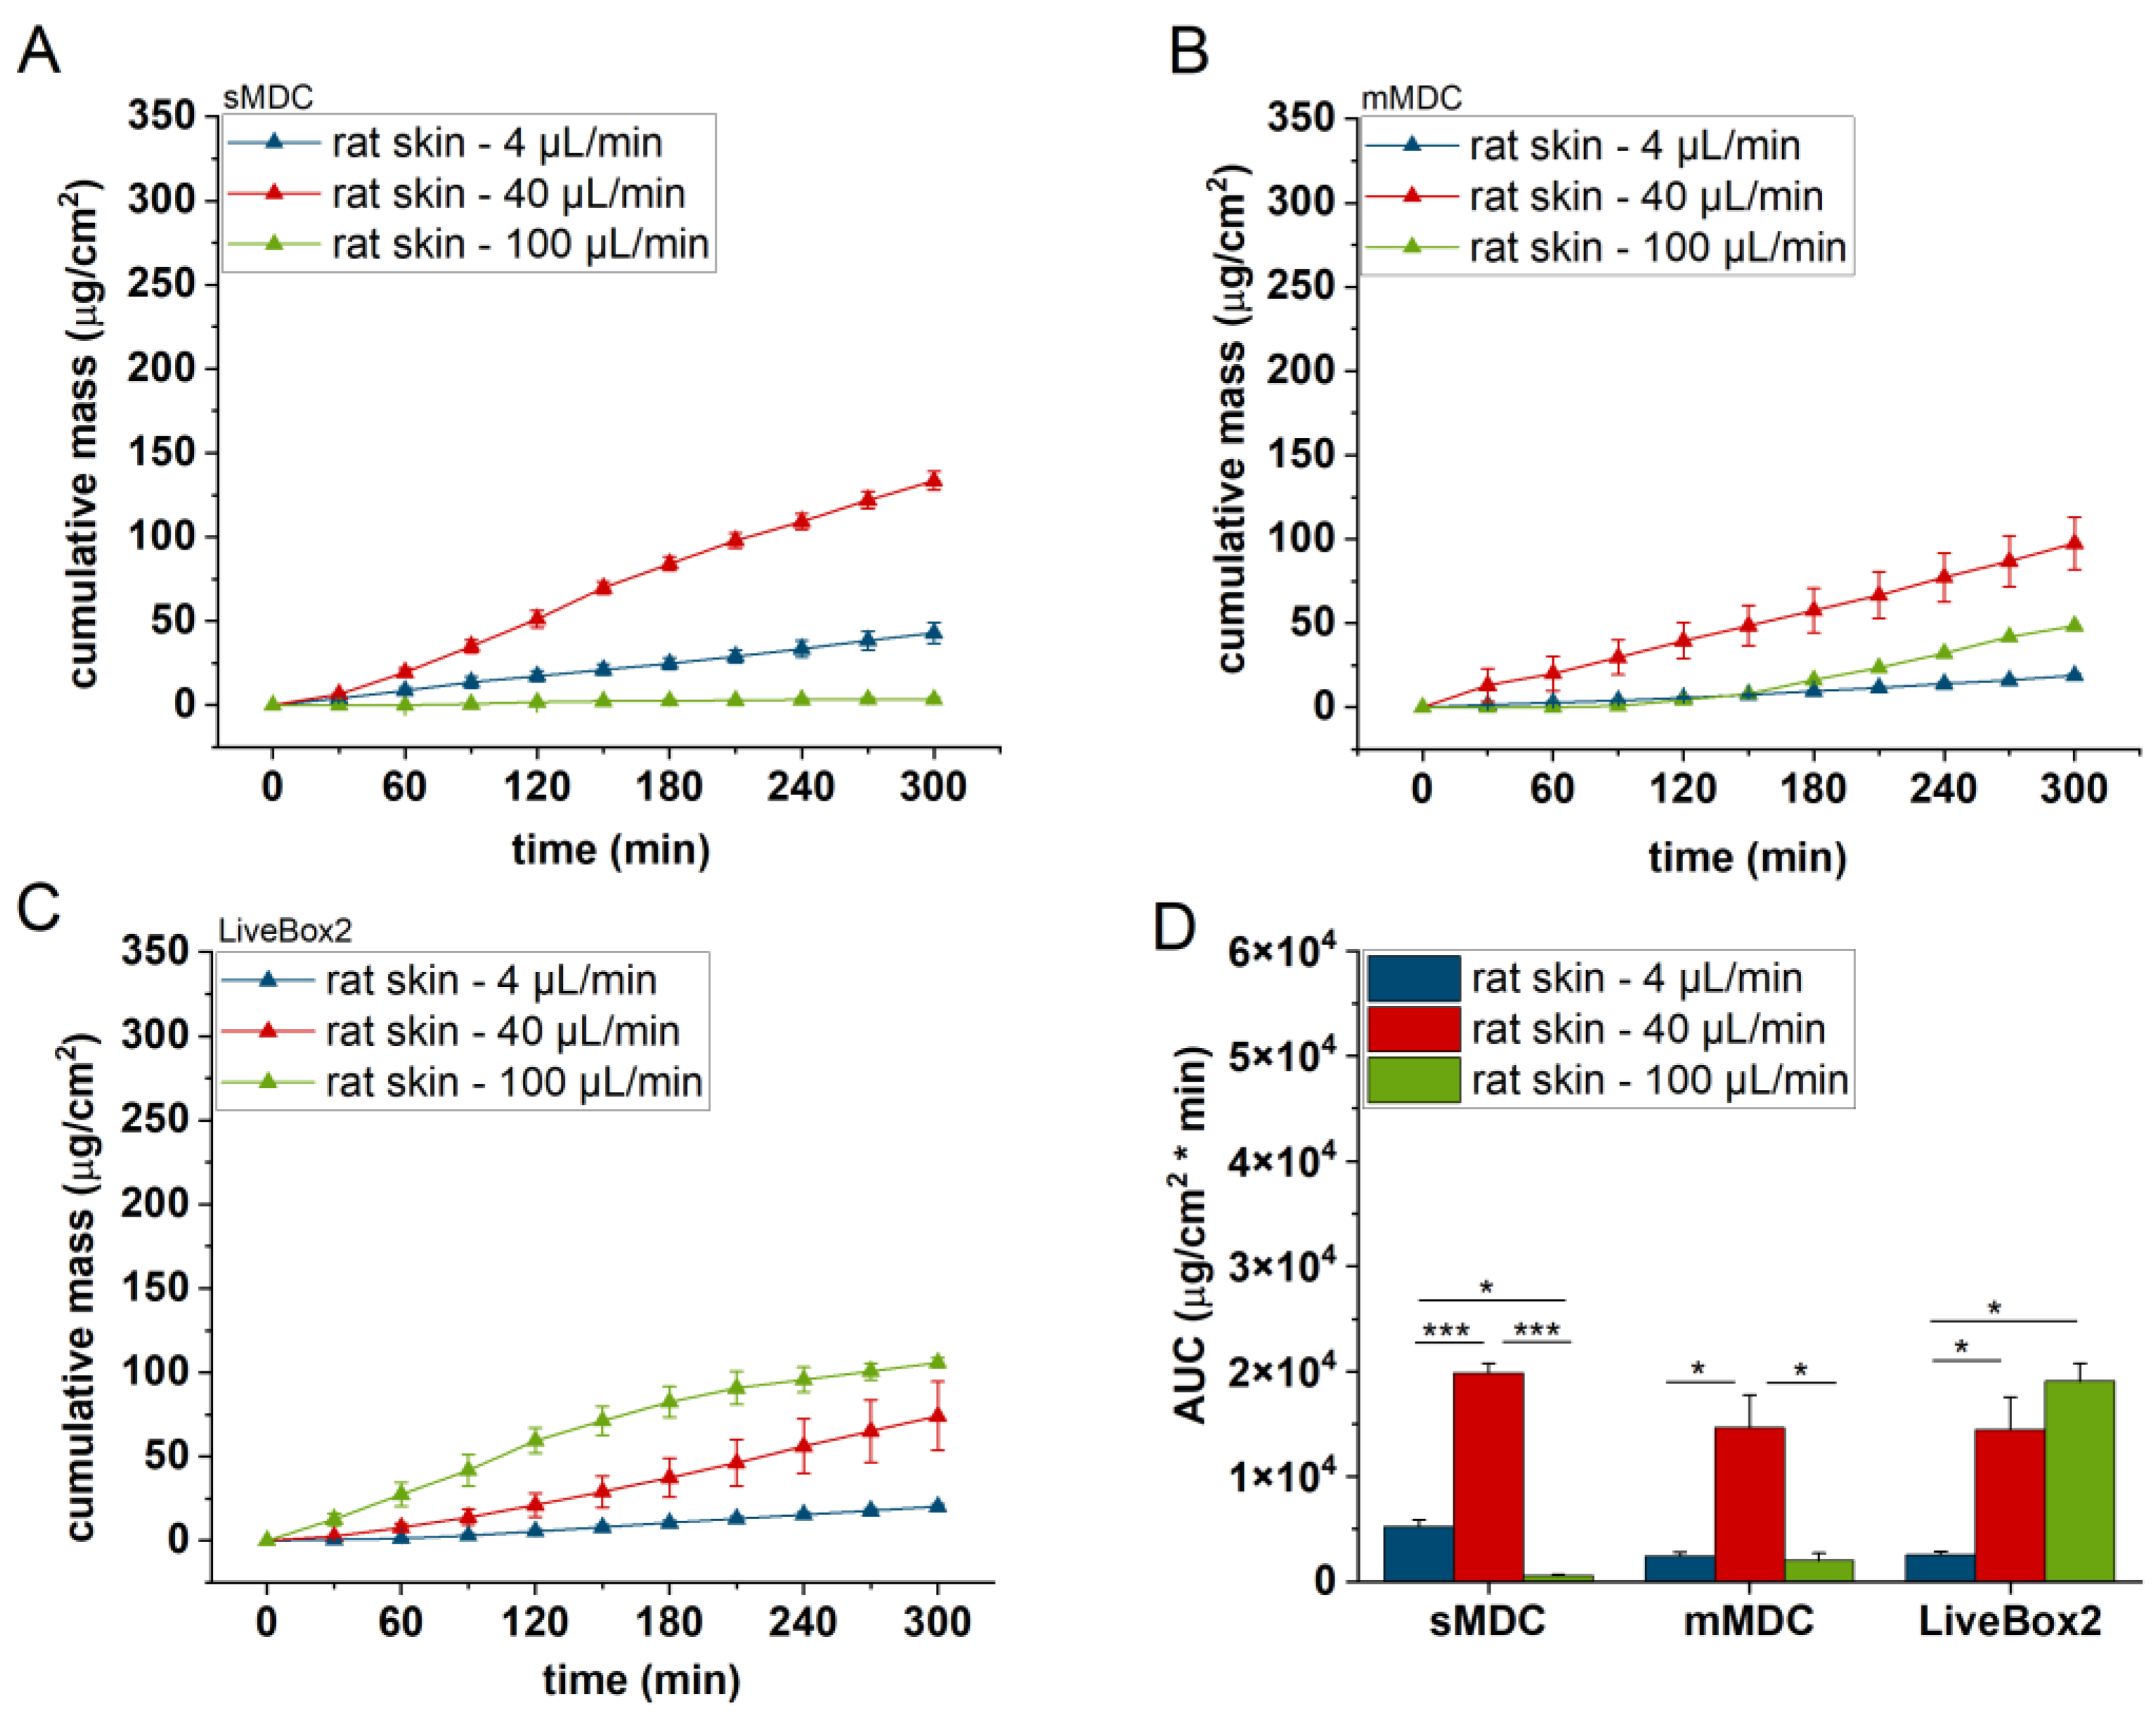
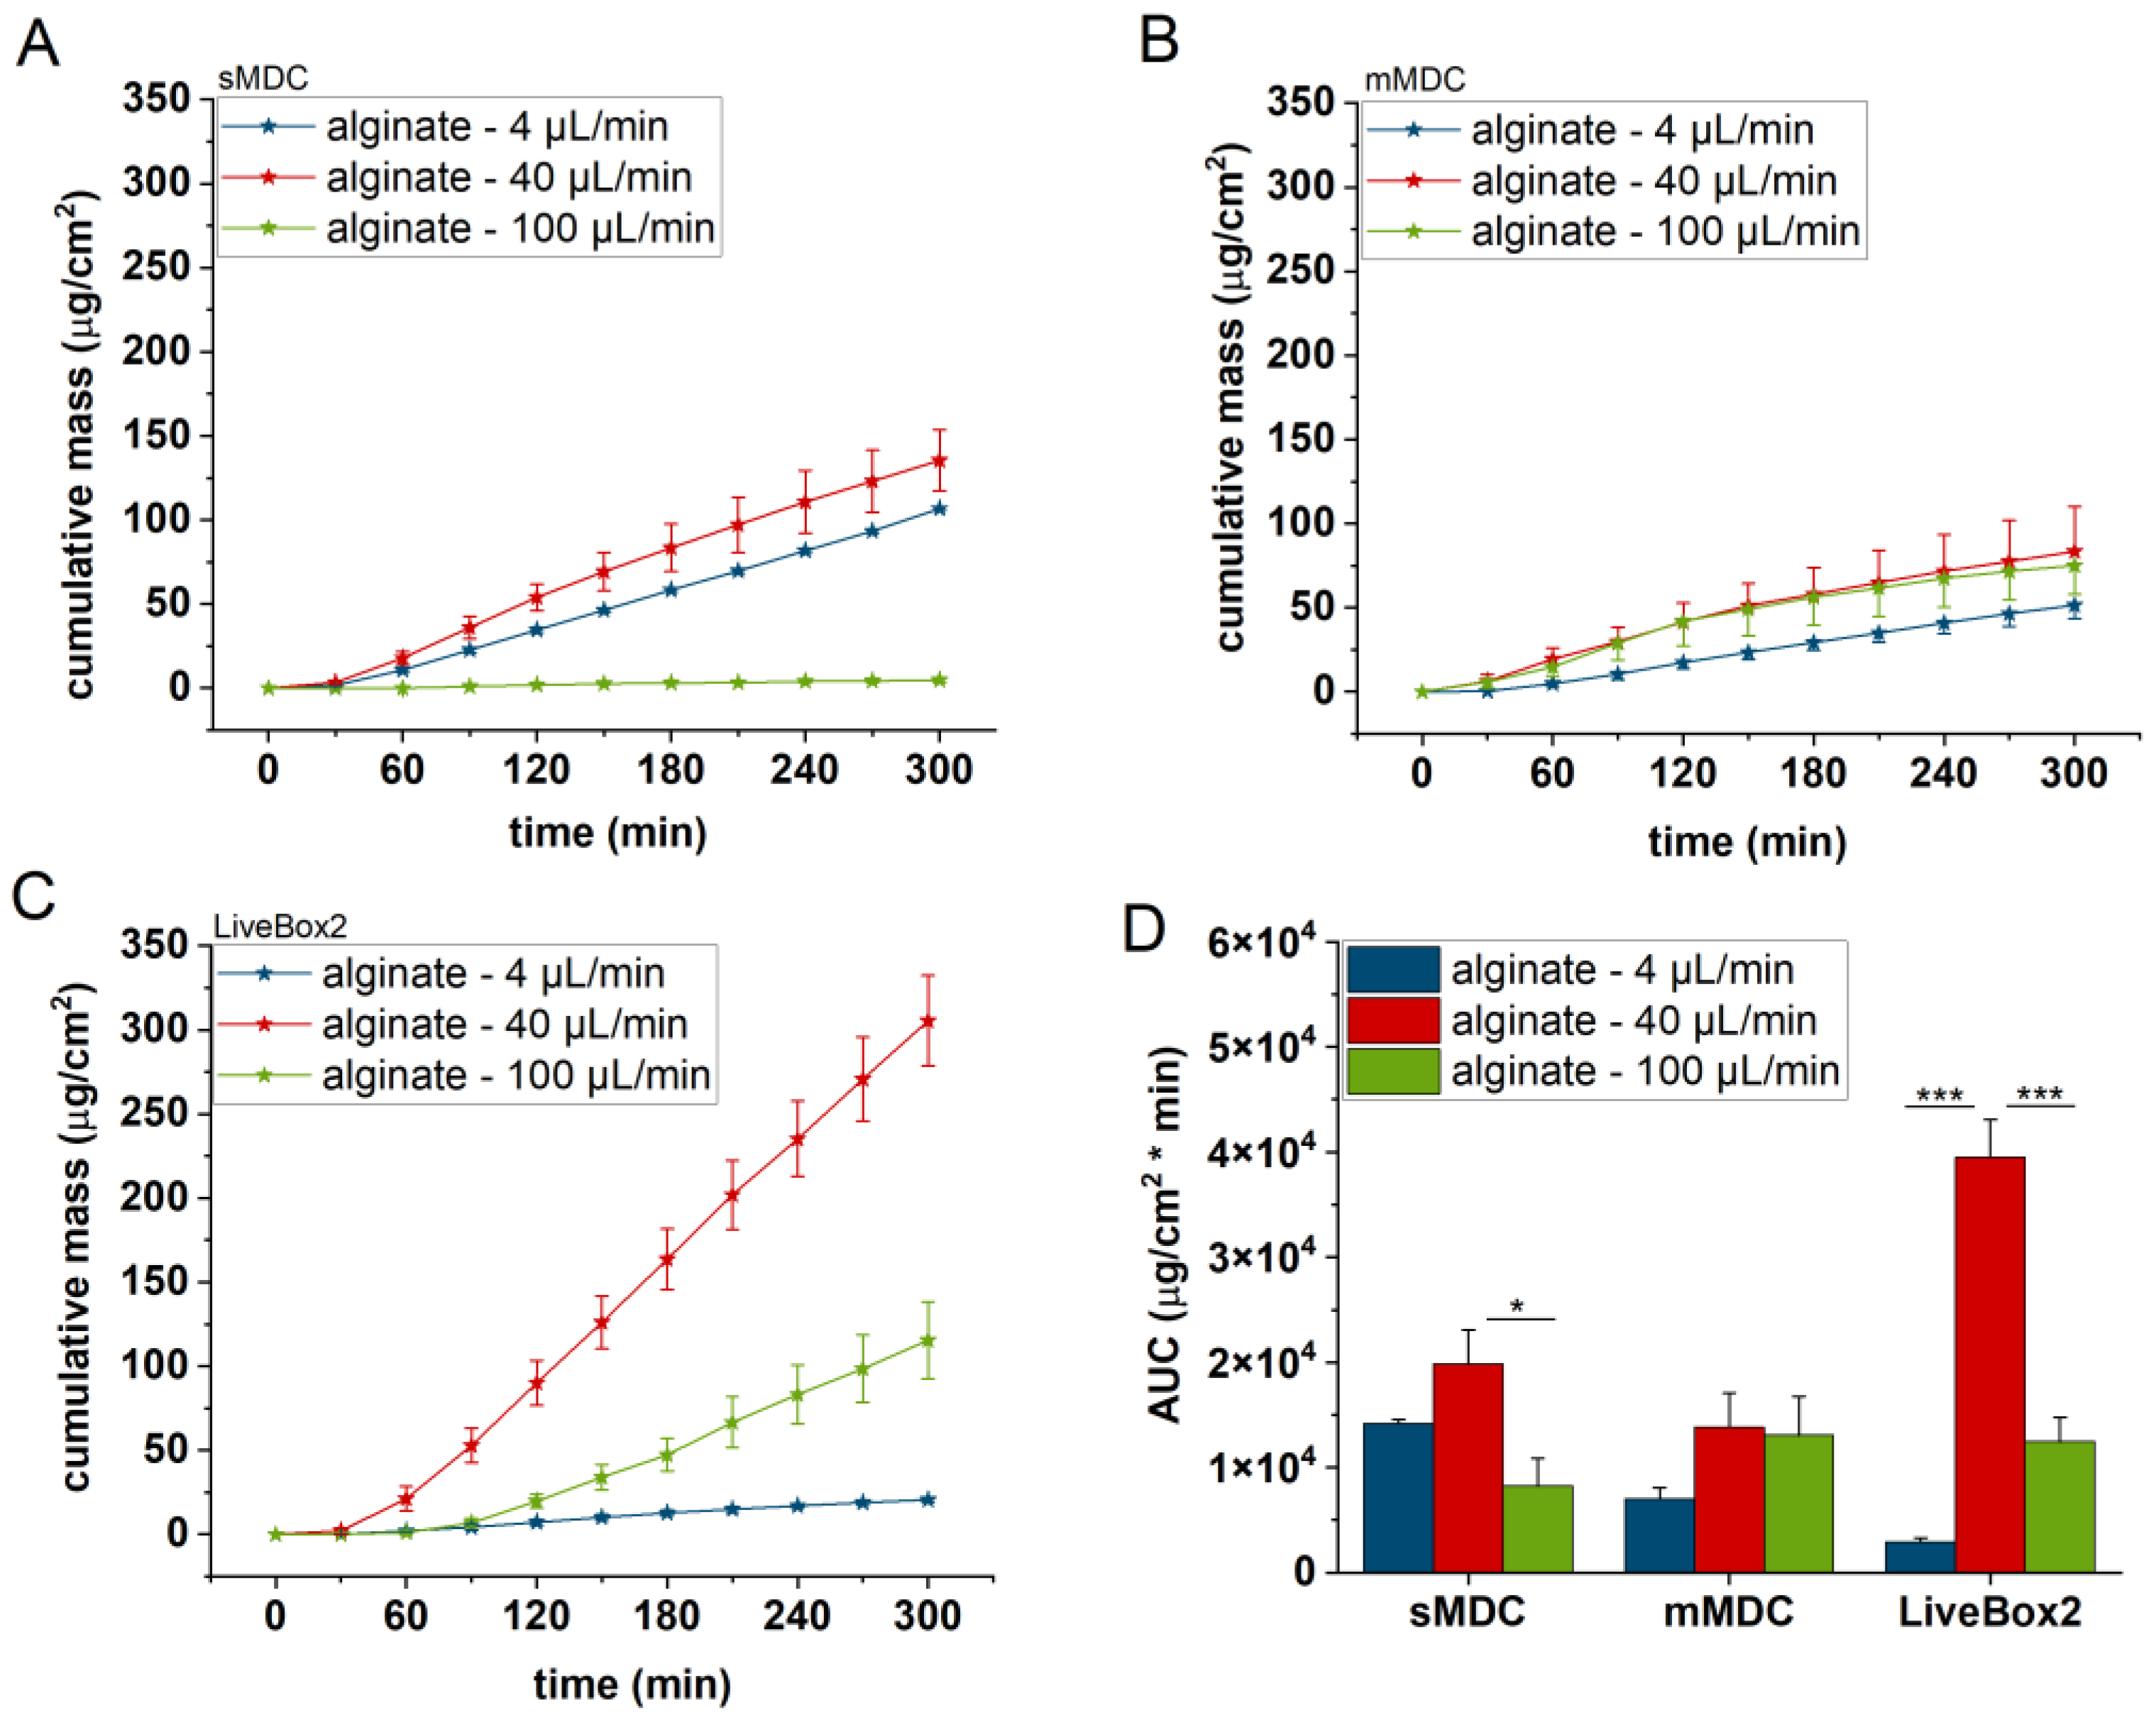
The release and diffusion of caffeine from the cream formulation and across the diffusion platforms (PET and CA membranes, excised rat skin, and alginate scaffold) were investigated at three different flow rates (4, 40, and 100 µL/min) for 5 h. Three diffusion chambers were compared (sMDC: single-channel microfluidic diffusion chamber, mMDC: multi-channel microfluidic diffusion chamber, and LiveBox2). The cumulative mass–time profiles are displayed in
Figure 5,
Figure 6,
Figure 7 and
Figure 8.
Figure 5 displays the caffeine permeation profile across the polyester (PET) membrane in different setups: sMDC, mMDC, and LiveBox2. Across all setups, permeation at 40 µL/min was the highest (AUC was 1.7-, 1.8-, and 12.9-fold compared to the 4 µL/min flow rate in sMDC, mMDC, and Livebox2, respectively). However, at a flow rate of 100 µL/min, permeation decreased compared to the flow rate of 40 µL/min. In
Figure 6, the permeation profile of caffeine through the cellulose-acetate membrane is depicted. The total penetrated caffeine amount was markedly higher in sMDC and LiveBox2 at a flow rate of 40 µL/min than at 4 µL/min (AUC was 5.9-fold and 13-fold, respectively). This increase was attributed to the low caffeine concentration in the receptor chamber at higher flow rates, leading to an elevated concentration gradient that facilitated drug diffusion. Despite a greater concentration difference at a 100 µL/min flow rate, the cumulative mass increased only in the LiveBox2 system, although the difference was not statistically significant. The absorption parameters of caffeine through rat skin, as shown in
Figure 7, were lower compared to the previous barrier models (e.g., PET and CA membranes). Here, also, a significant difference was observed between the first two flow rates (4 and 40 µL/min) in all setups, but the total penetrated caffeine decreased at 100 µL/min.
Figure 8 depicts the results obtained with the alginate scaffold. The highest caffeine levels were recorded at 40 µL/min (AUC was 1.4, 2, and 16 times greater than at the lowest fluid velocity), but they decreased at the highest flow rate.
The LiveBox2 system possessed the highest receptor chamber volume, leading to the largest disparities in caffeine permeation between the first two flow rates. In contrast, the sMDC was designed with a considerably smaller volume, resulting in less pronounced differences between results at 4 µL/min and 40 µL/min. Similarly, in mMDC, where the chamber size was the smallest, the differences in the penetration profiles were less prominent.
Significant variations were observed among barrier models, too. In sMDC, the highest penetration rate occurred in the CA membrane, followed by PET, alginate, and excised rat skin. In LiveBox2, the highest permeability was in the alginate scaffold, followed by the CA membrane, polyester membrane, and rat skin. Conversely, in mMDC, all barrier models exhibited similar ranges of drug penetration.
Based on the penetration results, the molecular diffusion greatly depended on the geometric design of the microfluidic device. In the case of the single-channel device, for the PET and CA membranes and also the rat skins, the 40 μL/min flow rate produced the highest diffusion, while, in LiveBox2, the highest flow rate (100 μL/min) led to the most effective diffusion for the CA membranes and rat skin. Thus, similarly to blood circulation, in the LiveBox2 system, the channel diameter was larger than in sMDC and, therefore, the optimal flow rate was faster than in the case of the microchannel systems.
All in all, the medium flow rate (40 µL/min) seemed to be the optimum perfusion velocity in the majority of the diffusion platforms tested in these microfluidic setups. Both the slower and the faster flow rates showed worse diffusion effectivity for caffeine through the barriers. The best barrier was the natural animal skin, which displayed the lowest permeability for the test compound due to the presence of tight junction proteins between the keratinocytes in the epidermal stratum granulosum layer, the presence of active transporter proteins in the skin cells, and the complex extracellular matrix. The CA membrane and alginate produced the highest diffusion (permeability), which peaked with sMDC for the CA membrane and with LiveBox2 for the alginate. In sMDC and mMDC, the microfluidic channels were narrow and the artificial membranes showed hydrophilic characteristics. On the other hand, in the skin, the penetration was more moderate due to the complexity of the natural epidermal/dermal barrier, including the lipid matrix in the stratum corneum, which presented a lipophilic surface, partially active transporters, and tight junctions proteins in the granular epidermis. Caffeine MW, LogP, particle size, viscosity, and the geometry of the device altogether resulted in the best balance for the diffusion at a 40 μL/min flow rate in these devices in almost all cases investigated.
3.3. Computational Fluid Dynamics (CFD)
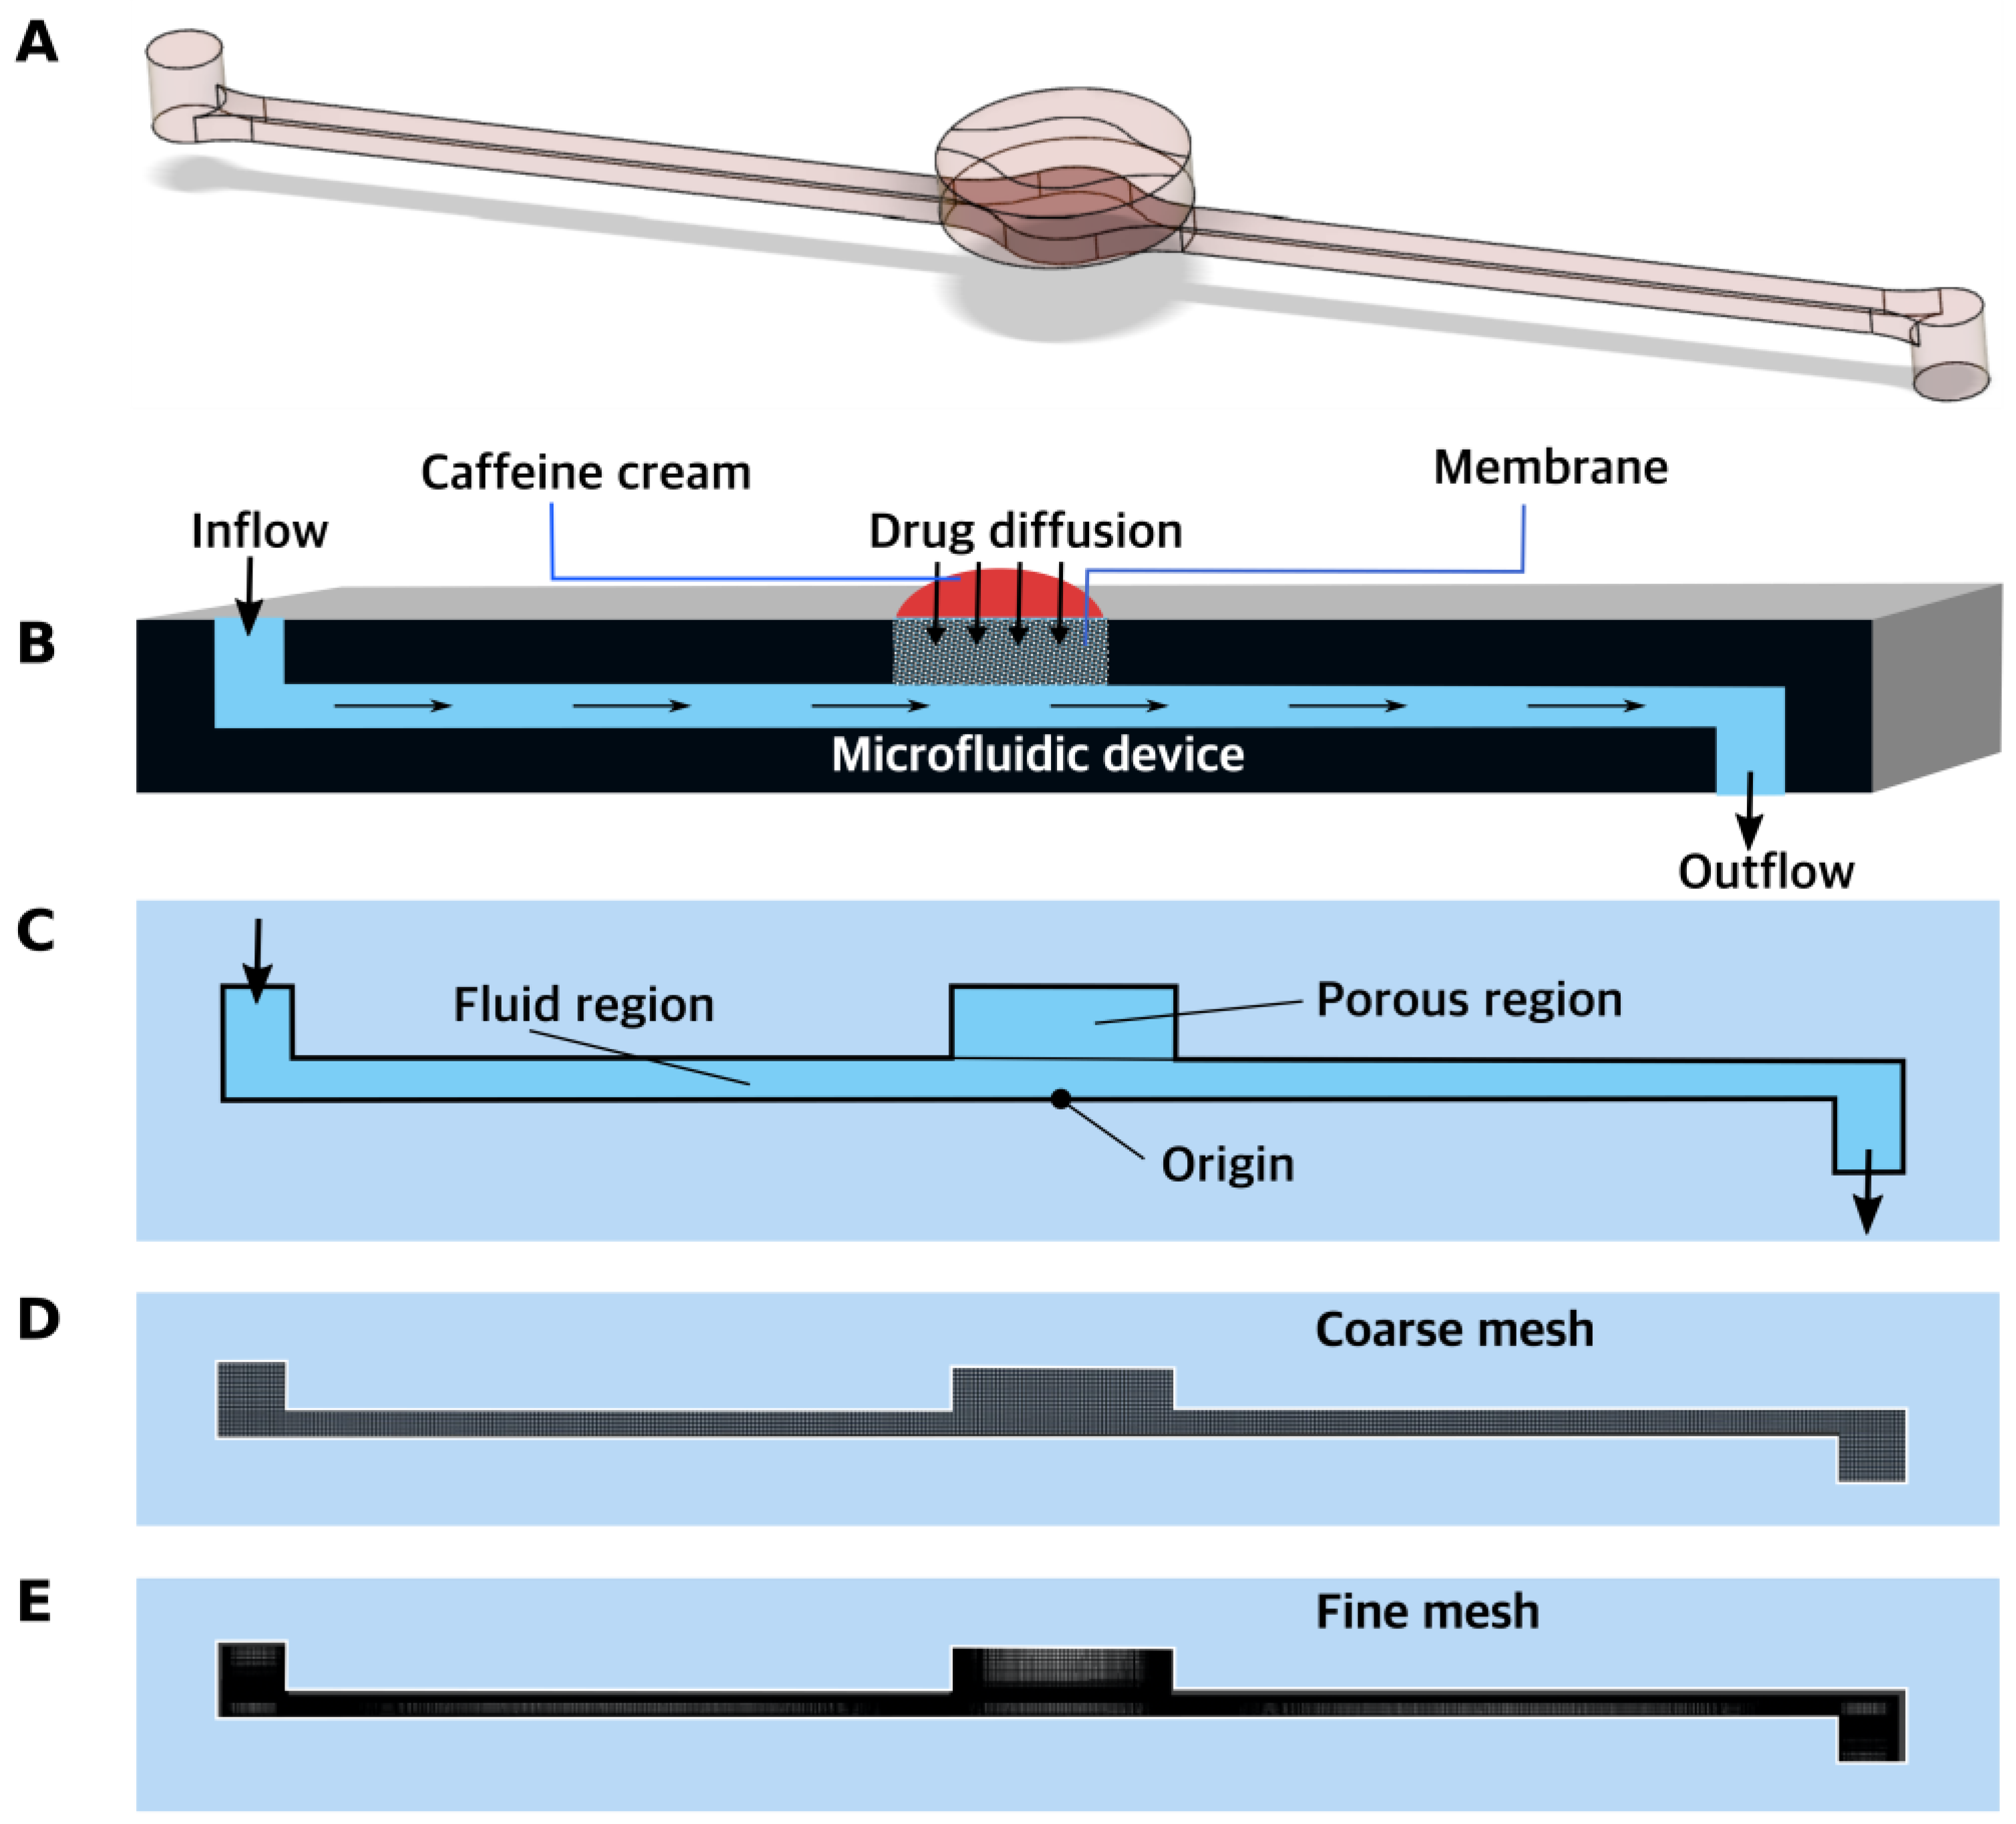
The CFD simulations were only performed for the sMDC microfluidic device.
The results of the simulation included figures depicting the cumulative mass versus time (
Figure S1), non-dimensional velocity profiles (
Figure S2) at various cross-sections along the duct’s length, caffeine concentration contours (Figure 12), and skin wall shear contours (Figure 14). The cumulative mass plots exhibited nearly linear trends after a certain duration, indicating a nearly constant diffusion rate at a steady state (
Figure S1). Lower flow rates required more time to reach a steady state, whereas higher flow rates achieved a steady state within approximately 10 min.
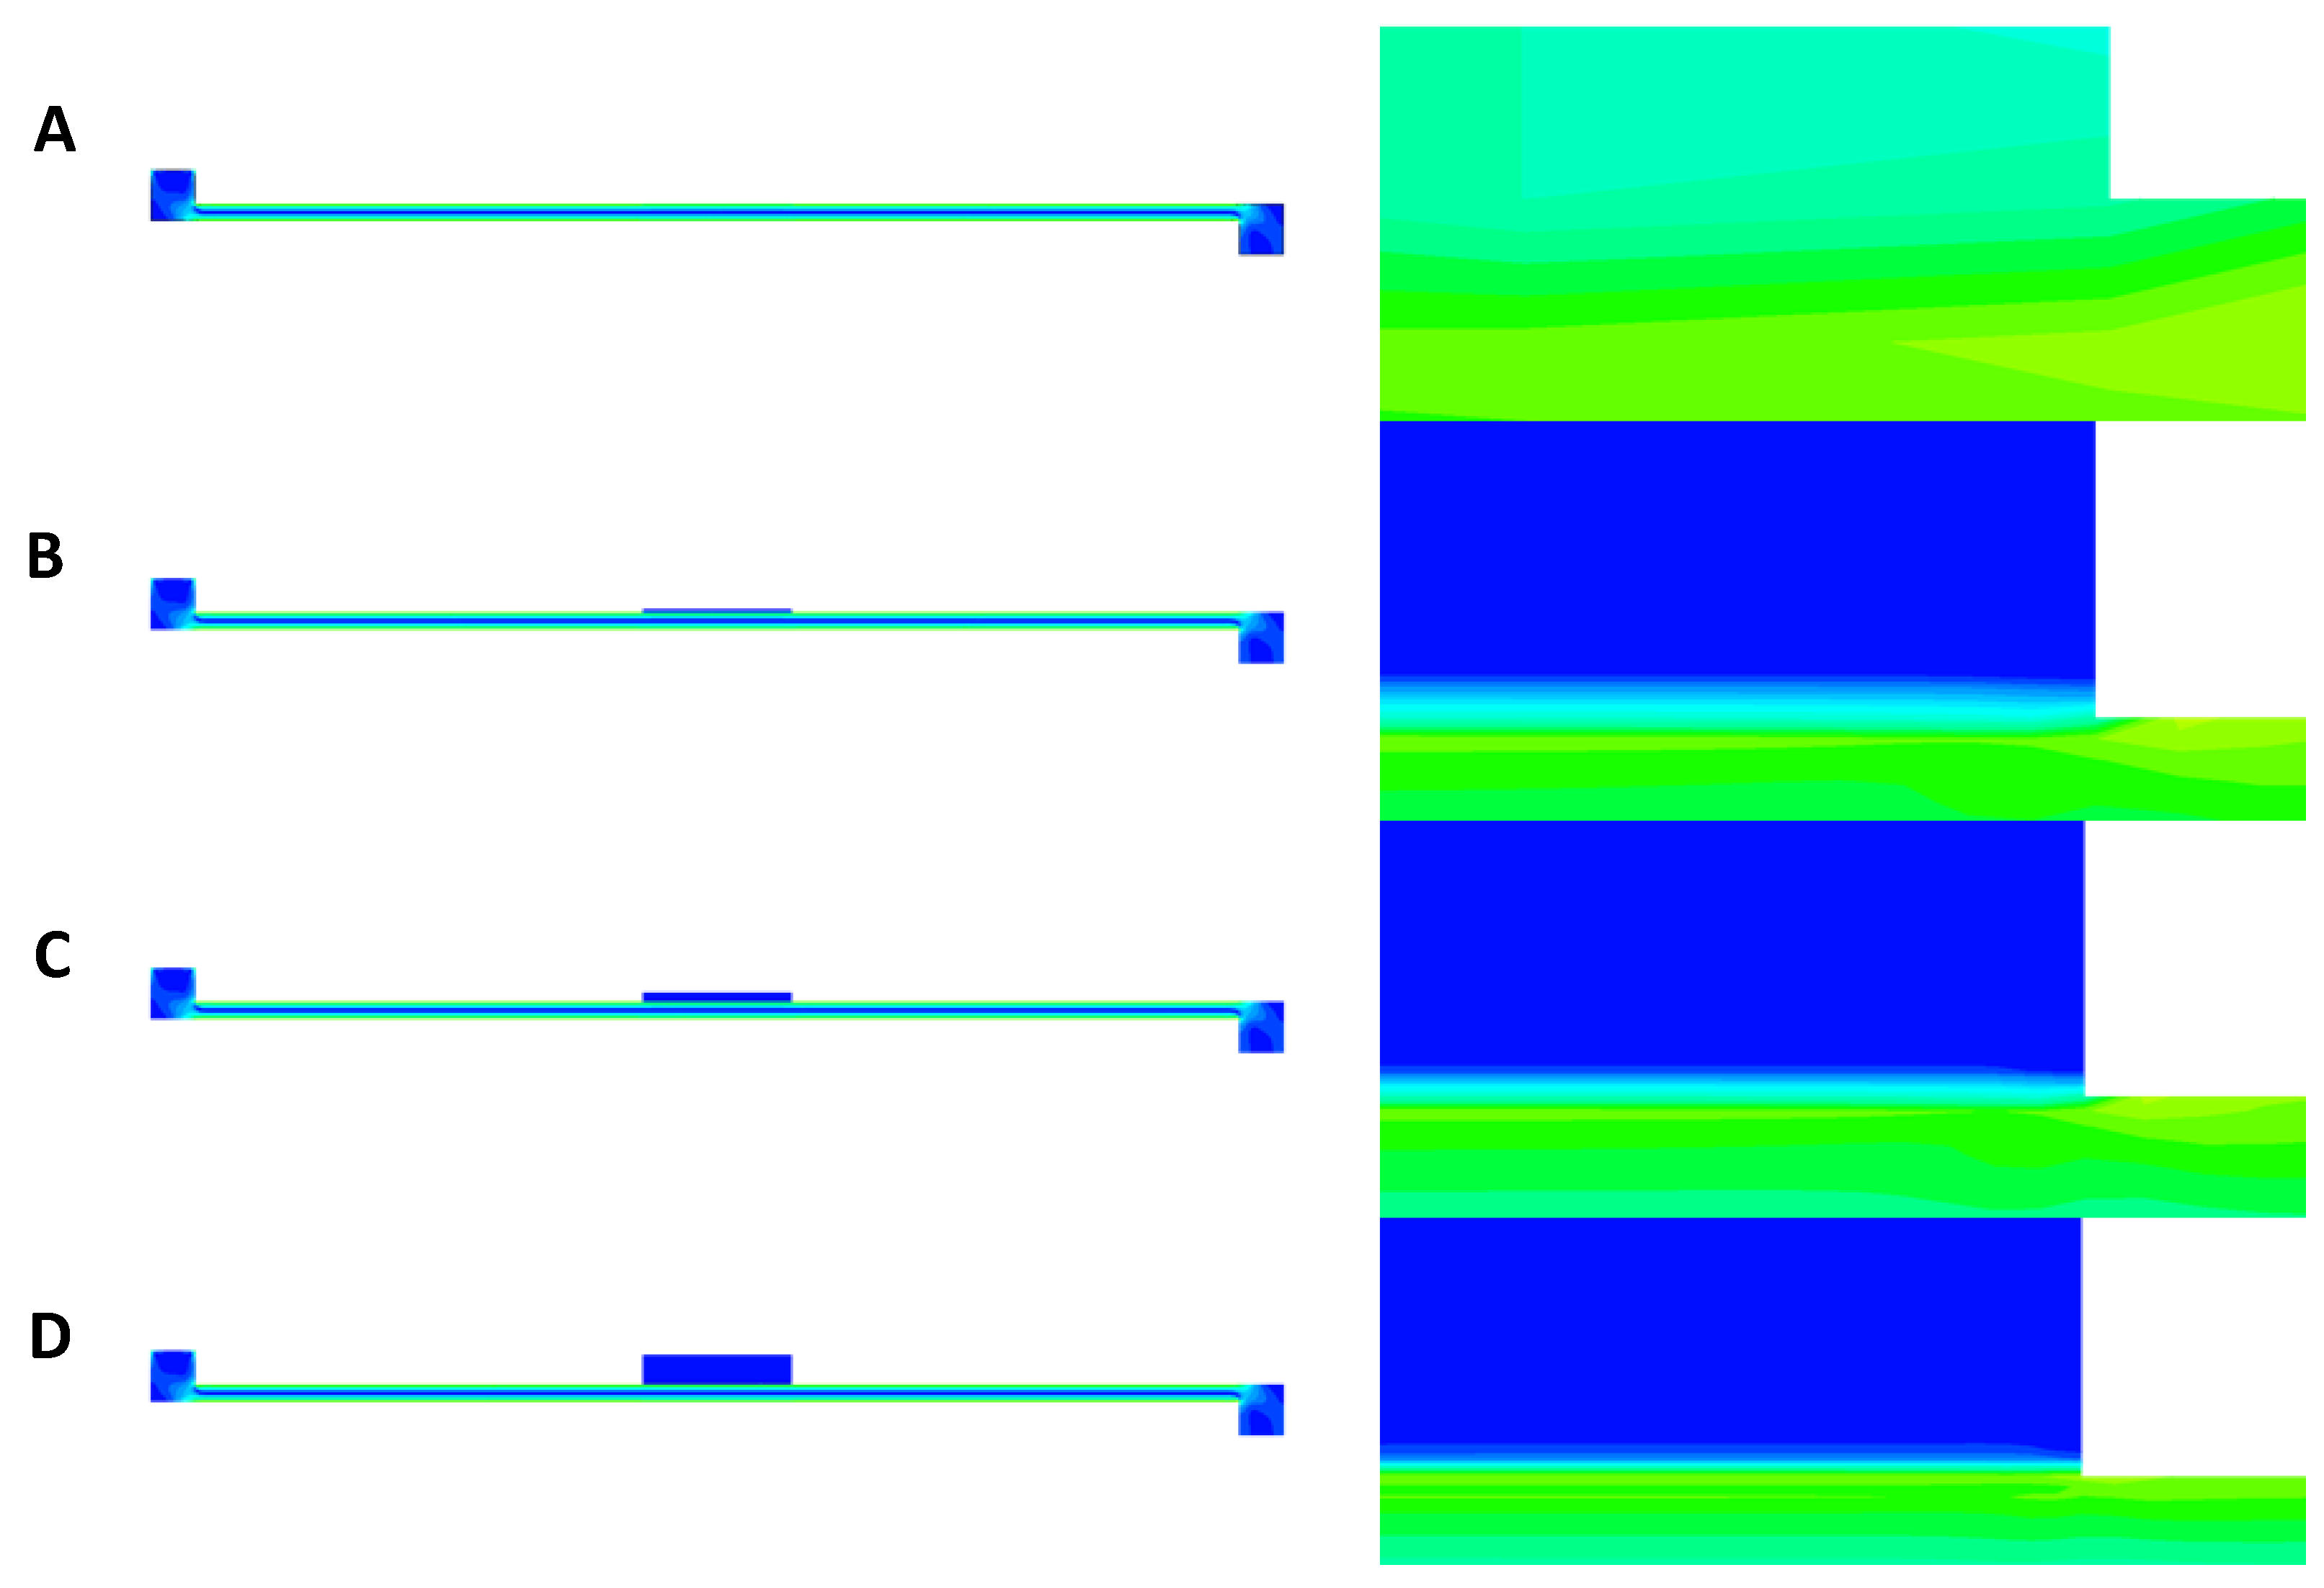
The contours of shear stress at a flow rate of 40 µL/min are presented in
Figure 9A–D for PET, CA, rat skin, and alginate scaffold. In all the figures, some amount of stress concentration near the beginning and end of the membrane can be seen. This can be explained by the sudden change in the cross-sectional area at these regions, which caused the flow profile to change by a small amount. This change resulted in stress being concentrated in these regions. It can also be observed that only the base of the membrane suffered shear stress (
Figure 9B–D), which was because that was the only surface exposed to the flow of PPF owing to the low permeability of the membranes [
25]. However, due to the very low thickness of the PET membrane, the shear can be seen everywhere in the membrane in
Figure 9A.
3.4. Shear Stress Profiles of Membranes
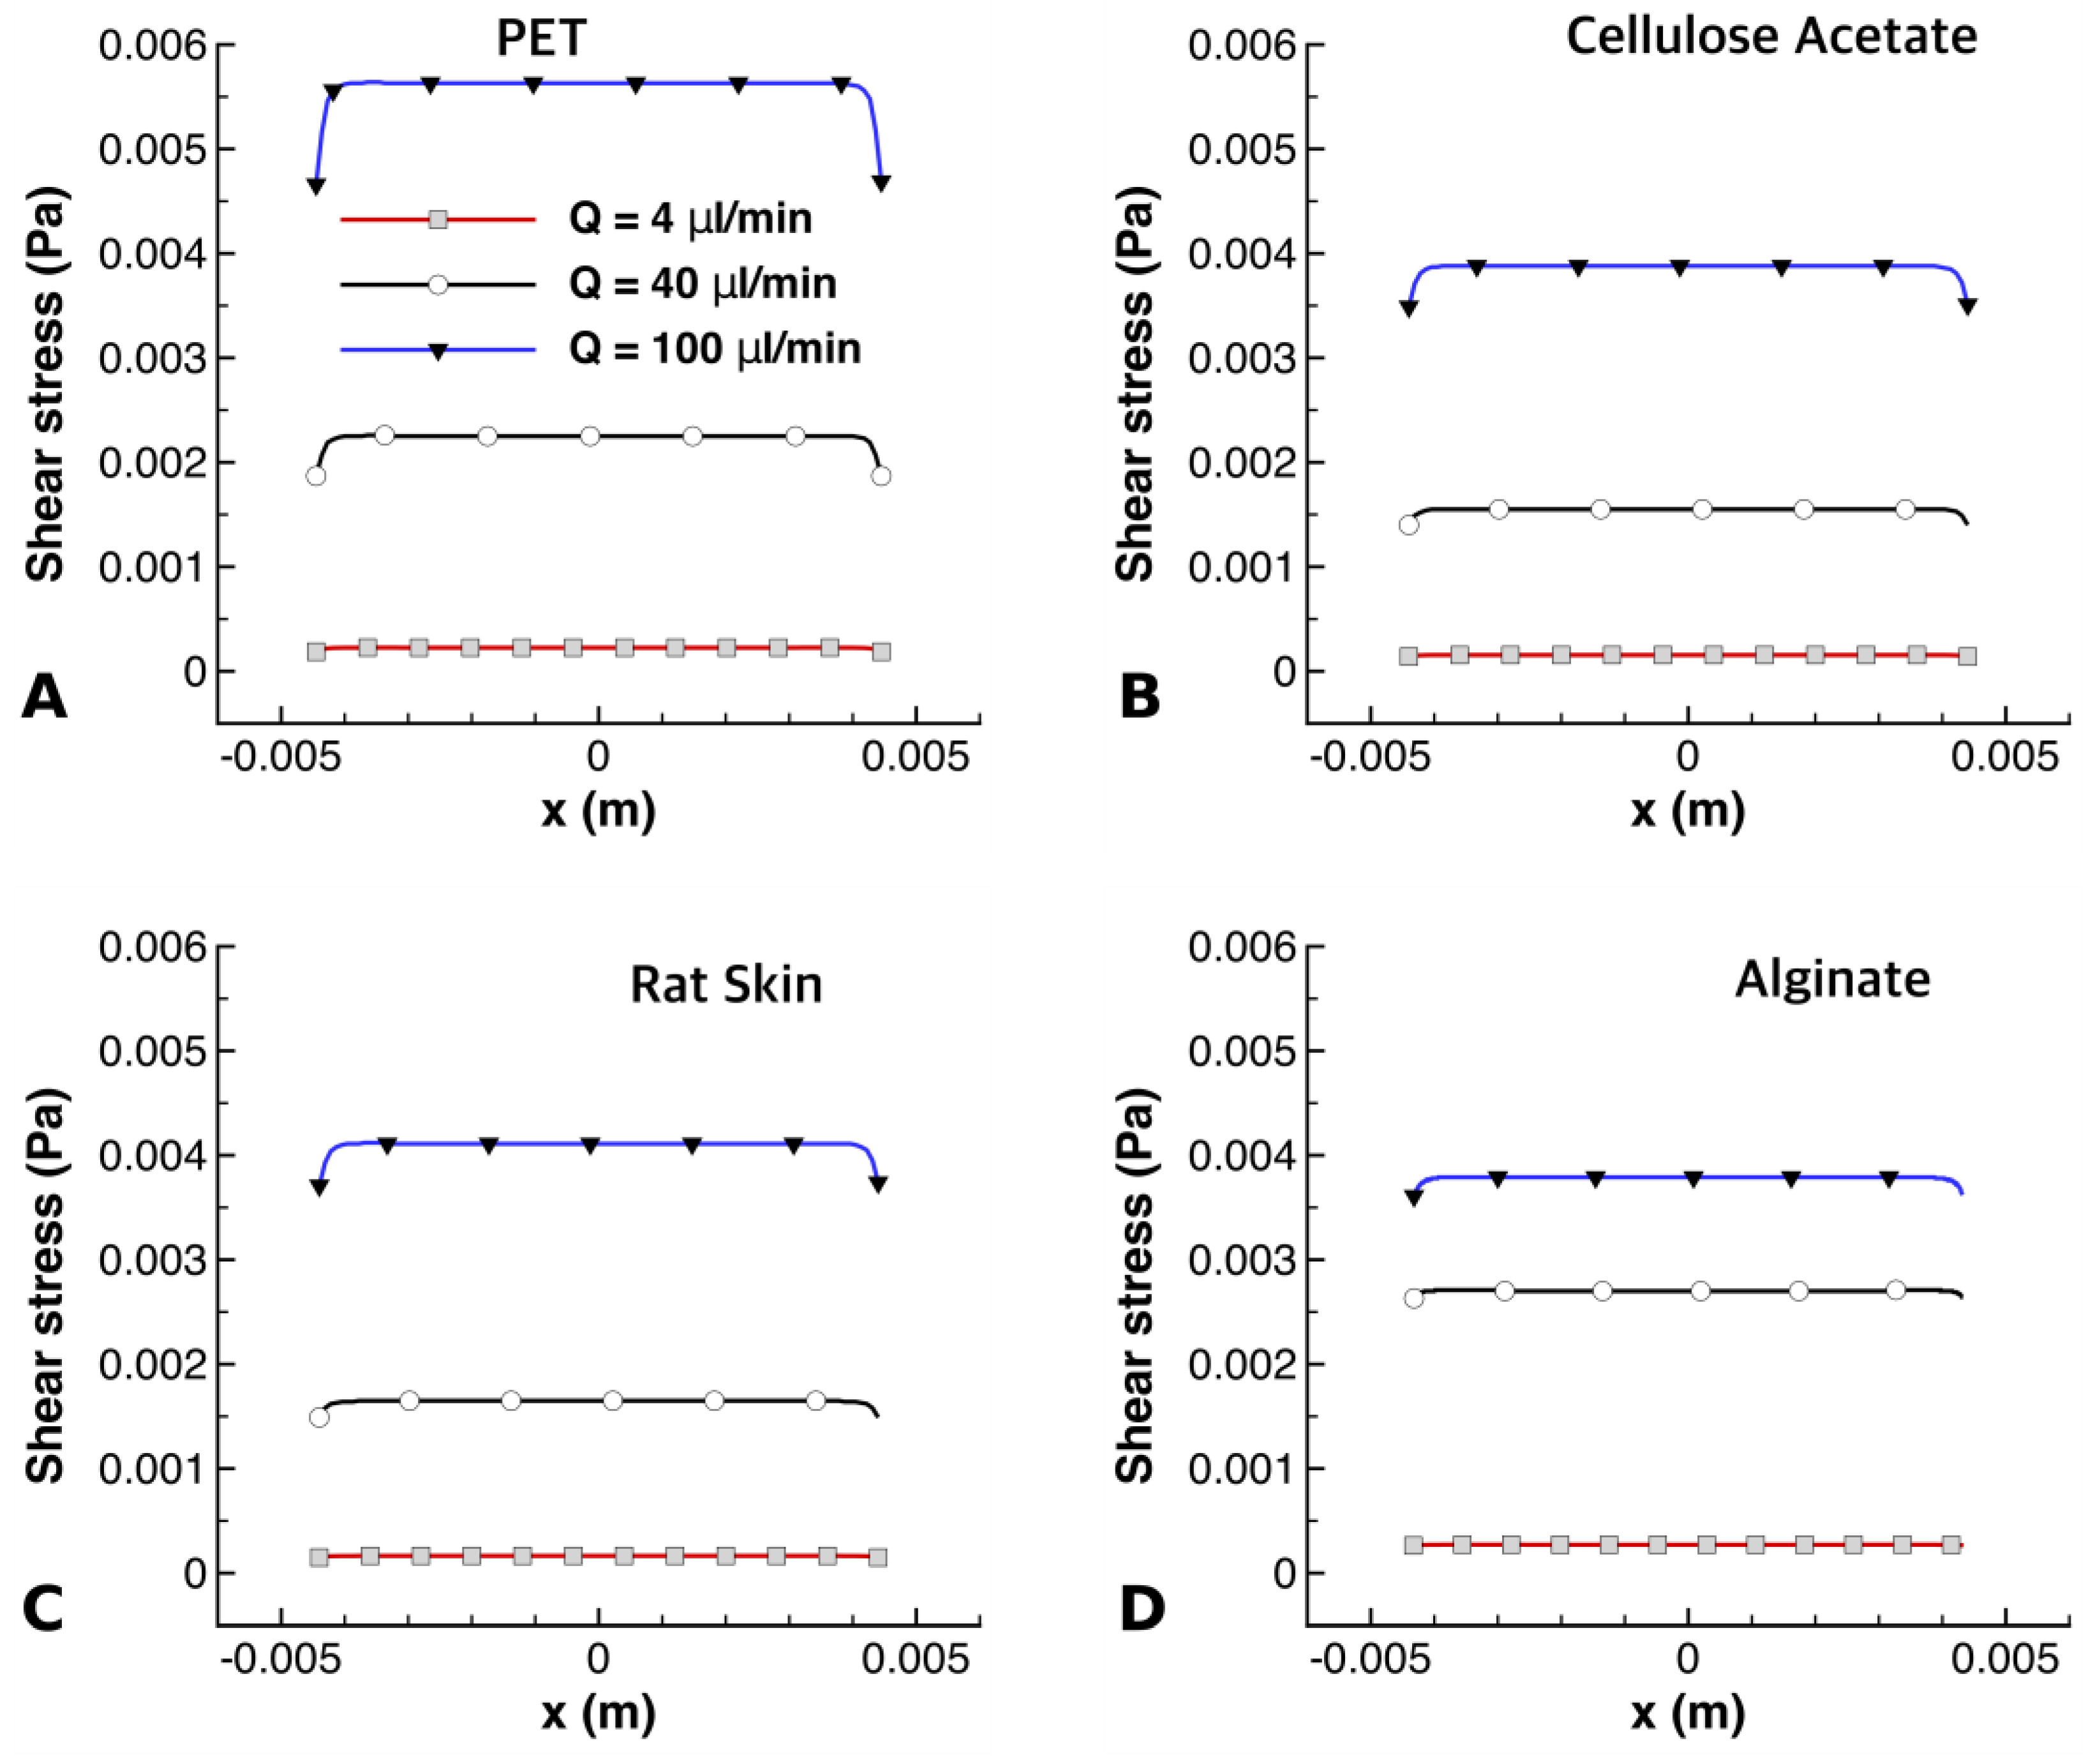
Variations of shear stress along the bottom surface of the PET, CA, rat skin, and alginate scaffold are shown in
Figure 10. It can be seen that the maximum shear stress at different flow rates had different values across the membranes. PET had higher values of shear stress than the other membranes, as seen in
Figure 10A; this was due to its low thickness [
25], offering less resistance to shear stress. It can also be observed in
Figure 10A,D that the alginate had the highest shear stress at a flow rate of 40 µL/min, while PET had the highest shear stress at a flow rate of 100 µL/min. Cellulose acetate experienced the least amount of shear stress at all flow rates, which is clearly visible in
Figure 10B.
3.5. Velocity Profiles
The velocity profiles below the various membranes were also calculated in the microchannel of sMDC and the results are displayed in
Figure S2. It shows the non-dimensional velocity profiles along the height of the channel at different locations below the membranes. The origin was taken to be in the middle of the channel at the bottom wall. The velocity profiles were then plotted at the symmetrically opposite points: x = ±0.02 m indicated points nearly midway between the inlet and membrane and the membrane and outlet; x = ±0.00445 m indicated the beginning and end of the membrane; x = 0 indicated the point exactly in the middle of the chamber. The symmetrically opposite points had the same velocity profiles and, thus, they overlapped. The little difference between the profiles at x = 0, ±0.00445 and ±0.02 could be explained by the existence of a membrane that was not a perfect wall and caused the flow to deviate a little from its fully developed profiles. At the same time, the membranes had very low permeability; thus, different membranes did not cause an observable change in the velocity profiles, which can be seen in the very similar profiles for each membrane.
3.6. Velocity Contours
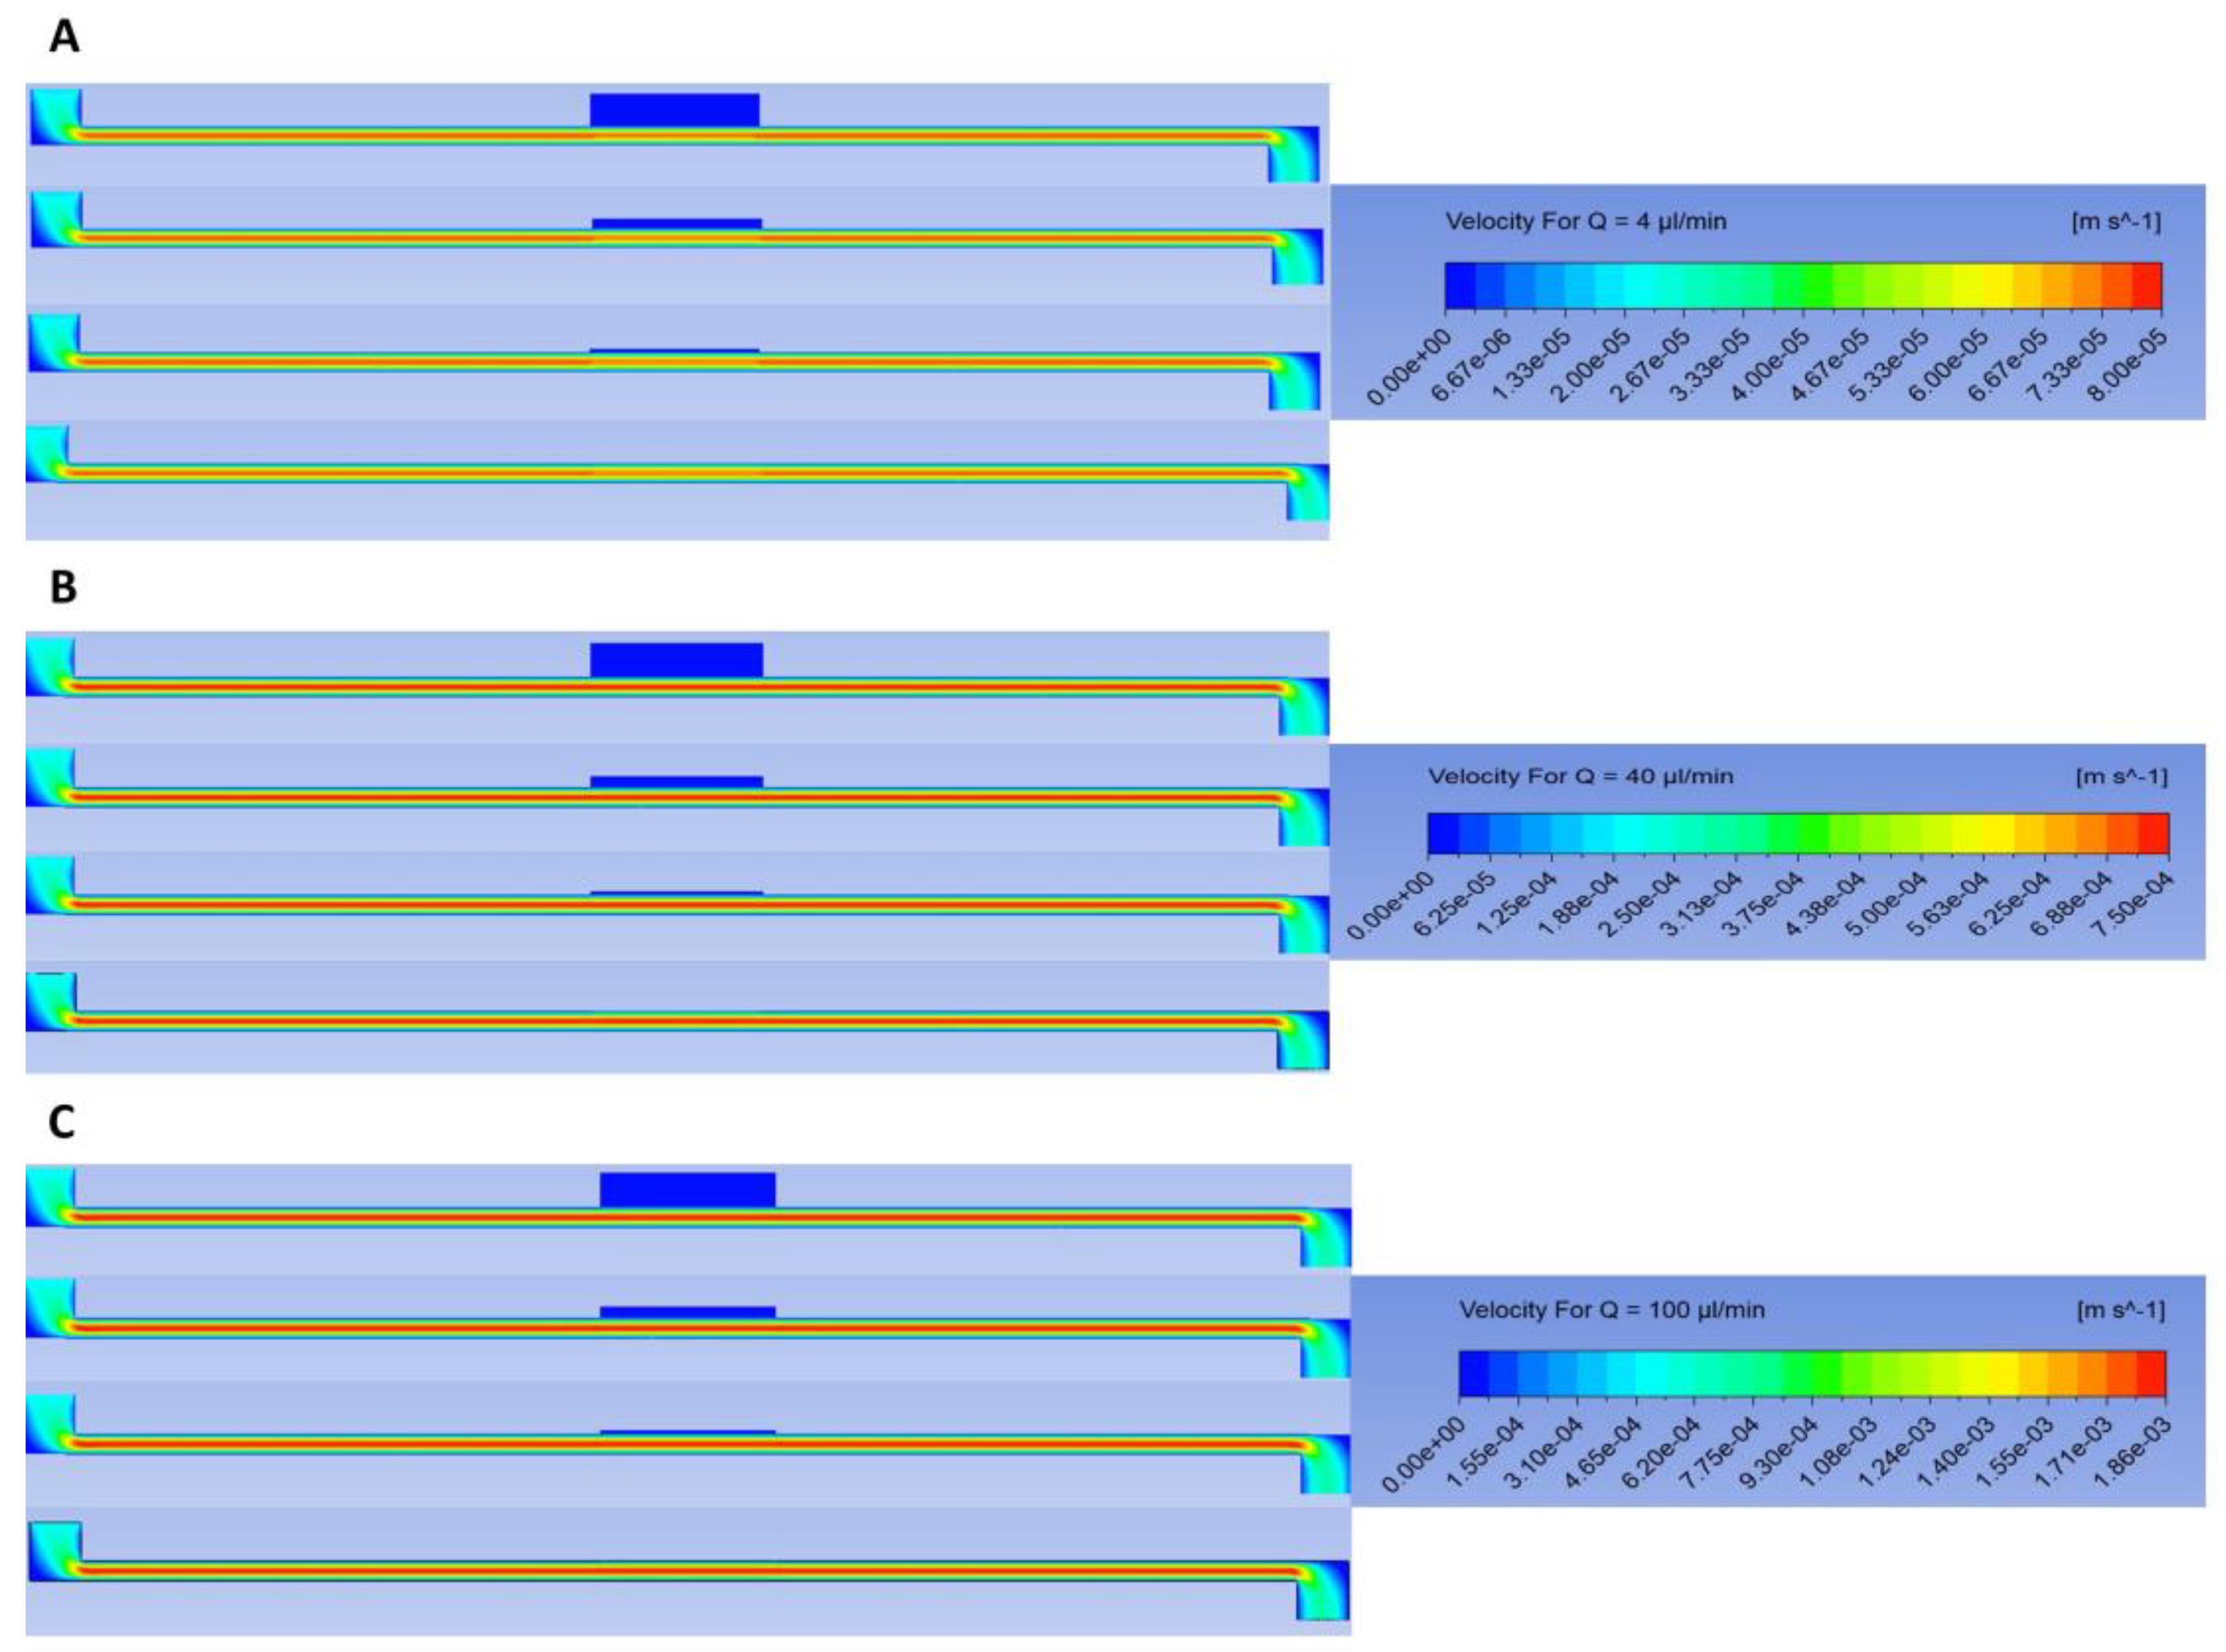
Figure 11A–C show the contours of velocity for different flow rates for all four membranes. We can see that no flow penetrated any membrane at any flow rate. Thus, the flow profile did not change significantly throughout the channel and the contours in the channel were nearly the same for all the membranes at a given flow rate. This can be explained by the fact that the membranes were almost impervious to flow due to their low permeability; thus, flow in the channel behaved similarly to Plane–Poiseuille flow [
26].
3.7. Caffeine Progression
In
Figure 12A–C, the time evolution of drug diffusion through rat skin into the perfusion fluid (PPF) is shown for flow rates of 4 μL/min, 40 μL/min, and 100 μL/min, respectively. At a flow rate of 4 μL/min, the system approached a steady state gradually. For the first 1800 s, almost no mass passed through the outlet, as indicated by the horizontal line in the cumulative mass graph (
Figure 7A) during the initial 30 min. After this period, the system reached a steady state, resulting in a nearly constant mass flux and a linear increase in caffeine accumulation. The concentration profiles were also thicker, as seen in the contours.
At a higher flow rate of 40 μL/min, drug diffusion followed a similar pattern but reached a steady state much faster, in just 200 s (
Figure 12B). A notable thick concentration layer formed on the top wall of the channel due to the higher flow velocities. At the highest flow rate of 100 μL/min, a steady state was achieved in a similar timeframe. However, the concentration remained very low, with barely any mass passing through the outlet, as shown in
Figure 12C.
These results illustrate how flow rate significantly influenced the time to reach a steady state and the concentration profiles in the system. Lower flow rates took longer to reach a steady state but resulted in higher concentrations, while higher flow rates achieved a steady state quickly but with much lower concentrations. The higher concentrations may have been due to the long exposure time for lower flow rates, which allowed more mass of caffeine to accumulate in the flow.
3.8. Three-Dimensional Simulations
Two-dimensional simulation assumed that the channel maintained a constant cross-section throughout the flow. However, in reality, the cross-section changed in the
y and
z-directions near the diffusion area. The effect of the change in the cross-section in the
y-direction is discussed in
Section 3.3 and
Section 3.5 and visible in
Figure 9 and
Figure S2. To examine the impact of the cross-sectional change in the
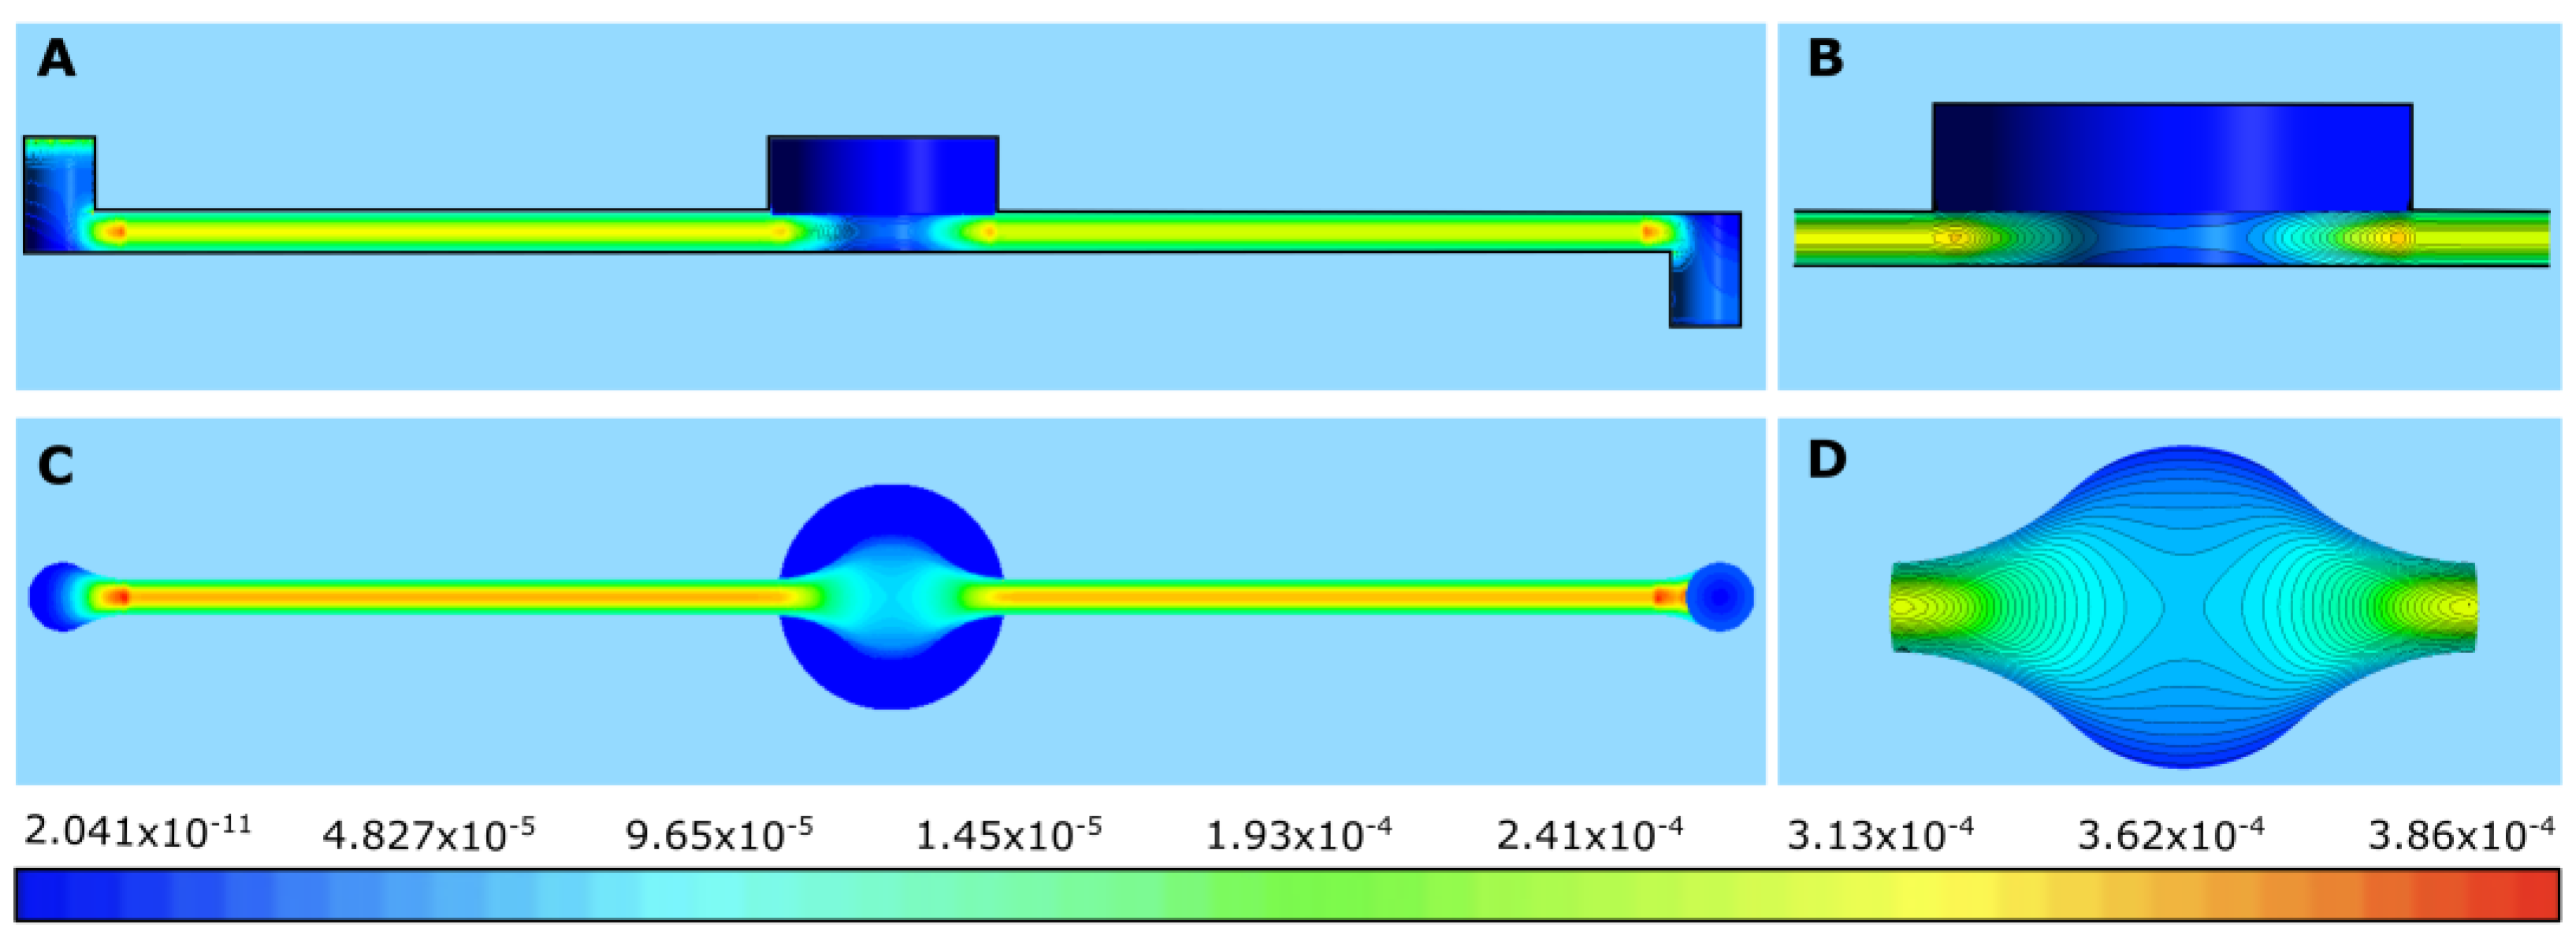
z-direction, 3D results for alginate at a flow rate of 4 μL/min are presented. The streamlines shown in
Figure 13 indicate that there was no significant flow penetration into the membrane.
Figure 14 reveals an important result that was not visible in the 2D simulation. The cross-section of the duct changed in the z-direction in the middle of the channel, where diffusion occurred. This change caused variations in velocity in this region that were not evident in the 2D velocity contours (
Figure 11). Consequently, there was a gradient of velocity here that could not be visualized in the 2D simulation, leading to stress concentrations (in addition to the ones observed in
Figure 9) at the beginning and end of the membrane (
Figure 14). This increase in stress is not apparent in the shear profiles shown earlier (
Figure 9).
These findings highlight the limitations of 2D simulations in capturing the full complexity of the system. The 3D simulations provide a more accurate representation by accounting for cross-sectional changes and their effects on flow dynamics. The future scope for this work could involve exploring 3D modeling of these channels for a better and more in-depth understanding of the flow pattern near the diffusion area.
4. Discussion and Conclusions
A state-of-the-art method of computational fluid dynamics has been successfully applied for modeling fluid flow in microfluidic systems with different complexities. Bakuova and co-workers investigated and compared the flow behavior and filling characteristics of two microfluidic liver-on-a-chip devices using CFD analysis and experimental cell culture growth based on the Huh7 cell line [
27]. Biagini and co-workers developed a millifluidic device to generate fully controlled shear stress profiles and quantitatively probe their influence on tissue or bacterial models, overcoming the limitations of previously reported similar devices [
28]. Amini and his group studied the flow behavior of a liquid–liquid (chloroform and water) extraction process in a serpentine microchannel [
29]. The simulation was performed using a 3D model and the results were found to be consistent with experimental data. Cardona and her research group used numerical modeling for physical cell trapping in microfluidic chips. The validity of the model was assessed with experimental data [
30]. In a recent paper, Garud and co-workers applied a hybrid approach of computational fluid dynamics and Taguchi analysis to evaluate the influence of various geometrical and operating factors on shear stress in a microfluidic cerebrovascular channel [
31]. Drug delivery across the blood–brain barrier was considered in the presence of shear stress at the blood–brain interface. Another vascular chip model was analyzed by Wang’s group [
32]. CFD models were employed to reveal the hydrodynamics in a tissue-engineered blood vessel on a chip for cardiovascular disease examinations. Takken and Wille described an accelerated CFD simulation method of microfluidic devices by exploiting higher levels of abstraction [
33]. They showed case studies that confirm that the proposed method accelerates CFD simulations by multiple factors (often by several orders of magnitude) while maintaining the fidelity of the simulations.
In our report, a novel application field of CFD in the development and characterization of microfluidic skin-on-a-chip devices was described. The core idea of the current study was to analyze and optimize the fluid dynamics in three existing microfluidic diffusion chambers for transdermal drug delivery studies. Due to the limitation of the analytical detection techniques of active ingredients in the perfusion fluid in such microscale systems, the aim was to find the highest extracting flow rate and obtain measurable drug concentrations in the collected perfusate samples. This study included (1) an experimental part, where three perfusion flow rates were studied using four diffusion platforms integrated into different microfluidic diffusion chambers, and (2) a 2D and 3D simulation part, in which we wanted to find the theoretical explanation for our experimental findings.
The experimental part revealed that the highest drug diffusion could be achieved at the medium flow rate (40 µL/min) in all three microfluidic setups in almost all experimental arrangements, and the barrier function of the natural skin was the strongest, while the permeability turned out to be greatest in the CA membrane in sMDC and the alginate scaffold in the LiveBox2 system. In terms of extracting the absorbed active ingredient, the mMDC system was the least efficient. The smallest cumulative amounts were measured here. In terms of ease of application, the sMDC system was the best to handle, while the LiveBox2 chamber seemed to be the most advantageous from a practical point of view in terms of washing and cleanability (including sterilization). The experimental findings show the direction for further developments of microfluidic systems for drug penetration testing. Based on the results, sMDC and mMDC should be used at lower flow rates, especially in the case of hydrophilic drugs, while LiveBox2 works better at higher speeds. This study also showed preliminary data about alginate as a scaffold bioink for the production of 3D-bioprinted skin tissue for transdermal drug absorption testing. Simulations should be continued for the LiveBox 2 system with bioprinted skin.
The in silico modeling showed that the shear rate was the highest at the highest flow rate (100 µL/min) in each device, and, at this velocity, the penetration through the excised rat skin was very low. Although the concentration gradient between the barrier surface and the flowing fluid was proportional to the perfusion flow rate, the degree of diffusion could not be enhanced further due to the inhibitory shear forces. The simulation nicely visualized the shear stress areas of the channels and the caffeine progression with the peripheral perfusion fluid through the microchannel up to the outlet on a longitudinal scale.
Computational fluid dynamics simulation played a crucial role in analyzing a single-channel microfluidic system. It accurately predicted fluid flow patterns within the microchannel, essential for understanding fluid behavior. CFD also provided detailed insights into shear stress distribution along membrane surfaces, highlighting areas of high stress concentration that could impact system performance. By visualizing concentration gradients, such as caffeine diffusion, how different flow rates influenced the process was revealed. The simulations were validated against experimental data, confirming their reliability. Also, considering three-dimensional effects, such as changes in cross-sectional areas and velocity gradients, offered a more comprehensive understanding compared to two-dimensional analysis. Overall, CFD simulations were indispensable for predicting fluid behavior, validating experimental results, and understanding complex interactions within the microfluidic system.
The consistency between the visualization (CFD simulations) and measured data underscores the reliability and robustness of the microfluidic system. This alignment suggests that the CFD models accurately capture the physical phenomena occurring within the microfluidic device, such as fluid flow patterns, shear stress distributions, and concentration gradients. Specifically, the ability of the simulations to replicate the experimentally observed caffeine diffusion and shear stress patterns validates the precision of the computational models. This validation enhances confidence in the system’s design and its predictive capabilities, indicating that the microfluidic platform can reliably simulate real-world conditions for drug delivery studies and other applications. Moreover, the accurate reflection of three-dimensional effects and localized phenomena in the simulations further confirms the system’s efficacy in providing detailed and accurate representations of microscale fluid dynamics, thereby supporting its use in designing and optimizing microfluidic devices for various biomedical applications.
The computational investigation into caffeine diffusion through a permeable membrane within a microfluidic device revealed several significant findings. The cumulative mass plots illustrated a near-linear trend after an initial period, indicative of a steady diffusion rate once equilibrium was reached. Notably, lower flow rates necessitated a longer duration to attain a steady state, while higher flow rates achieved equilibrium within approximately 10 min. Stress concentration near the beginning and end of the membrane was observed across all figures, attributed to abrupt changes in the cross-sectional area leading to localized alterations in the flow profile and subsequent stress concentration. Interestingly, the distribution of shear stress along the membrane surfaces varied, with the PET membrane exhibiting higher shear values compared to other membranes due to its low thickness, which offered less resistance to shear. Additionally, the shear distribution varied with flow rate, with alginate showing the highest shear stress among membranes at a flow rate of 40 µL/min and PET exhibiting the highest shear stress at a flow rate of 100 µL/min.
At varying flow rates, distinct behaviors were observed regarding the time required to reach a steady state and the resulting concentration of caffeine. Notably, lower flow rates, exemplified by 4 µL/min, necessitated a longer duration to achieve equilibrium. This prolonged duration can be attributed to the slower movement of caffeine molecules through the microfluidic device, resulting in a gradual approach to a steady state. Conversely, at higher flow rates, such as 100 µL/min, a steady state was attained within a comparable timeframe, indicating a more rapid establishment of equilibrium. However, despite the similar timeframes to reach a steady state, the concentration of caffeine differed significantly. At lower flow rates, the accumulation of caffeine reached higher concentrations due to the prolonged exposure time to the permeable membrane. Conversely, at higher flow rates, although a steady state was achieved rapidly, the concentration of caffeine remained low, suggesting a diminished accumulation of caffeine within the microfluidic device. The 2D simulations provided valuable insights into the diffusion process, albeit with limitations. While these simulations assumed a constant cross-section throughout the flow, the 3D results for alginate highlighted the significance of cross-section changes in the y-direction, leading to variations in velocity and subsequent stress concentrations, particularly at the beginning and end of the membrane. This gradient of velocity, unobservable in 2D simulations, underscores the complexity of the diffusion process and emphasizes the importance of considering three-dimensional effects in microfluidic devices.
The modeling data confirmed the results of the in vitro experiments and facilitated a better understanding of the fluid dynamic features of the devices. The findings of this study can contribute to further improvements in the design and fabrication of organ-on-a-chip systems integrating artificial tissues or 3D-bioprinted skin equivalents and also help achieve better diffusion efficacy in the routine use of existing microfluidic setups.
In conclusion, this study provides a comprehensive analysis of the dynamics of caffeine diffusion through a permeable membrane within a microfluidic device. Combining experimental data on caffeine mass accumulation with computational fluid dynamics simulations yielded detailed insights into fluid flow patterns, shear stress distributions, and concentration gradients within the system. Notably, the incorporation of 3D simulations highlighted the complexities of microscale fluid behavior, revealing significant phenomena such as stress concentrations at membrane boundaries, which profoundly influenced device performance. These findings underscore the importance of considering three-dimensional effects and localized phenomena in microfluidic systems, offering valuable insights for the design and optimization of drug delivery platforms and biomedical devices. Moving forward, further research in this area could explore additional factors influencing diffusion dynamics and refine computational models to better capture the intricacies of mass transport in microscale systems.

