Abstract
Mangosteen, or Garcinia mangostana L., has merged as an emerging fruit to be investigated due to its active compounds, especially xanthone derivatives such as α -mangostin (AM), γ-mangostin (GM), and gartanin (GT). These compounds had been reported to exert some pharmacological activities, such as antioxidant and anti-inflammatory, therefore, the development of an analytical method capable of quantifying these compounds should be investigated. The aim of this study was to determine the correlation between FTIR spectra and HPLC chromatogram, combined with chemometrics for quantitative analysis of ethanolic extract of mangosteen. The ethanolic extract of mangosteen pericarp was prepared using the maceration technique, and the obtained extract was subjected to measurement using instruments of FTIR spectrophotometer at wavenumbers of 4000–650 cm−1 and HPLC, using a PDA detector at 281 nm. The data acquired were subjected to chemometrics analysis of partial least square (PLS) and principal component regression (PCR). The result showed that the wavenumber regions of 3700–2700 cm−1 offered a reliable method for quantitative analysis of GM with coefficient of determination (R2) 0.9573 in calibration and 0.8134 in validation models, along with RMSEC value of 0.0487% and RMSEP value 0.120%. FTIR spectra using the second derivatives at wavenumber 3700–663 cm−1 with coefficient of determination (R2) >0.99 in calibration and validation models, along with the lowest RMSEC value and RMSEP value, were used for quantitative analysis of GT and AM, respectively. It can be concluded that FTIR spectra combined with multivariate are accurate and precise for the analysis of xanthones.
1. Introduction
Mangosteen is a fruit that is naturally found in South East Asia, especially Indonesia. Mangosteen is one of the most delicious and sweet fruits, known as the “Queen of Fruit”. The fruit contains 6–10 aril segments with various widths. The pericarp of mangosteen can be used as traditional medicine [1,2]. Mangosteen pericarp contains xanthone, one of the polyphenolics compounds. The major constituents of xanthone derivatives in mangosteen pericarp are α-mangostin (AM) and γ-mangostin (GM) [3]. The compound of AM is reported as the principal component of the species, with pharmacological activities [4]. AM exhibits antioxidant, analgesic, anti-inflammatory, antifungal, and anthelmintic properties [2]. The compounds of GM, AM, and gartanin (GT) have multifunctional activities against Alzheimer’s disease, antioxidant activities, and are potent for neuroprotective effects [3]. The fact that mangosteen pericarp is beneficial to human health makes it necessary to develop reliable analytical methods for the extraction and analysis of those compounds.
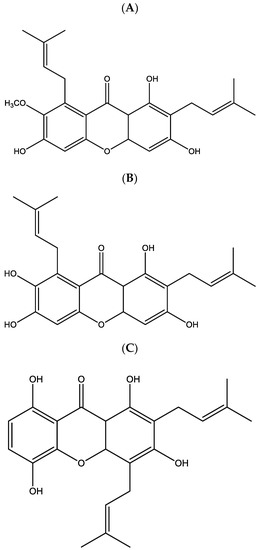
Xanthones are the main active compounds isolated from Garcinia mangostana L. Xanthone in mangosteen pericarp extract was essential for human health, because xanthone is the source of antioxidants capable of preventing diseases; therefore, it can be used for traditional medicine [5]. Xanthones have a chemical structure composed of a tricyclic system (C6–C3–C6). The main xanthone compounds present in mangosteen pericarp include AM, GT, GM, β -mangostin, isomangostin, and garcinones [6]. Among these, AM, GT, and GM (Figure 1) are the most active components in mangosteen pericarp. The method used for the quantification of xanthone contents in mangosteen is HPLC [7,8]. Reverse-phase HPLC method for quantification was found to be rapid, selective, precise, accurate, and have high sensitivity [7].

Figure 1.
The Chemical structures of (A) α-mangostin (AM), (B) γ-mangostin (GM), and (C) gartanin (GT) [3].
The chemometrics of multivariate calibrations may be used effectively and efficiently to determine the relationships between actual values of analytes, as determined by reference methods such as HPLC and predicted values using the developed method (FTIR spectroscopy in this case). The most commonly used of multivariate calibrations are partial least squares (PLS) and principal component regression (PCR) [9]. The objective of this study was to determine the contents of AM, GT, and GM in mangosteen, using HPLC and to correlate FTIR spectra and HPLC data for quantitative analysis of xanthones using PLS and PCR.
2. Materials and Methods
The extract samples used in this study were ethanolic extracts of mangosteen pericarp. The mangosteen pericarp was obtained from 7 regions in Sulawesi, Indonesia. The authentication of mangosteen was performed in Faculty of Pharmacy, Universitas Hasanuddin, Makasar South Sulawesi, Indonesia. The reference standards of α-mangostin, γ-mangostin and gartanin were purchased from E. Merck (Darmstadt, Germany).
2.1. Sample Preparation
The mangosteen pericarp was cut into small pieces, and dried using an oven at a temperature of 40–50 °C. The dried mangosteen pericarp was powdered using a commercial blender. The powder (approximately 100 g) was macerated by ethanol 96% and 70% for three days, using a macerating technique with immediate shaking every day. The extract was filtered and evaporated using a vacuum rotary evaporator at 60–80 °C.
2.2. HPLC Analysis of Xanthones
HPLC analysis of xanthones was performed according to Wittenauer et al. [10] Analysis of xanthones was performed using Shimadzu Prominence HPLC system (Kyoto, Japan), equipped with LC-20D pumps, SIL-20A autosampler, SPD M20A photo-diode array detector (PDA). Separation was performed on C18 Shim-pack GIST column (Kyoto, Japan) 150 × 4.6 mm, 5 μm operated at a temperature of 25 °C. The mobile phase consists of 2% acetic acid in water (eluent A) and 0.5% acetic acid in acetonitrile (eluent B), using gradient programs as follows: 50–60% B (20 min), 60–70% B (35 min), 70–100% B (5 min), 100% B isocratic (3 min), 100–0% B (2 min), at a flow rate of 0.6 mL/min. The injection volume was 8 µL for all samples. The total run time was 65 min. The xanthones compound was monitored at 281 nm. For preparation of reference standard solutions, the stock solution of α-mangostin, γ-mangostin and gartanin was prepared at 1000 µg/mL in methanol HPLC grade. The solution was diluted to obtain concentrations of 200, 180, 160, 140, 120, 100, 80 µg/mL. For sample preparation, 100 mg mangosteen pericarp extract was accurately weighed using analytical balance (Fujitsu FS-AR-210), sonicated with 10 mL, with methanol at room temperature, filtered using 0.45 µm and injected in HPLC systems.
2.3. Analysis of Extracts Using FTIR Spectrophotometer
The measurement of FTIR spectra was performed according to Rohman et al. [11] FTIR Spectrophotometer (Thermo Scientific Nicolet iS10). The samples were analyzed with FTIR-spectrophotometer Nicolet iS10 equipped with DTGS (deuterated triglycine sulfate) detector and connected with OMNIC® software. The sample was directly placed on an ATR (attenuated total reflectance) crystal at 20 °C. The measurements were recorded at a resolution of 4 cm−1 and the number of scanning of 32 in the range of 4000–650 cm−1.
2.4. Data Analysis
The data were analyzed using multivariate calibrations of partial least square (PLS) and principle component regression (PCR). PLS and PCR were used for correlation between actual values of xanthones, as determined using HPLC and predicted values using FTIR spectroscopy. The chemometrics of multivariate calibrations is done by software TQ Analysis® version 9. Statistical parameters evaluated were coefficient of determination (R2) for model accuracy as well as root mean square error of calibration (RMSEC) and root mean square error of predicted (RMSEP), for precision evaluation.
3. Results
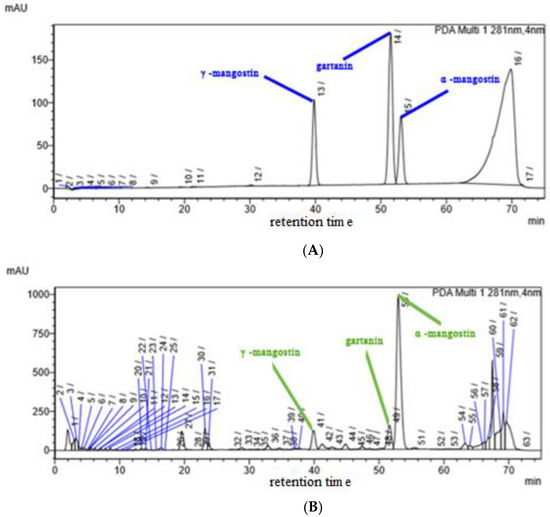
HPLC was used for quantitative analysis of AM, GM, and GT in ethanolic extracts of mangosteen. HPLC was an accurate technique for the identification and reliable quantification of natural compounds, because HPLC could be optimized to get the best optimization of separation [12]. AM, GM, and GT in ethanolic extract of mangosteen pericarp were determined using HPLC with PDA detector at wavelength 281 nm. The maximum absorbance of GT (281 nm) was used for detection [10]. Figure 2 showed the chromatogram of reference standards AM, GM, and GT. The retention times are 39.803, 51.494, and 53.075 min for GM, GT, and AM, respectively. The most prominent peak in chromatogram was AM, followed by GM and GT.

Figure 2.
HPLC Chromatogram of reference standards (A) and samples of ethanolic extract of mangosteen (B). For condition, see text.
The calibration curves constructed for the prediction of analytes was in the range of 105.6–237.6 µg/mL for GM, 80–200 µg/mL for GT and 96–240 µg/mL for AM. These concentration ranges can provide a high coefficient of correlation (R-value). Each variation was injected into HPLC and the coefficient of determination (R2) value for GM, GT, and AM 0.9868, 0.9918, and 0.9939 respectively, as shown in Table 1. The concentrations of GM, GT, and AM were calculated using external standard, by introducing peak area of samples into the calibration curve. The concentrations of GM, GT, and AM in mangosteen pericarp were shown in Table 2. AM revealed the highest concentrations of xanthones in mangosteen pericarp, followed by GM and GT.

Table 1.
Linearity for the quantitation of γ-mangostin (GM), gartanin (GT), and α-mangostin (AM).

Table 2.
Concentrations of γ-mangostin (GM), gartanin (GT), and α-mangostin (AM) in mangosteen pericarp.
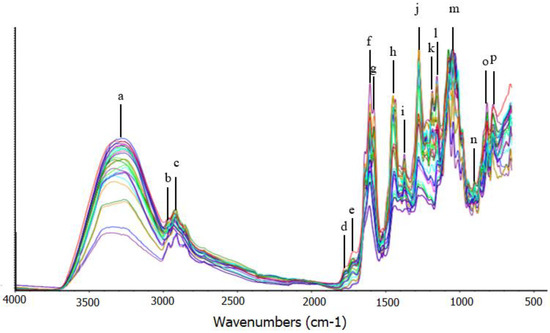
FTIR spectra of mangosteen pericarp extract were shown in Figure 3. In this study, the analysis of GM, GT, and AM compounds using FTIR spectrophotometry was performed at wavenumber 4000–650 cm−1 and scanned in the absorbance form. For interpretation FTIR spectra of mangosteen pericarp extract, the absorption band at (a) 3317 cm−1 is stretching vibration of hydrogen bonded (–OH), while bands at (b) 2953 cm−1 and (c) 2922 cm−1 correspond to asymmetric stretching vibration of methyl (CH3), asymmetric stretching vibration of methylene (CH2–) groups, respectively. The bands at (d) 1760 cm−1 and (e) 1741 cm−1 comes from stretching vibration of unconjugated carbonyl (C=O) group. The strong band at (f) 1654 cm−1 comes from stretching vibration of unconjugated C=C. The band at (g) 1590 cm−1 corresponds to stretching vibration conjugated C=C. The strong band at (h) 1409 cm−1 comes from CH2– bending, while the bands at (i) 1367 cm−1 comes from CH3− bending. The bands at (j) 1278 cm−1, (k) 1206 cm−1, (l) 1046 cm−1 correspond to the stretching vibration of C–O. The bands at (m) 1011 cm−1, (n) 908 cm−1, (o) 772 cm−1, (p) 677 cm−1 comes from C–OH stretching, –HC=CH– (trans) out of plane, –HC=CH– (cis) out of plane, –(CH2)n; –HC=CH-bending, respectively [11].

Figure 3.
FTIR spectra of ethanolic extract of mangosteen pericarp, scanned at mid infrared region 4000–650 cm−1, using attenuated total reflectance.
FTIR spectra combined with multivariate calibrations of PCR and PLS could be effective tools for quantitative analysis of analytes [13]. To perform a quantitative analysis of analytes in mangosteen pericarp extract, PCR and PLS were compared using predictor variables of absorbance values at specific wavenumber regions. The absorbance values were combined to get new variables (principle component or PC) or PLS factors. The PCs and factors were used for modelling with the concentration of analytes. The data obtained from FTIR and HPLC analysis were continued to the multivariate calibration of PLS and PCR. PLS analyzes multiple component that calibrate predictor variables (absorbance in specific wavenumbers) with dependent variables (concentration of GM, GT, and AM). The condition selected was based on the higher coefficient of determination (R2), for the relationship between actual value of analytes as determined using HPLC method (x-axis) and predictive value. The errors used for evaluation of precision of analytical methods were expressed by RMSEC and RMSEP, while R2 expressed the accuracy of the model [13]. The higher R2 and the lower RMSEC, the more accurate and more precise of models. Table 3 showed the statistical results with R2, RMSEC, and RMSEP values for correlation between actual values, as determined by HPLC, and predicted FTIR spectra for determination of GM, using normal, first derivative and second derivative spectra at specific wavenumbers regions.

Table 3.
The statistical parameters of multivariate calibrations of principle component regression (PCR) and partial least square (PLS) for the quantitative analysis of γ-mangostin (GM).
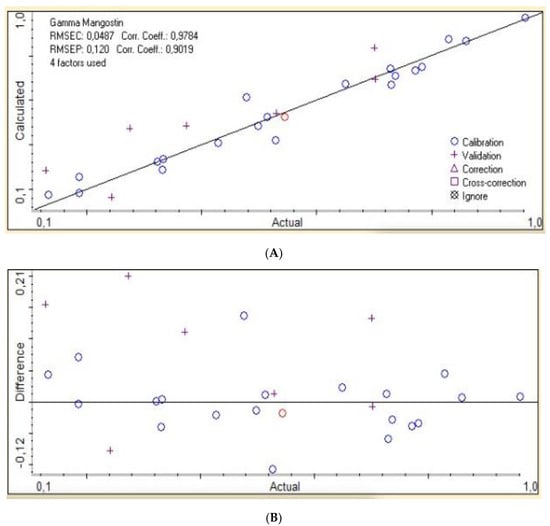
PLS, using absorbance values of FTIR spectra at combined wavenumber regions of 3700–2700 cm−1, was used to predict the content of GM, as indicated by highest R2 (0.9573 and 0.8134 in calibration and validation models), and by lowest value of RMSEC (0.0487%) and RMSEP (0.120%). The low value of RMSEC and RMSEP indicated that the developed models were precise. The R2 values in PCR models were less than 0.9, which indicated that the developed models did not reach the desired precision and accuracy. Figure 4 revealed the correlation between actual values of GM, as determined by HPLC method (x-axis) and FTIR predicted values (y-axis) in calibration and validation models, along with residual analysis. From residual analysis, it is clear that the errors occurring during analysis is random errors, because the points (the difference between actual and predicted value) fall around zero [14].

Figure 4.
The Partial Least Square regression (PLSR) between actual values of γ-mangostin combined with wavenumbers region 3700–2700 cm−1 using the second derivative FTIR (A), along with residual analysis (B).
Table 4 showed the statistical results with R2, RMSEC, and RMSEP values of FTIR spectra for determination GT using normal, first derivative and second derivative spectra at specific wavenumbers region. PLS combined wavenumber region of 3700–663 cm−1 was used to predict the content of GT as indicated by highest R2 (0.9952 and 0.3094 in calibration and validation models) and by lowest value of RMSEC (0.00789%) and RMSEP (0.0519%). The R2 value in PCR analysis is less than 0.9, which indicated that the developed models did not reached the desired precision and accuracy. Table 5 showed the statistical results with R2, RMSEC, and RMSEP values of FTIR spectra for determination AM, using normal, first derivative and second derivative spectra at a specific wavenumbers region. PLS combined wavenumber region of 3700–663 cm−1 was used to predict the content of AM as indicated by highest R2 (0.9934 and 0.6358 in calibration and validation models) and by lowest value of RMSEC (0.197%) and RMSEP (0.990%). From these results, FTIR spectroscopy combined with multivariate calibrations is a reliable technique for the quantitative analysis of AM, GM, and GT.

Table 4.
The statistical parameters of multivariate calibrations of Principle Component Regression (PCR) and Partial Least Square (PLS) for quantitative analysis of gartanin (GT).

Table 5.
The statistical parameters of multivariate calibrations of Principle Component Regression (PCR) and Partial Least Square (PLS) for a quantitative analysis of α-mangostin (AM).
4. Conclusions
HPLC method can determine the content of α-mangostin (AM), γ-mangostin (GM), and gartanin (GT) in mangosteen pericarp extracts. FTIR spectroscopy combined with PLS using wavenumber region at 3700–2700 cm−1 for the quantification of GM in mangosteen pericarp extract and 3700–663 cm−1 for quantification of GT and AM in mangosteen pericarp extract offered a reliable technique.
Author Contributions
E.P.T. and Irnawati performed research activities, data acquisition, data interpretation, and statistical analysis. W.S., B.Y., G.A., and A.R. concepted and designed research, prepared manuscript and made critical thinking on manuscript. All authors have read and agreed to the published version of the manuscript.
Funding
This research received no external funding.
Acknowledgments
We thank the Ministry of Research and technology scheme World Class Research 2020 with contract number 869/UN1/DITLIT/DIT-LIT/PT/2020.
Conflicts of Interest
The authors declare no conflict of interest.
References
- Cheok, C.Y.; Mohd Adzahan, N.; Abdul Rahman, R.; Zainal Abedin, N.H.; Hussain, N.; Sulaiman, R.; Chong, G.H. Current trends of tropical fruit waste utilization. Crit. Rev. Food Sci. Nutr. 2018, 58, 335–361. [Google Scholar] [CrossRef] [PubMed]
- El-kenawy, A.E.; Hassan, S.M.A.; Osman, H.H. Mangosteen (Garcinia mangostana L.), Nonvitamin and Nonmineral Nutritional Supplements; Elsevier Inc.: Amsterdam, The Netherlands, 2019. [Google Scholar] [CrossRef]
- Wang, S.; Li, Q.; Jing, M.; Han, Y.; Pi, R.; Yang, X.; Sabate, R.; Lan, W.; Chen, X.Y.J. Natural xanthones from Garcinia mangostana with multifunctional activities for the therapy of alzheimer’s disease. Nerochem. Res. 2016, 41, 1806–1817. [Google Scholar] [CrossRef] [PubMed]
- Rivero, B.; Garibay, I. Development and Validation of a Stability- Indicating HPLC Method for the Quantification of α-Mangostin in Dietary Supplements. Nat. Prof. Comm. 2019, 14, 1–5. [Google Scholar] [CrossRef]
- Kusmayadi, A.; Adriani, L.; Abun, A.; Muchtaridi, M.; Tanuwiria, U.H. The effect of solvents and extraction time on total xanthone and antioxidant yields of mangosteen peel (Garcinia mangostana L.) extract. Drug Invent. Today 2018, 10, 2572–2576. [Google Scholar]
- Gondokesumo, M.E.; Pardjianto, B.; Sumitro, S.B.; Widowati, W.; Pardji, B.; Bambang, S.; Widowa, W. Xanthones Analysis and Antioxidant Activity Analysis (Applying ESR ) of six different maturity levels of mangosteen rind extract (Garcinia mangostana Linn.). Pharmacogn. J. 2019, 11, 369–373. [Google Scholar] [CrossRef]
- Aisha, A.; Abu-salah, K.M.; Abdullah, K.; Medical, I.; Siddiqui, M.J. Quantification of α-, β-, and γ-mangostin in Garcinia mangostana fruit rind extracts by a reverse phase high performance liquid chromatography. J. Med. Plant. Res. 2012, 6, 4526–4534. [Google Scholar]
- Mayefis, D.; Anugerah, Y.; Rasyid, R. Determination of total xanthone content in the preparation of mangosteen pericarp capsules (Garcinia mangostana L.) available on the market using uv-visible spectrophotometry. Maj. Obat Trad. 2019, 24, 98–103. [Google Scholar] [CrossRef][Green Version]
- Tulukcu, E.; Cebi, N.; Sagdic, O. Chemical Fingerprinting of seeds of some salvia. Foods 2019, 4, 1–12. [Google Scholar]
- Wittenauer, J.; Falk, S.; Schweiggert-weisz, U.; Carle, R. Characterisation and quantification of xanthones from the aril and pericarp of mangosteens (Garcinia mangostana L.) and a mangosteen containing functional beverage by HPLC–DAD–MS. Food Chem. 2012, 134, 445–452. [Google Scholar] [CrossRef]
- Rohman, A.; Sudjadi, D.; Ramadhani, D.; Nugroho, A. Analysis of curcumin in curcuma longa and Curcuma xanthorriza using FTIR spectroscopy and chemometrics. Res. J. Med. Plant 2015, 9, 179–186. [Google Scholar] [CrossRef]
- Brighenti, V.; Groothuis, S.F.; Prencipe, F.P.; Amir, R.; Benvenuti, S.; Pellati, F. Metabolite fingerprinting of Punica granatum L. (pomegranate) polyphenols by means of high-performance liquid chromatography with diode array and electrospray ionization-mass spectrometry detection. J. Chromatogr. A 2017, 1480, 20–31. [Google Scholar] [CrossRef] [PubMed]
- Irnawati, I.; Riyanto, S.; Martono, S.; Rohman, A. Determination of sesame oil, rice bran oil and pumpkin seed oil in ternary mixtures using FTIR spectroscopy and multivariate calibrations. Food Res. 2020, 4, 135–142. [Google Scholar] [CrossRef]
- Miller, J.C.; Miller, J.N. Statistic and Chemometrics for Analytical Chemistry, 5th ed.; Pearson Education Limited: Harlow, UK, 2005. [Google Scholar]
© 2020 by the authors. Licensee MDPI, Basel, Switzerland. This article is an open access article distributed under the terms and conditions of the Creative Commons Attribution (CC BY) license (http://creativecommons.org/licenses/by/4.0/).