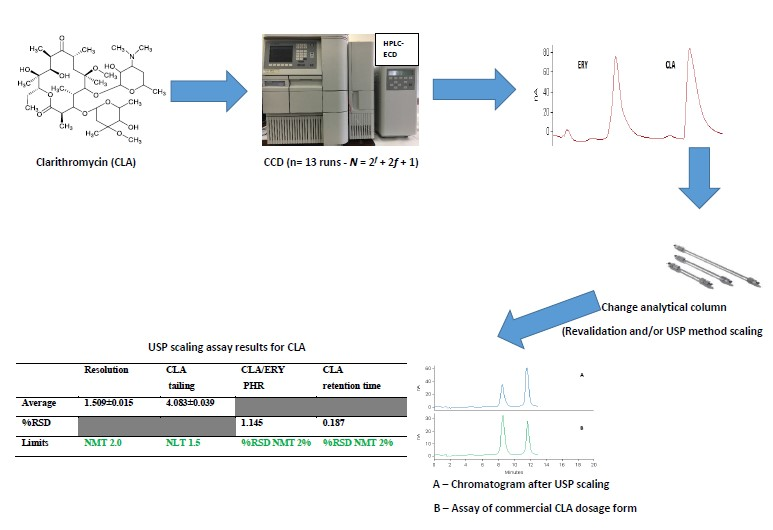
Article

Stability Indicating HPLC-ECD Method for the Analysis of Clarithromycin in Pharmaceutical Dosage Forms: Method Scaling versus Re-Validation

by
Pedzisai A. Makoni
,
Mellisa T. R. Chikukwa
,
Sandile M. M. Khamanga
and
Roderick B. Walker
*
Division of Pharmaceutics, Faculty of Pharmacy, Rhodes University, 6140 Grahamstown, South Africa
*
Author to whom correspondence should be addressed.
Sci. Pharm. 2019, 87(4), 31; https://doi.org/10.3390/scipharm87040031
Submission received: 16 October 2019 / Revised: 4 November 2019 / Accepted: 6 November 2019 / Published: 16 November 2019

Abstract

:
An isocratic high-performance liquid chromatographic method using electrochemical detection (HPLC-ECD) for the quantitation of clarithromycin (CLA) was developed using Response Surface Methodology (RSM) based on a Central Composite Design (CCD). The method was validated using International Conference on Harmonization (ICH) guidelines with an analytical run time of 20 min. Method re-validation following a change in analytical column was successful in reducing the analytical run time to 13 min, decreasing solvent consumption thus facilitating environmental and financial sustainability. The applicability of using the United States Pharmacopeia (USP) method scaling approach in place of method re-validation using a column with a different L–designation to the original analytical column, was investigated. The scaled method met all USP system suitability requirements for resolution, tailing factor and % relative standard deviation (RSD). The re-validated and scaled method was successfully used to resolve CLA from manufacturing excipients in commercially available dosage forms. Although USP method scaling is only permitted for columns within the same L-designation, these data suggest that it may also be applicable to columns of different designation.

Graphical Abstract

1. Introduction

Clarithromycin (CLA) is a semi-synthetic macrolide derivative of erythromycin A comprised of 14-cladisone and desosamine residues attached at positions 3 and 5 (Figure 1) [1,2]. CLA is a biopharmaceutical classification system (BCS) class II molecule that is poorly soluble and highly permeable. CLA exhibits an aqueous solubility of approximately 0.342 µg/mL at 25 °C, and has a pKa of 8.8 [3]. CLA is acid-stable and has a broad spectrum of antimicrobial activity, inhibiting a range of Gram-positive and Gram-negative organisms, atypical pathogens and some anaerobic organisms [4,5]. CLA lacks a chromophore as it has no conjugated double bond in the lactone ring therefore, significant UV absorbance is only observed at wavelengths < 210 nm [6]. Detection at these wavelengths is suitable for most in vitro samples but lack the necessary sensitivity for the quantitation of low concentrations of CLA, such as those observed in biological matrices [2,7] and nanoparticles [
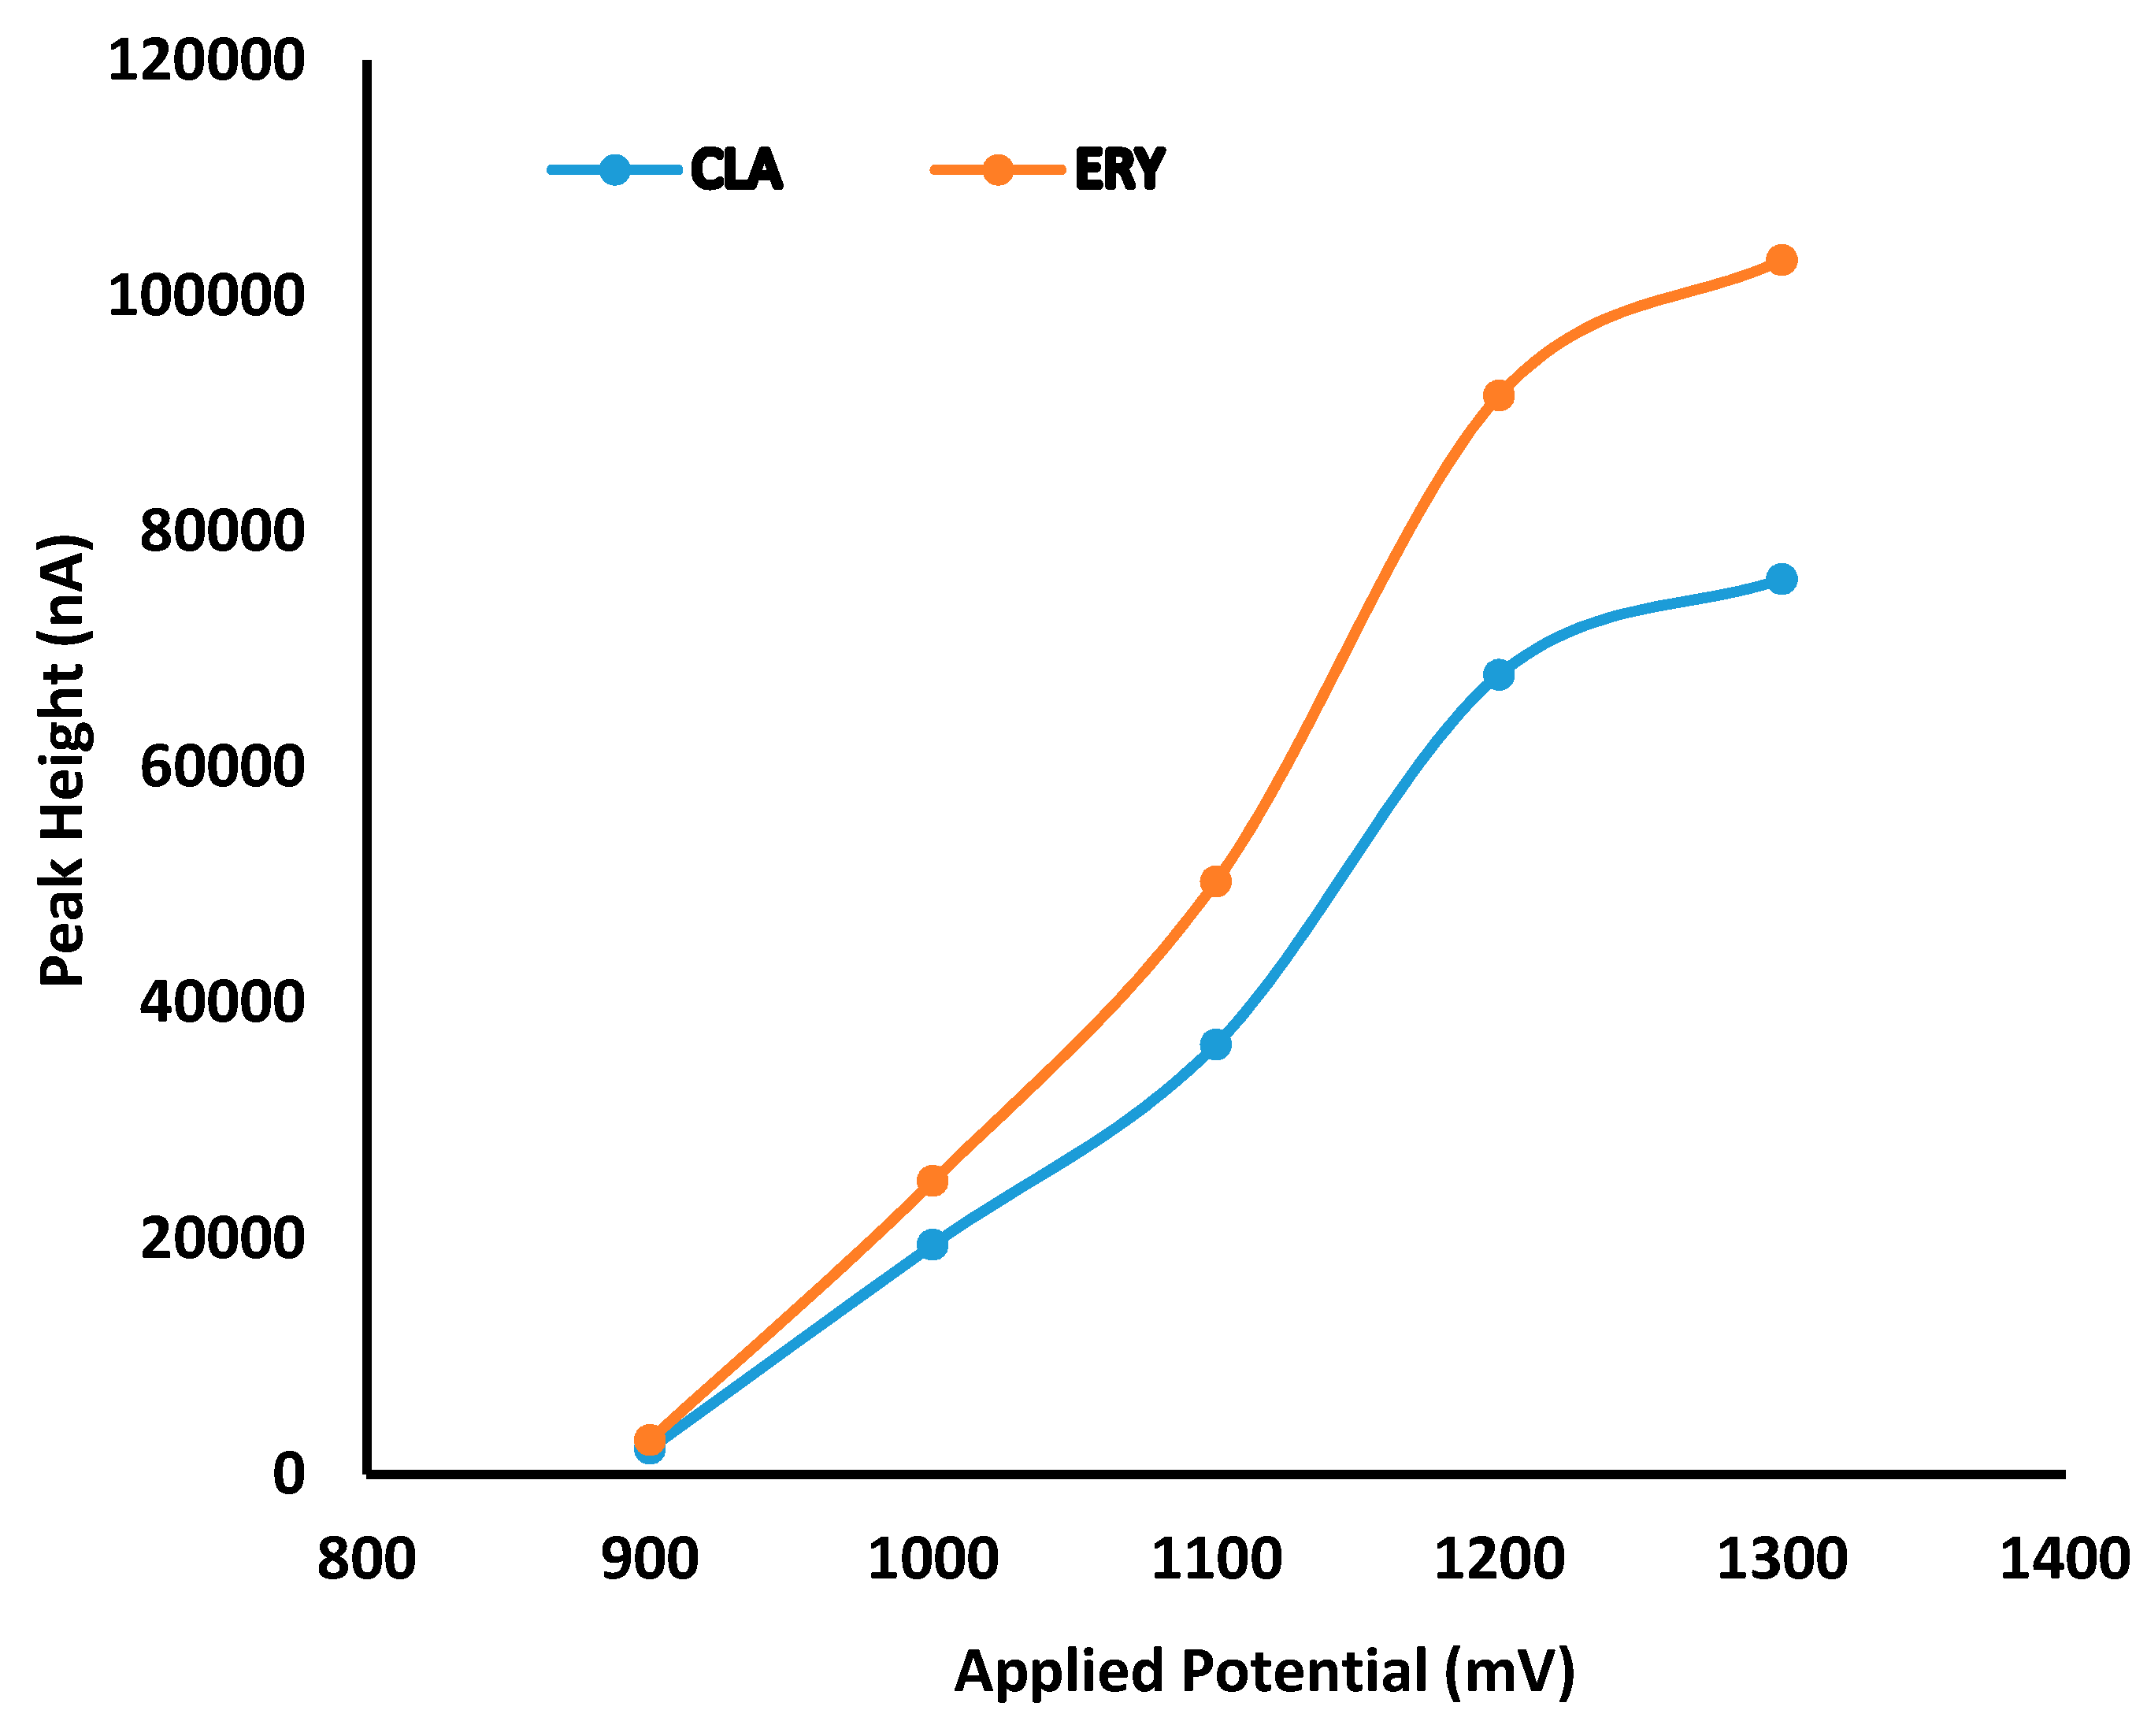
8]. CLA has a tertiary amino group which is reactive for electrochemical oxidation [9], making electrochemical detection (ECD) a potentially useful tool for ensuring the accurate determination of CLA in dosage forms. Quantitative analysis of CLA has been achieved in biological samples using high-performance liquid chromatography (HPLC) with ECD [10,11,12], UV [2,13], LCMS [14] and fluorescence detection [15]. Published HPLC-ECD methods have reported detection limits of 10.03 µg/mL [16], 0.5 µg/mL [17], 0.03 µg/mL [10], 0.1 µg/mL [18], 0.01 µg/mL [19], 0.15 µg/mL [20] and 0.02 µg/mL [21]. In addition, characterization of degradation products of CLA have been reported using HPLC-MS [22,23] and HPLC-UV [5,13].
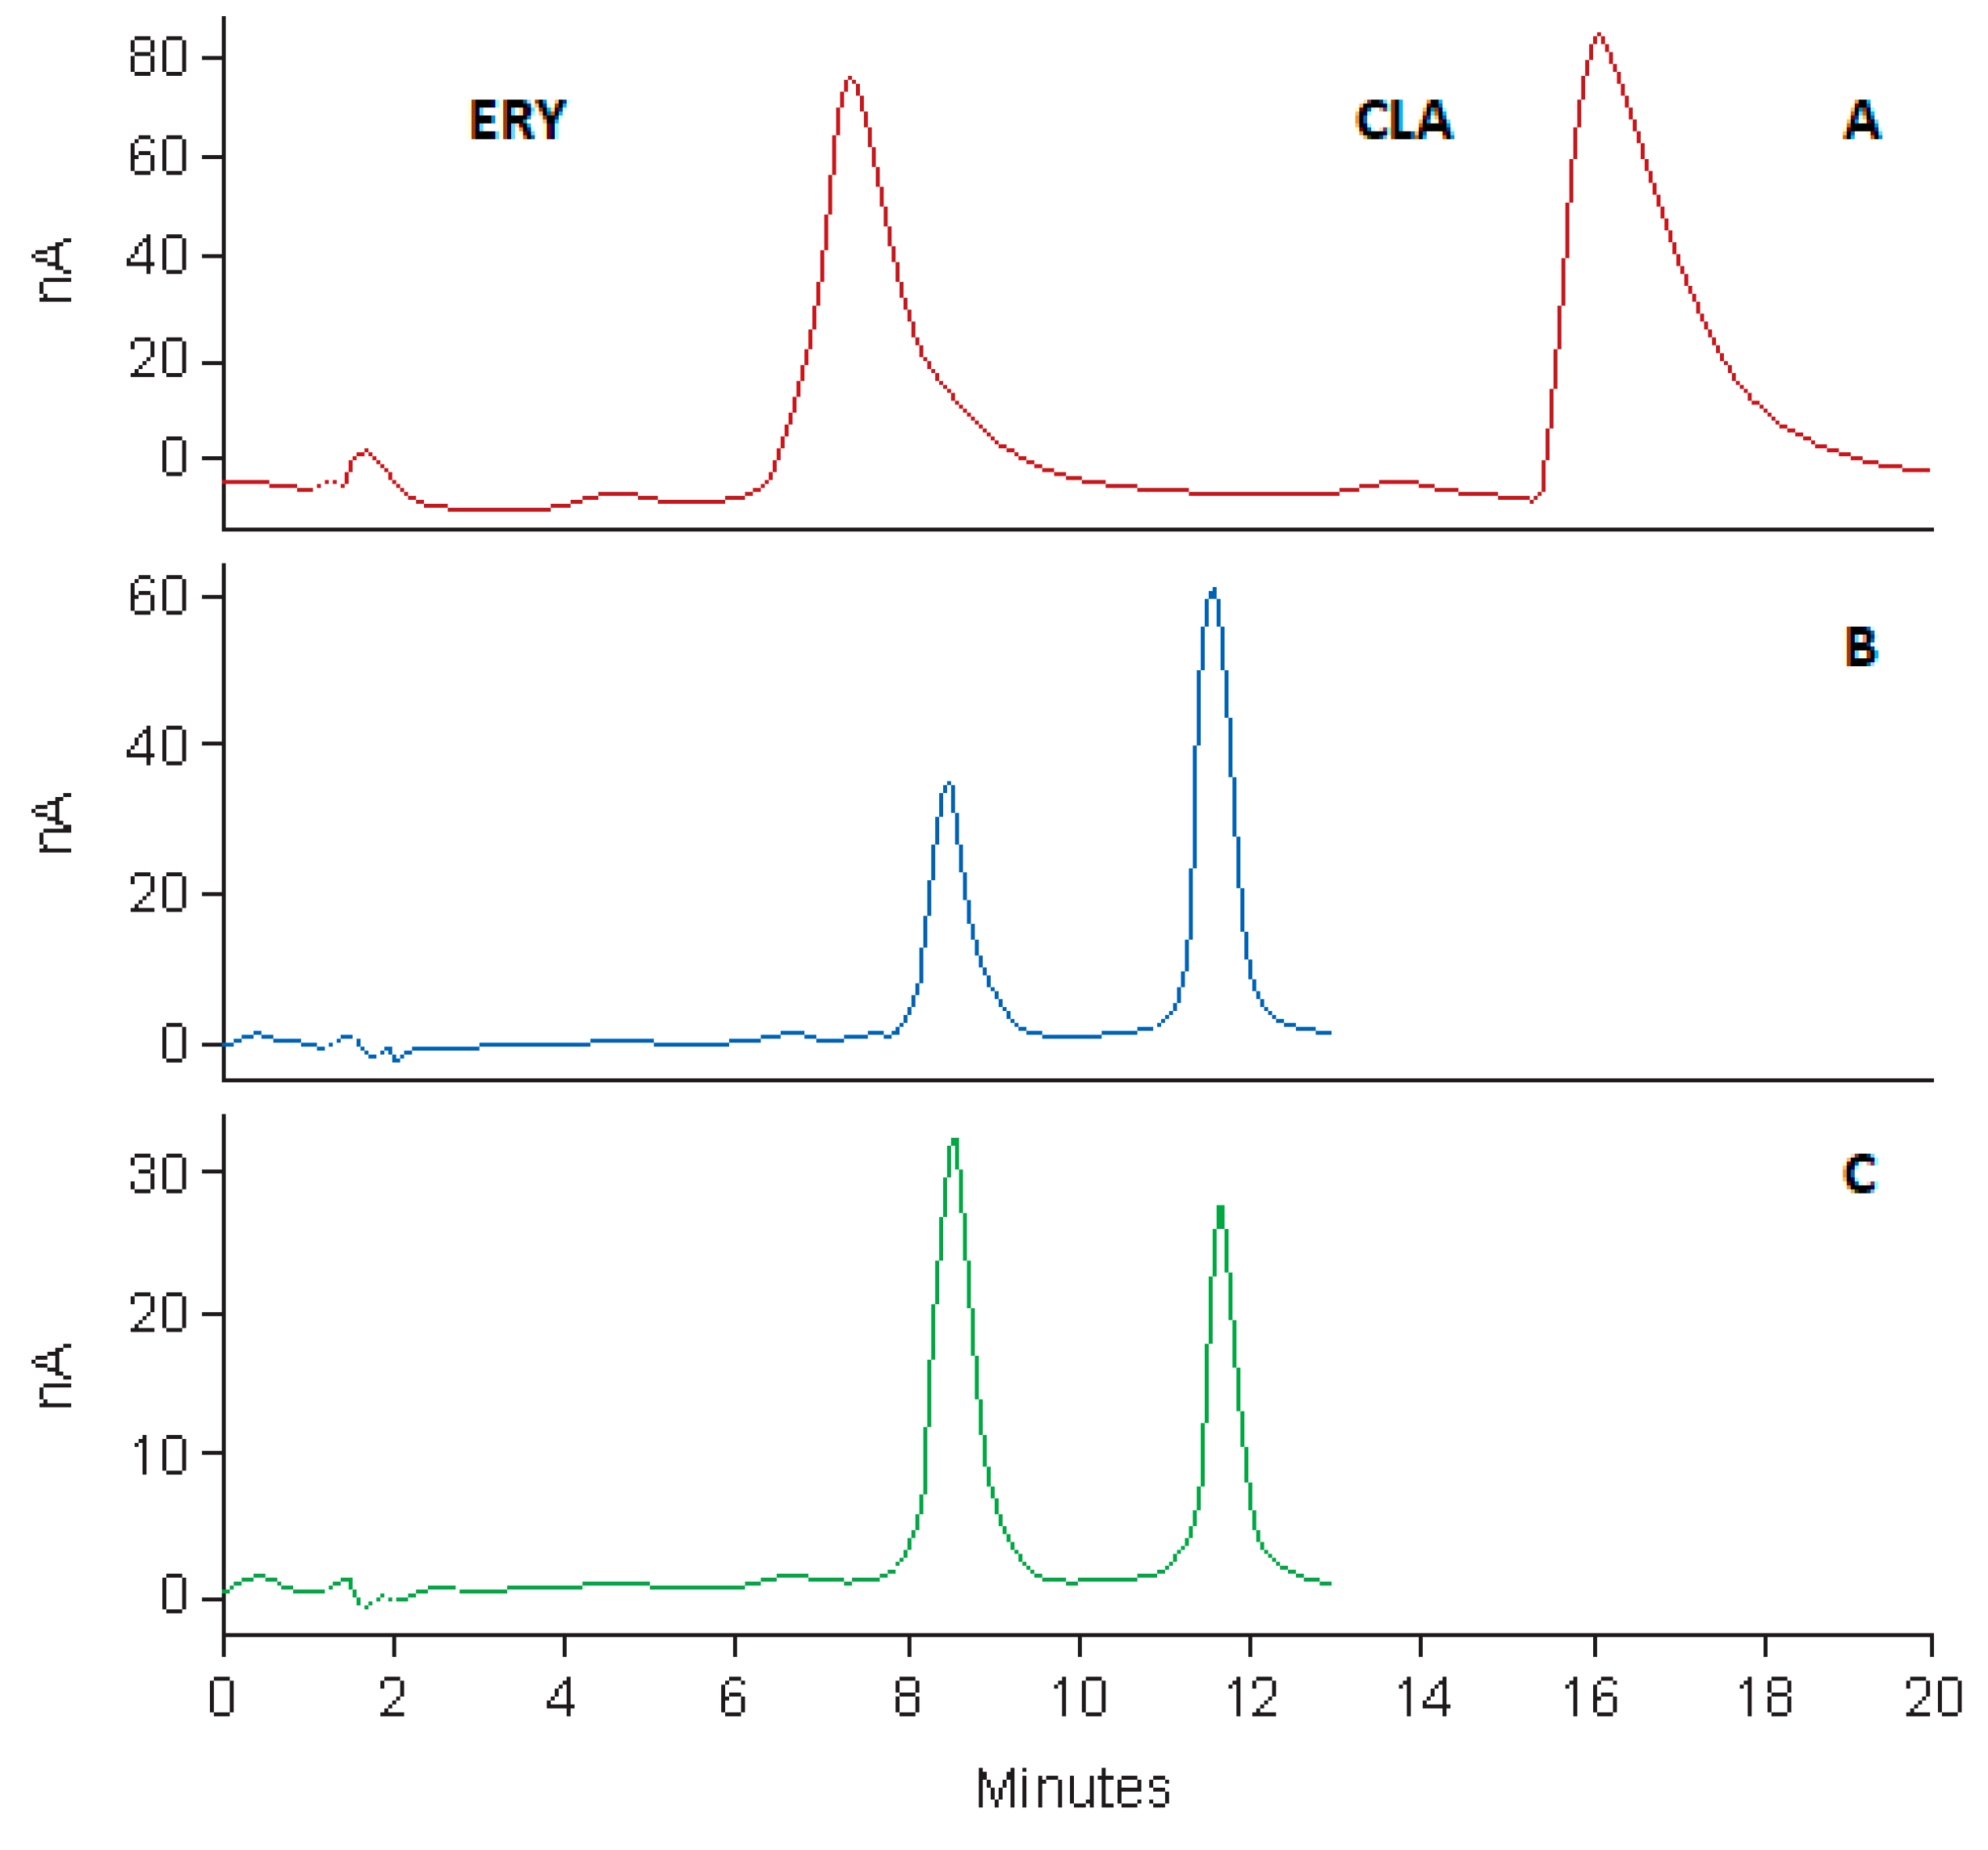
It has been established that step-by-step optimization procedures for any reliable HPLC method requires good peak resolution with acceptable retention time(s), the absence of ‘ghost’ peaks, stable sensitivity with minimal peak tailing [25]. The initial aim of these studies was to screen factors that would hinder achievement of the appropriate chromatographic conditions and performance, with the ultimate goal of developing a rapid, simple and sensitive analytical method using a minimum number of experimental runs.
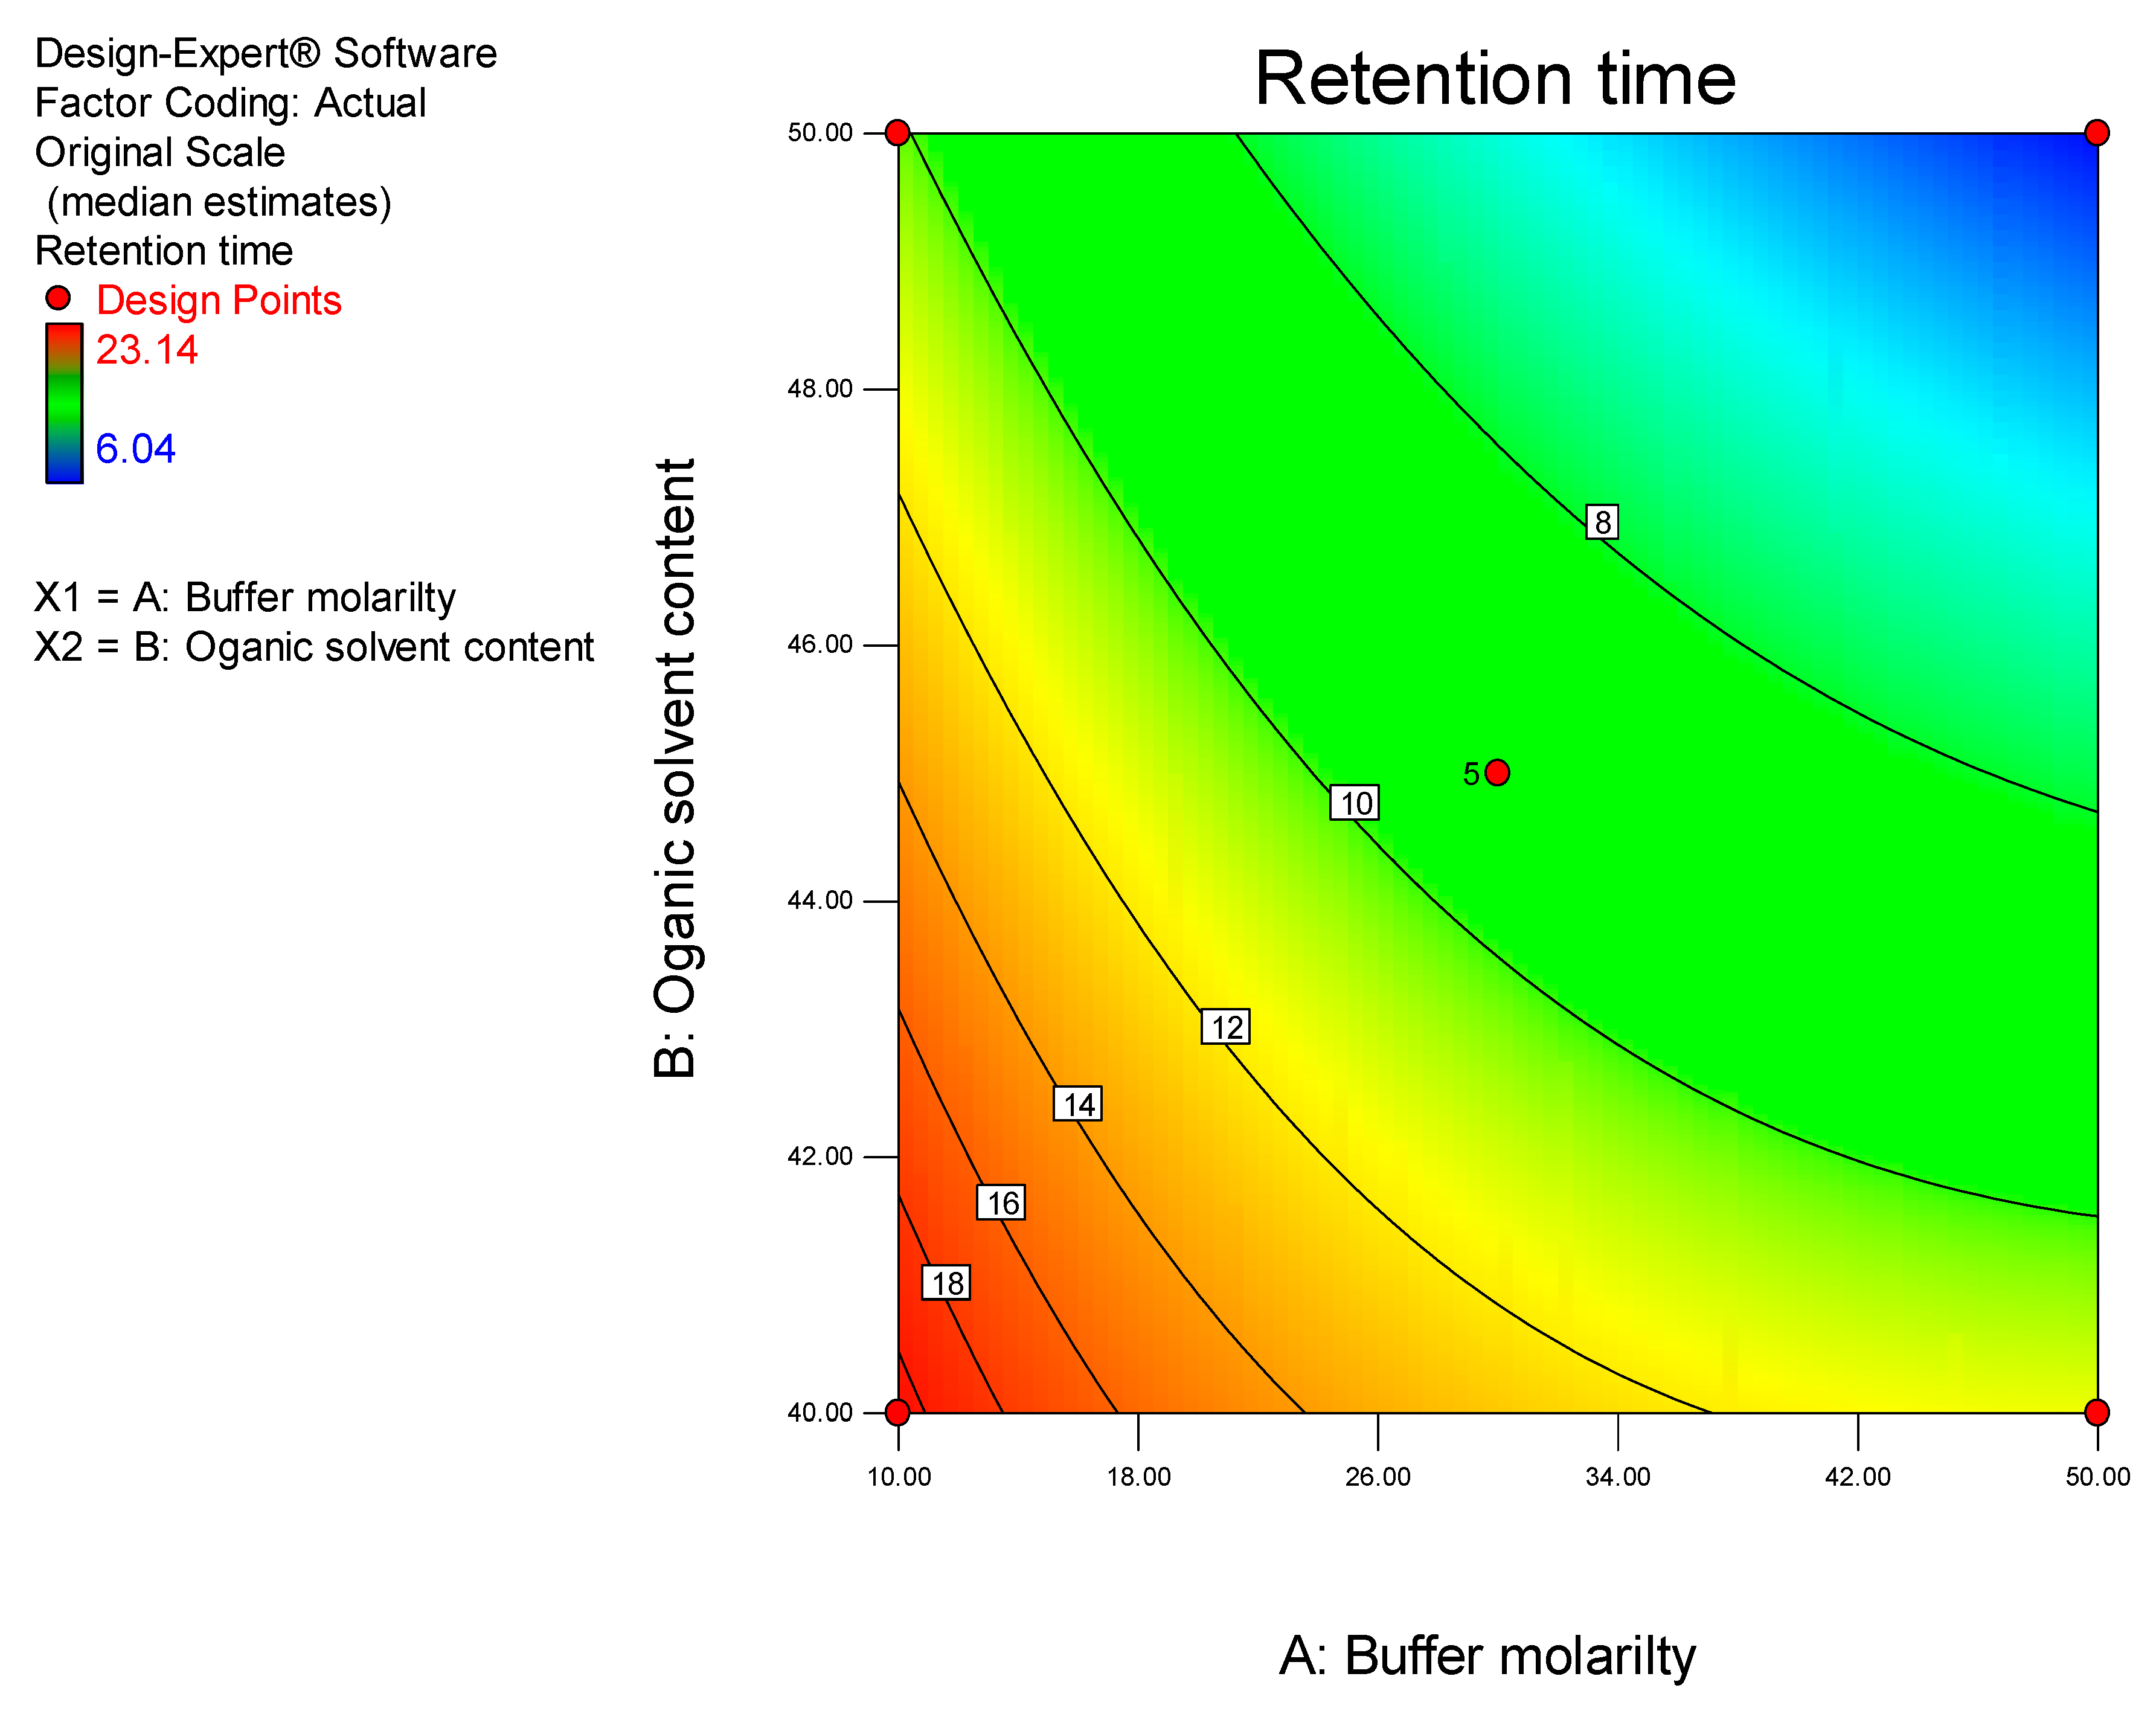
Prior to using Design of Experiments (DoE), a conventional approach was used to establish the optimum operating conditions so as to eliminate factors that resulted in a long retention time, baseline drift and background noise. DoE was ultimately used to identify the optimum analytical conditions for this separation.
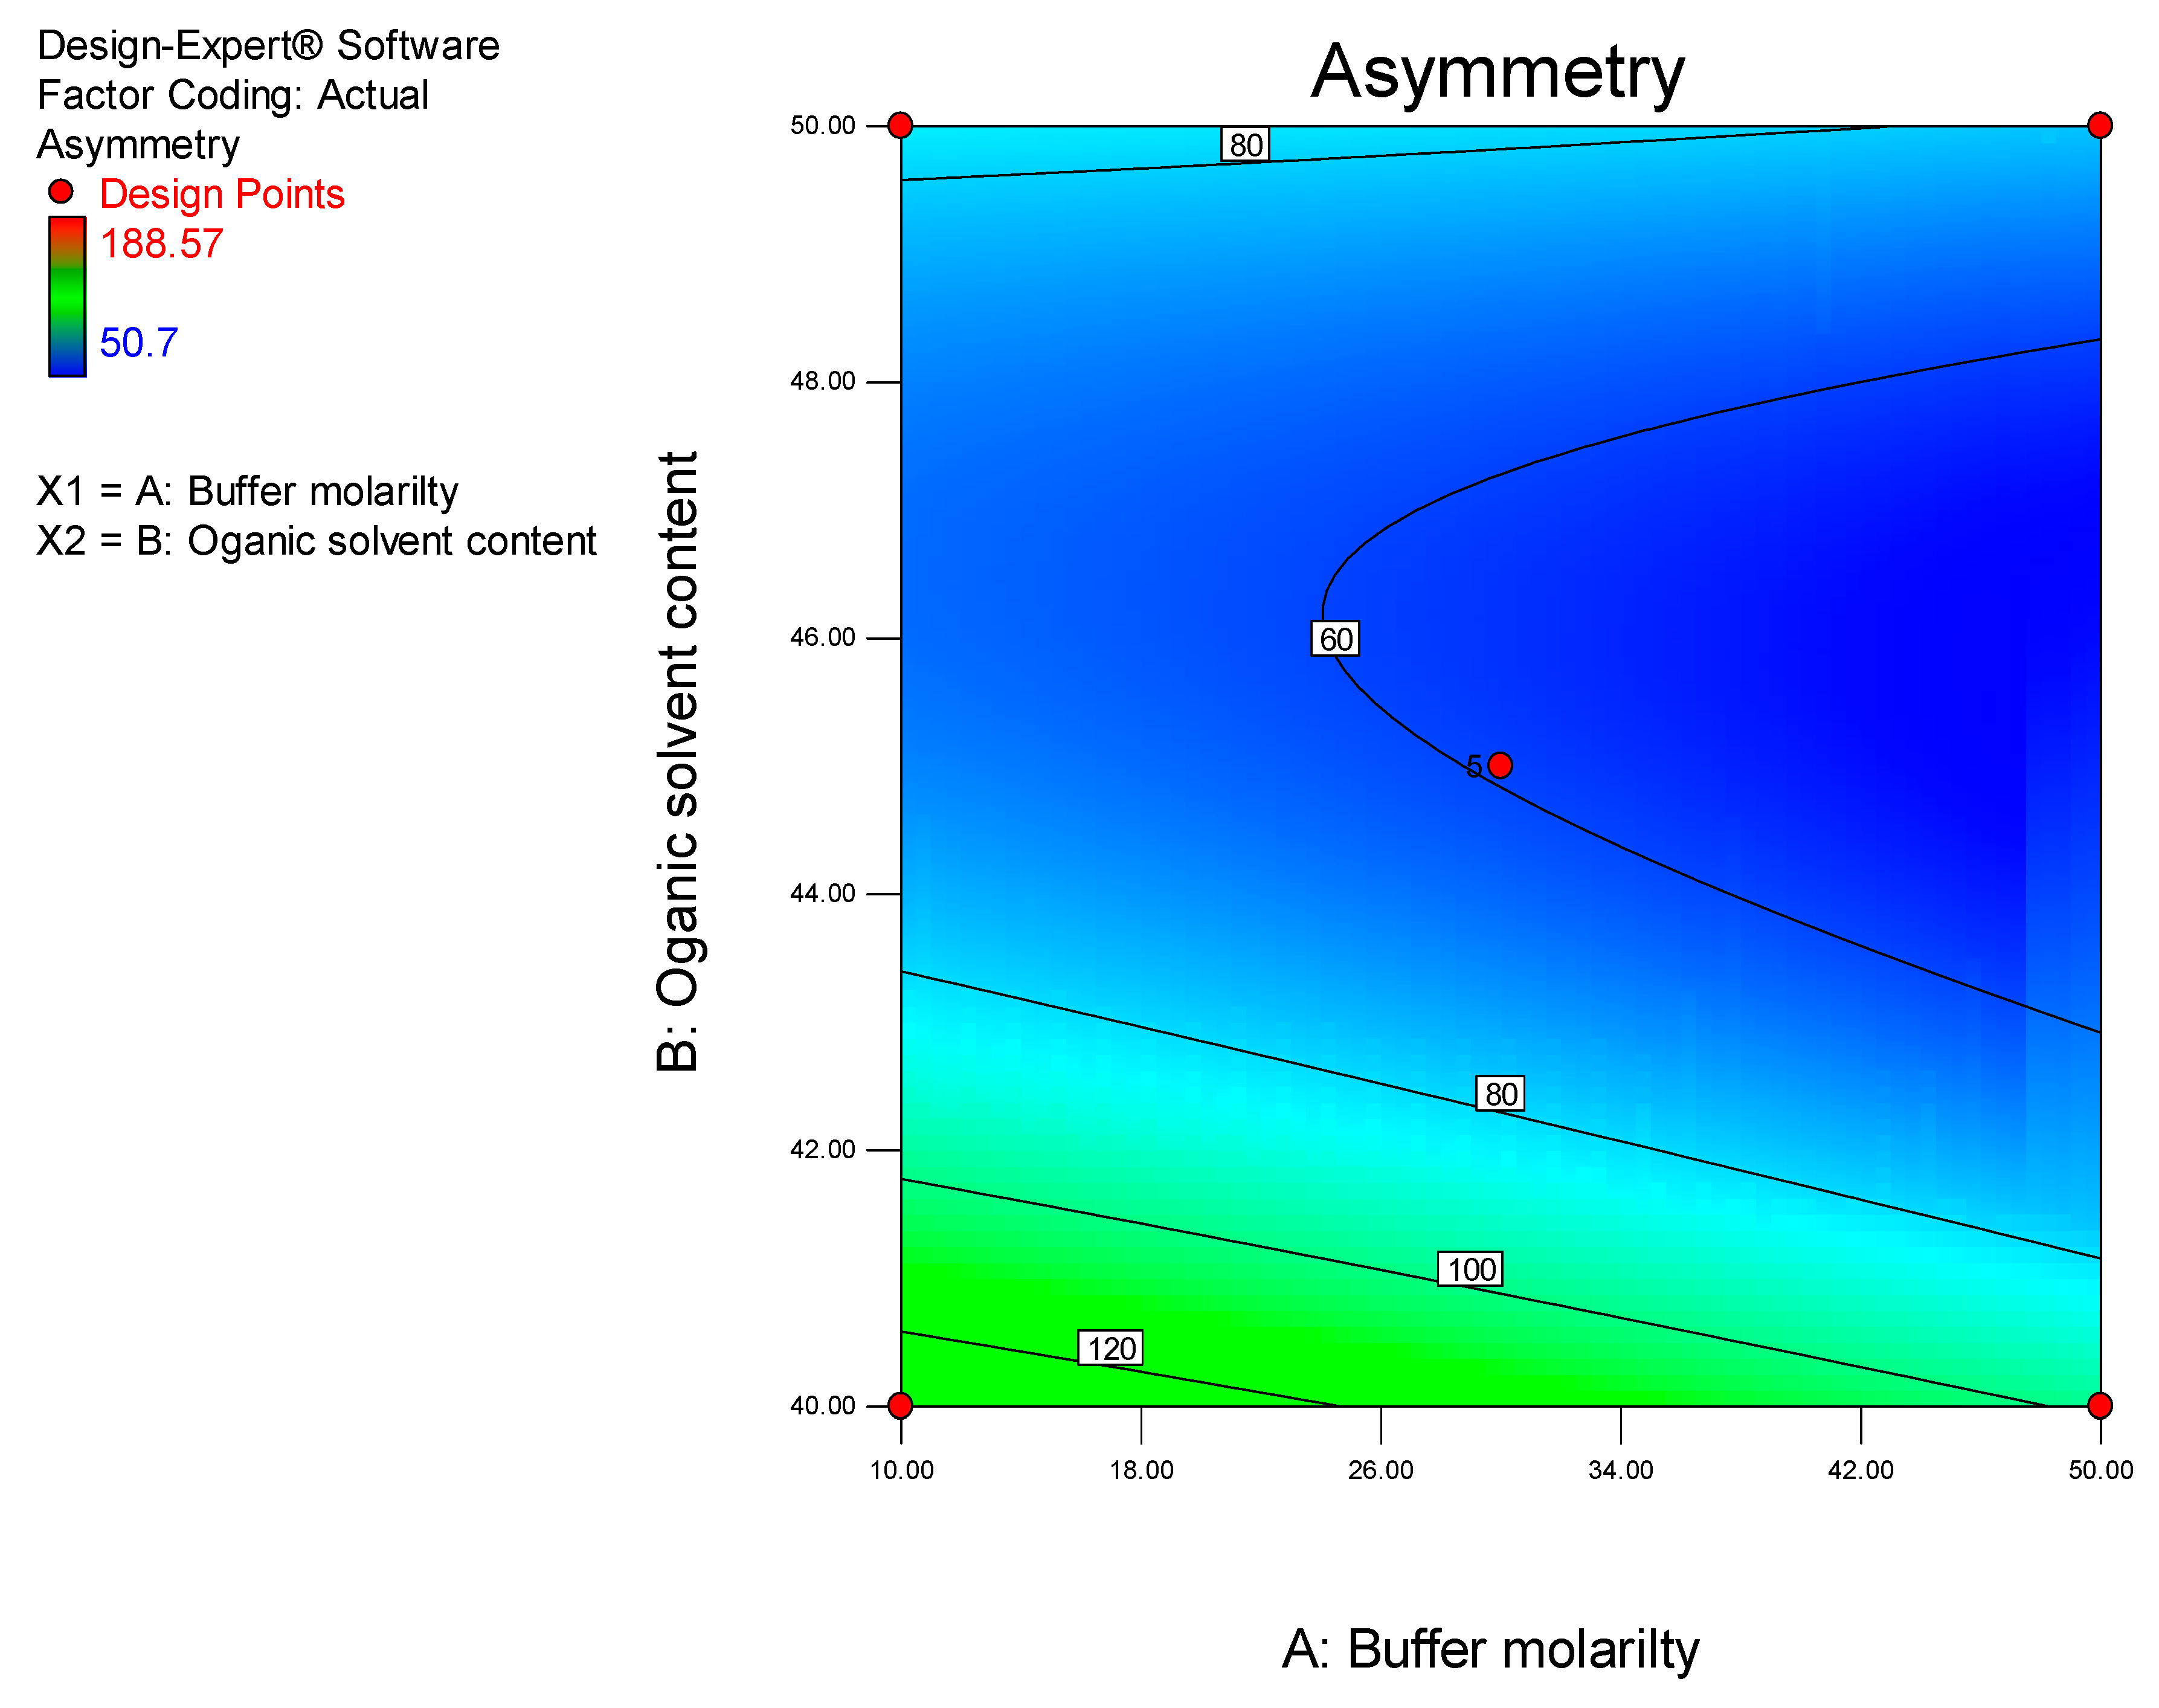
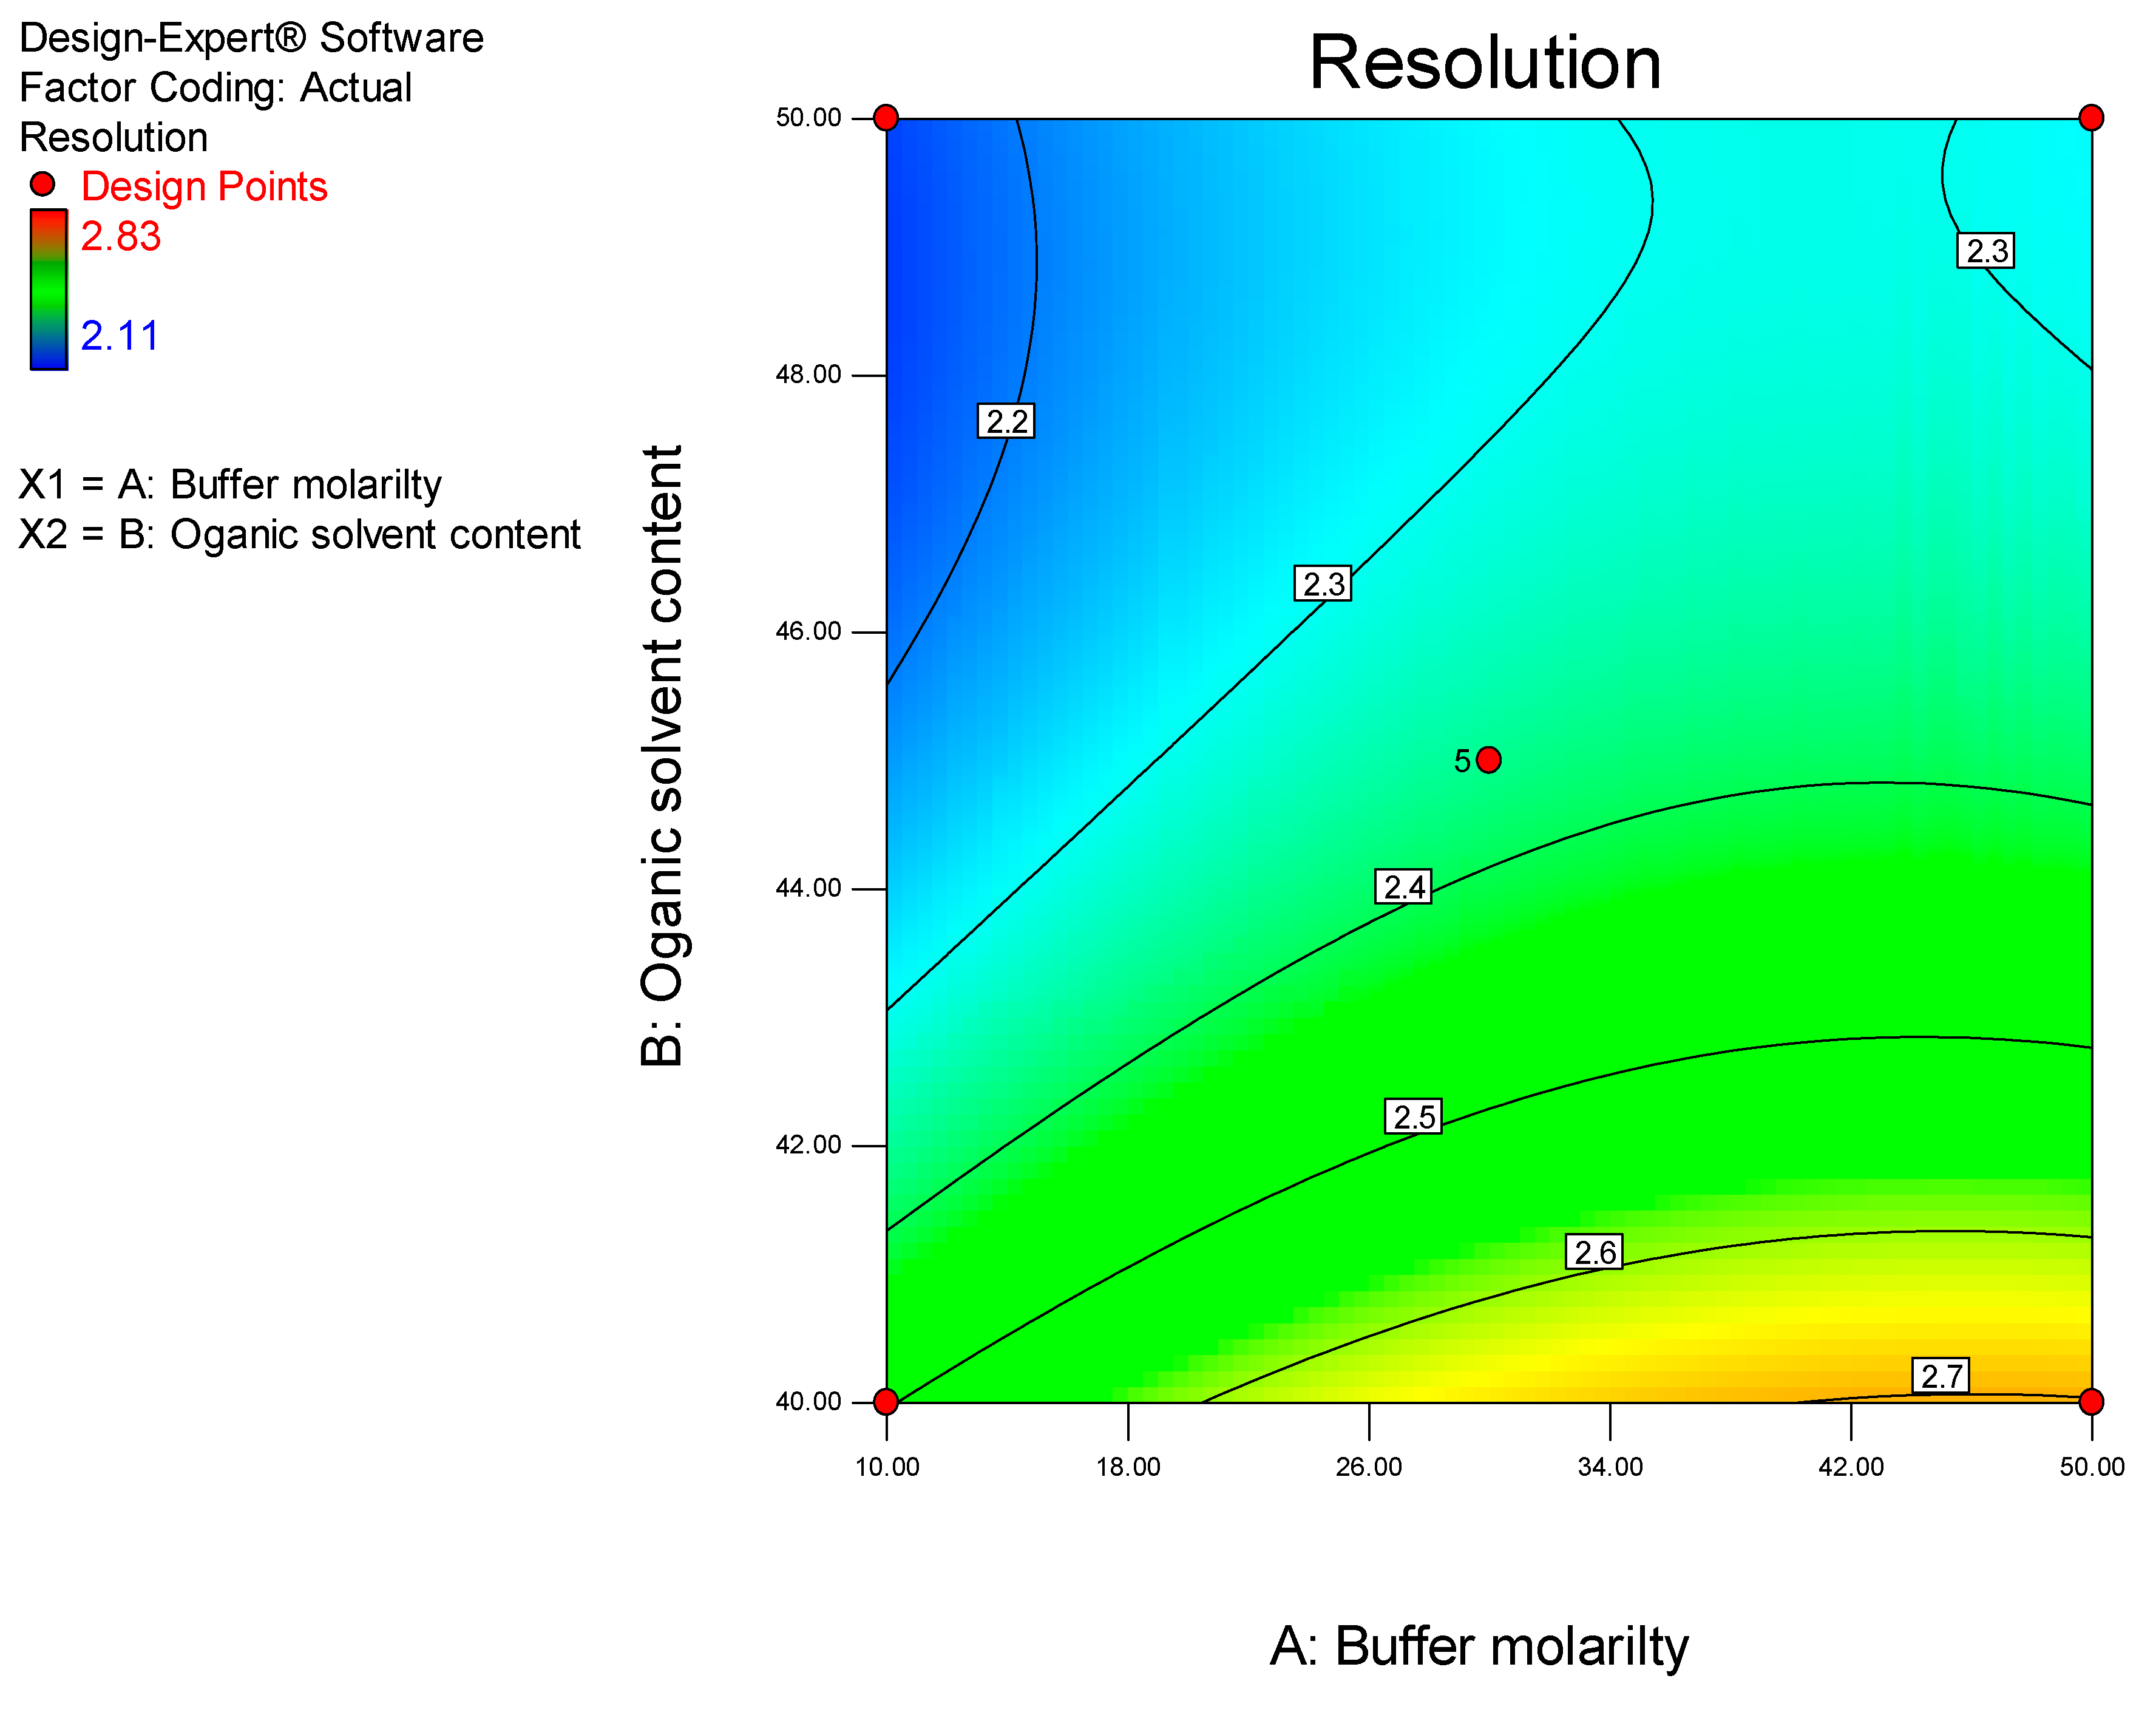
DoE is a chemometric approach that allows for a reduction in the number of experiments conducted associated with lower reagent consumption and less laboratory work [26]. The use of statistical experimental design modelling methods and response optimization based on derived models reduces the time and effort required for the development of complex multi-variable analyses. Furthermore, optimization of HPLC methods are complex processes since, several variables including mobile phase pH and composition, buffer concentration, flow rate, injection volume, column temperature and detector settings must be controlled to achieve an appropriate separation [27]. The approach facilitates the development of suitable polynomial regression models and the addition of valuable scientific information in support of an ability to assess the statistical significance of the influence of input variables on target chromatographic responses [26]. In these studies, a Central Composite Design (CCD) was used to identify the optimum conditions for the HPLC-ECD method.
The development of an HPLC-UV analytical method for the quantification of CLA in pharmaceutical dosage forms using DoE has been reported [28]. The CCD is a three-level full factorial design covering a symmetrical domain with a center point used to estimate experimental error [29]. A CCD may include a two-level full factorial design (2f experiments), a star design (2f experiments) and a center point, requiring N = 2f + 2f + 1 experiments to examine f factors [30,31]. The points of the full factorial design are located at factor levels −1 and +1 and for the star design at factor levels 0, −α and +α, whereas for the center point at a factor level 0 [32].
Method validation is a process that demonstrates that a method will successfully meet or exceed the minimum standards recommended by regulatory authorities for accuracy, precision, selectivity, sensitivity, reproducibility and stability [33]. According to the USP [34], certain parameters of a method may be adjusted or scaled on the condition that allowable limits and equivalency are maintained.
The objective of these studies was to develop a stability indicating the HPLC-ECD method for the quantitative determination of CLA in pharmaceutical formulations and monitoring CLA incorporation into lipid nano-carrier technologies. The method was developed and validated according to International Conference of Harmonization (ICH) guidelines [35]. Method re-validation in addition to modified method scaling as per United States Pharmacopeia (USP) [34] guidelines was also investigated in order to assess and assure the performance of the method when moving across analytical columns of different packing material (L-designation). To our knowledge, this is the first time an experimental design has been applied to the development of a simple, rapid, sensitive and reliable HPLC method using amperometric detection for the quantification of CLA in dosage forms. Furthermore, this is the first study to develop a stability indicating the HPLC-ECD method for CLA whilst investigating a modified USP scaling approach through use of a column of different L-designation.

2. Materials and Methods

2.1. Chemicals and Reagents

All reagents were at least of analytical reagent grade and used without further purification. CLA was purchased from Skyrun Industrial Co. Limited (Taizhou, China) and the internal standard, erythromycin (ERY) was purchased from Sigma Aldrich Chemical Co. (Milwaukee, WI, USA). Clarihexal®, Klarithran®, Klarithran® MR 500 mg tablets, Klarizon 250 mg tablets and Clarihexal®, Klarithran® 250 mg/mL granules for oral suspension were purchased from a local pharmacy. HPLC-grade water was prepared by reverse osmosis using a RephiLe® Direct-Pure UP ultrapure and RO water system (Microsep®, Johanessburg, South Africa), consisting of a deionization RephiDuO® H PAK cartridge and a polishing RephiDuO® PAK cartridge. The water was filtered through a 0.22 μm PES high-flux capsule filter (Microsep®, Johannesburg, South Africa) and used to prepare all buffer solutions. HPLC far UV-grade acetonitrile (ACN) and methanol (MeOH) was purchased from Anatech® Instruments Pty, Ltd. (Randburg, Johannesburg, South Africa). Potassium dihydrogen orthophosphate, sodium chloride and sodium hydroxide pellets were purchased from Merck® Laboratories (Merck®, Wadeville, South Africa).

2.2. Instrumentation and Analytical Conditions

The HPLC system was a Waters® Alliance Model 2695 separation module equipped with a solvent delivery module, an autosampler, an online degasser and a Model 2465 Electrochemical Detector (Waters®, Milford, MA, USA). Data acquisition, processing and reporting were achieved using Waters® Empower 3 software (Waters®, Milford, MA, USA). The separation was achieved under isocratic conditions using a Beckman® C8, 4 μm (150 mm × 4.0 i.d) (Beckman Instruments, Inc., San Ramon, CA, USA) cartridge column with a mobile phase consisting of 50 mM phosphate buffer (pH 7.0), ACN and MeOH in a 58.5:36.5:5.0 v/v/v ratio. The flow rate of the mobile phase and the injection volume were 1.0 mL/min and 10 µL, respectively. The analytical column was maintained at 30 °C using an integral column heater (Waters®, Milford, MA, USA).

2.3. Preparation of Solutions

2.3.1. Stock solution and calibration standards

Standard stock solutions of CLA (100 µg/mL) and ERY (50 µg/mL) were prepared by accurately weighing approximately 10 mg and 5 mg of each API using a Model AE 163 Mettler® analytical balance (Mettler® Inc., Zurich, Switzerland) into 100 mL A-grade volumetric flasks and dissolving in a small volume of ACN. The stock solutions were sonicated using an ultrasonic bath (Ultrasonic Manufacturing Company (Pty), Ltd., Kenware, Krugersdorp, South Africa) until a clear solution formed, after which the solutions were made up to volume with ACN. Calibration standards of CLA over the concentration range 5–50 µg/mL were prepared by serial dilution of the standard stock solution on the day of analysis, using ACN as a diluent. A 0.75 mL aliquot of the 50 µg/mL ERY stock solution was added to all calibration standards and test samples prior to analysis.

2.3.2. Buffer and Mobile Phase

Phosphate buffer solutions (50 mM) were prepared by accurately weighing 6.0845 g potassium dihydrogen orthophosphate into a 1 L A-grade volumetric flask and making up to volume with HPLC grade water. A 0.11 g aliquot of sodium chloride was added to the buffer solution to produce 2 mM equivalent chloride ions. The pH of the buffers was monitored at 22 °C using a Model Basic 20+ Grison pH-meter (Crison Instruments, Barcelona, Spain) and was adjusted to 7.0 using sodium hydroxide pellets. The buffer was degassed under vacuum with the aid of a Model A-2S Eyela Aspirator degasser (Rikakikai Co., Ltd., Tokyo, Japan) and filtered through a 0.2 µm cellulose membrane filter (Sartorius Stedim Biotech GmbH, Goettingen, Germany) prior to being transferred into a 1 L Schott® Duran bottle (Schott Duran GmbH, Wertheim, Germany).

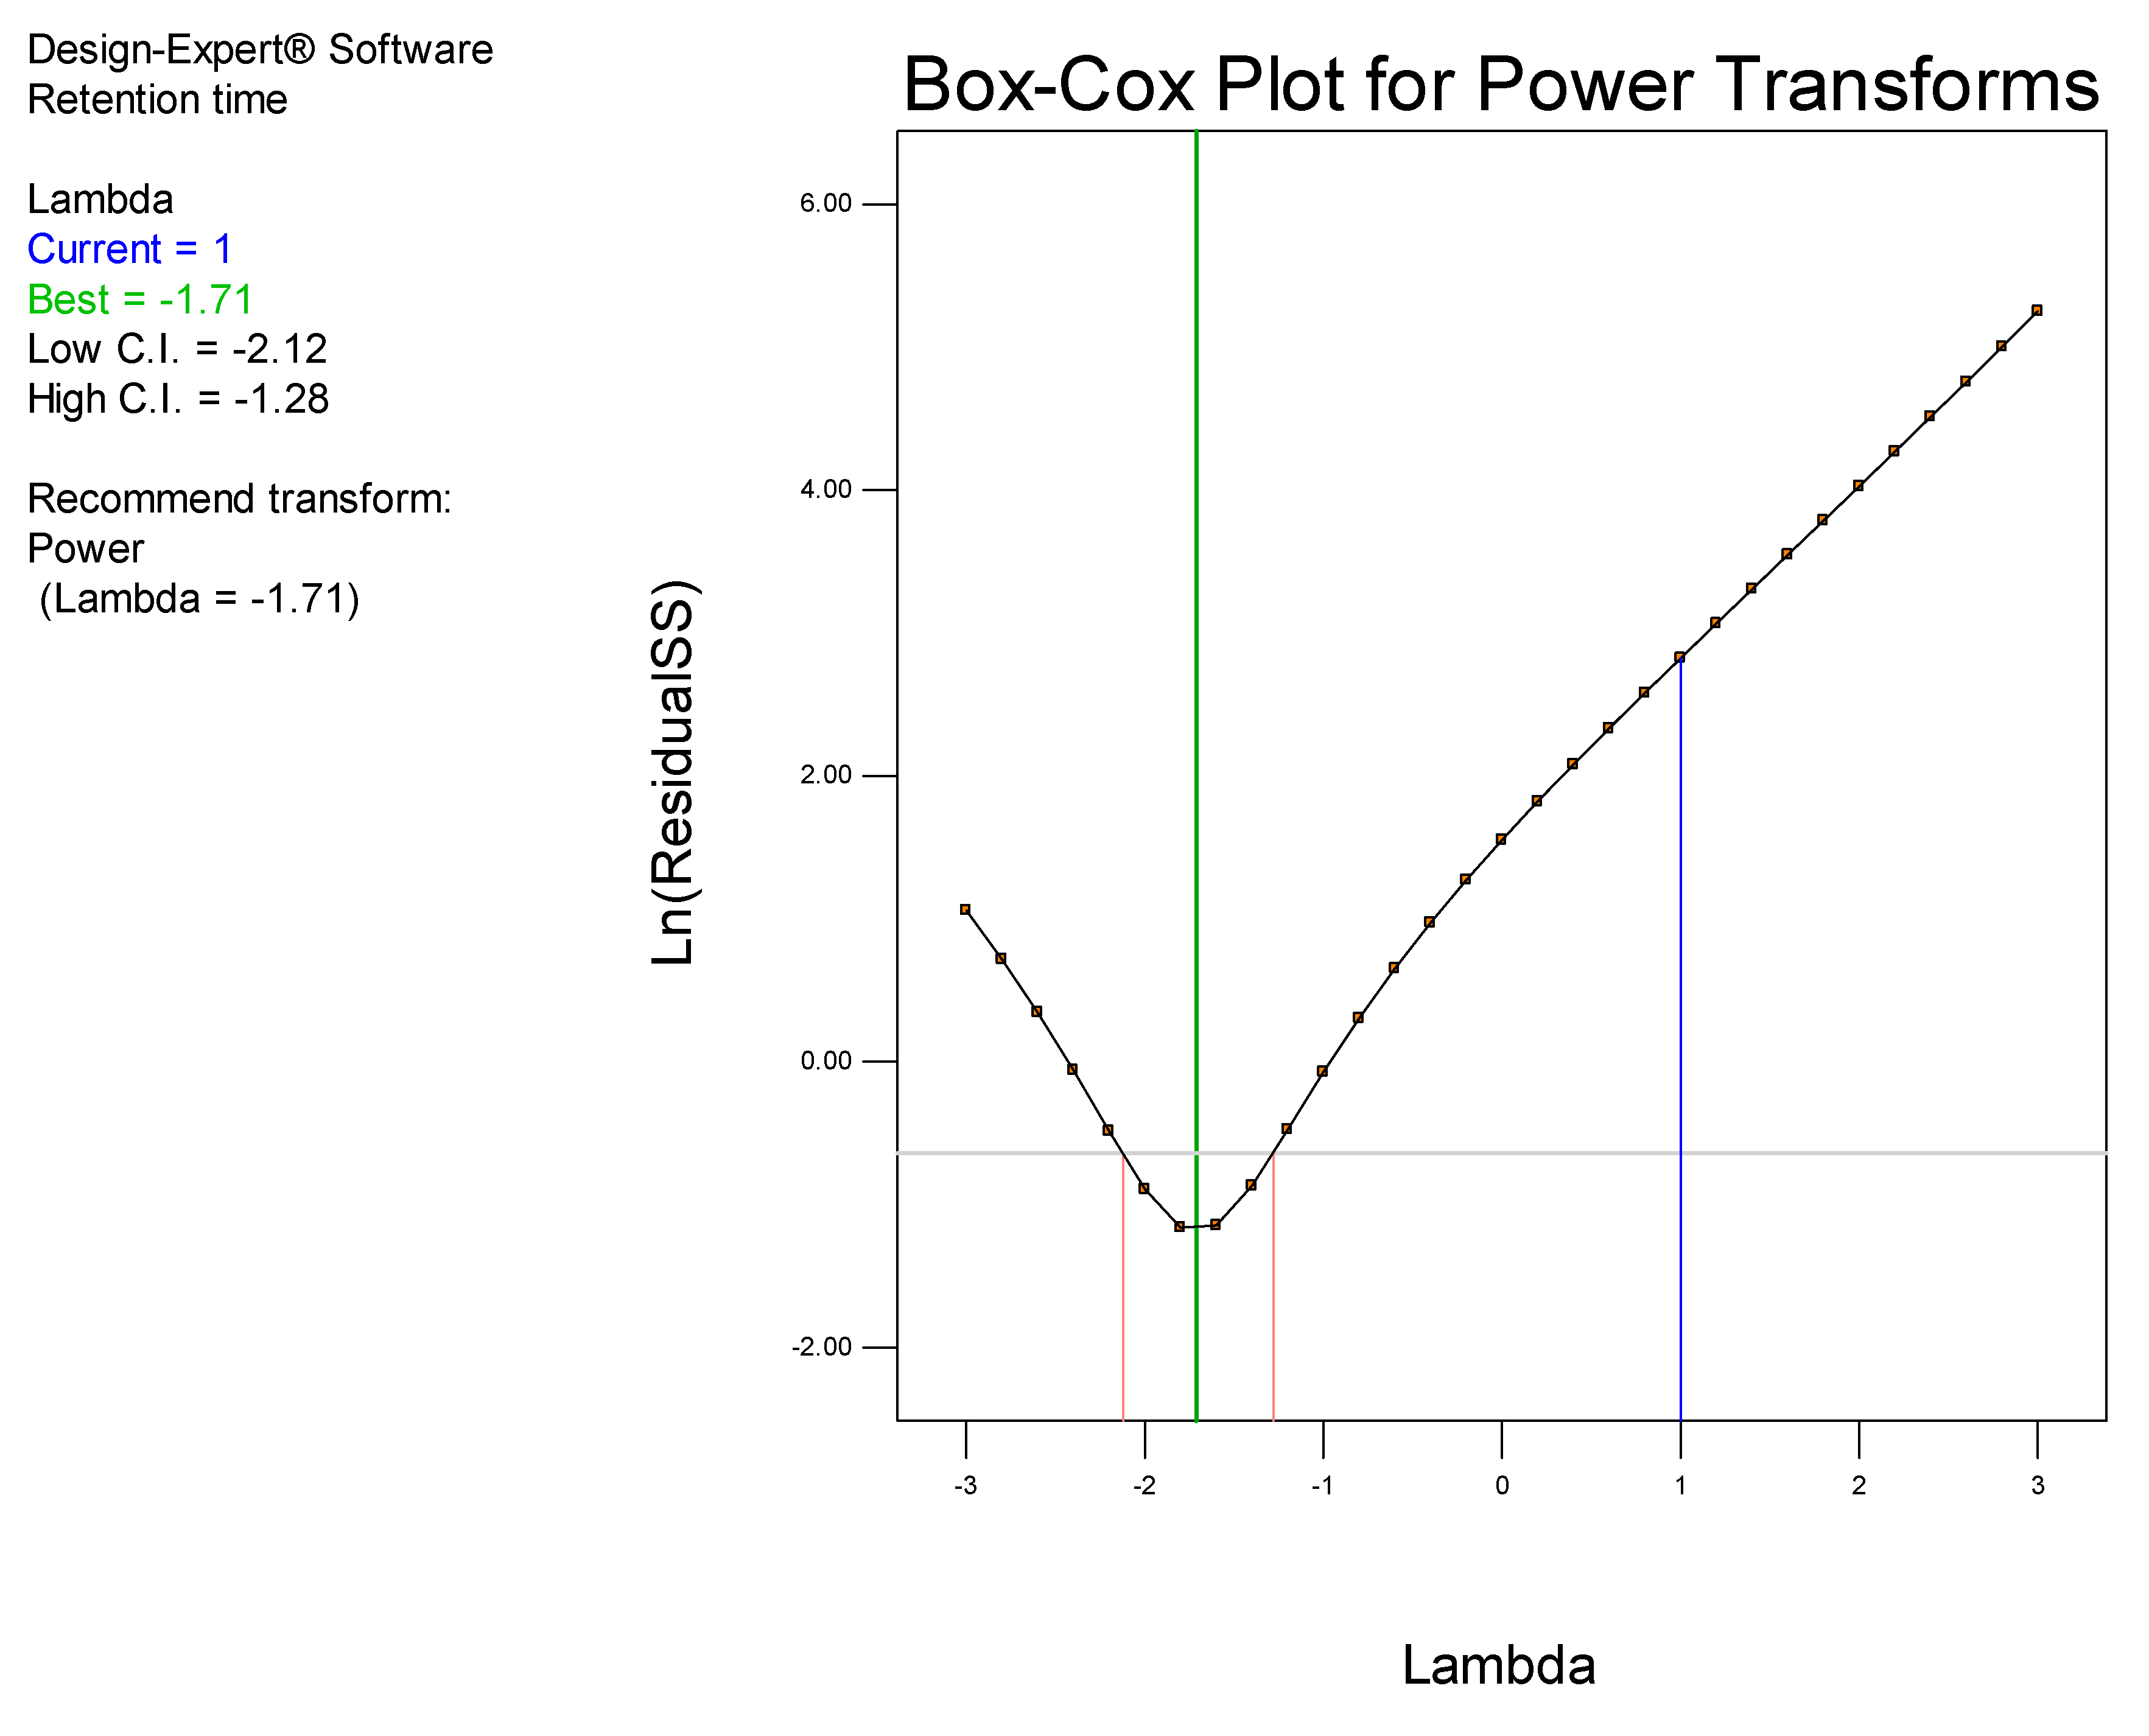
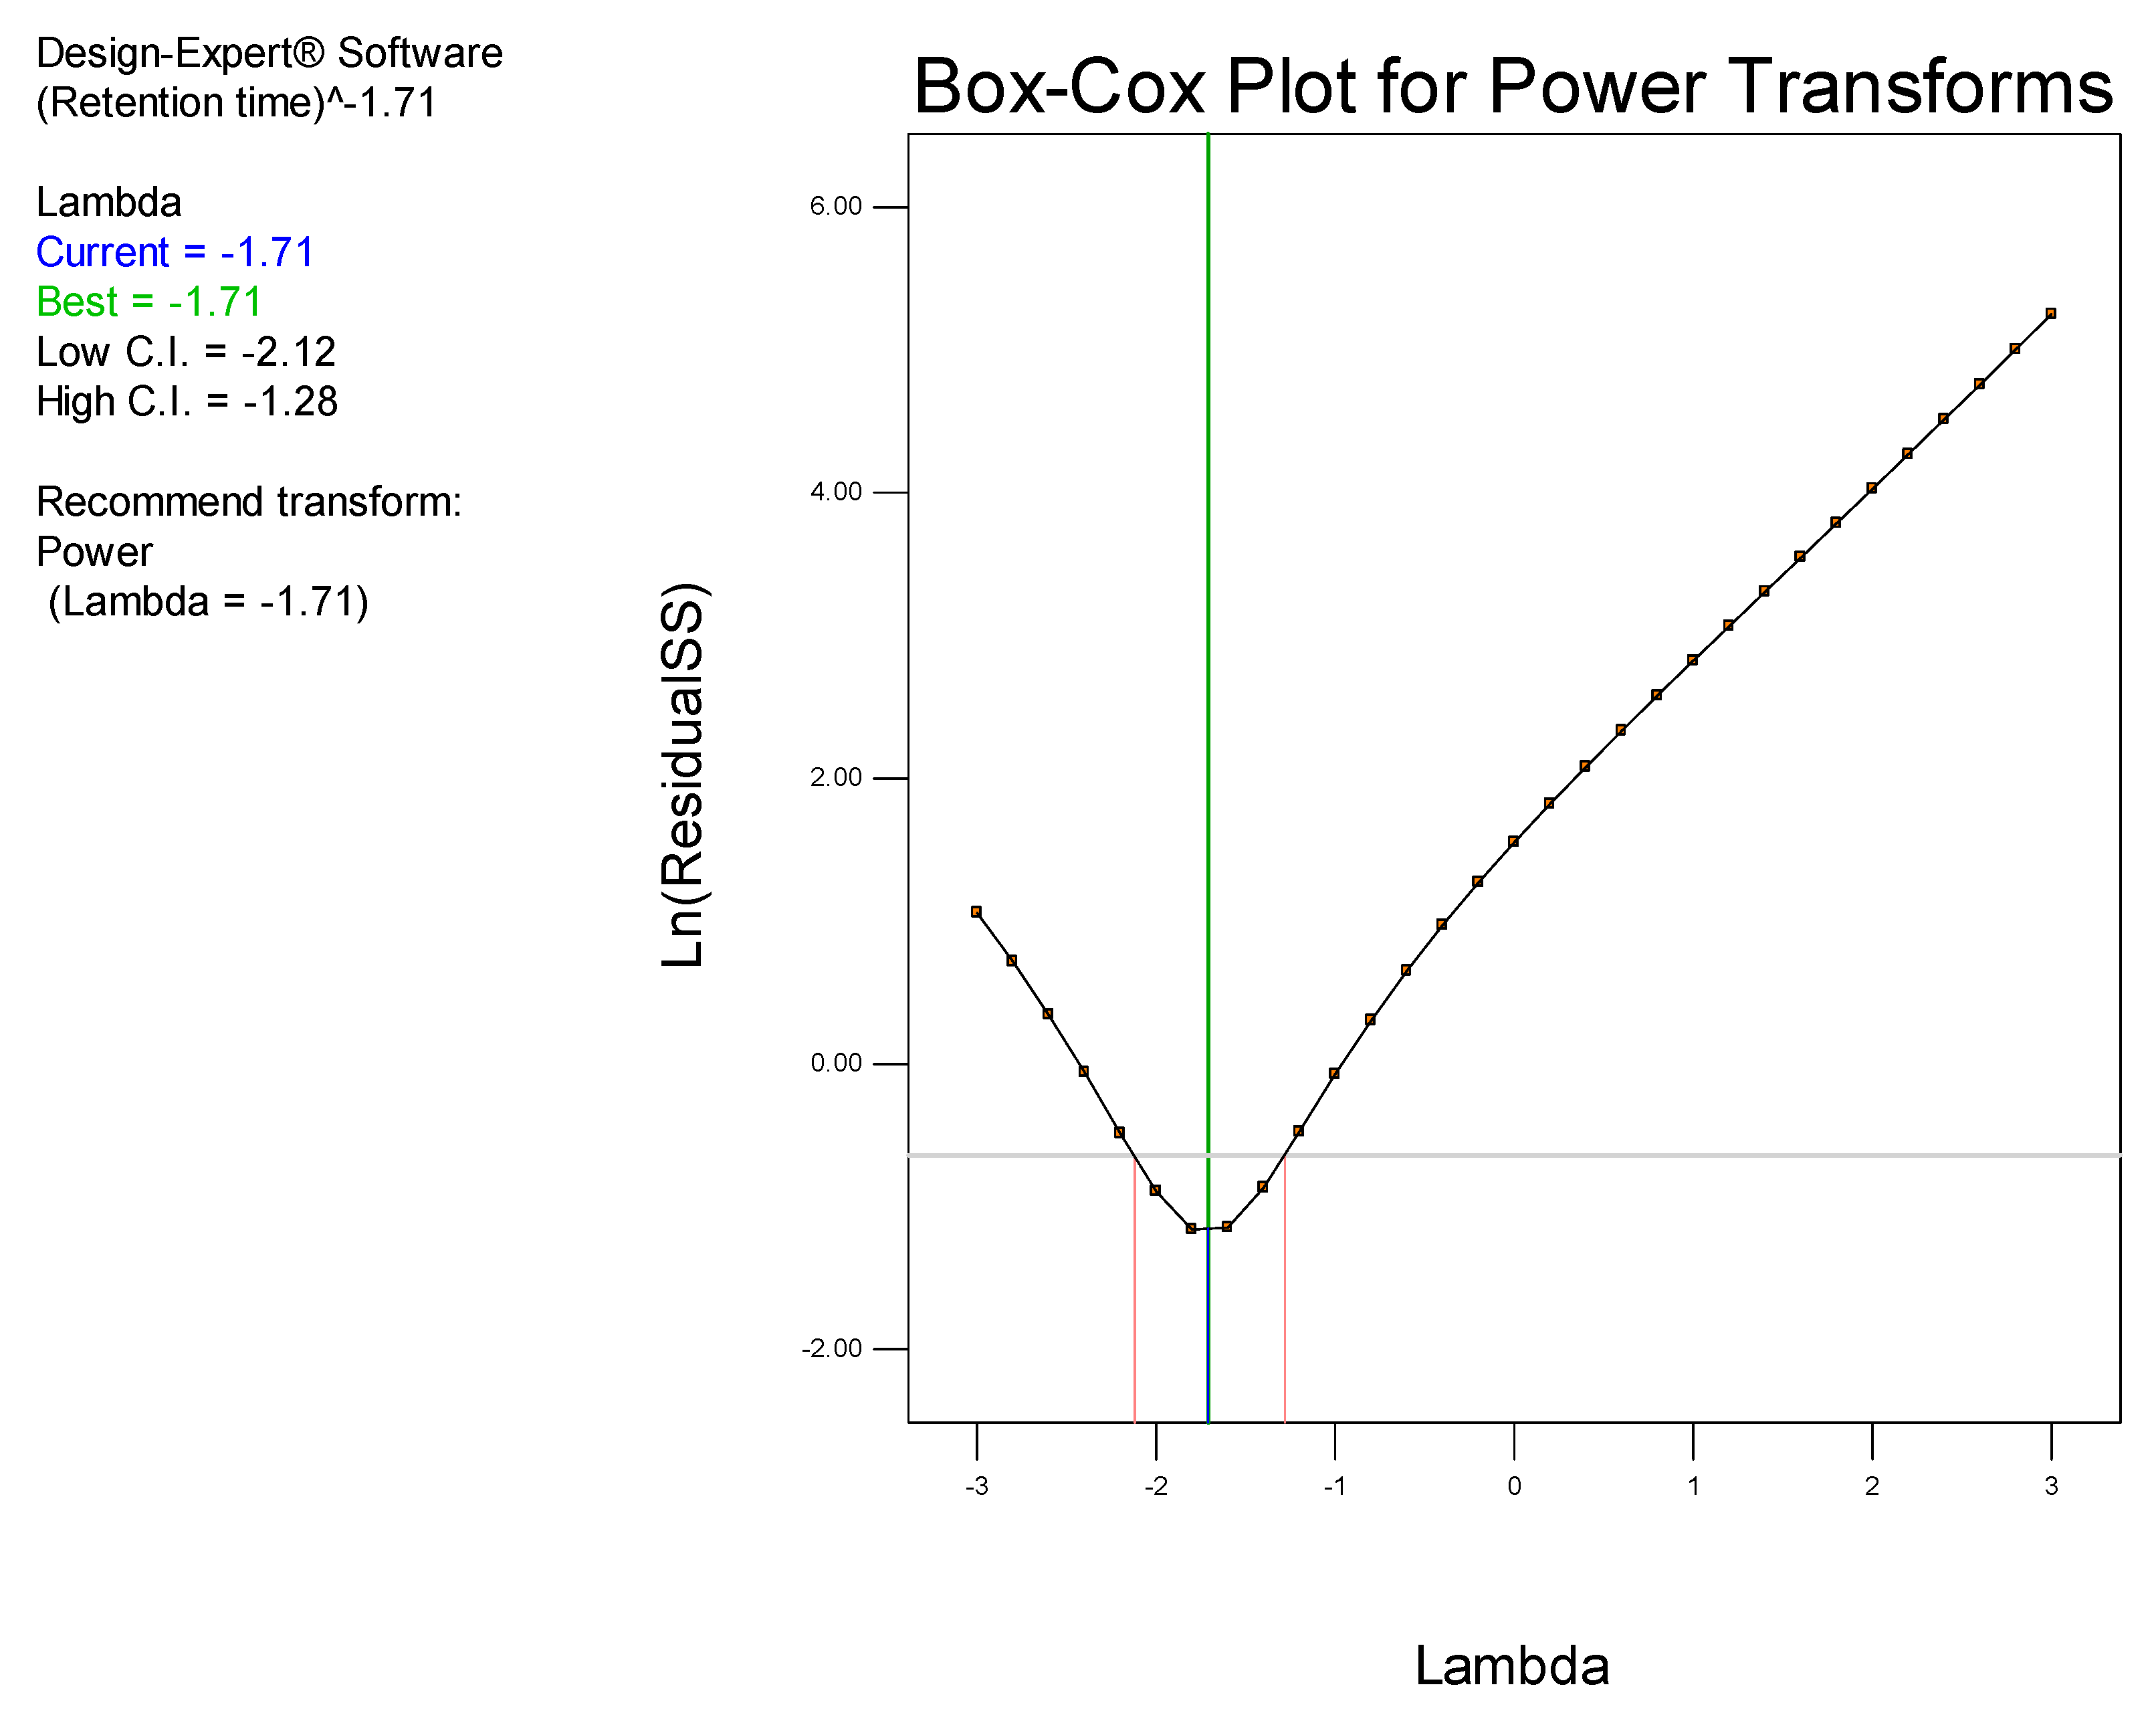
2.4. Statistical Analysis

Data generated were analyzed using Design Expert® version 8.0.2 statistical software (Stat-Ease Inc., Minneapolis, MN, USA). The significance of relevant factors was determined using Fisher’s statistical test for Analysis of Variance (ANOVA). Models were estimated and run to compare first-order interaction terms. ANOVA for linear regression, partitions the total variation of a sample into components that are then used to compute an F-ratio which is used to evaluate the effectiveness of the model. If the probability associated with the F-ratio is low, the model is considered to better fit the data statistically. In these calculations, the higher-order interaction terms are assumed not to contribute, to any great extent, to the behavior of the statistical model.

2.5. Method Validation

2.5.1. Linearity and Range

The linearity was determined using a minimum of five standards injected five times as per the ICH [35] guidelines. The linearity of the method was evaluated over the concentration range of 5–50 µg/mL and least squares linear regression analysis of the peak height ratio (PHR) versus concentration data was used to evaluate the linearity of the method.

2.5.2. Precision

The precision of the method was evaluated at two different levels viz., repeatability (intra-day precision) and intermediate precision (inter-day precision). The repeatability for CLA was determined by analysing a sample solution containing the target level of CLA. Ten replicates (n = 10) of the sample solution were analysed as per the final method procedure [36]. Repeatability was determined using a 50 µg/mL sample solution. The inter-day precision for CLA was determined by analysing sample solutions in replicate (n = 5) at three different concentrations viz., low, middle and high, within the range tested on three different days.

2.5.3. Accuracy

The accuracy of the method was determined by replicate analysis (n = 5) of samples containing known amounts of CLA at low (6.0 µg/mL), middle (25.0 µg/mL) and high (45.0 µg/mL) concentrations. The mean recovery was assessed for compliance according to the ICH guidelines.

2.5.4. LOQ and LOD

The limit of quantitation (LOQ) of the method was determined by evaluating the lowest concentration of CLA that resulted in a precision of < 5% RSD, and the limit of detection (LOD) was taken as the 0.3 × LOQ value. Alternatively, the LOD may be inferred from the concentration resulting in a % RSD of ≤ 20% when the LOQ results in a % RSD of ≤ 10% [37].

2.6. Method Scaling and Re-Validation

Method scaling is used when an adjustment of the method is required and where parameters are changed within permitted limits, to preserve the chromatographic separation. When a change is made to the column, flow rates may need to be adjusted to maintain the separation and chromatographic performance of a method [34,38]. Scaling methods can be used to ensure the same quality of separation while reducing run times, with a reduction in solvent consumption thus ensuring environmental and financial sustainability. In addition, reduced run times result in increased throughput, efficiency of operation and overall profitability.
Chapter 621 of the USP [34] defines permitted adjustments, for a method, for the purposes of scaling without the need for re-validation. These adjustments are permissible provided system suitability requirements, as described in the monograph, are met when the changes are implemented [34,38].
Any column changes must stay within the original method L-designation. For isocratic separations, the particle size and/or the length of the column may be modified provided that the ratio of column length (L) to particle size (dp) (the L/dp) remains constant or falls within the limits of −25%–+50%. When the particle size is changed, the flow rate may require adjustment and can be calculated using Equation (1) [34].
F2 = F1 × [(dc22xdp1)/(dc12xdp2)]
where, F1 and F2 are the flow rates for the original and modified conditions, dc1 and dc2 are the respective column diameters and dp1 and dp2 are the particle sizes of the stationary phase used. Following method development and validation using a Beckman® C8, 4 μm (150 mm × 4.0 i.d) analytical column, further analysis using the column could not be performed. Attempts to regenerate and/or purchase an identical column were unsuccessful as the specific column has been phased out by the manufacturer. Consequently, re-validation and an investigation into the application of method scaling using a different L-designation column were undertaken using a Phenomenex Luna® CN, 5 µm 150 mm × 4.6 mm i.d (Phenomenex®, Torrace, CA, USA) which exhibited a −20% decrease in the L/dp value that fell within the range of −25% to + 50% as per the USP [34] method scaling guidelines. Analysis was undertaken using a mobile phase flow rate of 1.058 mL/min that was calculated using Equation (1).
USP [34] system suitability requirements for resolution, tailing factor and % RSD for peak height ratio (PHR) and retention time, were used to determine if the modified scaling for the HPLC-ECD method resulted in outcomes that were comparable to those observed using re-validation and thus assess, the applicability of the scaled method for the determination of CLA.

2.7. Assay of Clarithromycin Dosage Forms

2.7.1. Assay of Commercial Tablets

Briefly, 20 tablets were crushed using a mortar and pestle and an aliquot of powder equivalent to the mass of one tablet transferred quantitatively to a 100 mL A-grade volumetric flask. Approximately 50 mL ACN was then added to the volumetric flask and the mixture sonicated using a bath sonicator (Ultrasonic Manufacturing Company (Pty), Ltd., Kenware, Krugersdorp, South Africa) with regular shaking at 20 min intervals for 1 h. The solution was allowed to cool to room temperature (22 °C) prior to making up to volume with ACN. A 5 mL aliquot of the resultant mixture was filtered through a 0.45 µm Millipore® Millex-HV Hydrophilic PVDF filter membrane (Millipore® Co., Bedford, MA, USA) and a 25 µg/mL sample solution in ACN was analyzed using the validated HPLC method.

2.7.2. Assay of Commercial Suspensions

The granules for suspension were reconstituted using HPLC-grade water as per the label instructions. A 5 mL aliquot of the reconstituted suspension was transferred to a 100 mL A-grade volumetric flask. Approximately 20 mL 50 mM phosphate buffer (pH 7.00) was then added to the volumetric flask and the mixture sonicated using a bath sonicator (Ultrasonic Manufacturing Company (Pty), Ltd., Kenware, Krugersdorp, South Africa) with regular shaking at 10 min intervals for 30 min. Approximately 30 mL MeOH was added to the flask and the mixture was sonicated for a further 30 min. The solution was allowed to cool to room temperature (22 °C) prior to making up to volume with MeOH. The mixture was then stirred for one hour using a digital hot plate stirrer (Lasec®, Port Elizabeth, South Africa). A 5 mL aliquot of the resultant mixture was filtered through a 0.45 µm Millipore® Millex-HV Hydrophilic PVDF filter membrane (Millipore® Co., Bedford, MA, USA) and analyzed using the validated HPLC method after dilution to obtain a 25 µg/mL solution in ACN.

2.8. Forced Degradation Studies

Stress studies were conducted by exposing CLA to acidic, alkaline, hydrogen peroxide and light conditions [39]. Stock solutions (100 µg/mL) were prepared as described in Section 2.3. These solutions were then exposed to different stress conditions viz., 0.1 M HCL, 0.1 M NaOH, 4% H2O2 at 80 °C and 500 W/m2 for 12 h, prior to analysis using the validated analytical method. A tolerance level of 10% degradation is considered optimal for the purposes of validating the analytical method intended for assay [39]. Consequently, a tolerance of 10% was used to determine if CLA had degraded as a result of exposure to stress conditions. These studies were also performed to determine interference, if any, of degradation products with the chromatography.

3. Results and Discussion

3.1. Method Development and Optimization

3.1.1. Method Development

During the development of the analytical method, a Phenomenex® C18 5 μm Luna column, (150 mm × 2 mm, i.d) and a Beckman®Ultrashere C8 4 μm (150 mm × 4.0 i.d.) column were tested. The Beckman® column produced a better peak shape than the Phenomenex® column. Decreasing the particle size while keeping the column length constant, increases column efficiency and peak resolution [40]. Although C18 and C8 columns have similar selectivity, C8 columns are much less likely to retain compounds due to shorter alkyl chains, resulting in improved peak shape [40], as observed with the Beckman® column. The Beckman® column was selected as the column of choice for use in the analysis of CLA.
Hydrodynamic voltammetric (HDV) studies were undertaken to identify the optimum working electrode potential for the analysis of CLA. The HDV of CLA and ERY generated in direct current (DC) mode at potential settings ranging between +900 mV and +1300 mV at a scan background current of 100 nA is depicted in Figure 2.
These data reveal that a limiting current plateau occurred at a potential of +1200 mV for both CLA and ERY. The response of both macrolides was sigmoidal and can be explained mathematically as a logistic function voltammogram [41]. The background current that exhibited the best signal to noise compromise was 100 nA and was selected for use. In addition, preliminary screening chromatographic experiments were performed to identify factors for optimization. Inclusion of methanol (MeOH) in the mobile phase improved chromatographic behavior and influenced the detector signal positively. However, MeOH increased the retention time significantly due to a low solvent strength based on the Hildebrand’s elution strength scale for reversed-phase liquid chromatography [40]. Consequently, MeOH content was maintained at 2% v/v of the organic phase composition during optimization studies. An increase in column temperature resulted in a prolonged retention time and an increase in baseline noise, possibly due to an increase in the oxidation of mobile phase impurities at the higher temperatures. However, the drift in baseline was reduced at temperatures above ambient (22 °C) conditions. Consequently, a temperature of 30 °C was selected as a compromise and used during optimization studies. Buffer pH was maintained at 7.00 since ERY is stable between pH 7.00 and 8.00 [19,42,43] and the life of silica-based stationary phases is significantly reduced under alkaline conditions [44].

3.1.2. Method Optimization

All experiments undertaken during optimization studies were performed in randomized order to minimize bias of uncontrolled factors. A computer-generated rotatable CCD design consisting of 13 experiments with 5 center points and 8 axial points was generated using Design Expert® version 8.0.2 statistical software (Stat-Ease Inc., Minneapolis, MN, USA). The experimental levels investigated and responses monitored are listed in Table 1. The minimum and maximum values for buffer molarity (X1) were 10 mM and 50 mM, with the lower and upper axial points set at 1.72 mM and 58.28 mM. Similarly, ACN concentration (X2) was kept at minimum and maximum levels of 40% v/v and 50% v/v with respect to mobile phase composition, with the lower and upper axial levels of 37.9% v/v and 52.1% v/v, respectively. The independent input variables and ranges were selected on the basis of preliminary studies, and the retention time (Y1) of the last peak eluted, peak asymmetry (Y2) and peak resolution (Y3) were the responses monitored. The data generated from the responses were analysed using Design Expert® version 8.0.2 statistical software (Stat-Ease Inc., Minneapolis, MN, USA). Fisher’s test for Analysis of Variance (ANOVA) was used to establish the significance of any difference(s) between the factors investigated. The overall design summary consisted of three quadratic and mathematical models for two independent factors. Optimization of significant model variables was undertaken to identify the best combination of factors that would yield the desired responses.

Retention Time

The retention time (Y1) is the most critical response as it has an effect on the length of the analytical run and cost of using a method. ACN concentration and buffer molarity were found to be the statistically significant factors that affected retention time. The influence of ACN concentration and buffer molarity on retention time is depicted in Figure 3.
These data reveal that a decrease in retention time of CLA occurs when the ACN content is increased from 40–50% v/v and the buffer molarity is increased form 10–50 mM. ACN is a strong solvent according to Hilderbrand’s elution strength scale, thereby reducing mobile phase polarity when ACN concentrations are increased [40], leading to preferential partitioning of CLA into the mobile phase resulting in rapid elution and shorter retention times. The decrease in retention time observed with increased buffer molarity can be attributed to increased competition of buffer cations for active silanol sites on the stationary phase, leading to preferential partitioning of CLA into the mobile phase [41].
Examination of the model Box-Cox plot (Figure 4) inferred the need to transform the model. The plot reveals that the blue line fell outside the 95% confidence interval, indicating that the model was not located in the optimum region of the parabola. Consequently, a power transformation of the model was undertaken using model reduction by backward elimination in order to improve the fit of the data to the model, thereby permitting navigation of the design space [45].
The Box-Cox plot (Figure 5) generated following power transformation of the data using backward elimination reveals the blue line falls within the confidence interval, confirming that the data fell in the optimum region of the parabola and indicates model adequacy.
ANOVA was used to evaluate the quadratic model for retention time and Fisher’s F-ratio was calculated to identify significant terms in the model, with the error term set at p = 0.05. Values of Prob > F < 0.0500 indicate model terms that are significant; however, values > 0.1000 indicate that the model terms are not significant. The overall contribution of model factors to retention time were statistically significant, as summarized in Table 2.
The Model F-value of 902.59 implies the model is significant and there is only a 0.01% chance that a Model F-Value this large could occur due to noise. The Pred R-Squared of 0.9892 is in reasonable agreement with the Adj R-Squared of 0.9973. Adeq Precision measures the signal to noise ratio. A ratio > 4 is desirable and the ratio of 96.322 indicates an adequate signal. This model can thus be used to navigate the design space and, therefore, the method developed was able to be applied to predict the retention time of CLA within the limits of the identified design space. The equation for Y1 (retention time) is reported in Equation (2).
Y1−1.71 = +0.023 + 9.208E − 003A + 0.011B + 4.248E − 003AB − 2.301E − 003A2 + 1.276E − 003B2

Peak Symmetry

The asymmetry factor was used to evaluate the response, peak symmetry (Y2). Excellent chromatographic columns have been reported to produce asymmetry factor values between 0.95 and 1.1 [46]. Due to the molecular mass and the basic nature of CLA, interaction with silica-based reversed-phase columns results in marked tailing of the peaks, due to interaction with residual silanols of the stationary phase [47], resulting in poor peak symmetry.
ANOVA analysis reveals that the model for peak symmetry was significant (p = 0.0149). The significant model term established was ACN content (p = 0.0011). The influence of ACN concentration on CLA peak symmetry is depicted in Figure 6.
The best peak shape with minimal tailing can be obtained at an ACN concentration of approximately 46% v/v. Due to peak tailing, the experimental run time was increased to 20 min to permit the chromatograms to return to baseline. The equation for peak symmetry (Y2) is reported in Equation (3).
1/Sqrt (Asymmetry) = + 0.13 + 5.545E − 003A + 4.846E − 003B − 3.690E − 003AB − 2.773E − 003A2 − 0.022B2

Peak Resolution

The goal of the HPLC analysis was to separate CLA from all other components present. Resolution is a measure of the degree of separation of two adjacent analytes [40]. Ideally, most HPLC methods should achieve a baseline separation between 1.5 and 2.0 for all analytes of interest [48].
ANOVA analysis reveals that the model for peak resolution was significant (p < 0.0001). The significant model terms were buffer molarity and ACN content with p values of 0.0028 and <0.0001, respectively. The two-dimensional contour plot of the influence of the two factors on peak resolution is depicted in Figure 7.
ACN content and buffer molarity can be manipulated to improve peak resolution. The contour plot suggests that increased peak resolution will be obtained when a buffer molarity of 50 mM and ACN content of approximately 40% v/v is used. The equation for peak resolution (Y3) is reported in Equation (4).
Resolution = + 2.37 + 0.083A − 0.19B − 0.020AB − 0.064A2 + 0.11B2

3.1.3. Optimized Chromatographic Conditions

The overall solutions for chromatographic analysis of CLA and ERY were identified by optimization of the quadratic models using Design Expert statistical software Version 8.0.2 Design Expert® statistical software (Stat-Ease Inc., Minneapolis, MN, USA). A series of compromises is required when evaluating outputs from Design Expert®. For example, for a retention time of ≤ 10 min, minimum peak asymmetry and maximum resolution between CLA and ERYthe impact of MeOH was largely avoided, by maintaining the content at 2.0% v/v and therefore ensured the benefits of using this solvent were achieved. Elegant multi-criteria statistical solutions are possible; however, they may be considered if required when this pragmatic approach to optimization is not adequate. Solutions to quadratic models have been generated by matrix calculation using Cramer’s rule, Eigenvalues and Eigenfunctions, for the optimized conditions of chromatography for captopril [41] but were not considered necessary for this separation. The optimized conditions for the overall separation are summarized in Table 3.
The optimized chromatographic separation was applied to the quantitative analysis of CLA and the final separation produced well resolved peaks for CLA and ERY (Figure 8). The % prediction error for retention time of CLA using the optimized conditions in relation to the predicted retention time was −6.19%. The % prediction errors for resolution and asymmetry were −2.38% and −10.13%, respectively. The low values for the calculated percentage prediction errors indicate the robustness of the mathematical models used. In addition, the high predictive ability of DoE is also demonstrated, suggesting the efficiency of DoE, for process optimization [49].
Prior to validation of the analytical method, an attempt was made to improve peak shape and detector sensitivity by investigating the effect of the amount of MeOH as a component of the mobile phase.

Effect of Methanol

The inclusion of MeOH in the mobile phase was found to have a positive effect on peak and chromatographic responses during method development. MeOH inclusion in the mobile phase was investigated over a 2 to 10% v/v range. Well resolved chromatographic responses were achieved for all concentrations of MeOH investigated. The average peak height ratios of CLA and ERY over the concentration range investigated are summarized in Table 4.
The increase in MeOH content in the mobile phase resulted in an increase in the retention time of CLA and ERY. The % RSD of the peak response decreases with an increase in MeOH content. Consequently, 5% v/v MeOH was used in the mobile phase for all validation studies as the run time of 20 min was deemed suitable for this analysis.

3.2. Method Validation

3.2.1. Linearity and Range

The calibration curve was found to be linear with a R2 of 0.9997, a slope of 0.0233 and a y-intercept of 0.0439, yielding a regression equation of y = 0.0233 + 0.0439. Correlation coefficients of >0.990 are generally considered as evidence of acceptable linearity fora regression line [37]. Consequently, the HPLC-ECD method was linear over the concentration range of CLA investigated.

3.2.2. Precision

The precision data are summarized in Table 5. These data reveal that in all cases, the % RSD values were < 2%, indicating that the method is precise and can be used as intended.

3.2.3. Accuracy

The data for accuracy are listed in Table 6 and % RSD values for all analyses were < 2%, indicating that the HPLC-ECD analytical method is accurate and suitable for its intended purpose.

3.2.4. LOQ and LOD

The LOQ was 0.05 µg/mL with an associated % RSD of 4.27% and by convention, the LOD was 0.02 µg/mL.

3.3. Re-Validation and Method Scaling

Method re-validation following the column change was deemed successful. In addition, scaling of the method across analytical columns of different L-designation met all USP system suitability requirements for resolution, tailing factor and % RSD for this HPLC-ECD method, confirming the potential applicability of method scaling using a different stationary phase in a different class as an efficient tool for this method resulting in a shorter run time, decreased solvent consumption and reduced cost. The data generated from these studies are listed in Table 7 and Table 8.
Chromatographic responses before and after method re-validation and scaling are depicted in Figure 8. The scaled method revealed an improvement in peak asymmetry, producing sharp peaks with reduced tailing in a shorter analytical run time in comparison to the method developed using the Beckman® column. Columns in which CN functional groups are used are more polar than C8-based phases and exhibit shorter retention times and exhibit different selectivity than C8 columns [40]. Consequently, the repulsion of the ionized CLA moiety at pH 7.00 when using the CN column, led to reduced peak tailing and shorter analytical run times.

3.4. Forced Degradation Studies

The results of forced degradation studies can be used to establish specificity and stability indicating characteristics of the HPLC-ECD method. Data from these studies are summarized in Table 9 and the resultant chromatograms are depicted in Figure 9.
The data reveal that CLA undergoes extensive degradation when exposed to oxidative stress conditions. Oxidation of CLA has been reported to occur via reactivity of the tertiary amino group [9]. Consequently, the reaction with hydrogen peroxide is thought to oxidise CLA, resulting in products that cannot oxidise during analysis. Exposure of CLA to acidic conditions (pH 1.2) resulted in approximately 5% degradation, which could be attributed to hydrolysis of cladinose [50], confirming previously published data which reported 90.2% and 41.1% loss of CLA from aqueous samples exposed in solution to pH 1.0 and pH 2.0 for four hours [51]. However, one of the degradants interferes with the chromatogram following acid hydrolysis and can be seen in Figure 9D, thus failing to infer specificity of the method for these conditions. Nevertheless, the extreme conditions used for these studies are unlikely to be used in any of the manufacturing or analytical procedures, therefore this outcome is of little concern as the study was conducted at a temperature well in excess of the normal conditions used for analyses. Exposure to alkaline conditions led to significant degradation of CLA that may be attributed to the presence of ester functional groups that are susceptible to hydrolysis in alkaline conditions. Acid and base hydrolysis does not result in the total loss of the oxidizing potential of CLA, implying the molecule may be detected and separated in the presence of degradation products but with some interference observed in acid hydrolysis. CLA was stable with < 10% degradation observed following exposure to heat and UV radiation for 12 h.

3.5. Assay

The specificity of the method to resolve peak(s) of interest from any possible excipients or contaminants that may be present in a dosage form was established by quantitation of CLA in commercially available tablets and suspensions. All tablet and suspension samples complied with USP assay specifications. The USP assay limits for clarithromycin tablets of 90.0%–110.0% [52] and suspensions 90.0%–115.0% [53] were used as the acceptance criteria. The assay results are listed in Table 10. The analysis of CLA dosage forms resulted in clear, sharp, well-resolved peaks without interference from any excipients used for manufacture (Figure 8).

4. Conclusions

A simple, selective and sensitive high-performance liquid chromatographic method with electrochemical detection for the quantitation of clarithromycin in bulk samples and oral dosage forms has been developed. The method complies with ICH validation parameters. In addition, an attempted investigation into the applicability of USP method scaling across different L-designation proved feasible. Method scaling allows for translation of an analytical method while achieving an equivalent separation without the need for re-validation. In this study, a revalidation was undertaken and confirmed the applicability of method scaling across analytical columns of different L-designation, to the HPLC-ECD analytical determination of CLA. This, in turn, saves costs and is environmentally sustainable as less solvent is used and reduced analytical run times can be achieved. The scaled method resulted in an increase in throughput with shorter run times that resulted in less solvent consumption in the laboratory. HPLC methods can thus be scaled on condition that they meet USP system suitability requirements, maintaining separation quality, thereby eliminating the need for method re-validation. Although USP method scaling is only permitted for columns within the same L-designation, its applicability should be investigated across analytical columns of different L-designation to further streamline regulatory requirements. This is, to the best of our knowledge, the first evaluation of an HPLC-ECD method using a modified scaling approach.

Author Contributions

P.A.M. and M.T.R.C. performed the experiments, analyzed the data and wrote the article. R.B.W. and S.M.M.K. contributed to the conceptualization, supervision, bibliographical research and proof reading of the manuscript.

Funding

The authors acknowledge funding support from the Rhodes University Research Committee.

Acknowledgments

The authors wish to acknowledge the Research Committee of Rhodes University (R.B.W.) for financial assistance.

Conflicts of Interest

The authors report no conflict of interest and the authors are responsible for the content and writing of this manuscript.

References

  1. Kanfer, I.; Skinner, M.; Walker, R. Analysis of macrolide antibiotics. J. Chromatogr. A 1998, 812, 255–286. [Google Scholar] [CrossRef]
  2. Li, W.; Jia, H.; Zhao, K. Determination of clarithromycin in rat plasma by HPLC–UV method with pre-column derivatization. Talanta 2007, 71, 385–390. [Google Scholar] [CrossRef] [PubMed]
  3. Esfandi, E.; Ramezani, V.; Vatanara, A.; Najafabadi, A.R.; Pouya, S.; Moghaddam, H. Clarithromycin Dissolution Enhancement by Preparation of Aqueous Nanosuspensions Using Sonoprecipitation Technique. Iran. J. Pharm. Res. 2014, 13, 809–818. [Google Scholar] [PubMed]
  4. Peters, D.H.; Clissold, S.P. Clarithromycin. A review of its antimicrobial activity, pharmacokinetic properties and therapeutic potential. Drugs 1992, 44, 117–164. [Google Scholar] [CrossRef]
  5. Abuga, K.O.; Chepkwony, H.K.; Roets, E.; Hoogmartens, J. A stability-indicating HPLC method for the separation of clarithromycin and related substances in bulk samples. J. Sep. Sci. 2001, 24, 849–855. [Google Scholar] [CrossRef]
  6. Bekele, L.K.; Gebeyehu, G.G. Application of Different Analytical Techniques and Microbiological Assays for the Analysis of Macrolide Antibiotics from Pharmaceutical Dosage Forms and Biological Matrices. Anal. Chem. 2012, 2012, 1–17. [Google Scholar] [CrossRef]
  7. Bahrami, G.; Mohammadi, B. Determination of clarithromycin in human serum by high-performance liquid chromatography after pre-column derivatization with 9-fluorenylmethyl chloroformate: Application to a bioequivalence study. J. Chromatogr. B 2007, 850, 417–422. [Google Scholar] [CrossRef]
  8. Sharma, M.; Gupta, N.; Gupta, S. Implications of designing clarithromycin loaded solid lipid nanoparticles on their pharmacokinetics, antibacterial activity and safety. RSC Adv. 2016, 6, 76621–76631. [Google Scholar] [CrossRef]
  9. Huber, M.M.; Korhonen, S.; Ternes, T.A.; von Gunten, U. Oxidation of pharmaceuticals during water treatment with chlorine dioxide. Water Res. 2005, 39, 3607–3617. [Google Scholar] [CrossRef]
  10. Taninaka, C.; Ohtani, H.; Hanada, E.; Kotaki, H.; Sato, H.; Iga, T. Determination of erythromycin, clarithromycin, roxithromycin, and azithromycin in plasma by high-performance liquid chromatography with amperometric detection. J. Chromatogr. B Biomed. Sci. Appl. 2000, 738, 405–411. [Google Scholar] [CrossRef]
  11. Zaater, M.F.; Tahboub, Y.R.; Ghanem, E. Determination and stability assessment of clarithromycin in human plasma using RP-LC with electrochemical detection. J. Chromatogr. Sci. 2012, 50, 763–768. [Google Scholar] [CrossRef] [PubMed]
  12. Lohitnavy, M.; Lohitnavy, O.; Sareekan, K.; Chaiyaput, W. Average bioequivalence study of clarithromycin tablets in healthy male volunteers. J. Clin. Pharm. Ther. 2003, 28, 187–190. [Google Scholar] [CrossRef] [PubMed]
  13. Erah, P.O.; Barrett, D.A.; Shaw, P.N. Ion-pair high-performance liquid chromatographic assay method for the assessment of clarithromycin stability in aqueous solution and in gastric juice. J. Chromatogr. B Biomed. Sci. Appl. 1996, 682, 73–78. [Google Scholar] [CrossRef]
  14. Lange, F.; Cornelissen, S.; Kubac, D.; Sein, M.M.; von Sonntag, J.; Hannich, C.B.; Golloch, A.; Heipieper, H.J.; Möder, M.; von Sonntag, C. Degradation of macrolide antibiotics by ozone: A mechanistic case study with clarithromycin. Chemosphere 2006, 65, 17–23. [Google Scholar] [CrossRef] [PubMed]
  15. Sastre Toraño, J.; Guchelaar, H.-J. Quantitative determination of the macrolide antibiotics erythromycin, roxithromycin, azithromycin and clarithromycin in human serum by high-performance liquid chromatography using pre-column derivatization with 9-fluorenylmethyloxycarbonyl chloride and fluorescence detection. J. Chromatogr. B Biomed. Sci. Appl. 1998, 720, 89–97. [Google Scholar]
  16. Chu, S.-Y.; Sennello, L.T.; Sonders, R.C. Simultaneous determination of clarithromycin and 14(R)-hydroxyclarithromycin in plasma and urine using high-performance liquid chromatography with electrochemical detection. J. Chromatogr. B Biomed. Sci. Appl. 1991, 571, 199–208. [Google Scholar] [CrossRef]
  17. Hedenmo, M.; Eriksson, B.-M. Liquid chromatographic determination of the macrolide antibiotics roxithromycin and clarithromycin in plasma by automated solid-phase extraction and electrochemical detection. J. Chromatogr. A 1995, 692, 161–166. [Google Scholar] [CrossRef]
  18. Choi, S.J.; Kim, S.B.; Lee, H.S.H.-Y.Y.; Na, D.H.; Yoon, Y.S.; Lee, S.S.; Kim, J.H.; Lee, K.C.; Lee, H.S.H.-Y.Y. Column-switching high-performance liquid chromatographic determination of clarithromycin in human plasma with electrochemical detection. Talanta 2001, 54, 377–382. [Google Scholar] [CrossRef]
  19. Kees, F.; Spangler, S.; Wellenhofer, M. Determination of macrolides in biological matrices by high-performance liquid chromatography with electrochemical detection. J. Chromatogr. A 1998, 812, 287–293. [Google Scholar] [CrossRef]
  20. Wibawa, J.I.; Shaw, P.; Barrett, D. Quantification of clarithromycin, its 14-hydroxy and decladinose metabolites in rat plasma, gastric juice and gastric tissue using high-performance liquid chromatography with electrochemical detection. J. Chromatogr. B 2003, 783, 359–366. [Google Scholar] [CrossRef]
  21. Foroutan, S.M.; Zarghi, A.; Shafaati, A.; Madadian, B.; Abolfathi, F. Rapid high performance liquid chromatographic method for determination of clarithromycin in human plasma using amperometric detection: Application in pharmacokinetic and bioequivalence studies. Iran. J. Pharm. Res. 2013, 12, 65–69. [Google Scholar] [PubMed]
  22. Leonard, S.; Ferraro, M.; Adams, E.; Hoogmartens, J.; Schepdael, A. Van Application of liquid chromatography/ion trap mass spectrometry to the characterization of the related substances of clarithromycin. Rapid Commun. Mass Spectrom. 2006, 20, 3101–3110. [Google Scholar] [CrossRef] [PubMed]
  23. Calza, P.; Medana, C.; Padovano, E.; Giancotti, V.; Baiocchi, C. Identification of the unknown transformation products derived from clarithromycin and carbamazepine using liquid chromatography/high-resolution mass spectrometry. Rapid Commun. Mass Spectrom. 2012, 26, 1687–1704. [Google Scholar] [CrossRef] [PubMed]
  24. Ogoko, E.C.; Odoemelam, S.A.; Ita, B.I.; Eddy, N.O. Adsorption and inhibitive properties of clarithromycin for the corrosion of Zn in 0.01 to 0.05 M H2SO4. Port. Electrochim. Acta 2009, 27, 713–724. [Google Scholar] [CrossRef]
  25. Pappa-Louisi, A.; Papageorgiou, A.; Zitrou, A.; Sotiropoulos, S.; Georgarakis, E.; Zougrou, F. Study on the electrochemical detection of the macrolide antibiotics clarithromycin and roxithromycin in reversed-phase high-performance liquid chromatography. J. Chromatogr. B Biomed. Sci. Appl. 2001, 755, 57–64. [Google Scholar] [CrossRef]
  26. Sahu, P.K.; Ramisetti, N.R.; Cecchi, T.; Swain, S.; Patro, C.S.; Panda, J. An overview of experimental designs in HPLC method development and validation. J. Pharm. Biomed. Anal. 2018, 147, 590–611. [Google Scholar] [CrossRef]
  27. Vander Heyden, Y.; Nijhuis, A.; Smeyers-Verbeke, J.; Vandeginste, B.G.; Massart, D. Guidance for robustness/ruggedness tests in method validation. J. Pharm. Biomed. Anal. 2001, 24, 723–753. [Google Scholar] [CrossRef]
  28. Elkhoudary, M.M.; Salam, R.A.A.; Hadad, G.M. Robustness Testing in HPLC Analysis of clarithromycin, norfloxacin, doxycycline, tinidazole and omeprazole in pharmaceutical dosage forms using experimental design. Curr. Pharm. Anal. 2014, 10, 58–70. [Google Scholar] [CrossRef]
  29. Dejaegher, B.; Vander Heyden, Y. Experimental designs and their recent advances in set-up, data interpretation, and analytical applications. J. Pharm. Biomed. Anal. 2011, 56, 141–158. [Google Scholar] [CrossRef]
  30. Lewis, G.A.; Mathieu, D.; Phan-Tan-Luu, R. (Eds.) Pharmaceutical Experimental Design, 1st ed.; CRC Press: Boca Raton, FL, USA, 1998. [Google Scholar]
  31. Dejaegher, B.; Vander Heyden, Y. The use of experimental design in separation science. Acta Chromatogr. 2009, 21, 161–201. [Google Scholar] [CrossRef]
  32. Massart, D.L.; Vandeginste, B.G.; Buydens, L.M.C.; Lewi, P.J.; Smeyers-Verbeke, J.; De Jong, S. Handbook of Chemometrics and Qualimetrics; Elsevier: New York, NY, USA, 1997. [Google Scholar]
  33. Bansal, S.; DeStefano, A. Key elements of bioanalytical method validation for small molecules. AAPS J. 2007, 9, E109–E114. [Google Scholar] [CrossRef] [PubMed]
  34. General Chapter <621> Chromatography. In United States Pharmacopeia 40 National Formulary 35 (USP 40–NF 35); United States Pharmacopeial: Rockville, MD, USA, 2017; pp. 508–520.
  35. ICH Q2 (R1) Harmonised Tripatite Guidline. Validation of Analytical Procedures, Texts and Methodology. Available online: https://www.ich.org/fileadmin/Public_Web_Site/ICH_Products/Guidelines/Quality/Q2_R1/Step4/Q2_R1__Guideline.pdf (accessed on 25 July 2019).
  36. Shabir, G.A.; John Lough, W.; Arain, S.A.; Bradshaw, T.K. Evaluation and Application of Best Practice in Analytical Method Validation. J. Liq. Chromatogr. Relat. Technol. 2007, 30, 311–333. [Google Scholar] [CrossRef]
  37. LoBrutto, R.; Patel, T. Method Validation. HPLC for Pharmaceutical Scientists. In Method Validation. HPLC for Pharmaceutical Scientists; John Wiley & Sons, Inc.: Hoboken, NJ, USA, 2006; pp. 455–502. [Google Scholar]
  38. Dolan, J. Method Adjustment the USP Way. Available online: http://www.chromatographyonline.com/method-adjustment-usp-way (accessed on 13 August 2019).
  39. Blessy, M.; Patel, R.D.; Prajapati, P.N.; Agrawal, Y.K. Development of forced degradation and stability indicating studies of drugs-A review. J. Pharm. Anal. 2014, 4, 159–165. [Google Scholar] [CrossRef] [Green Version]
  40. Dong, M.W. Modern HPLC for Practicing Scientists, 1st ed.; Wiley Interscience: Hoboken, NJ, USA, 2006. [Google Scholar]
  41. Khamanga, S.M.; Walker, R.B. The use of experimental design in the development of an HPLC–ECD method for the analysis of captopril. Talanta 2011, 83, 1037–1049. [Google Scholar] [CrossRef] [PubMed]
  42. Tsuji, K.; Goetz, J.F. High-performance liquid chromatographic determination of erythromycin. J. Chromatogr. 1978, 147, 359–367. [Google Scholar] [CrossRef]
  43. Brisaert, M.; Heylen, M.; Plaizier-Vercammen, J. Investigation on the chemical stability of erythromycin in solutions using an optimization system. Pharm. World Sci. 1996, 18, 182–186. [Google Scholar] [CrossRef] [PubMed]
  44. Kirkland, J.J.; Henderson, J.W.; DeStefano, J.J.; van Straten, M.A.; Claessens, H.A. Stability of silica-based, endcapped columns with pH 7 and 11 mobile phases for reversed-phase high-performance liquid chromatography. J. Chromatogr. A 1997, 762, 97–112. [Google Scholar] [CrossRef] [Green Version]
  45. Makoni, P.A.; Khamanga, S.M.; Wa Kasongo, K.; Walker, R.B. The use of experimental design for the development and validation of an HPLC-ECD method for the quantitation of efavirenz. Pharmazie 2018, 73, 570–578. [Google Scholar]
  46. Snyder, L.R.; Kirkland, J.J.; Glajch, J.L. Practical HPLC Method Development; Wiley: Hoboken, NJ, USA, 1997. [Google Scholar]
  47. Zhang, S.; Huang, X.; Yao, N.; Horváth, C. Preparation of monodisperse porous polymethacrylate microspheres and their application in the capillary electrochromatography of macrolide antibiotics. J. Chromatogr. A 2002, 948, 193–201. [Google Scholar] [CrossRef]
  48. Snyder, L.R.; Kirkland, J.J. Introduction to Modern Liquid Chromatography, 2nd ed.; John Wiley: New York, NY, USA, 1979. [Google Scholar]
  49. Fauzee, A.F.B.; Khamanga, S.M.; Walker, R.B. The impact of manufacturing variables on in vitro release of clobetasol 17-propionate from pilot scale cream formulations. Drug Dev. Ind. Pharm. 2014, 40, 1683–1692. [Google Scholar] [CrossRef]
  50. Davey, P.G. The pharmacokinetics of clarithromycin and its 14-OH metabolite. J. Hosp. Infect. 1991, 19, 29–37. [Google Scholar] [CrossRef]
  51. Erah, P.; Goddard, A.F.; Barrett, D.A.; Shaw, P.N.; Spiller, R.C. The stability of amoxycillin, clarithromycin and metronidazole in gastric juice: Relevance to the treatment of Helicobacter pylori infection. J. Antimicrob. Chemother. 1997, 39, 5–12. [Google Scholar] [CrossRef] [PubMed] [Green Version]
  52. USP Monographs: Clarithromycin Tablets. Available online: http://ftp.uspbpep.com/v29240/usp29nf24s0_m17995.html (accessed on 13 August 2019).
  53. USP Monographs: Clarithromycin for Oral Suspension. Available online: http://ftp.uspbpep.com/v29240/usp29nf24s0_m17993.html (accessed on 13 August 2019).
Figure 1. Chemical structure of clarithromycin (CLA) (C38H69NO13, MW = 747.96 g/mol) [24].
Scipharm 87 00031 g001
Figure 2. Hydrodynamic voltammogram (HDV) for CLA and erythromycin (ERY) generated in direct current (DC) mode at a sensitivity of 100 nA.
Scipharm 87 00031 g002
Figure 3. Contour plot depicting the impact of ACN content and buffer molarity on retention time.
Scipharm 87 00031 g003
Figure 4. Box-Cox plot for power transformation for retention time prior to transformation.
Scipharm 87 00031 g004
Figure 5. Box-Cox plot for power transformation for retention time following transformation.
Scipharm 87 00031 g005
Figure 6. Contour plot depicting the impact of ACN content and buffer molarity on peak asymmetry.
Scipharm 87 00031 g006
Figure 7. Contour plot depicting the impact of ACN content and buffer molarity on peak resolution.
Scipharm 87 00031 g007
Figure 8. Typical chromatograms depicting the separation of CLA and ERY before method scaling (CLA 45 µg/mL, ERY 50 µg/mL) (A), after method scaling (CLA 50 µg/mL, ERY 50 µg/mL) (B) and for assay of Klarizon 250 mg tablets (C).
Scipharm 87 00031 g008
Figure 9. Typical chromatograms following degradation of CLA (10 µg/mL) following exposure to ACN (A), heat at 80 °C (B), 500 W/m2 UV radiation (C), 0.1M HCl (D), 0.1M NaOH (E) and 4% v/v H2O2 (F).
Scipharm 87 00031 g009
Table 1. Variables and experimental design values.
VariableLevel
Input−α−11
Mobile phase mM (X1)1.72105058.28
ACN content % v/v (X2)37.9405052.1
OutputConstraints
Retention timeY1 ≤ 10 min
Peak asymmetryY2 = minimize
Peak resolutionY3 = maximize
Table 2. ANOVA table for response surface quadratic model for retention time.
SourceSum of SquaresdfMean SquareF Valuep-Value Prob>F
Model1.78 × 10−353.56 × 10−4902.59< 0.0001significant
A-Buffer molarilty6.78 × 10−416.78 × 10−41719.85< 0.0001
B-Oganic solvent content9.75 × 10−419.75 × 10−42472.06< 0.0001
AB7.22 × 10−517.22 × 10−5183.05< 0.0001
A23.68 × 10−513.68 × 10−593.42< 0.0001
B21.13 × 10−511.13 × 10−528.740.0011
Residual2.76 × 10−673.94 × 10⁻⁷
Lack of Fit2.70 × 10−639.00 × 10−757.930.0009significant
Pure Error6.21 × 10−841.55 × 10⁻⁸
Cor Total1.78 × 10−312
Std. Dev.6.28 × 10−4
Mean0.022
C.V. %2.86
PRESS1.93 × 10−5
R-Squared0.9985
Adj R-Squared0.9973
Pred R-Squared0.9892
Adeq Precision96.322
Table 3. Optimized chromatographic conditions for the overall separation of CLA and ERY.
ParameterResults
Buffer molarity50 mM
Organic phase content41.5% v/v
Flow rate 1.00 mL/min
Column temperature 30 °C
Mode Isocratic
Detection voltage +1200 mV
Injection volume 10 µL
Table 4. Chromatographic response of CLA and ERY with changes in mobile phase content (n = 3).
MeOH % v/vPHR (CLA/ERY)%RSDRun Time (min)
20.1272 ± 0.00342.69815
50.1424 ± 0.00231.62720
100.1605 ± 0.00251.53330
Table 5. Intra-and inter-day precision data for CLA analysis.
Intra-day Precision % RSD (n = 10)1.2363
Inter-day precision % RSD range (n = 5)
Day 11.1409–1.9528
Day 20.2915–1.2201
Day 30.6229–1.1288
Table 6. Accuracy results for blinded CLA samples (n = 5).
Theoretical Concentration µg/mLActual Concentration µg/mL% RSD% Bias
6.006.111.63+1.82
25.0025.490.91+1.94
45.0045.201.22+1.22
Table 7. Summary of re-validation results for HPLC method for CLA analysis.
ParameterCLA
Linearity
R20.9999
EquationY = 0.0315x + 0.0176
Intra-day precision % RSD (n = 10)1.7028
Inter-day precision % RSD range (n = 5)
Day 11.0645–1.5675
Day 21.1904–1.7166
Day 30.9385–1.7849
Accuracy (n = 5)
Theoretical concentration µg/mL7.6021.0044.00
% Recovery ± % RSD7.50 ± 3.7120.67 ± 1.0244.07 ± 1.42
%Bias−1.30−1.58+0.15
LOQ µg/mL (n = 5)1.5
LOD µg/mL0.5
Table 8. USP scaling assay results for CLA.
ResolutionCLA TailingCLA/ERY PHRCLA Retention Time
Average1.509 ± 0.0154.083 ± 0.039
%RSD 1.1450.187
LimitsNMT 2.0NLT 1.5%RSD NMT 2%%RSD NMT 2%
Table 9. Forced degradation data for CLA following exposure to stress conditions for 12 h.
Stress Condition% RecoveredRemarks
Control in ACN100-
Thermal at 80 °C105.48No degradation
UV exposure at 500 W/m292.33No degradation
Acid hydrolysis using 0.1 M HCL94.85No Degradation
Alkaline hydrolysis using 0.1 M NaOH54.81Degradation
Oxidation using 4% v/v H2O20.00Degradation
Table 10. Analysis of commercially available CLA formulations (n = 5).
Product and Label ClaimDose mg% Recovery% RSD
Clarihexal®500 XL500 mg99.691.57
Klarithran®MR 500500 mg99.090.61
Klarithran® 500500 mg103.941.80
Klarizon 250250 mg98.812.40
ClariHexal 250 mg/5 mL250 mg110.042.23
Klarithran®250mg/5 mL250 mg106.941.75

