Is Innovation a Risky Business? A Comparative Analysis in High-Tech and Traditional Industries in Poland


Abstract
:1. Introduction
- (1)
- The high-tech sector (including biotechnology), naturally predisposed to innovative activities, in particular product and process ones (more complex and advanced), and
- (2)
- The traditional industry, where innovations are usually of less technological advanced nature and often take the form of organisational and/or marketing innovations (less complex and advanced).
2. Literature Review
2.1. Innovation in Terms of the Industry
- 1.
- introducing a new product that customers have not yet used or giving new features to an existing product,
- 2.
- implementation of a new production method not previously used by the industry concerned,
- 3.
- opening up a new market where the industry has not previously operated,
- 4.
- acquiring new sources of production raw materials,
- 5.
- introduction of a new organisational structure in a given industry.
2.2. Risk in Innovative Activity
3. Methodology
3.1. Research Intentions and Problems
- the assumed division into traditional and high-tech industries;
- the structure of the Polish economy, dominated by traditional sectors, and within modern industries mainly telecommunications, healthcare and IT are developing (there are definitely fewer enterprises dealing with ecology and implementing eco-innovations, or they operate in the form of smaller enterprises);
- the availability of sufficiently long time series for the financial data included in the study to allow comparative statistical analysis.
- R1: Does a high level of innovativeness also mean a high level of risk for the enterprise?
- R2: Are enterprises operating in innovative industries associated with a higher risk than enterprises operating in traditional industries?
- R3: How can the risk accompanying innovation affect enterprises, sectors and the economy in Poland?
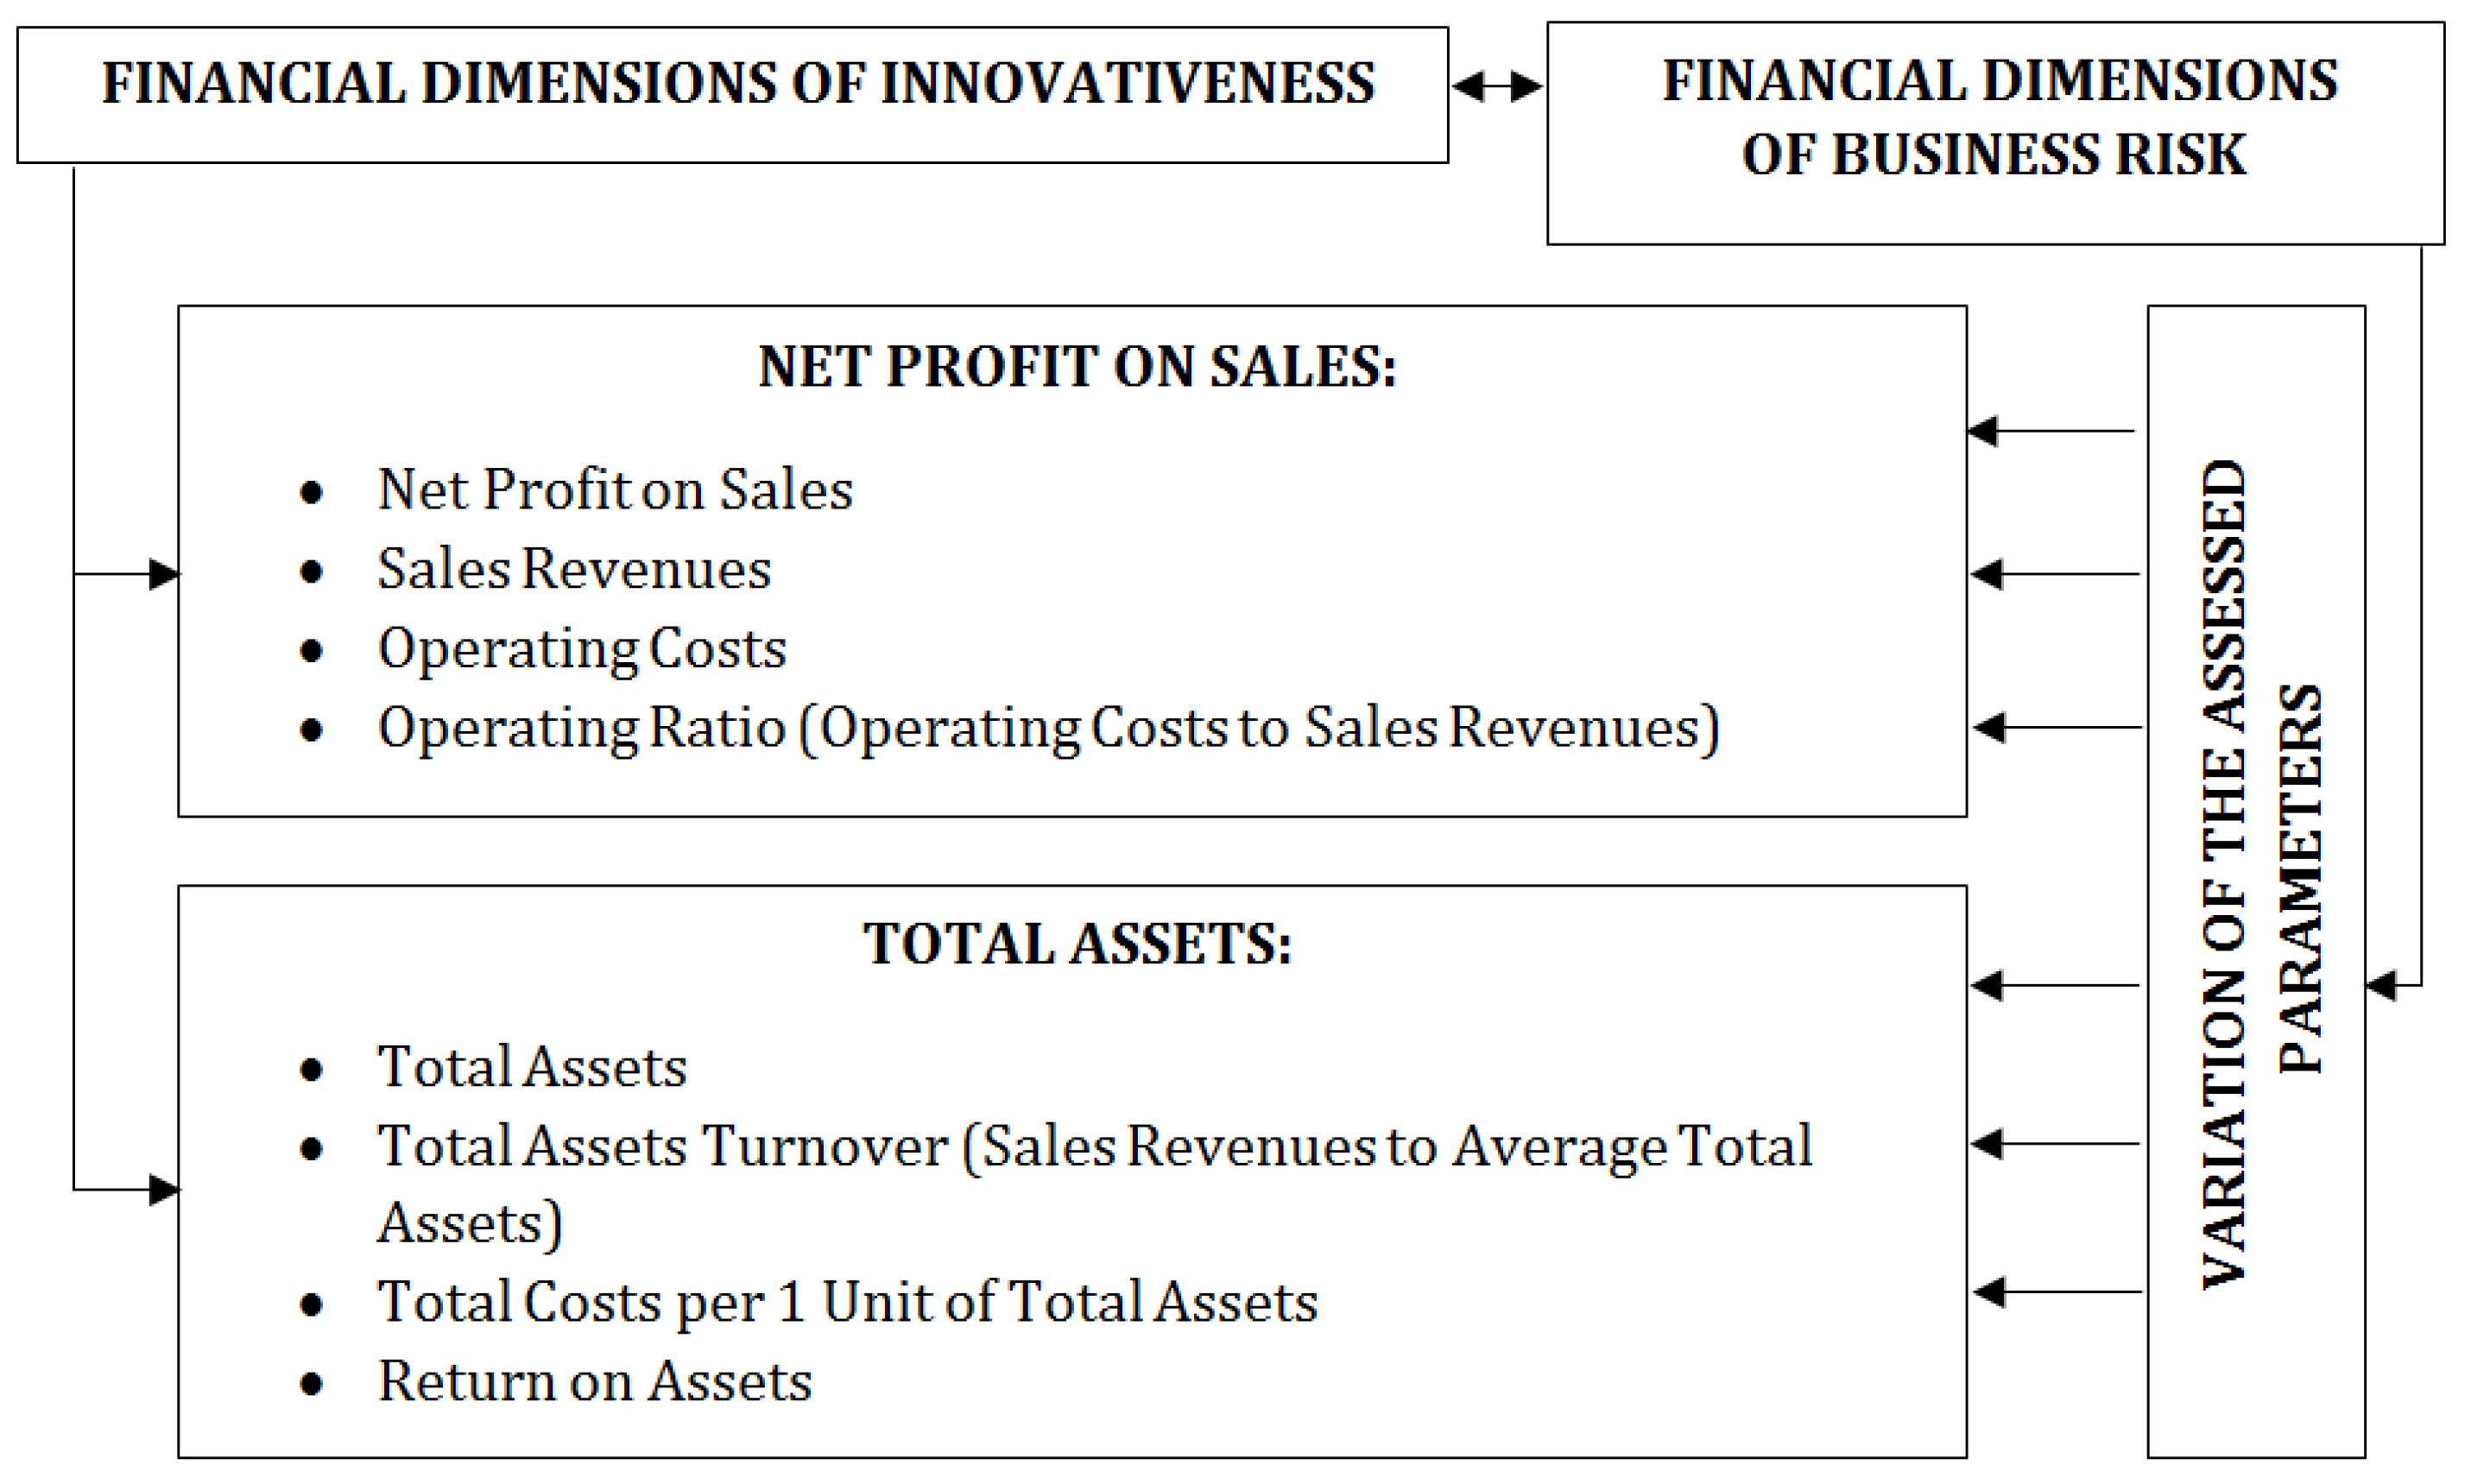
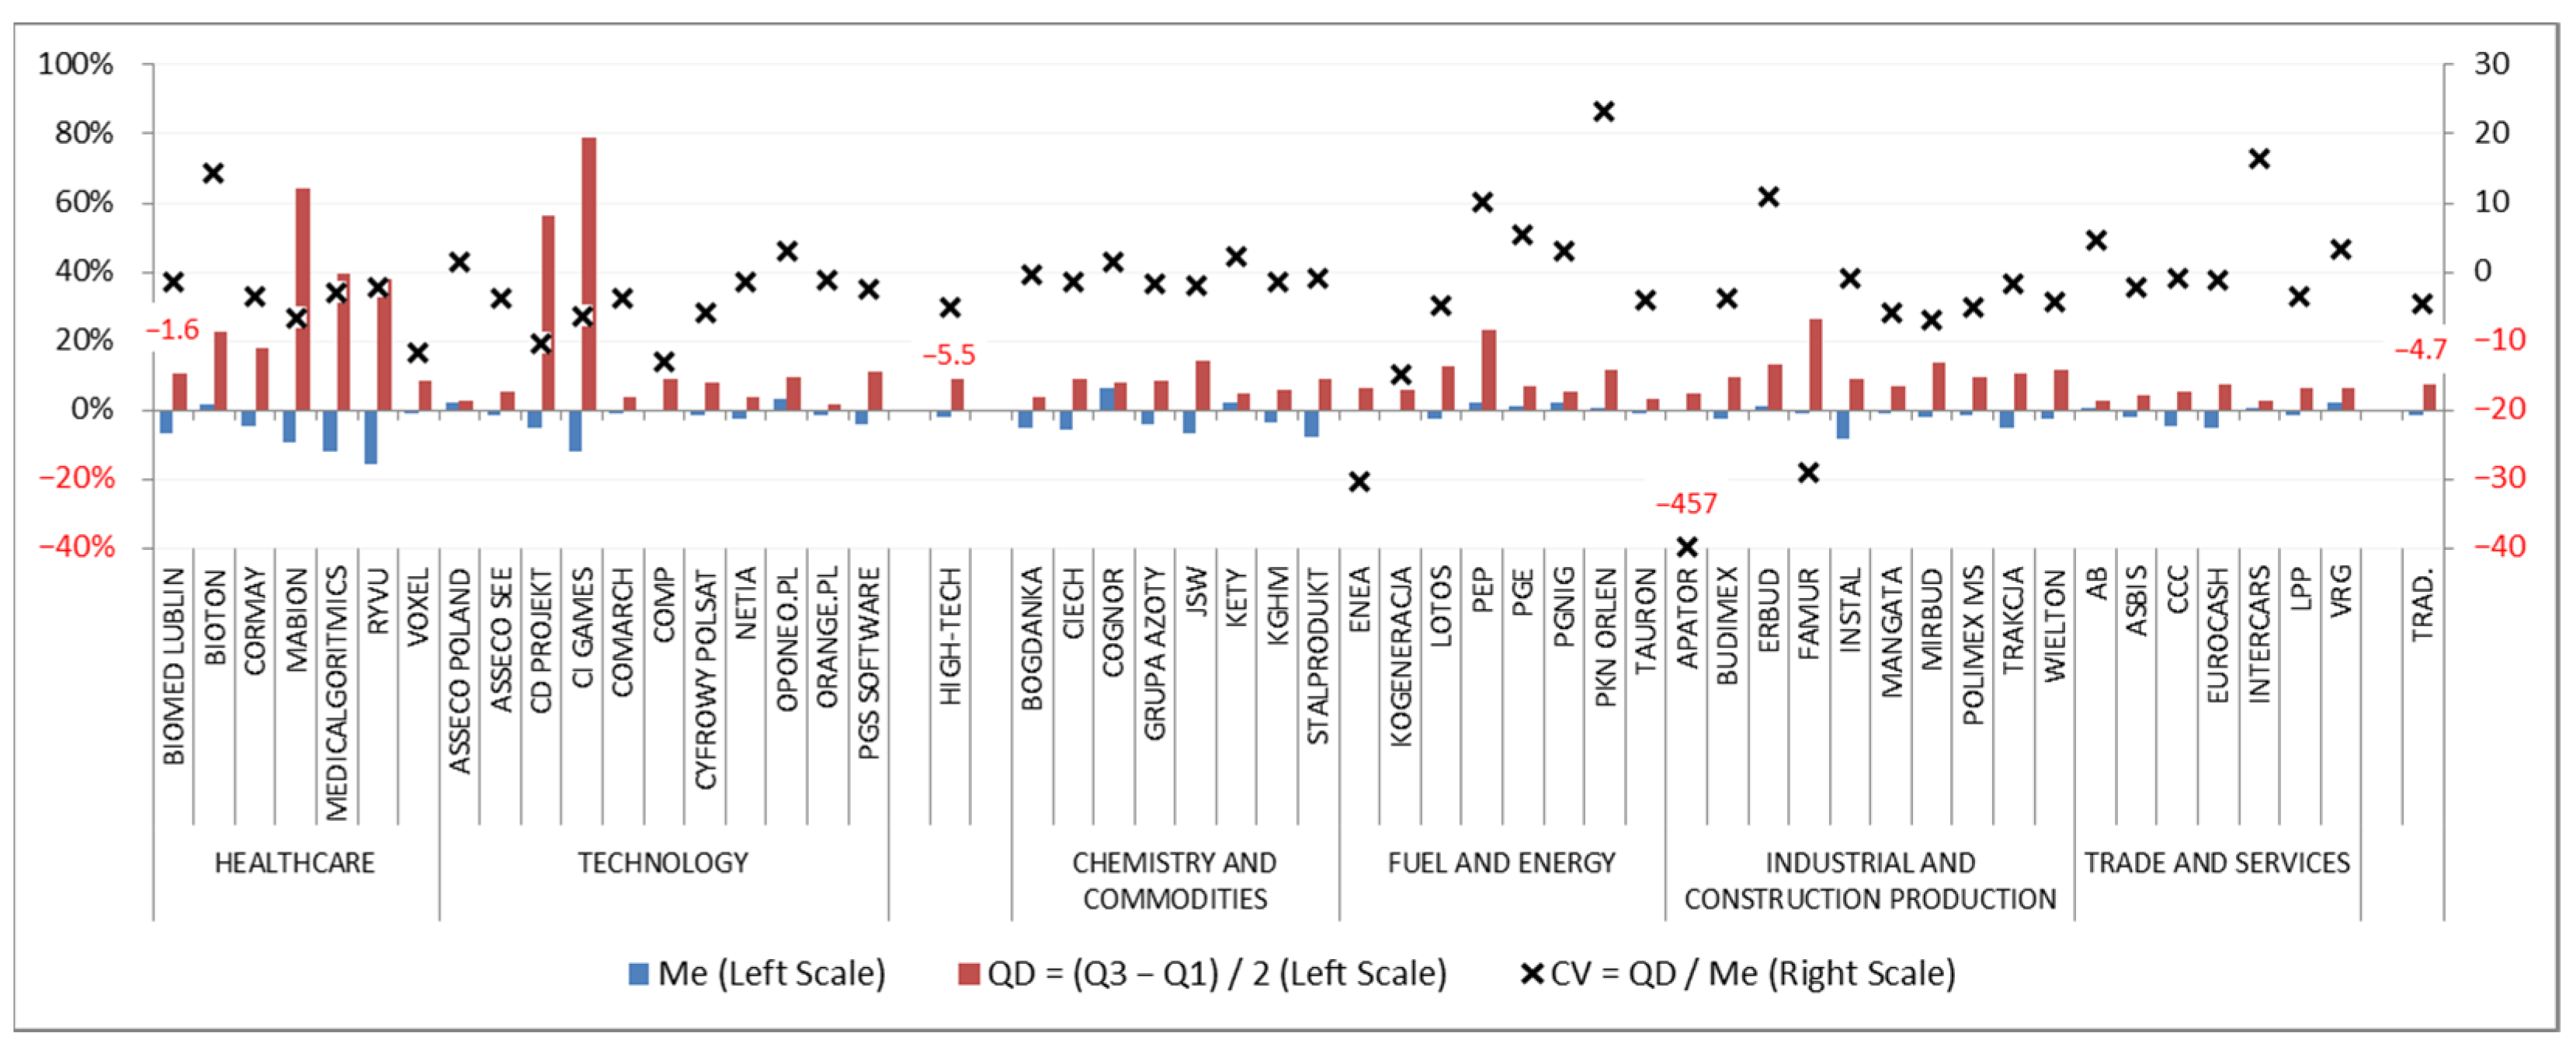
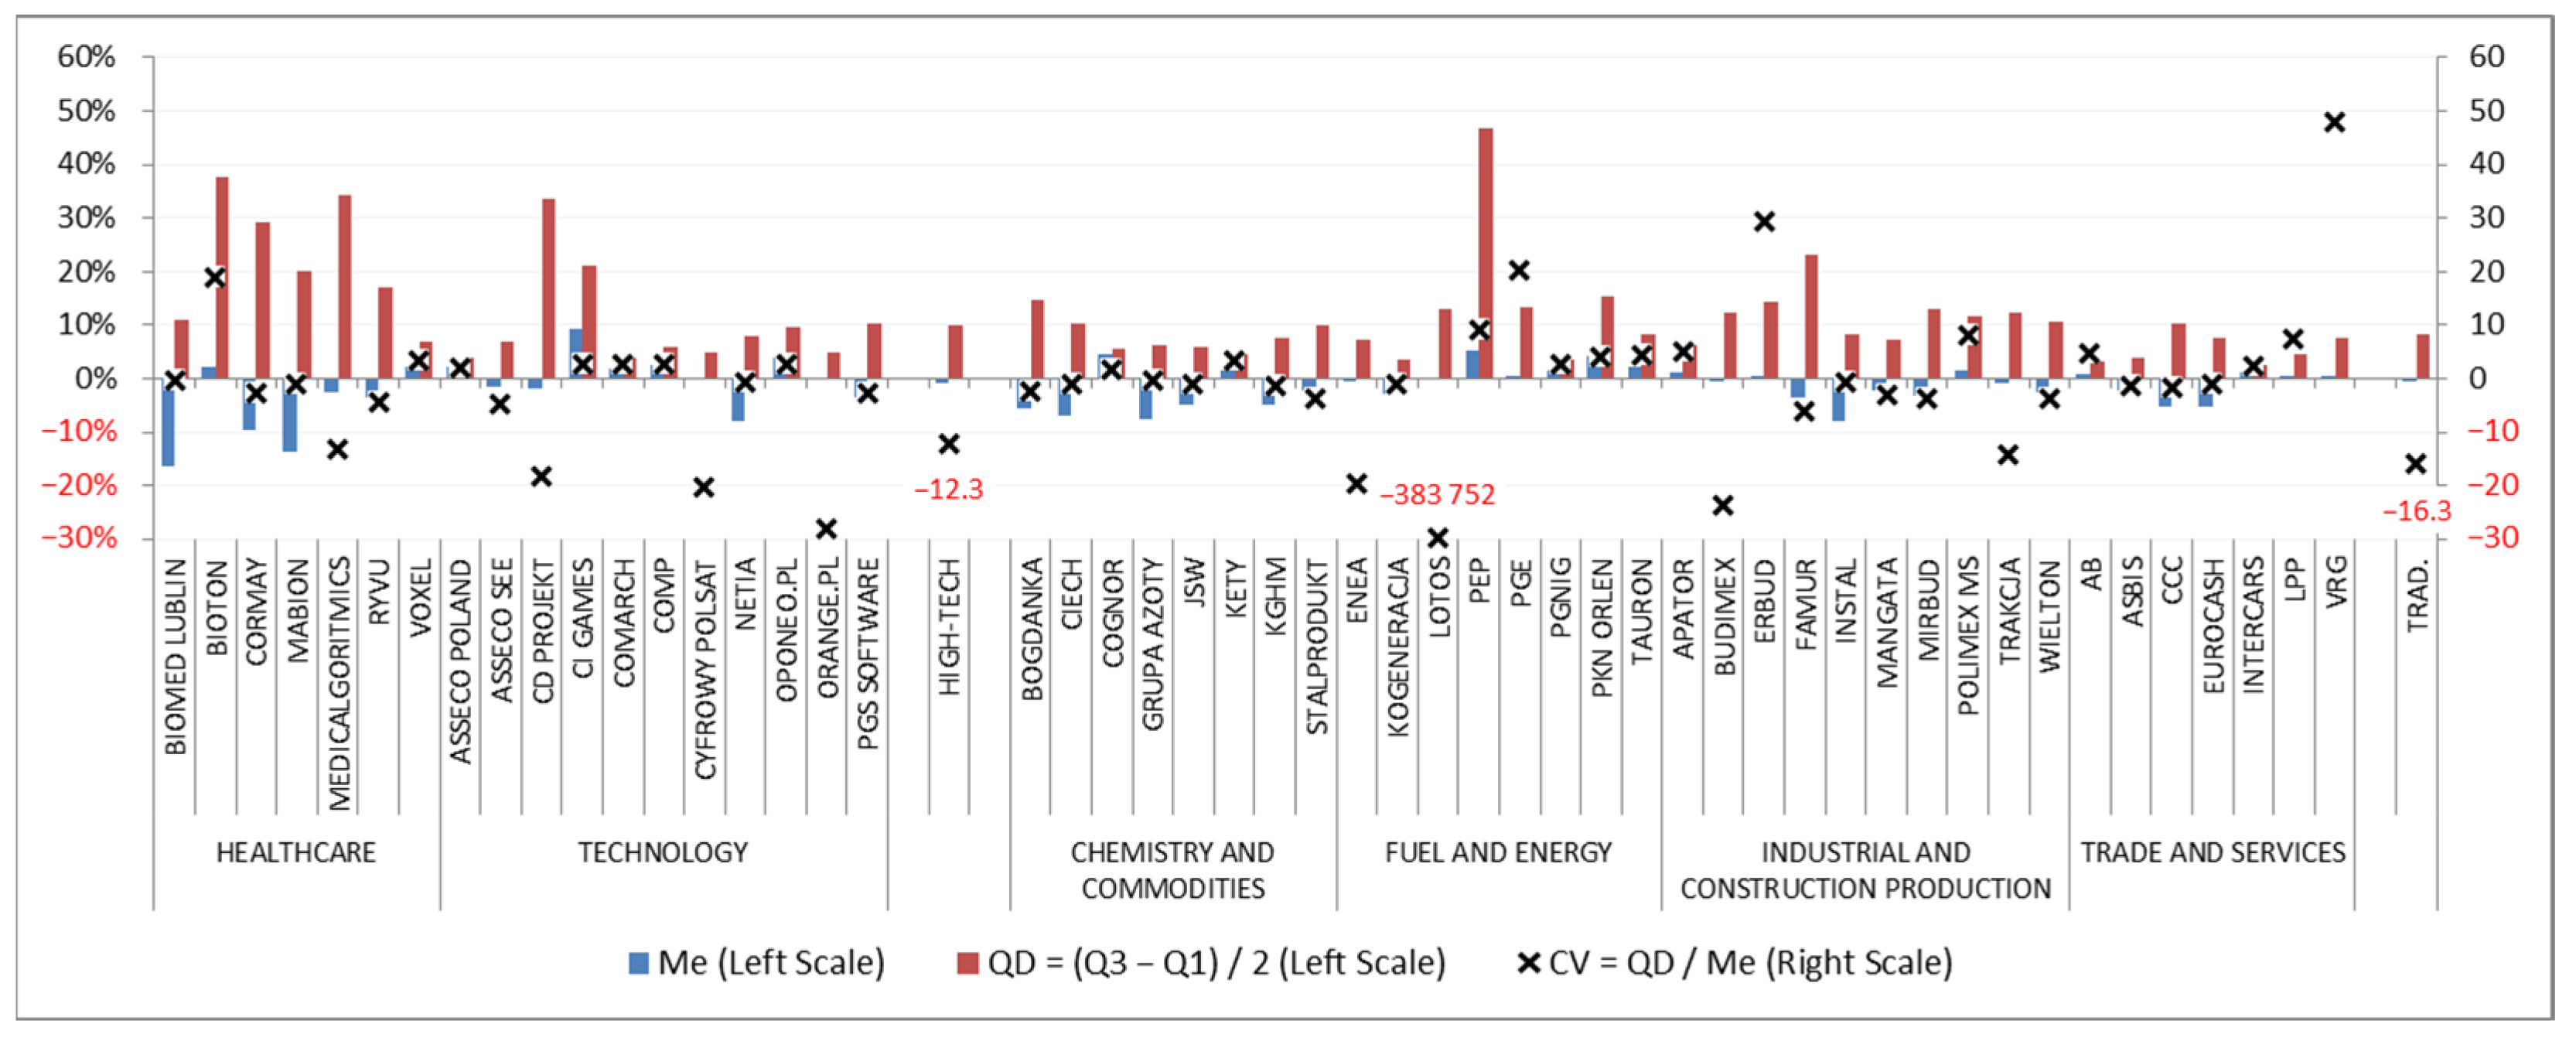
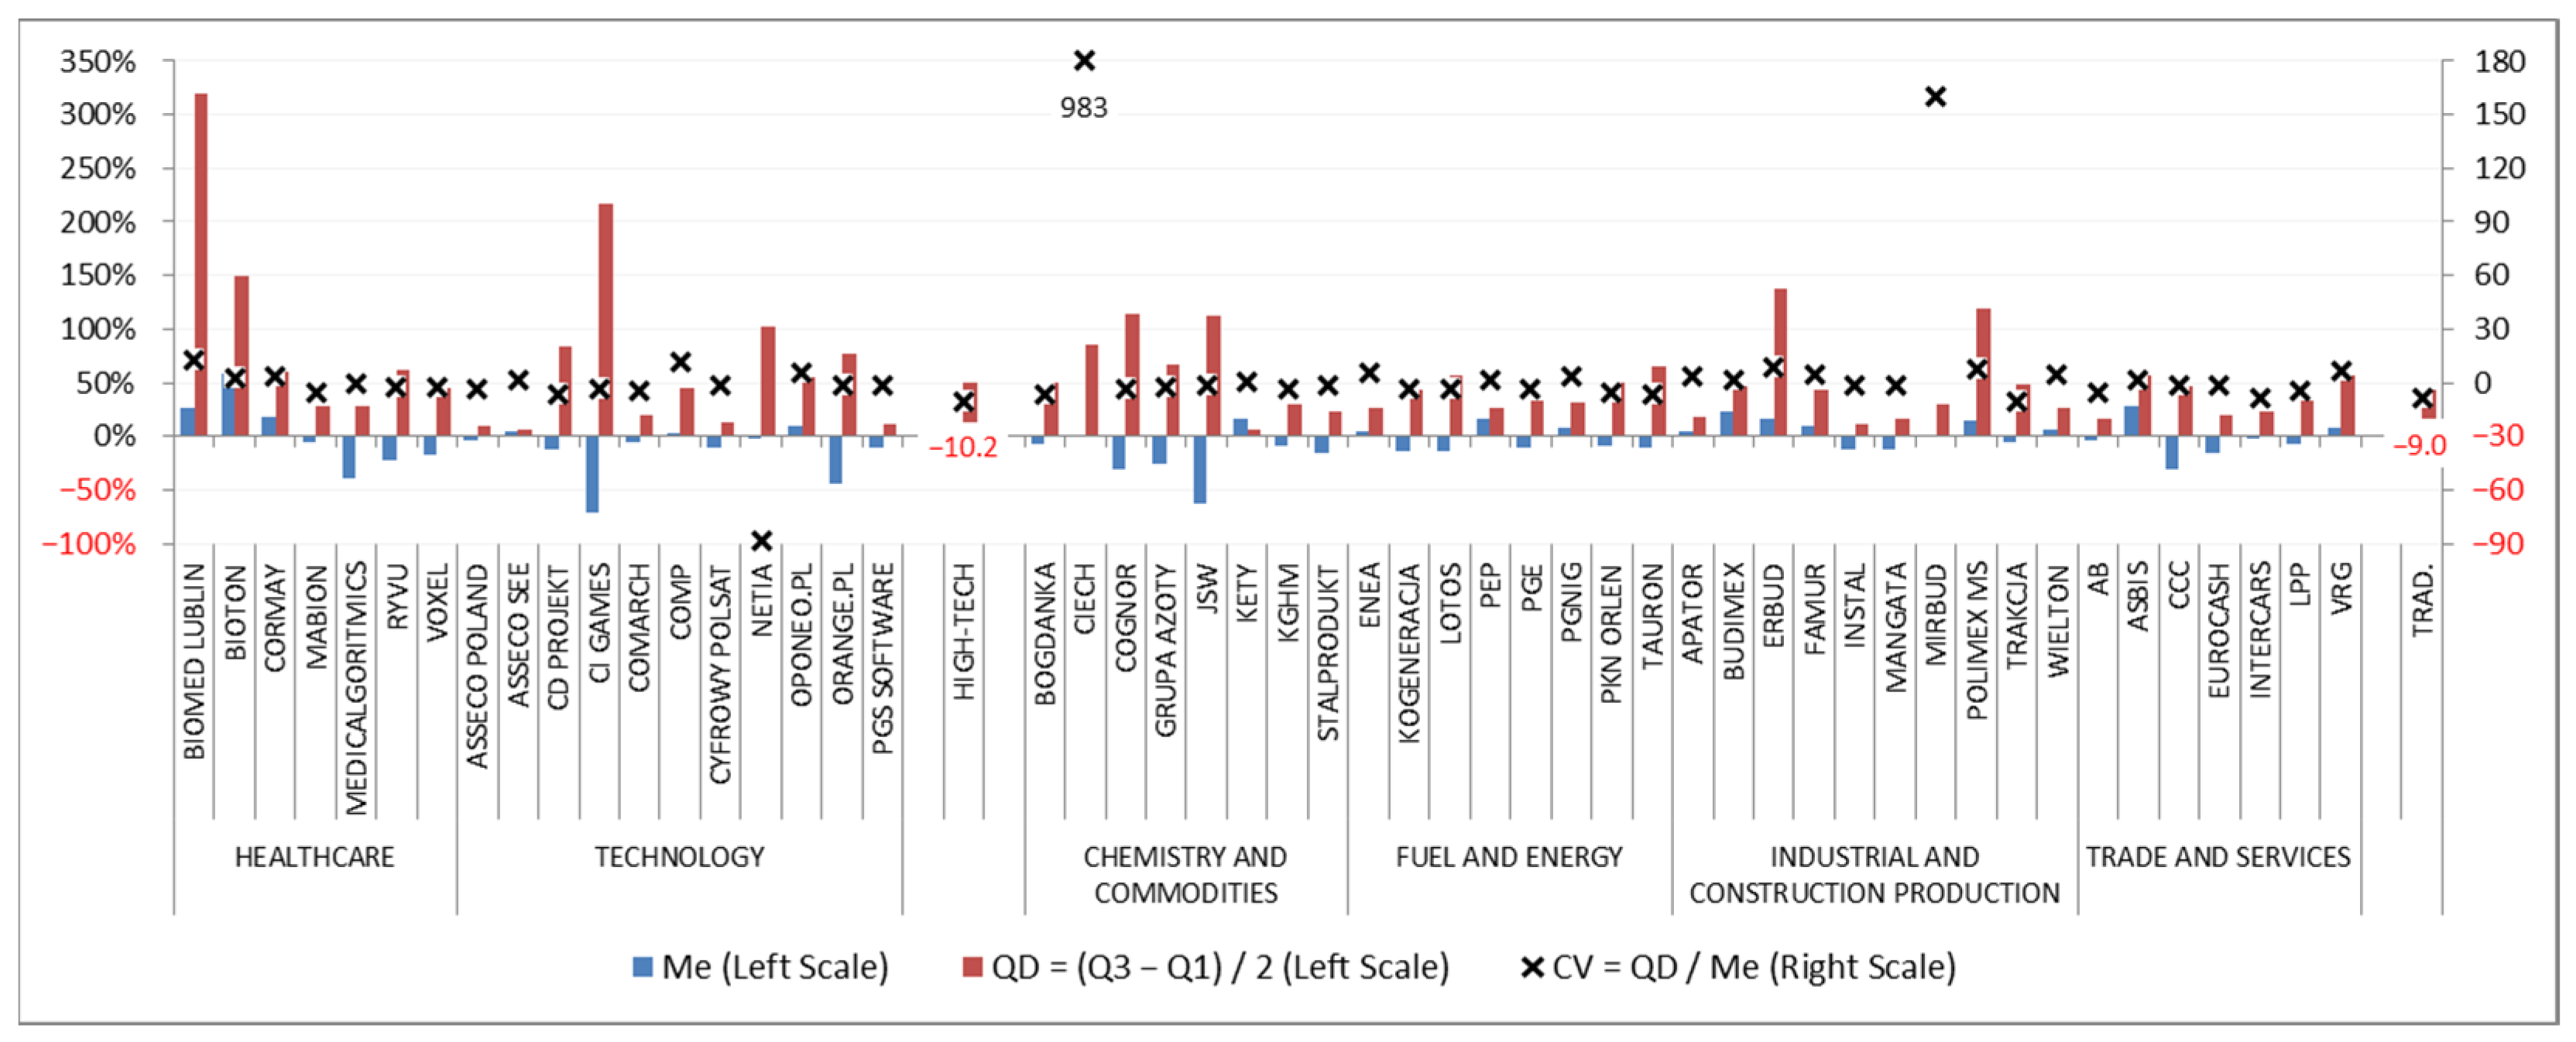
3.2. Business Risk Assessment Model in the Context of Corporate Innovativeness
- Me—median, middle value of the sample,
- n—the number of periods the data comes from,
- x—a value of the variable from the given period.
- IQR—interquartile range,
- Q1—first quartile,
- Q3—third quartile,
- QD—quartile deviation.
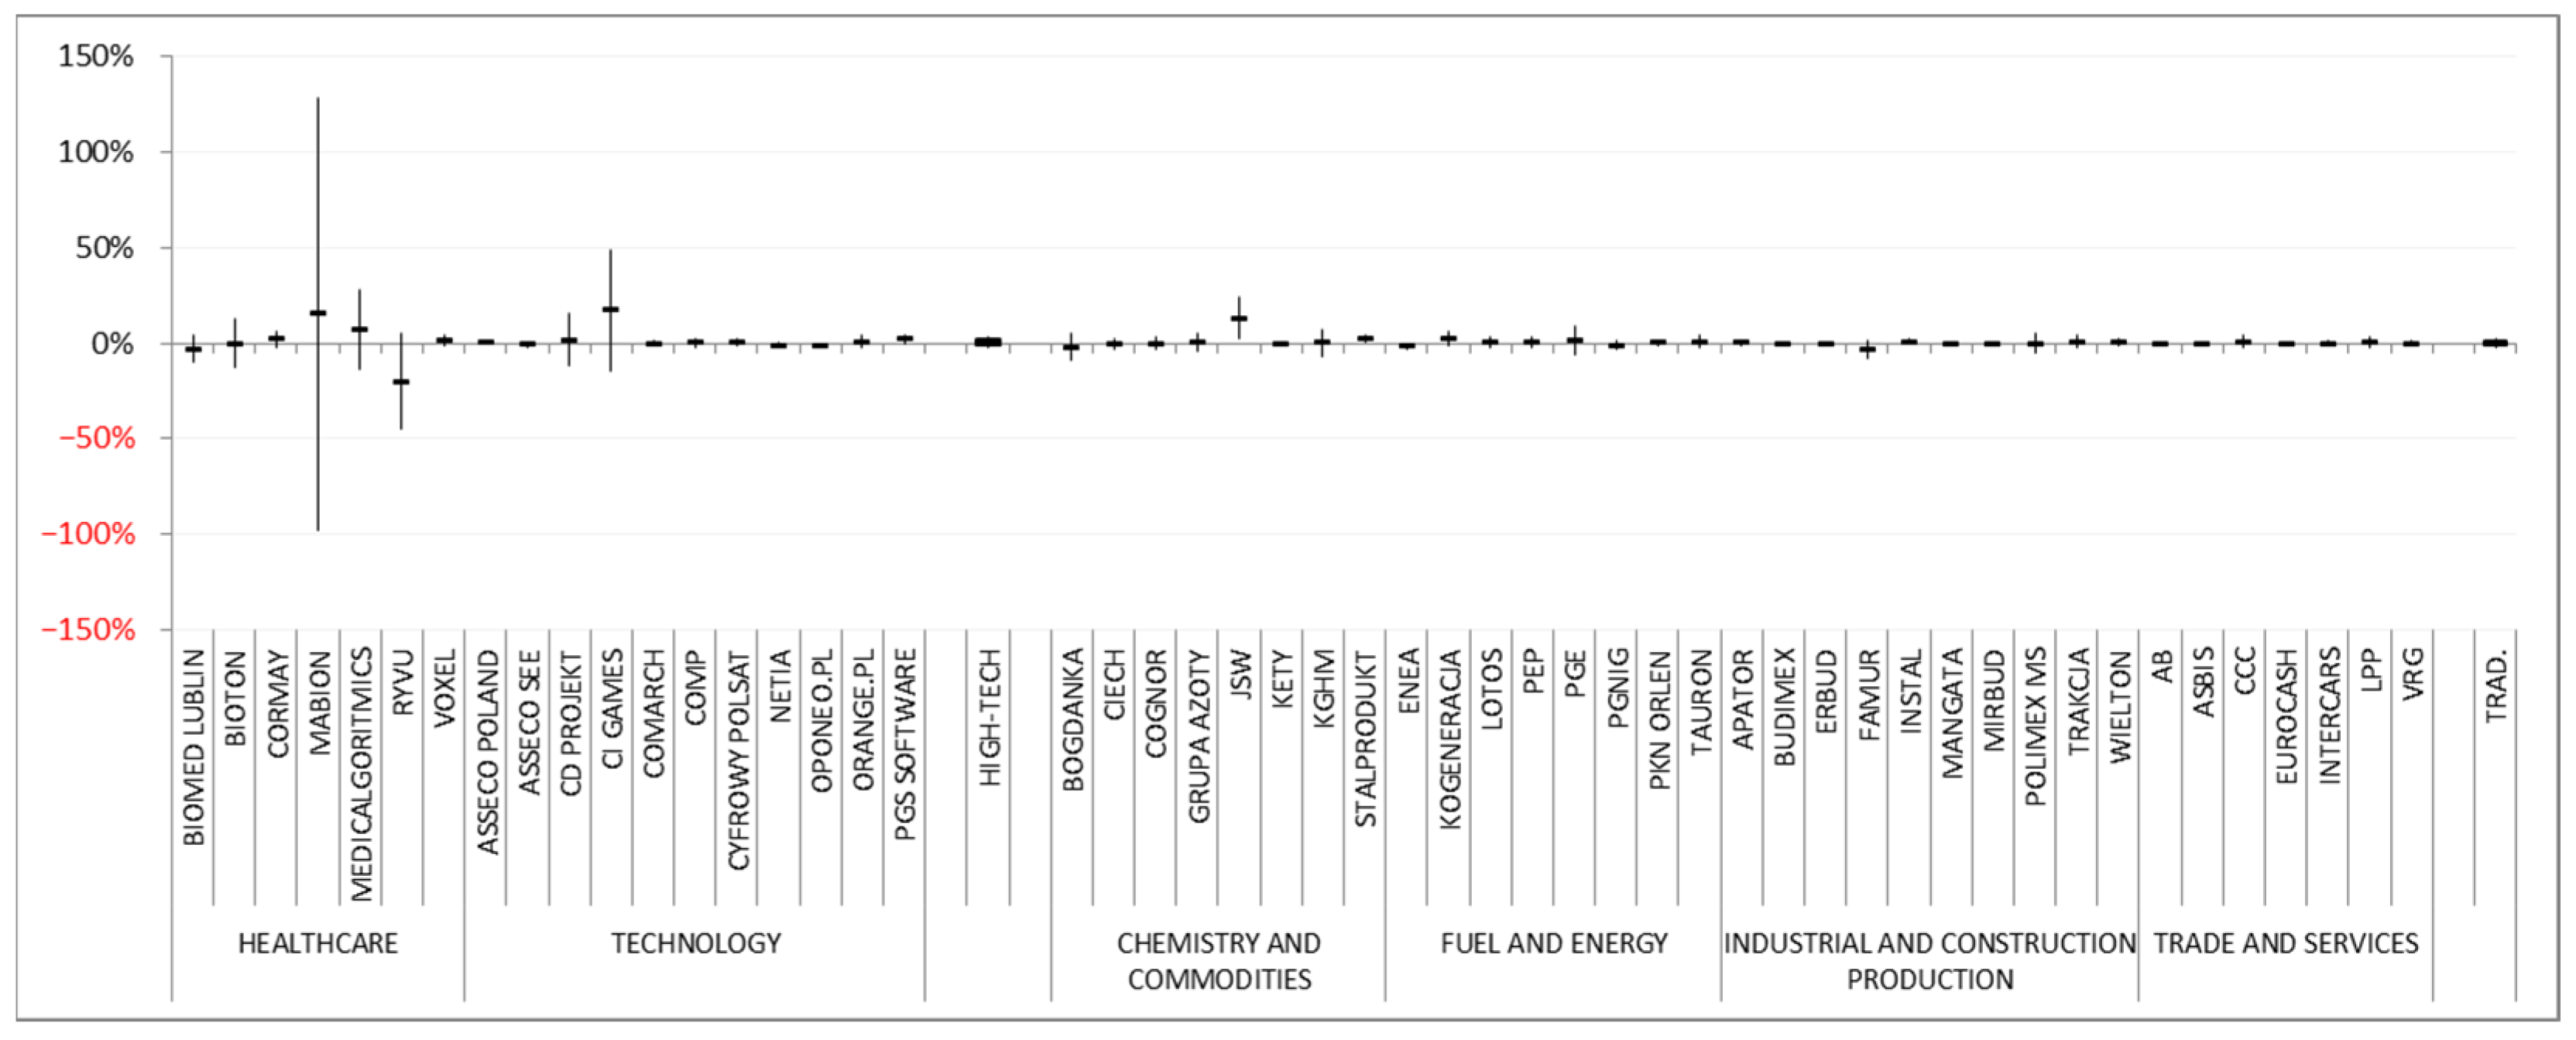
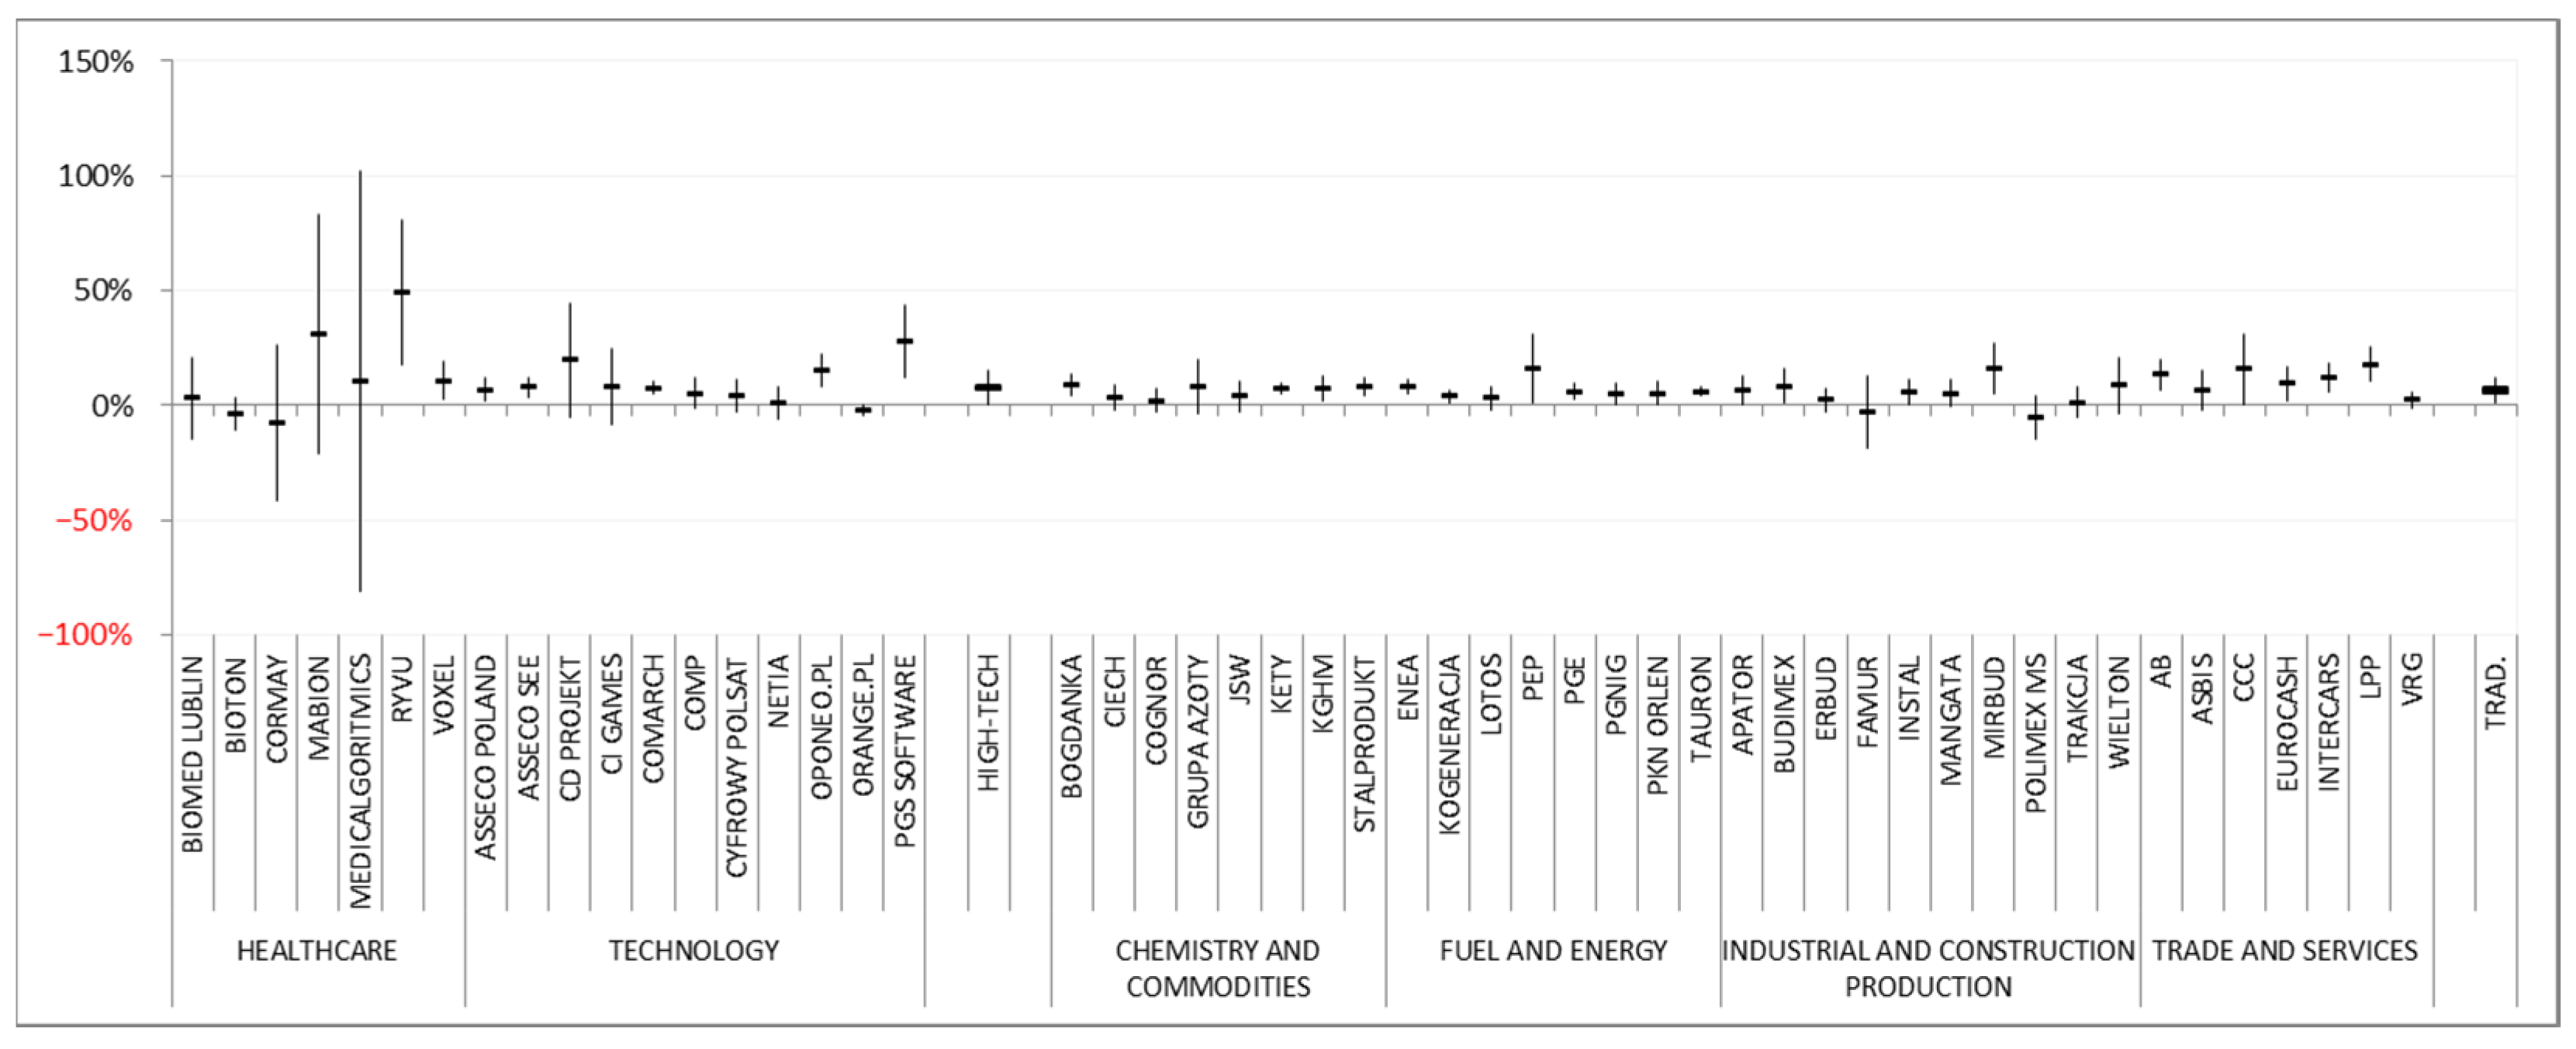
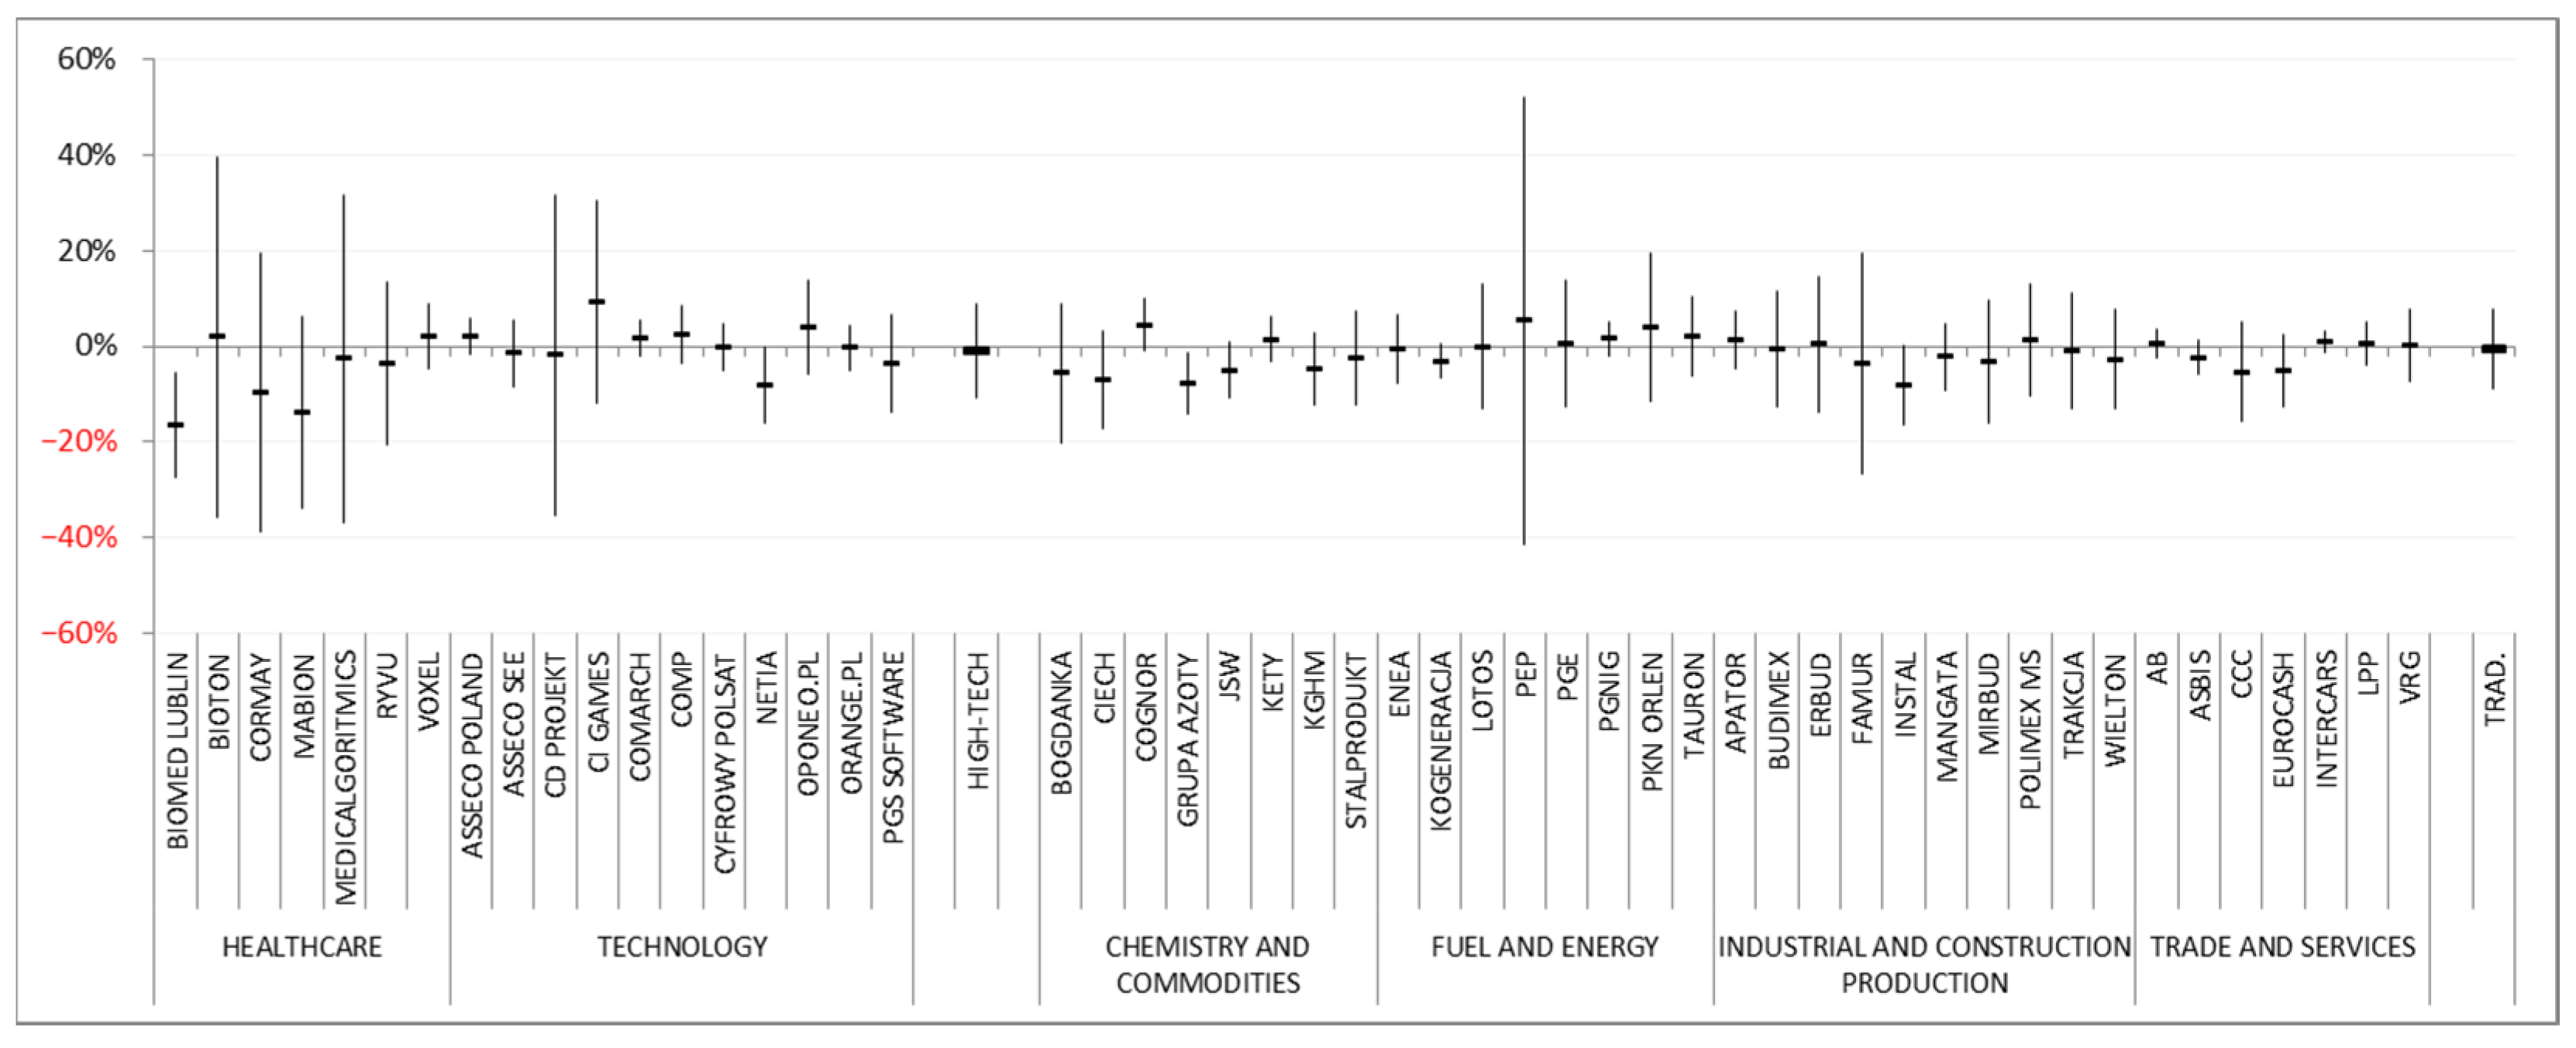
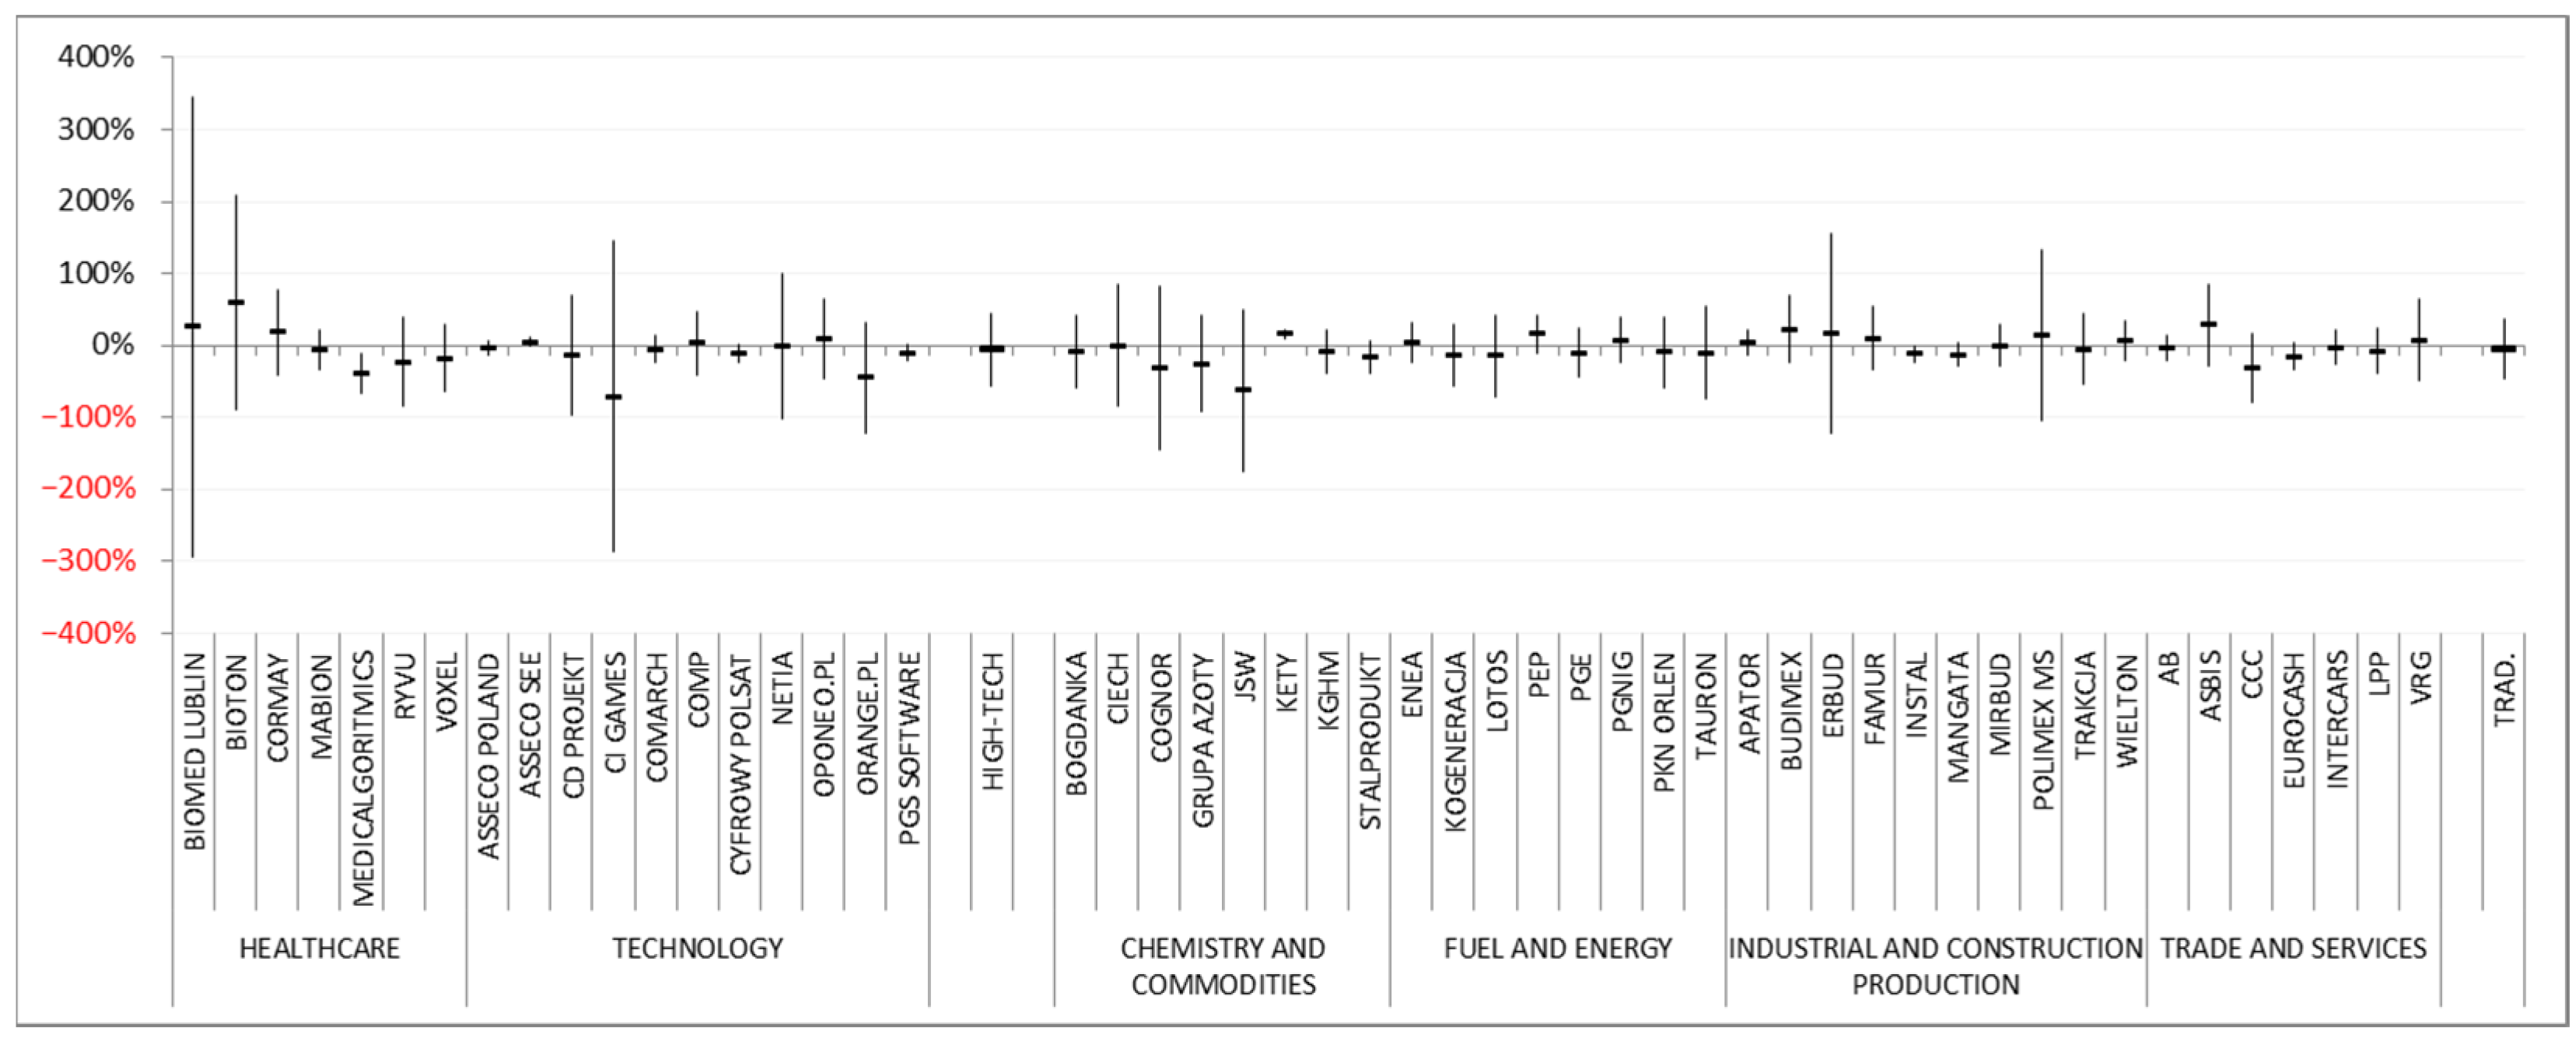
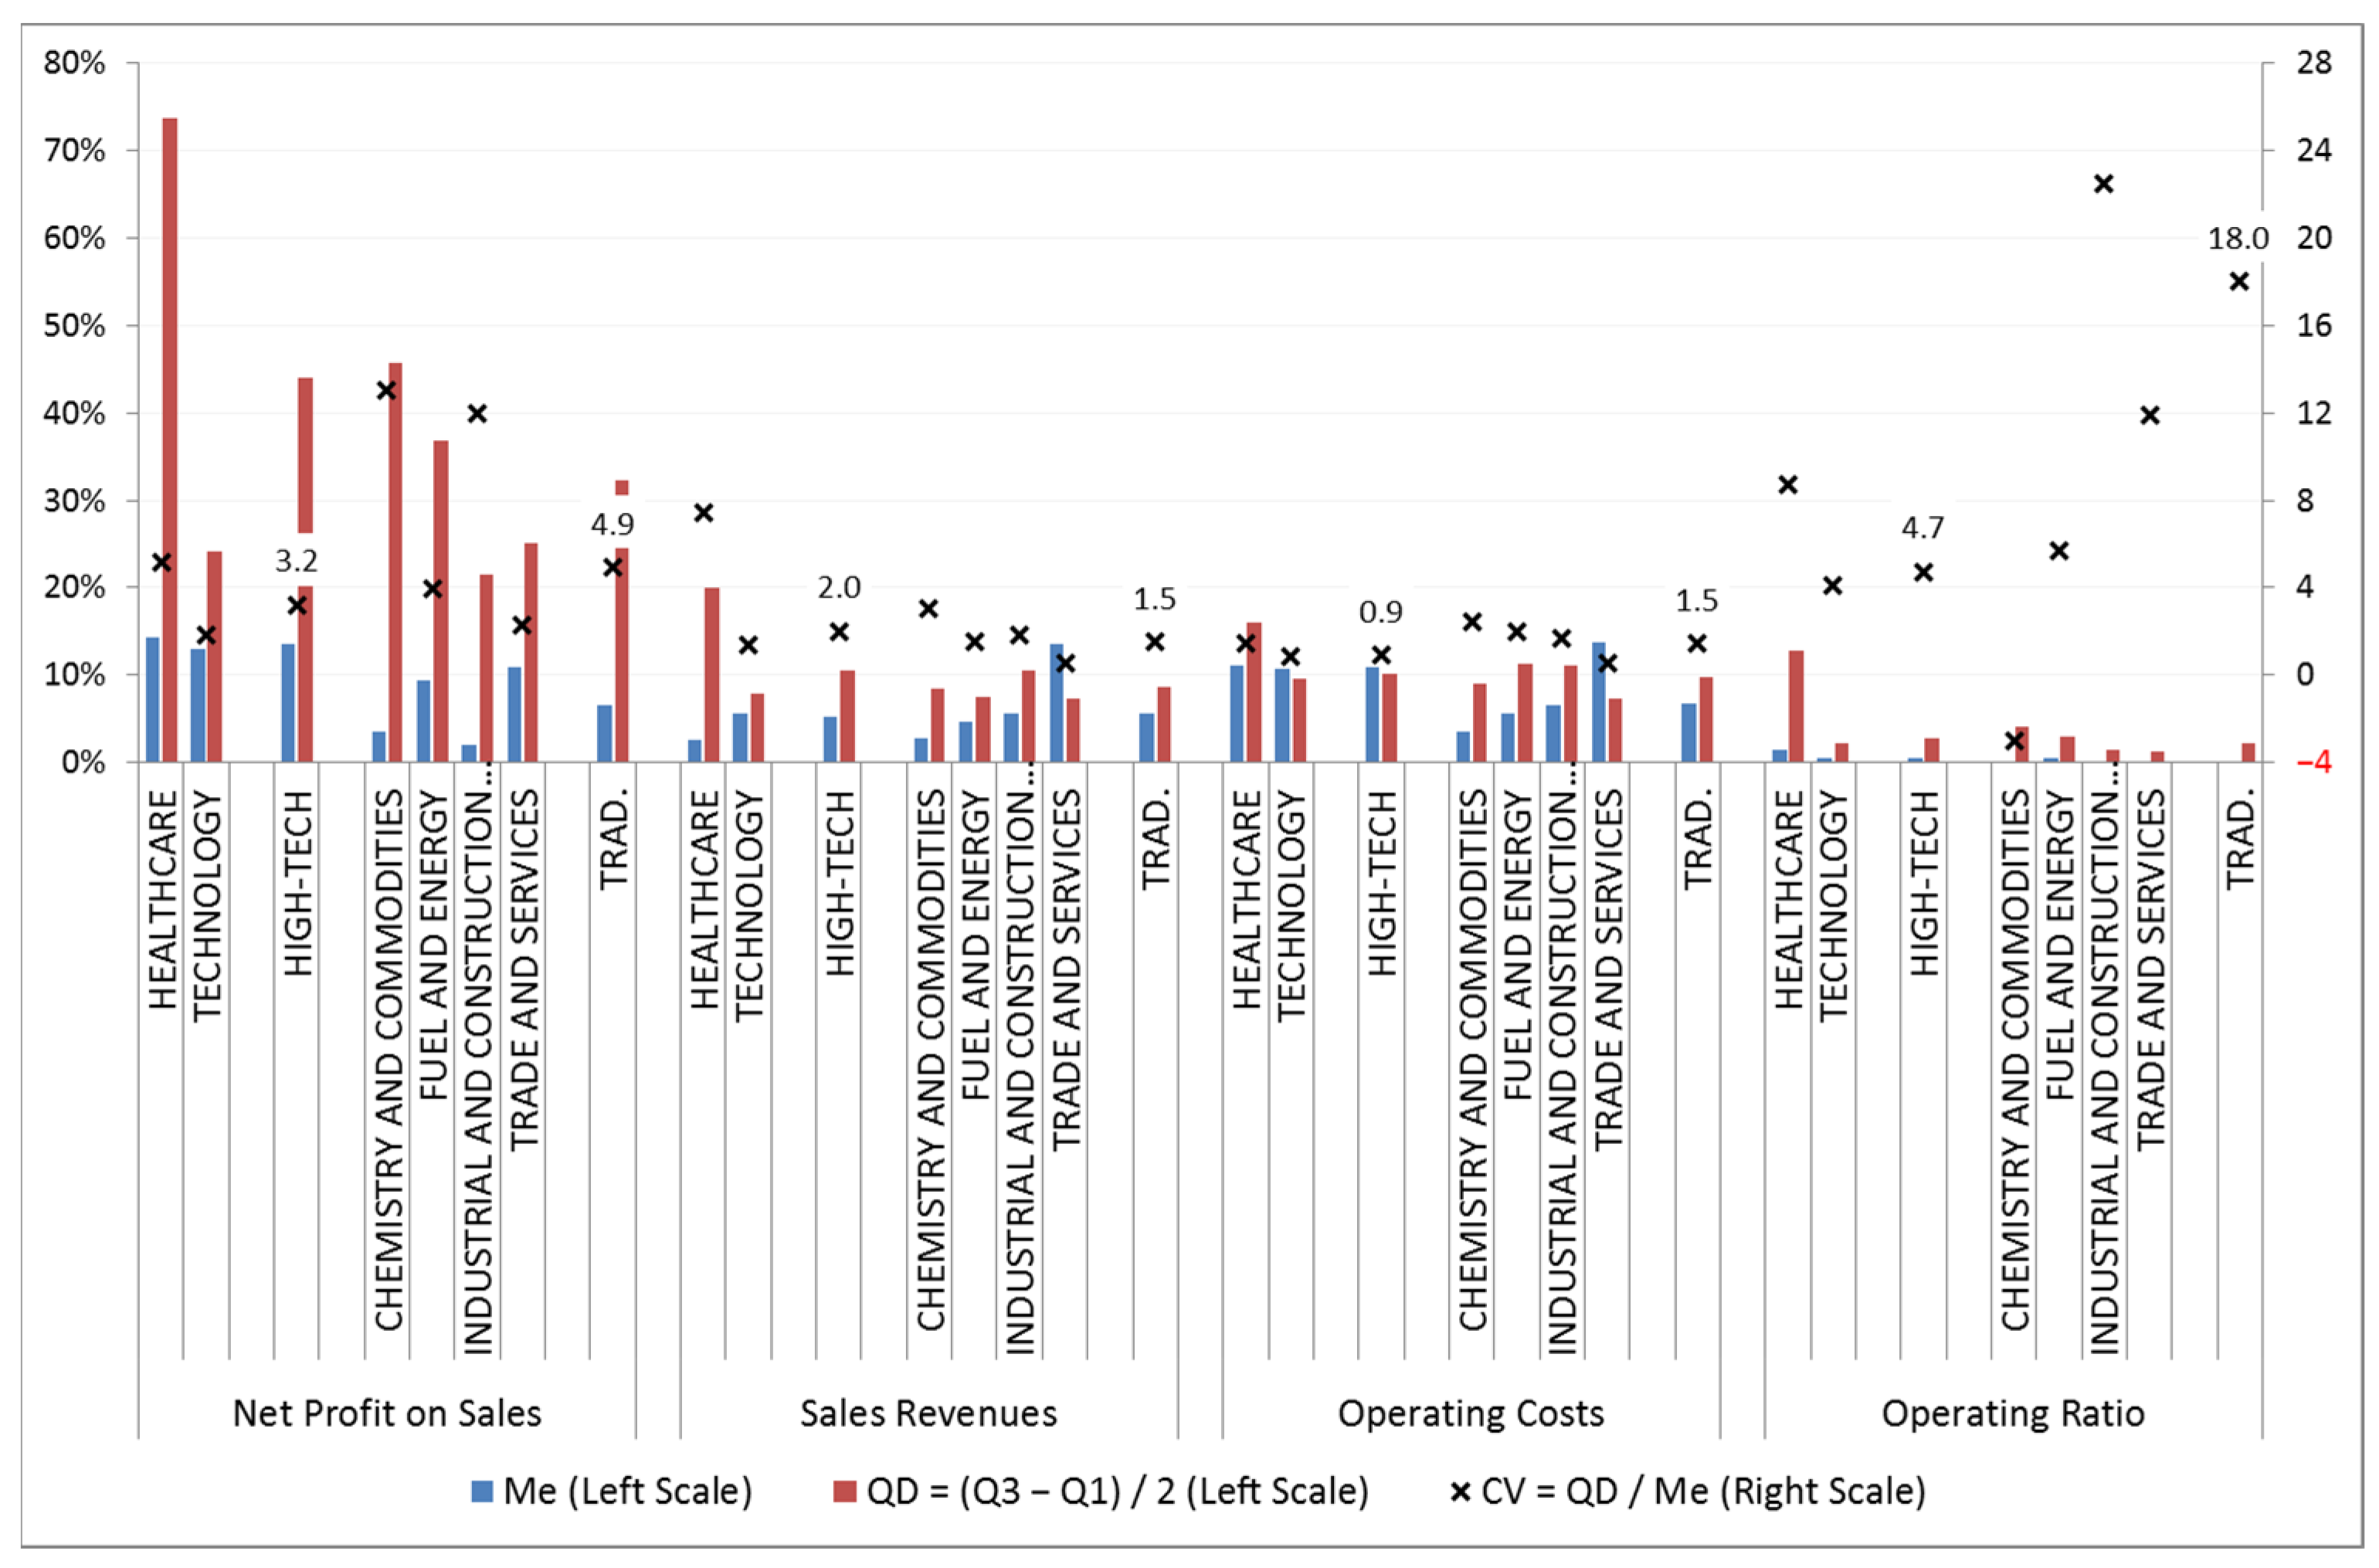
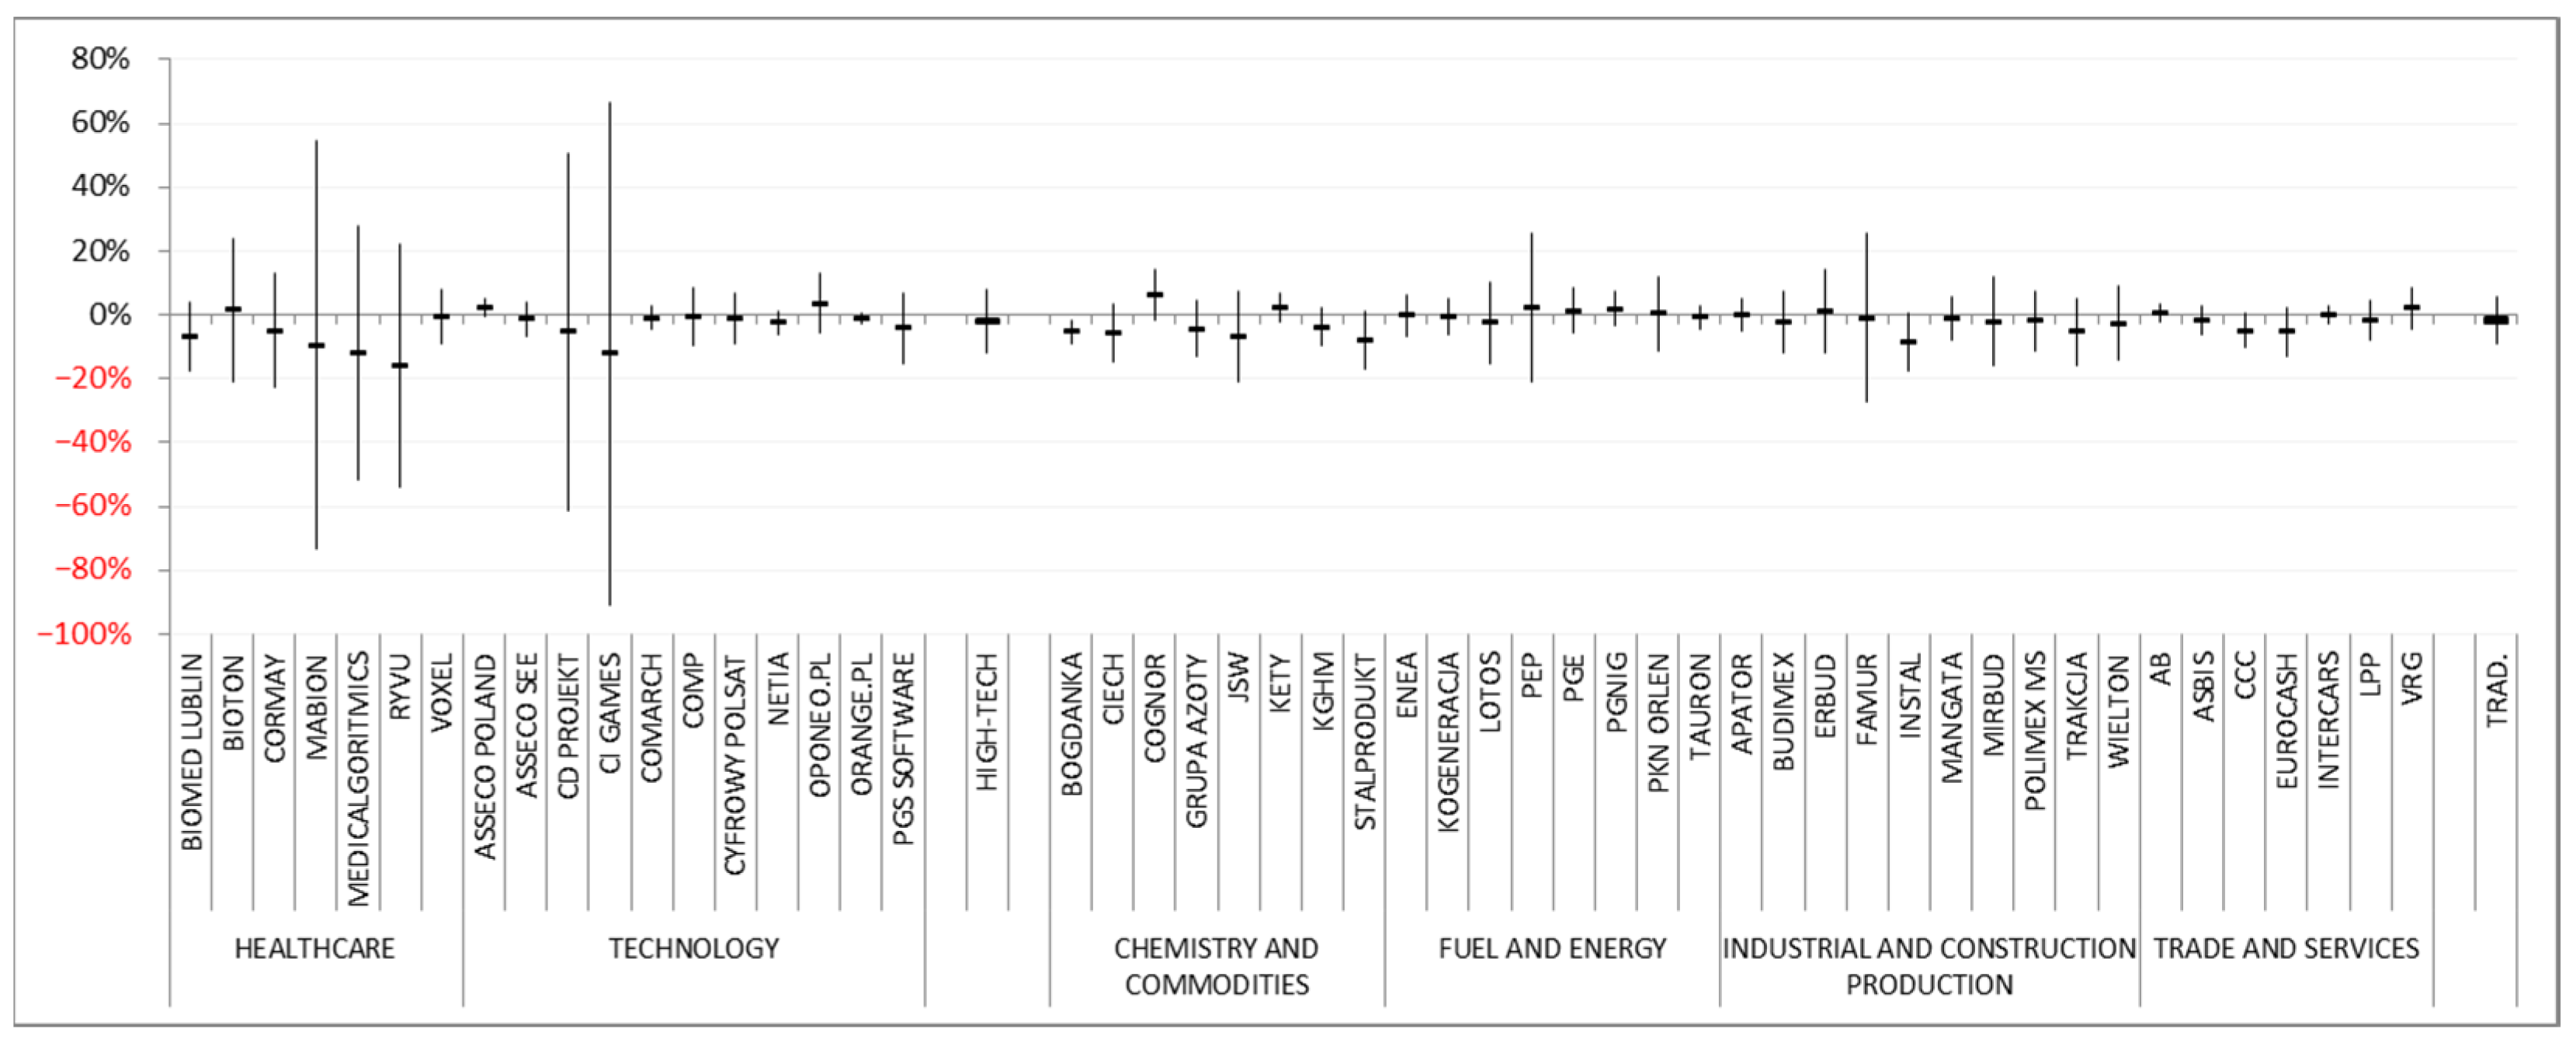
4. Results
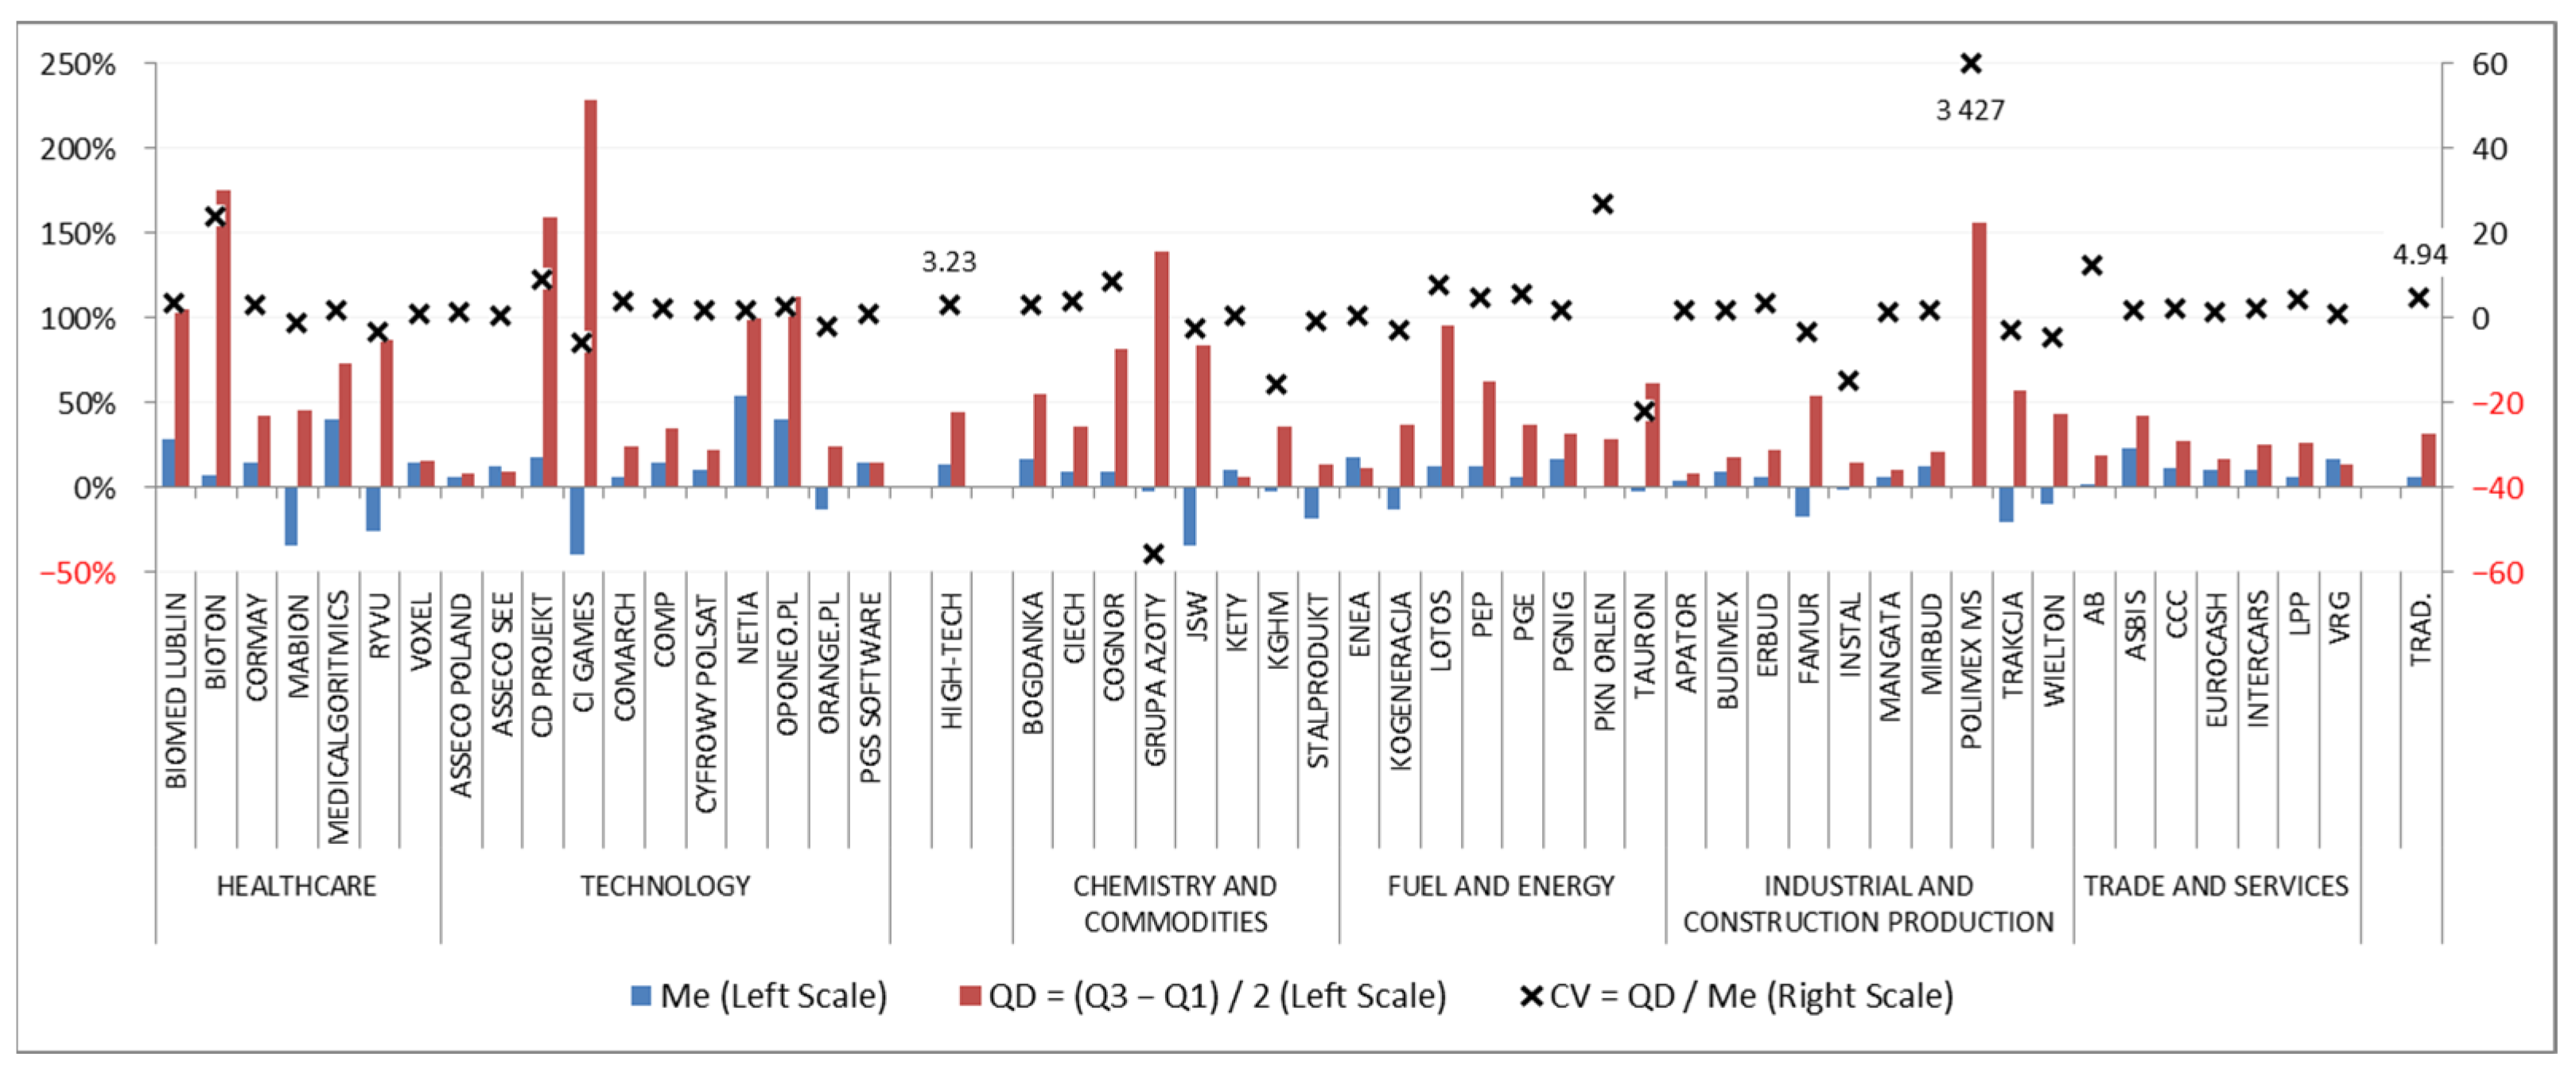
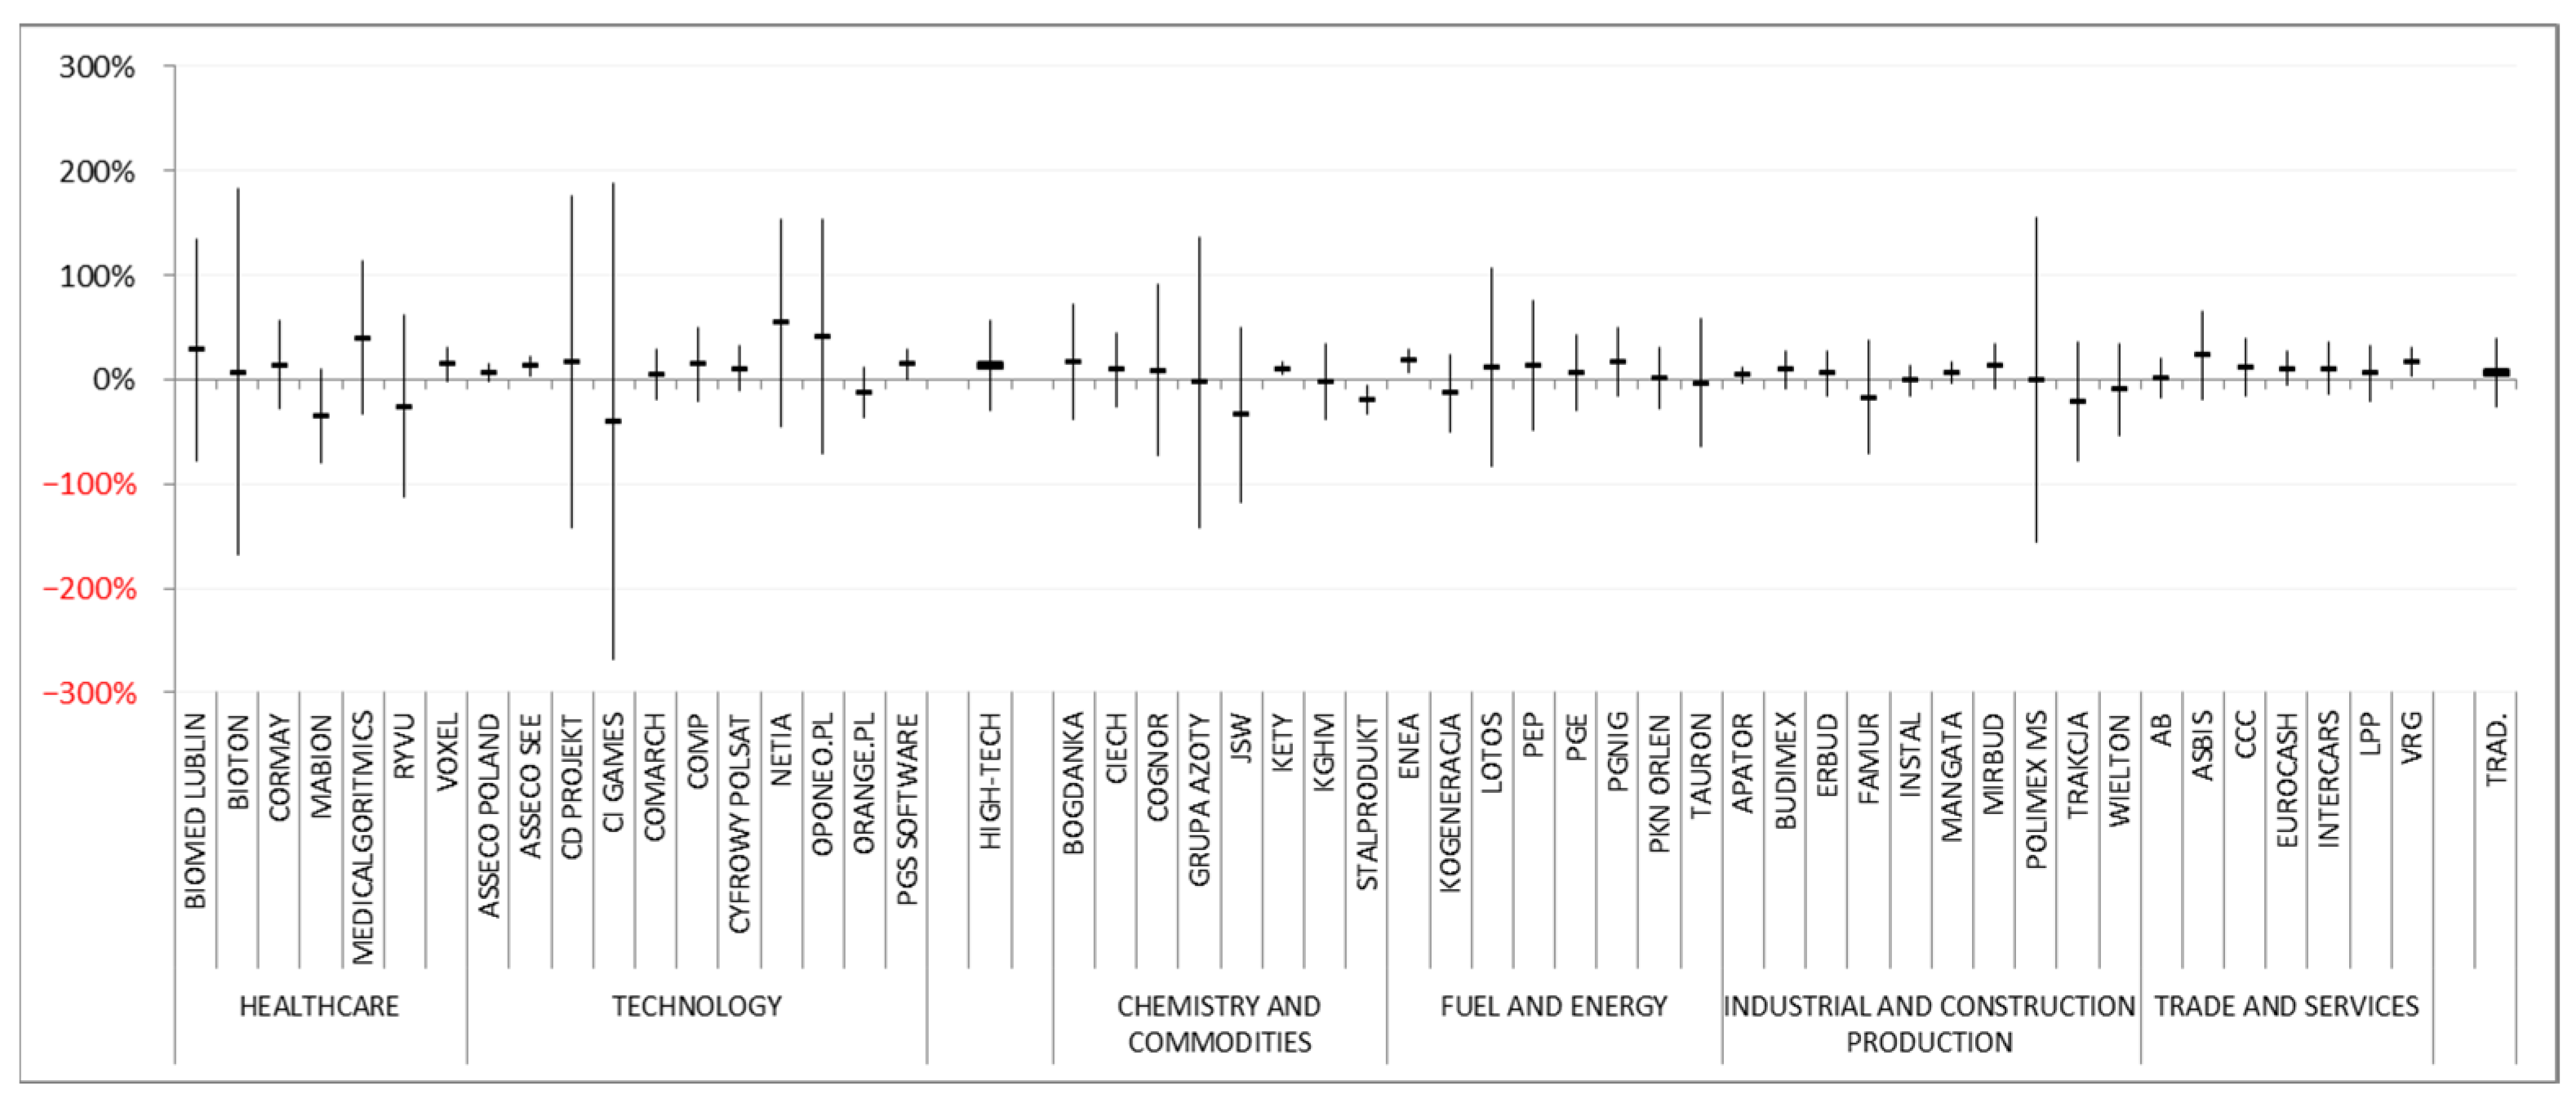
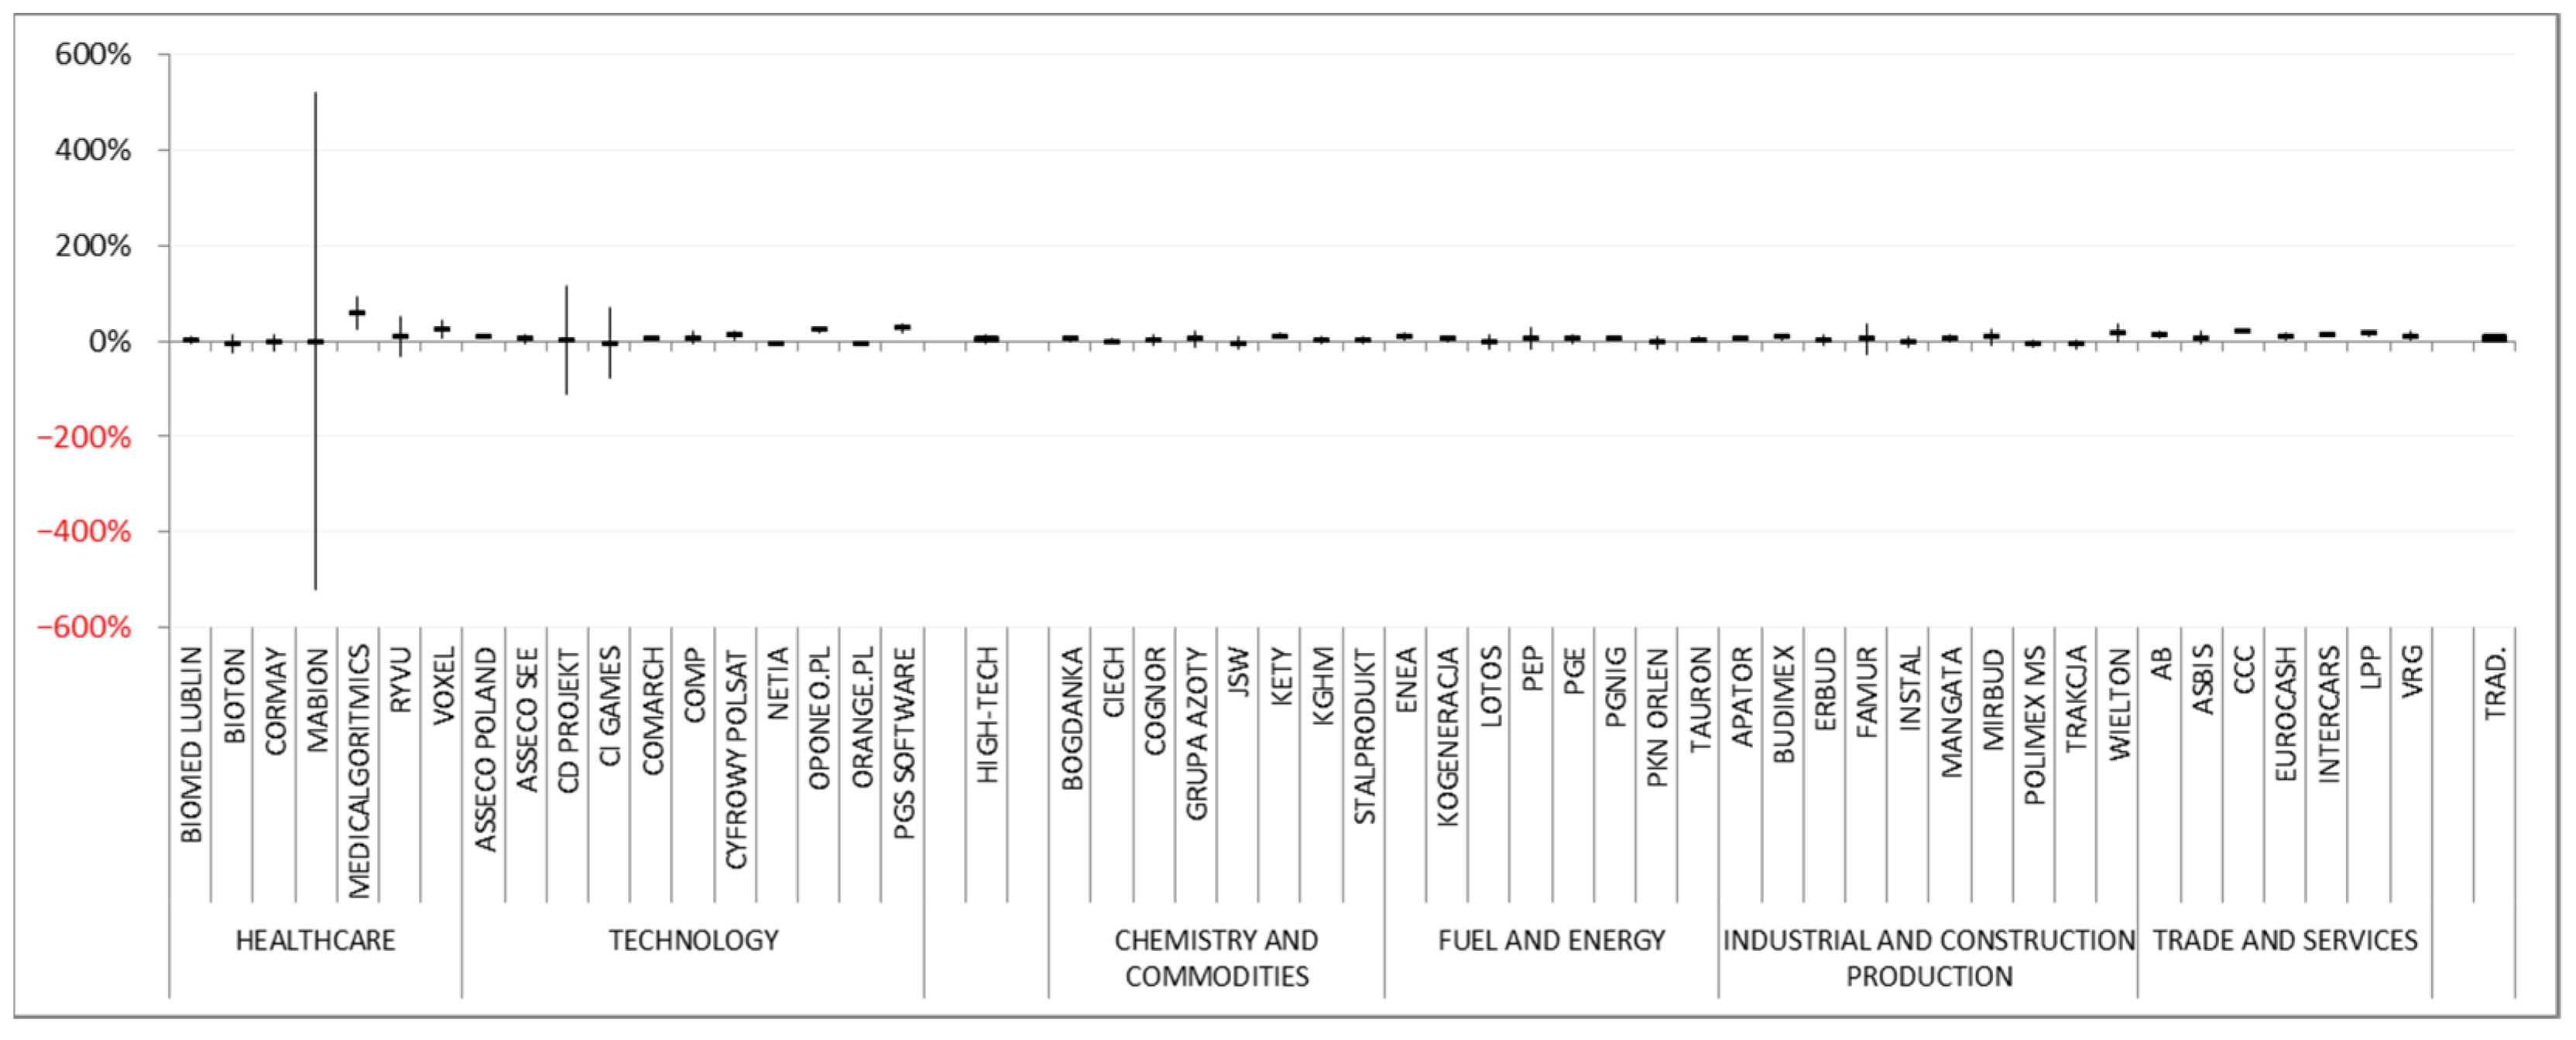
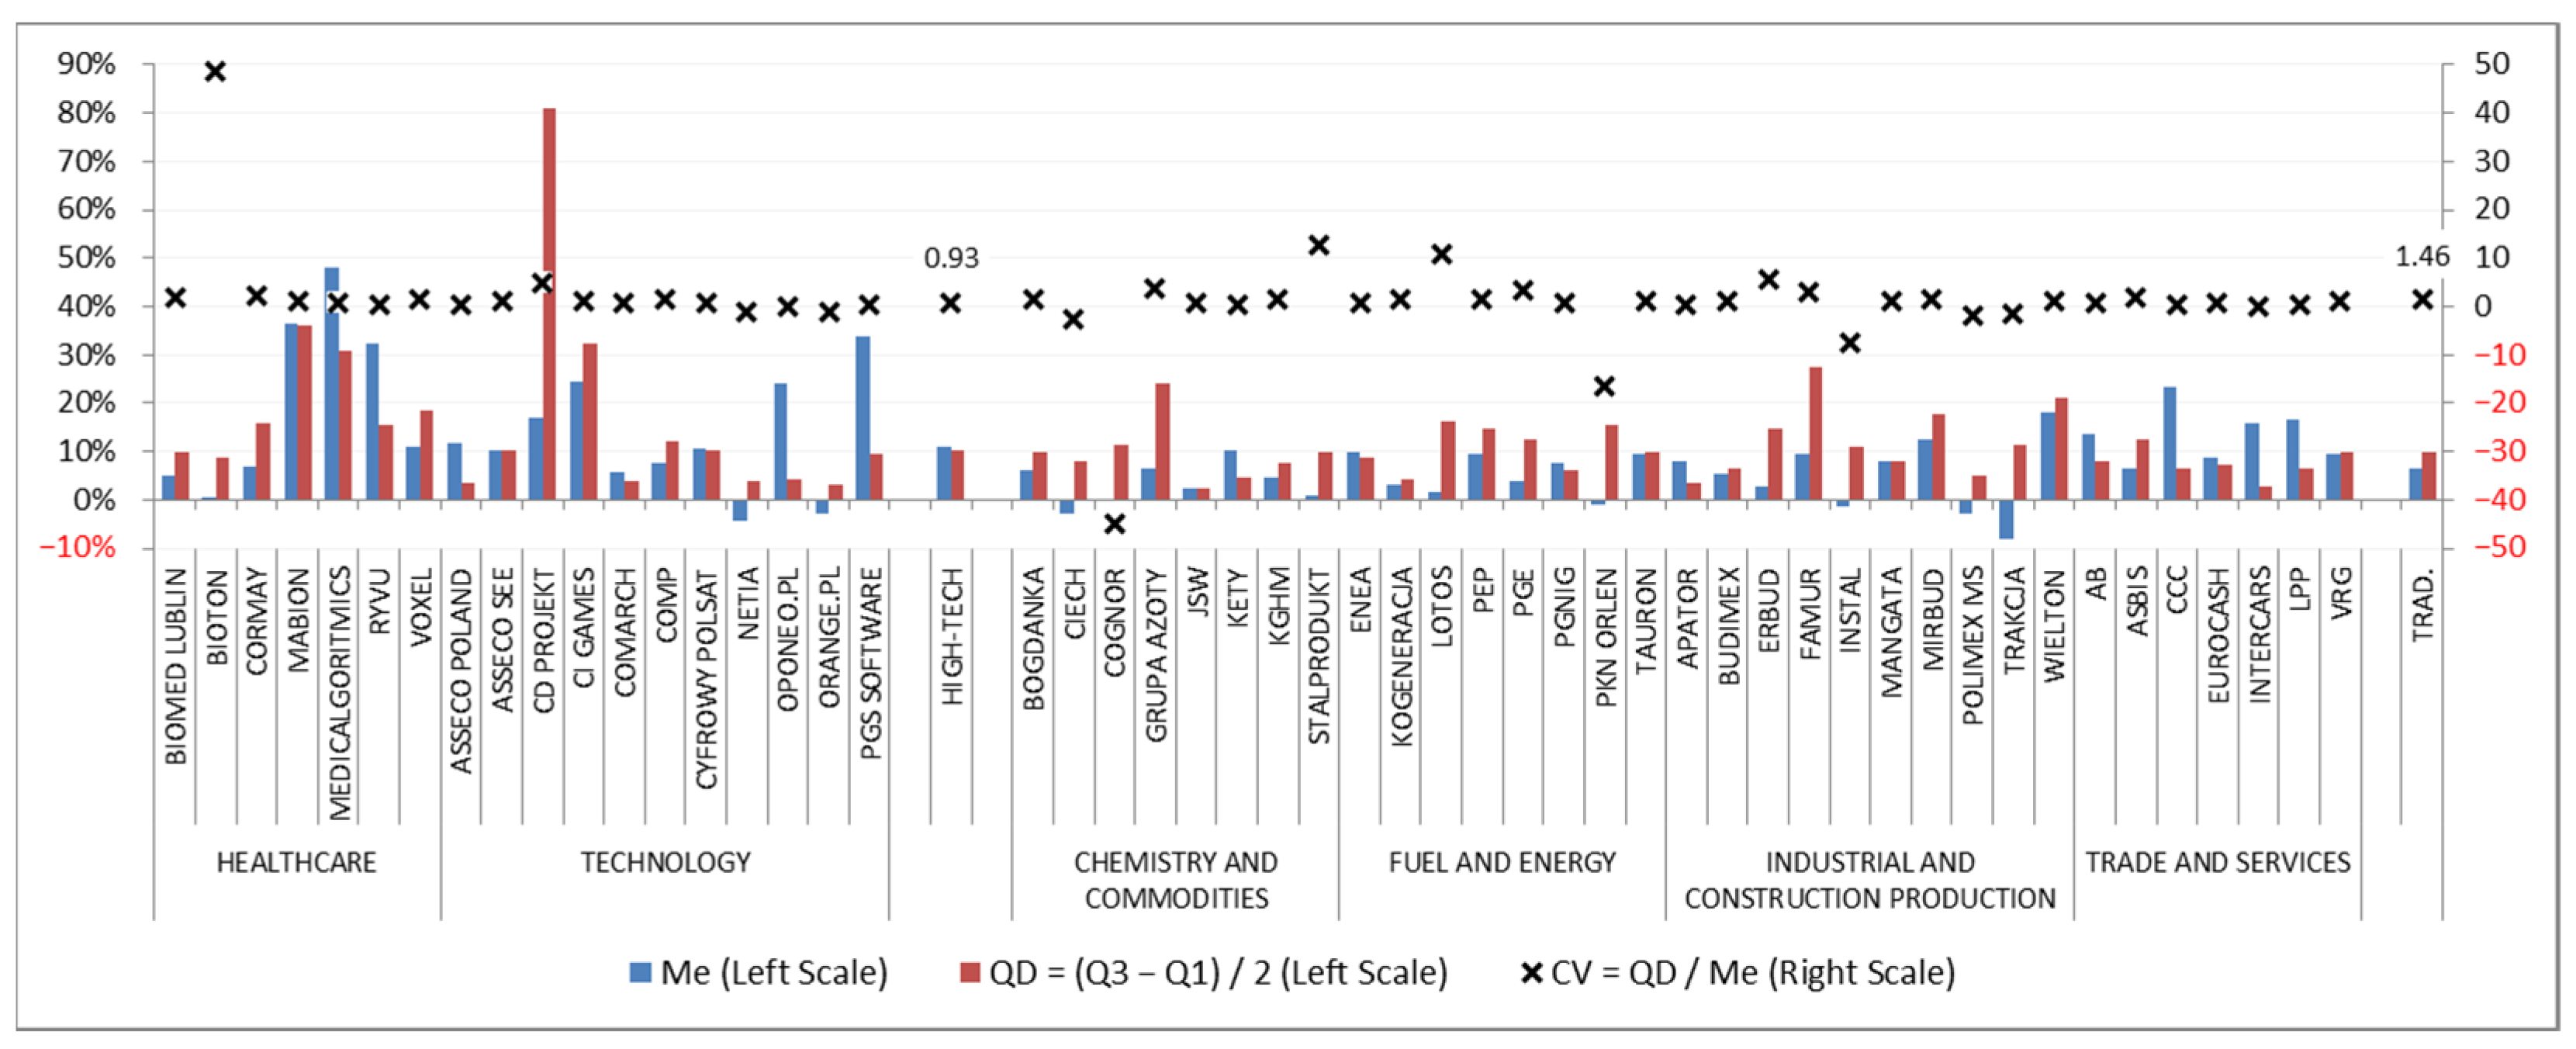
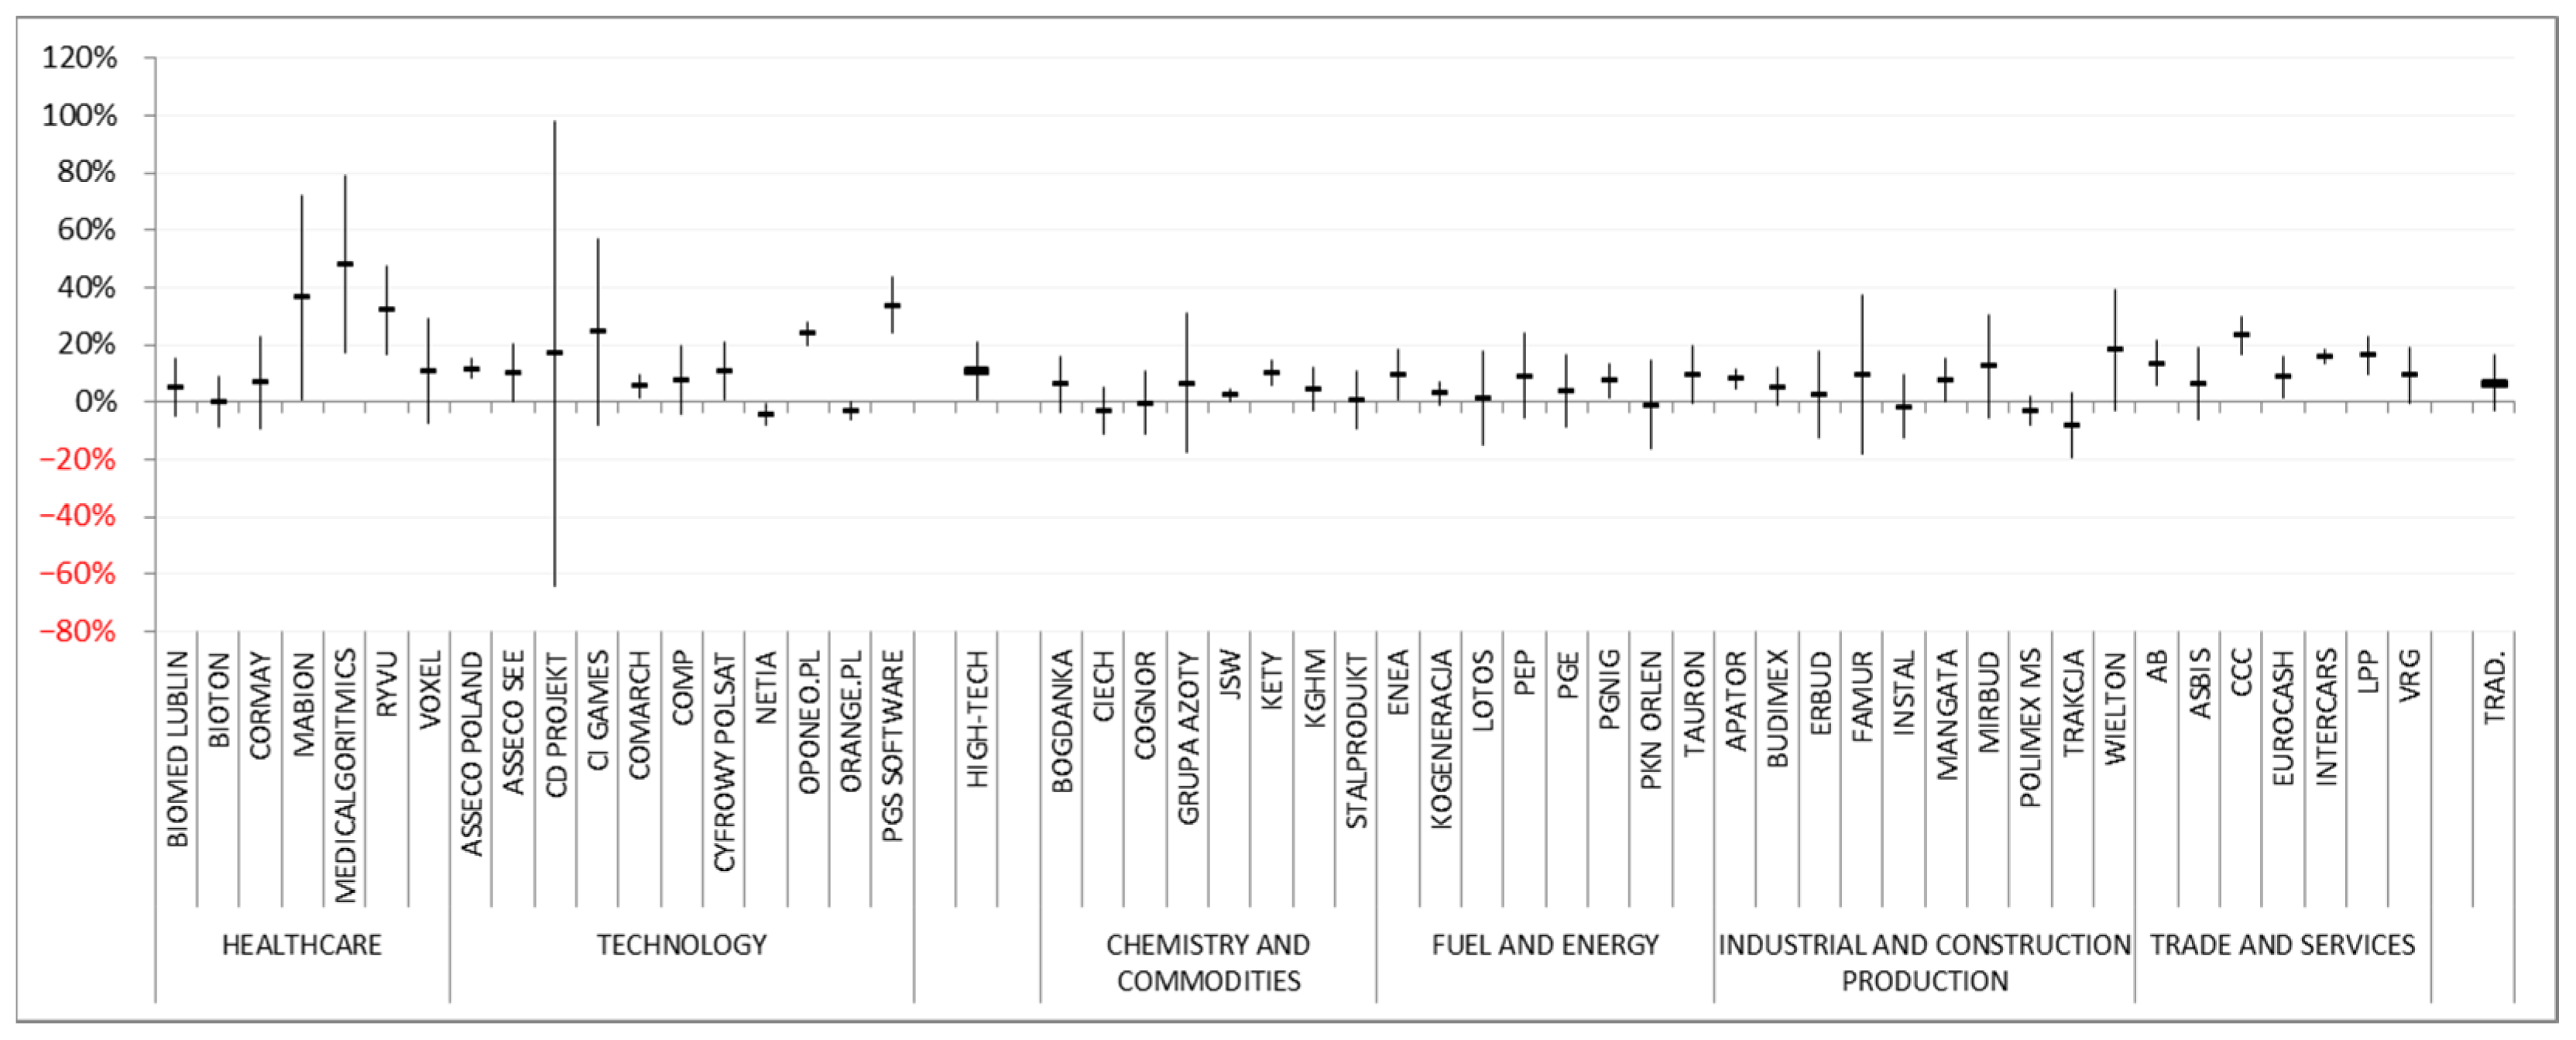
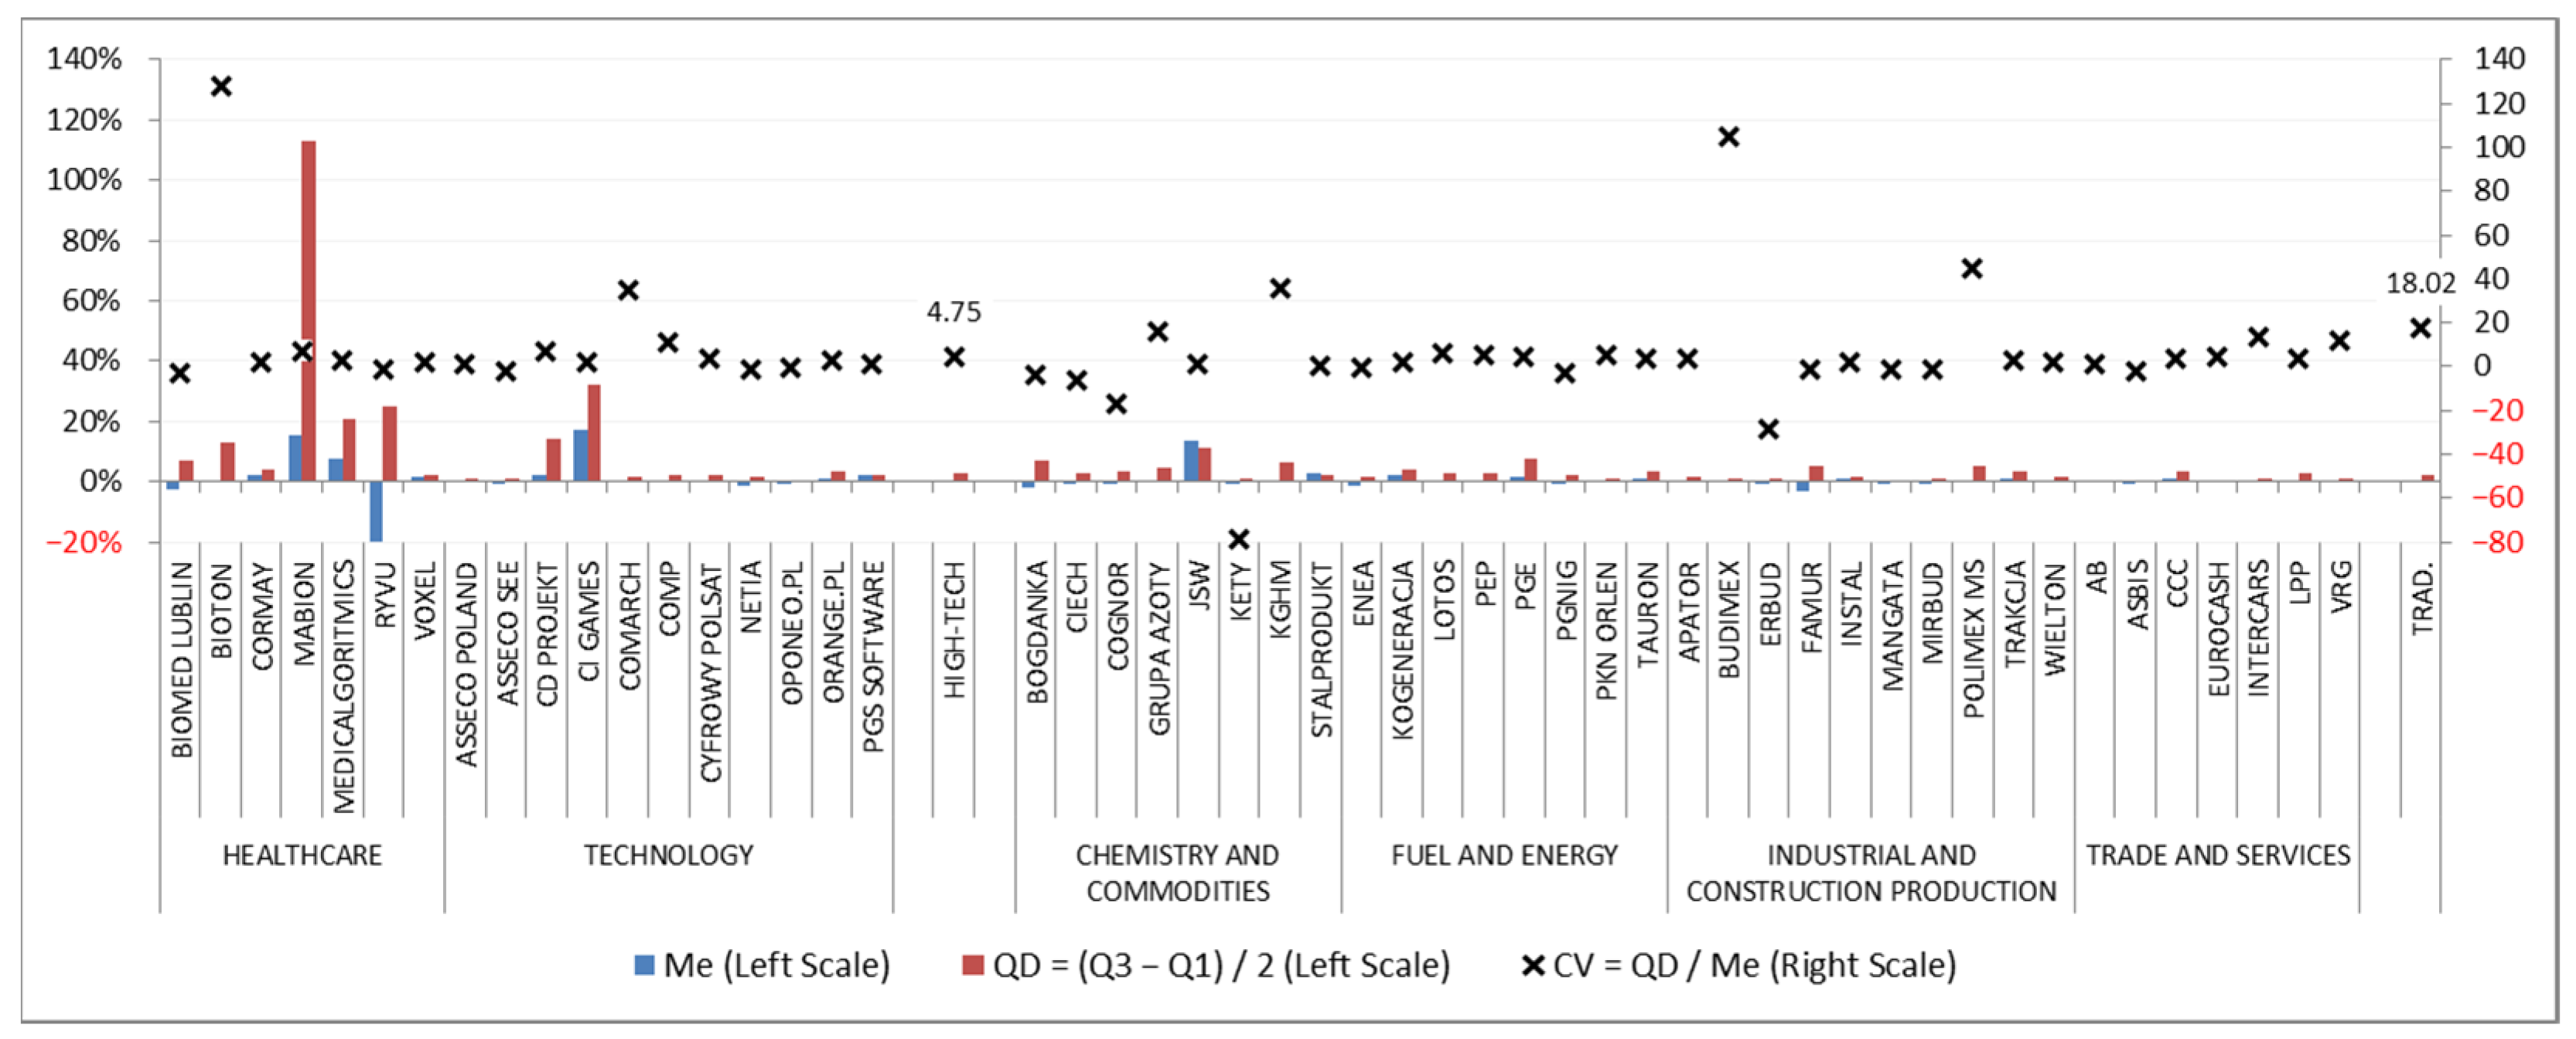
4.1. Business Risk Assessment in the Context of Innovativeness: The Financial Result Perspective
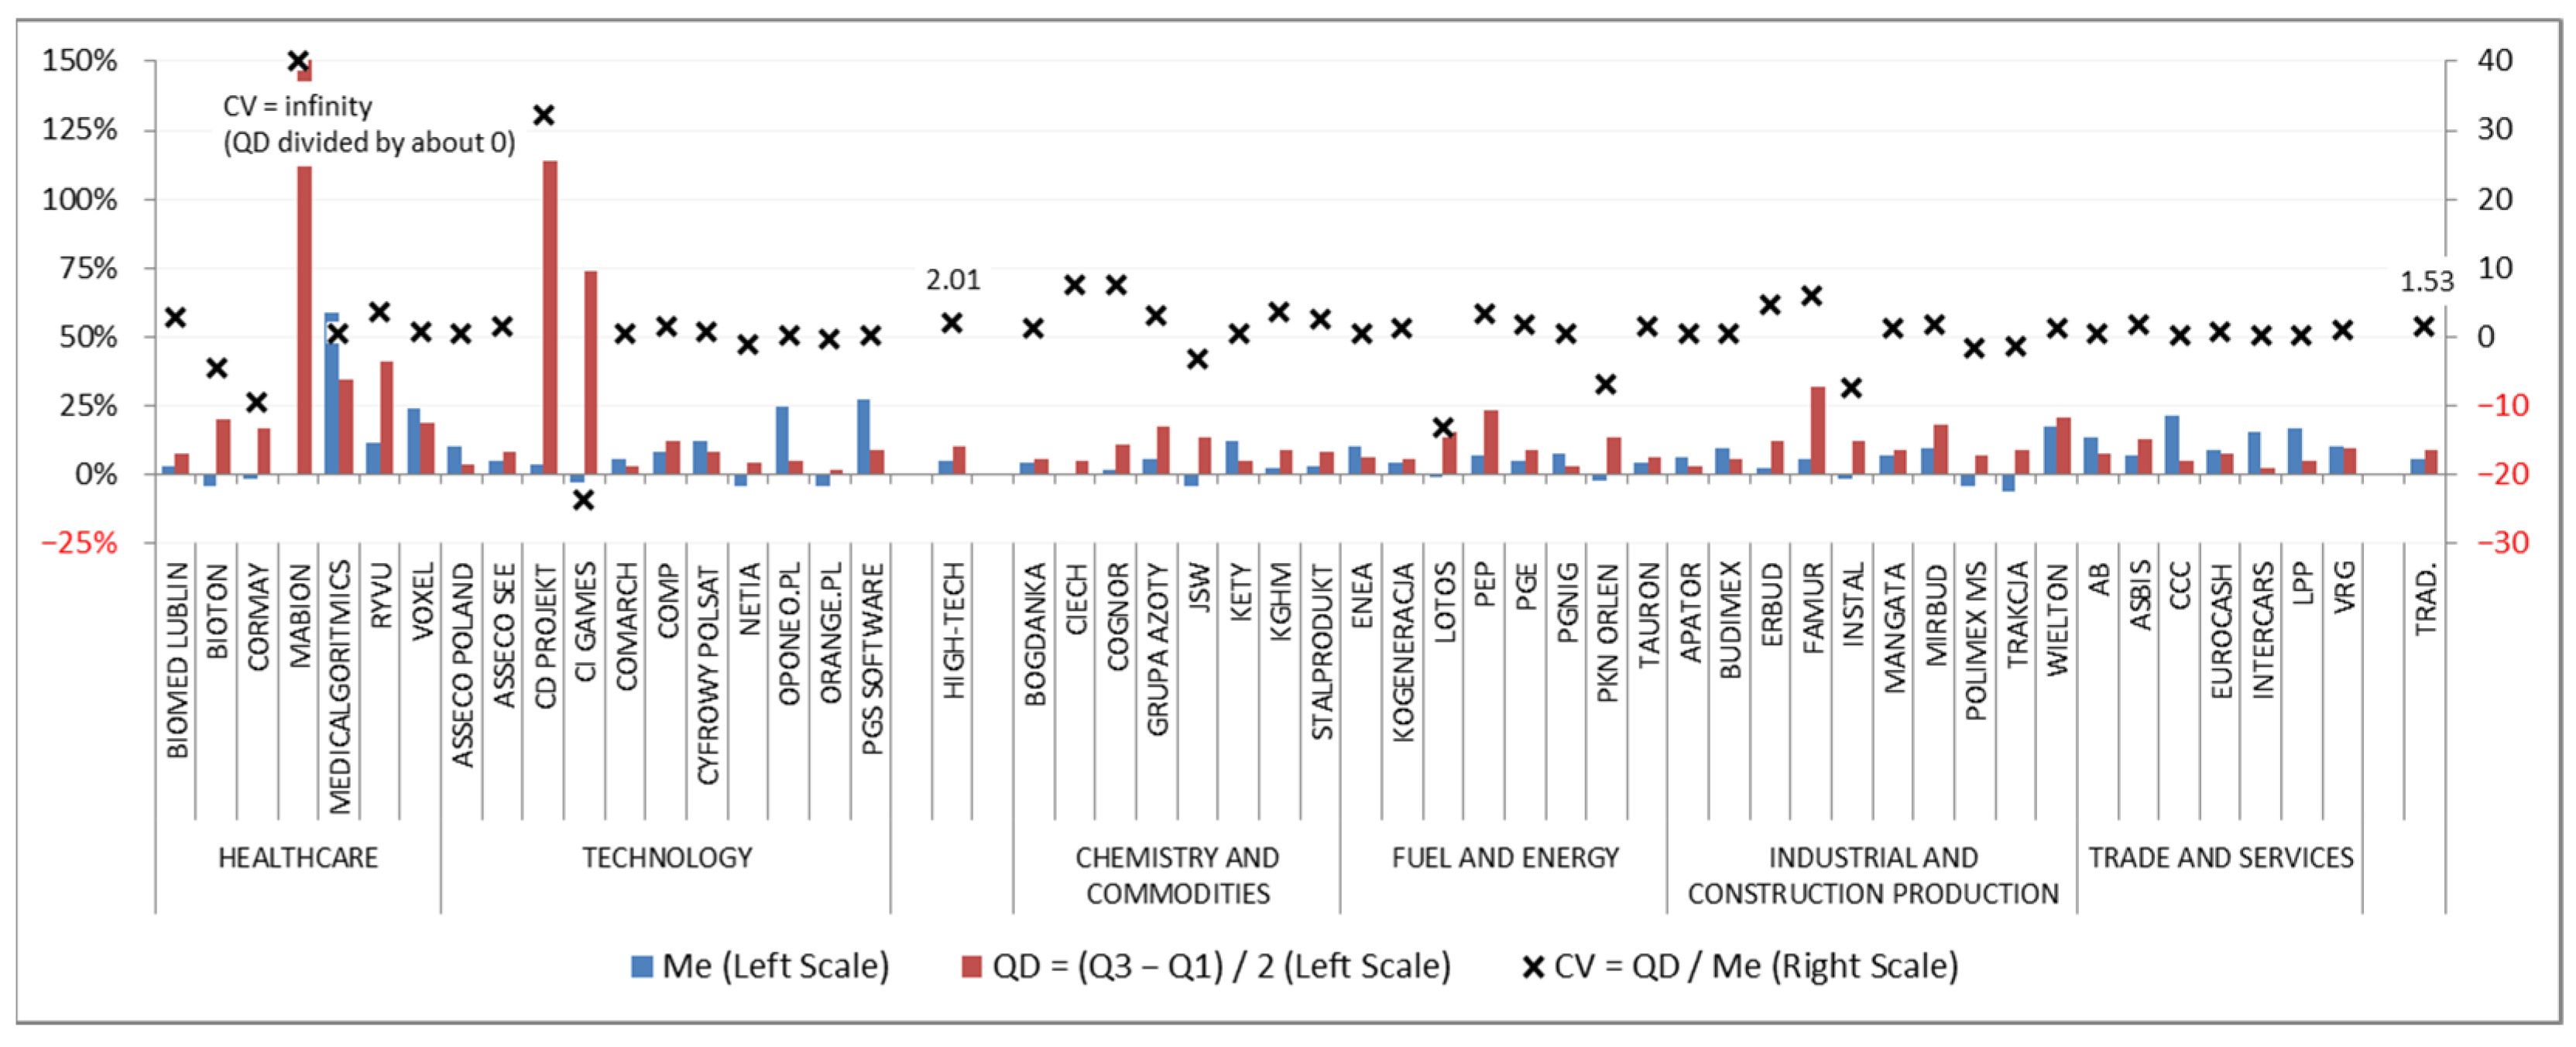
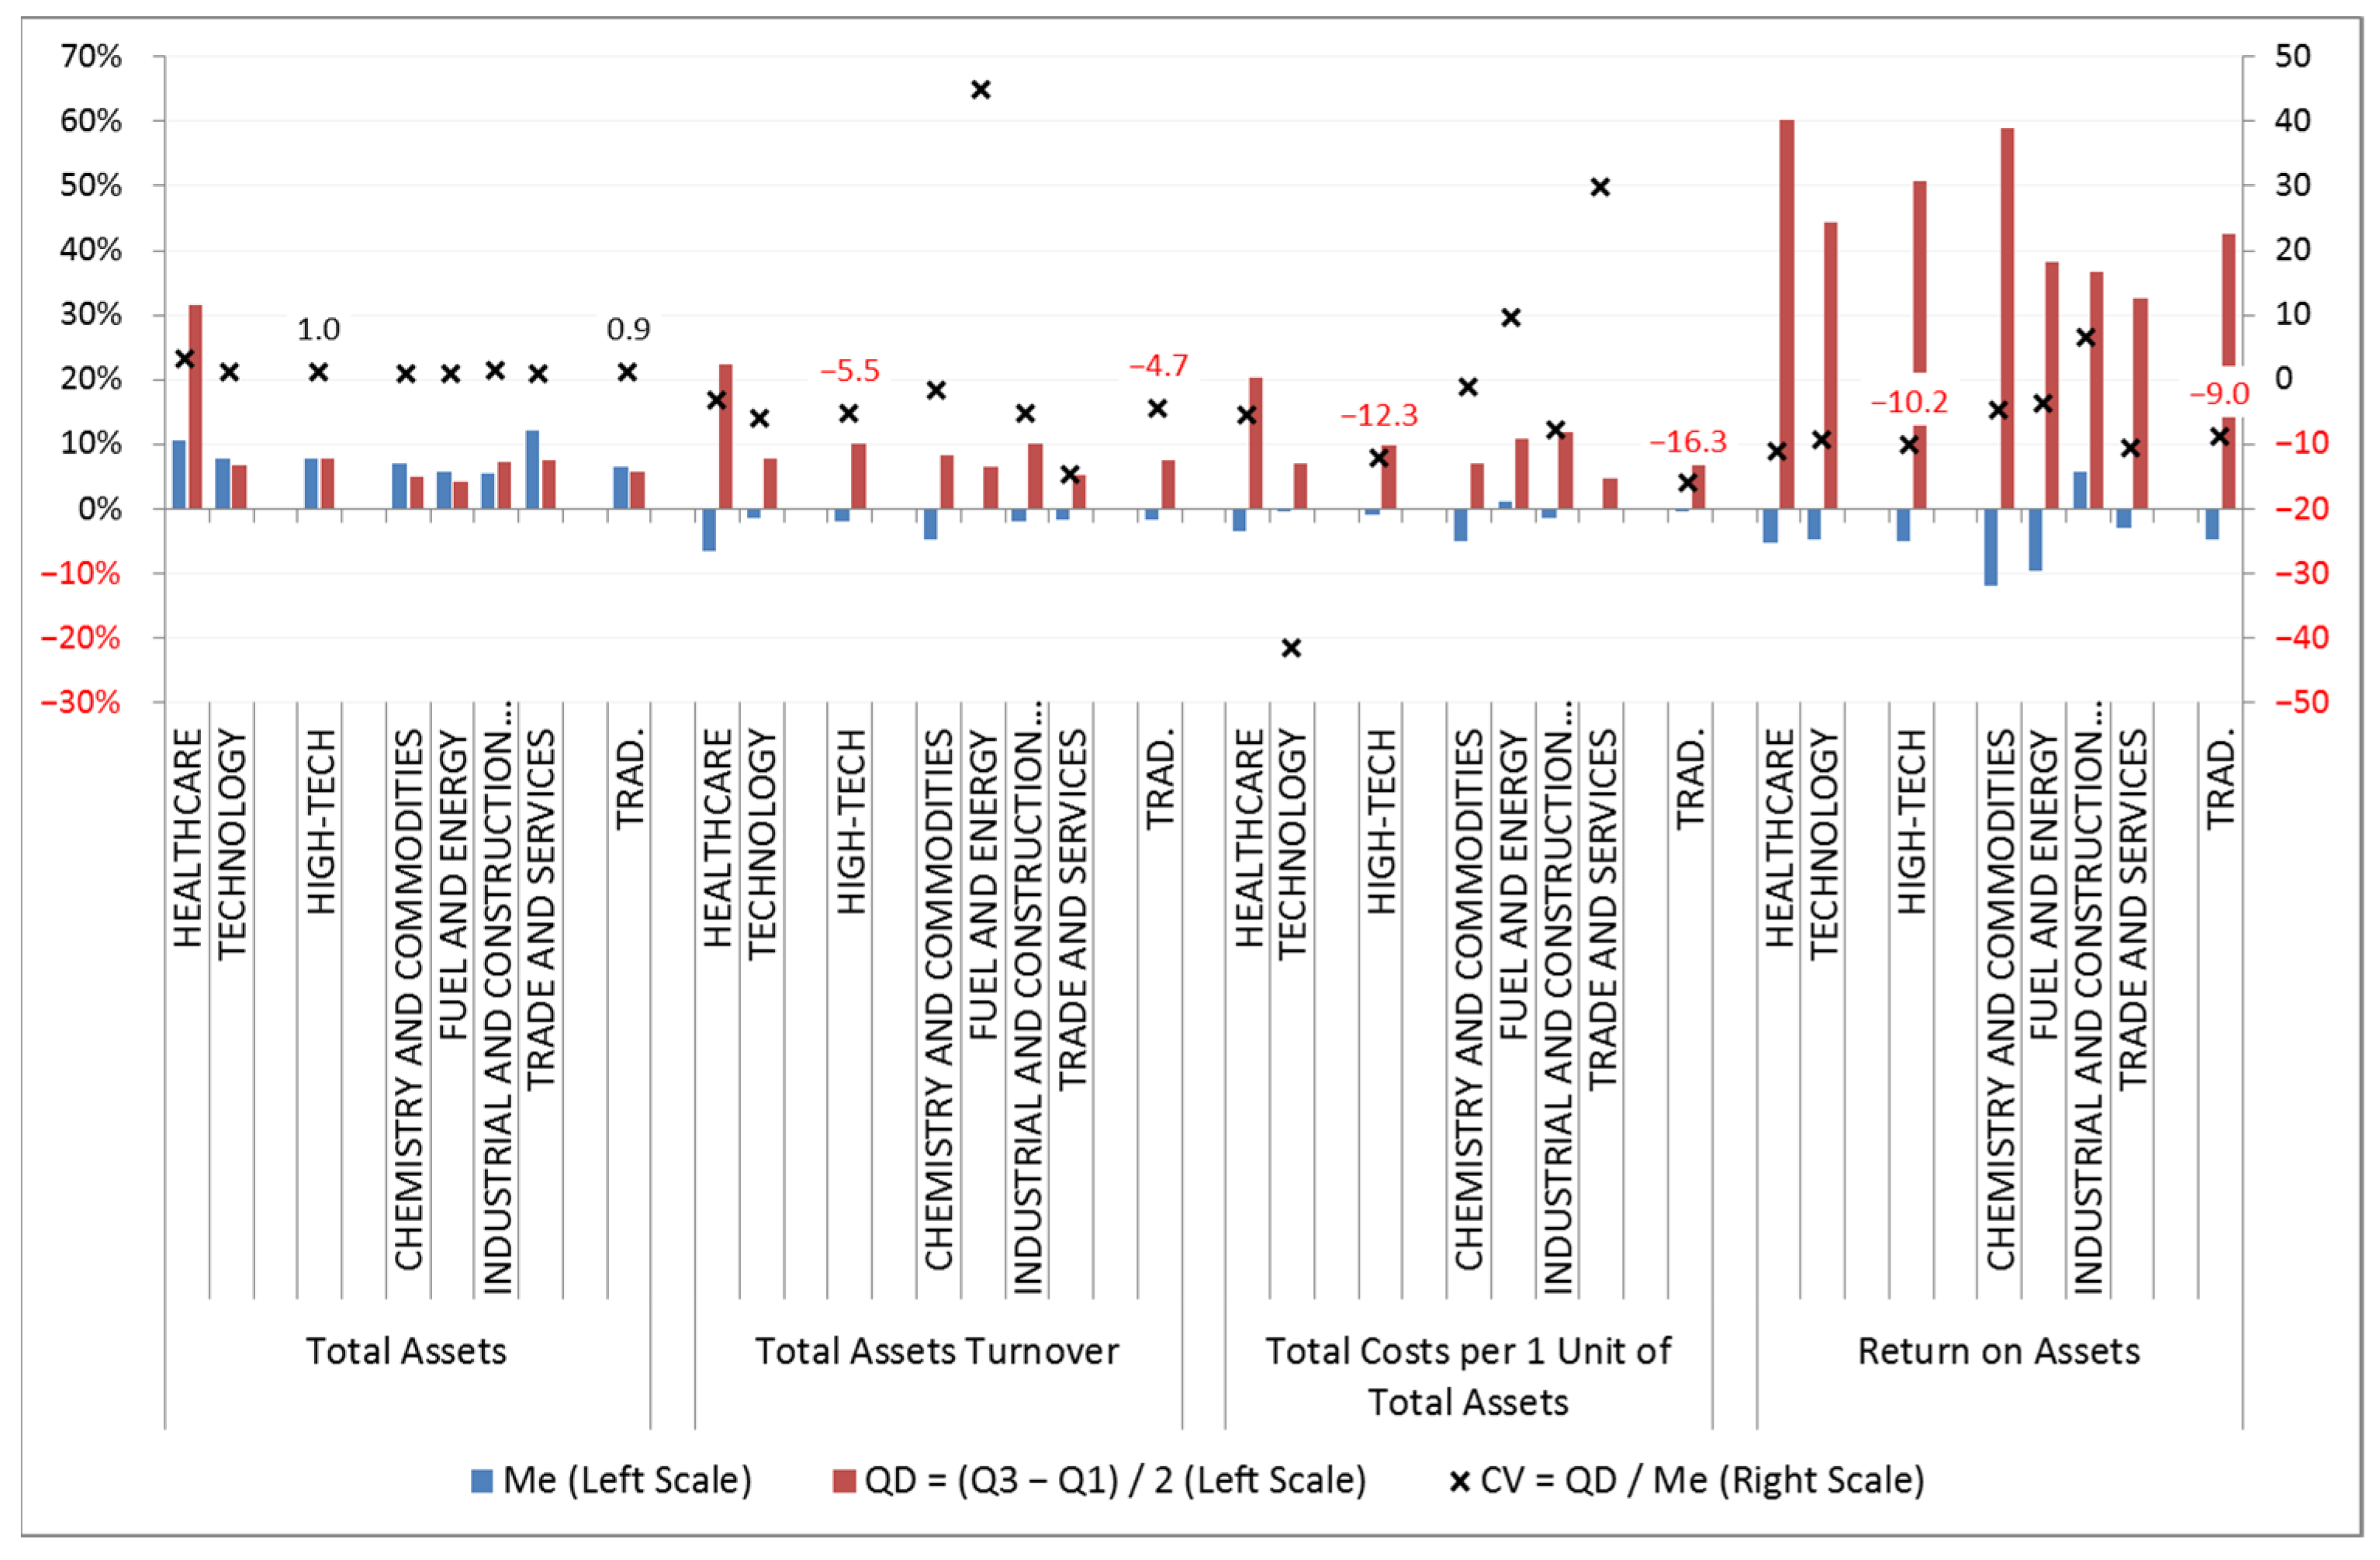
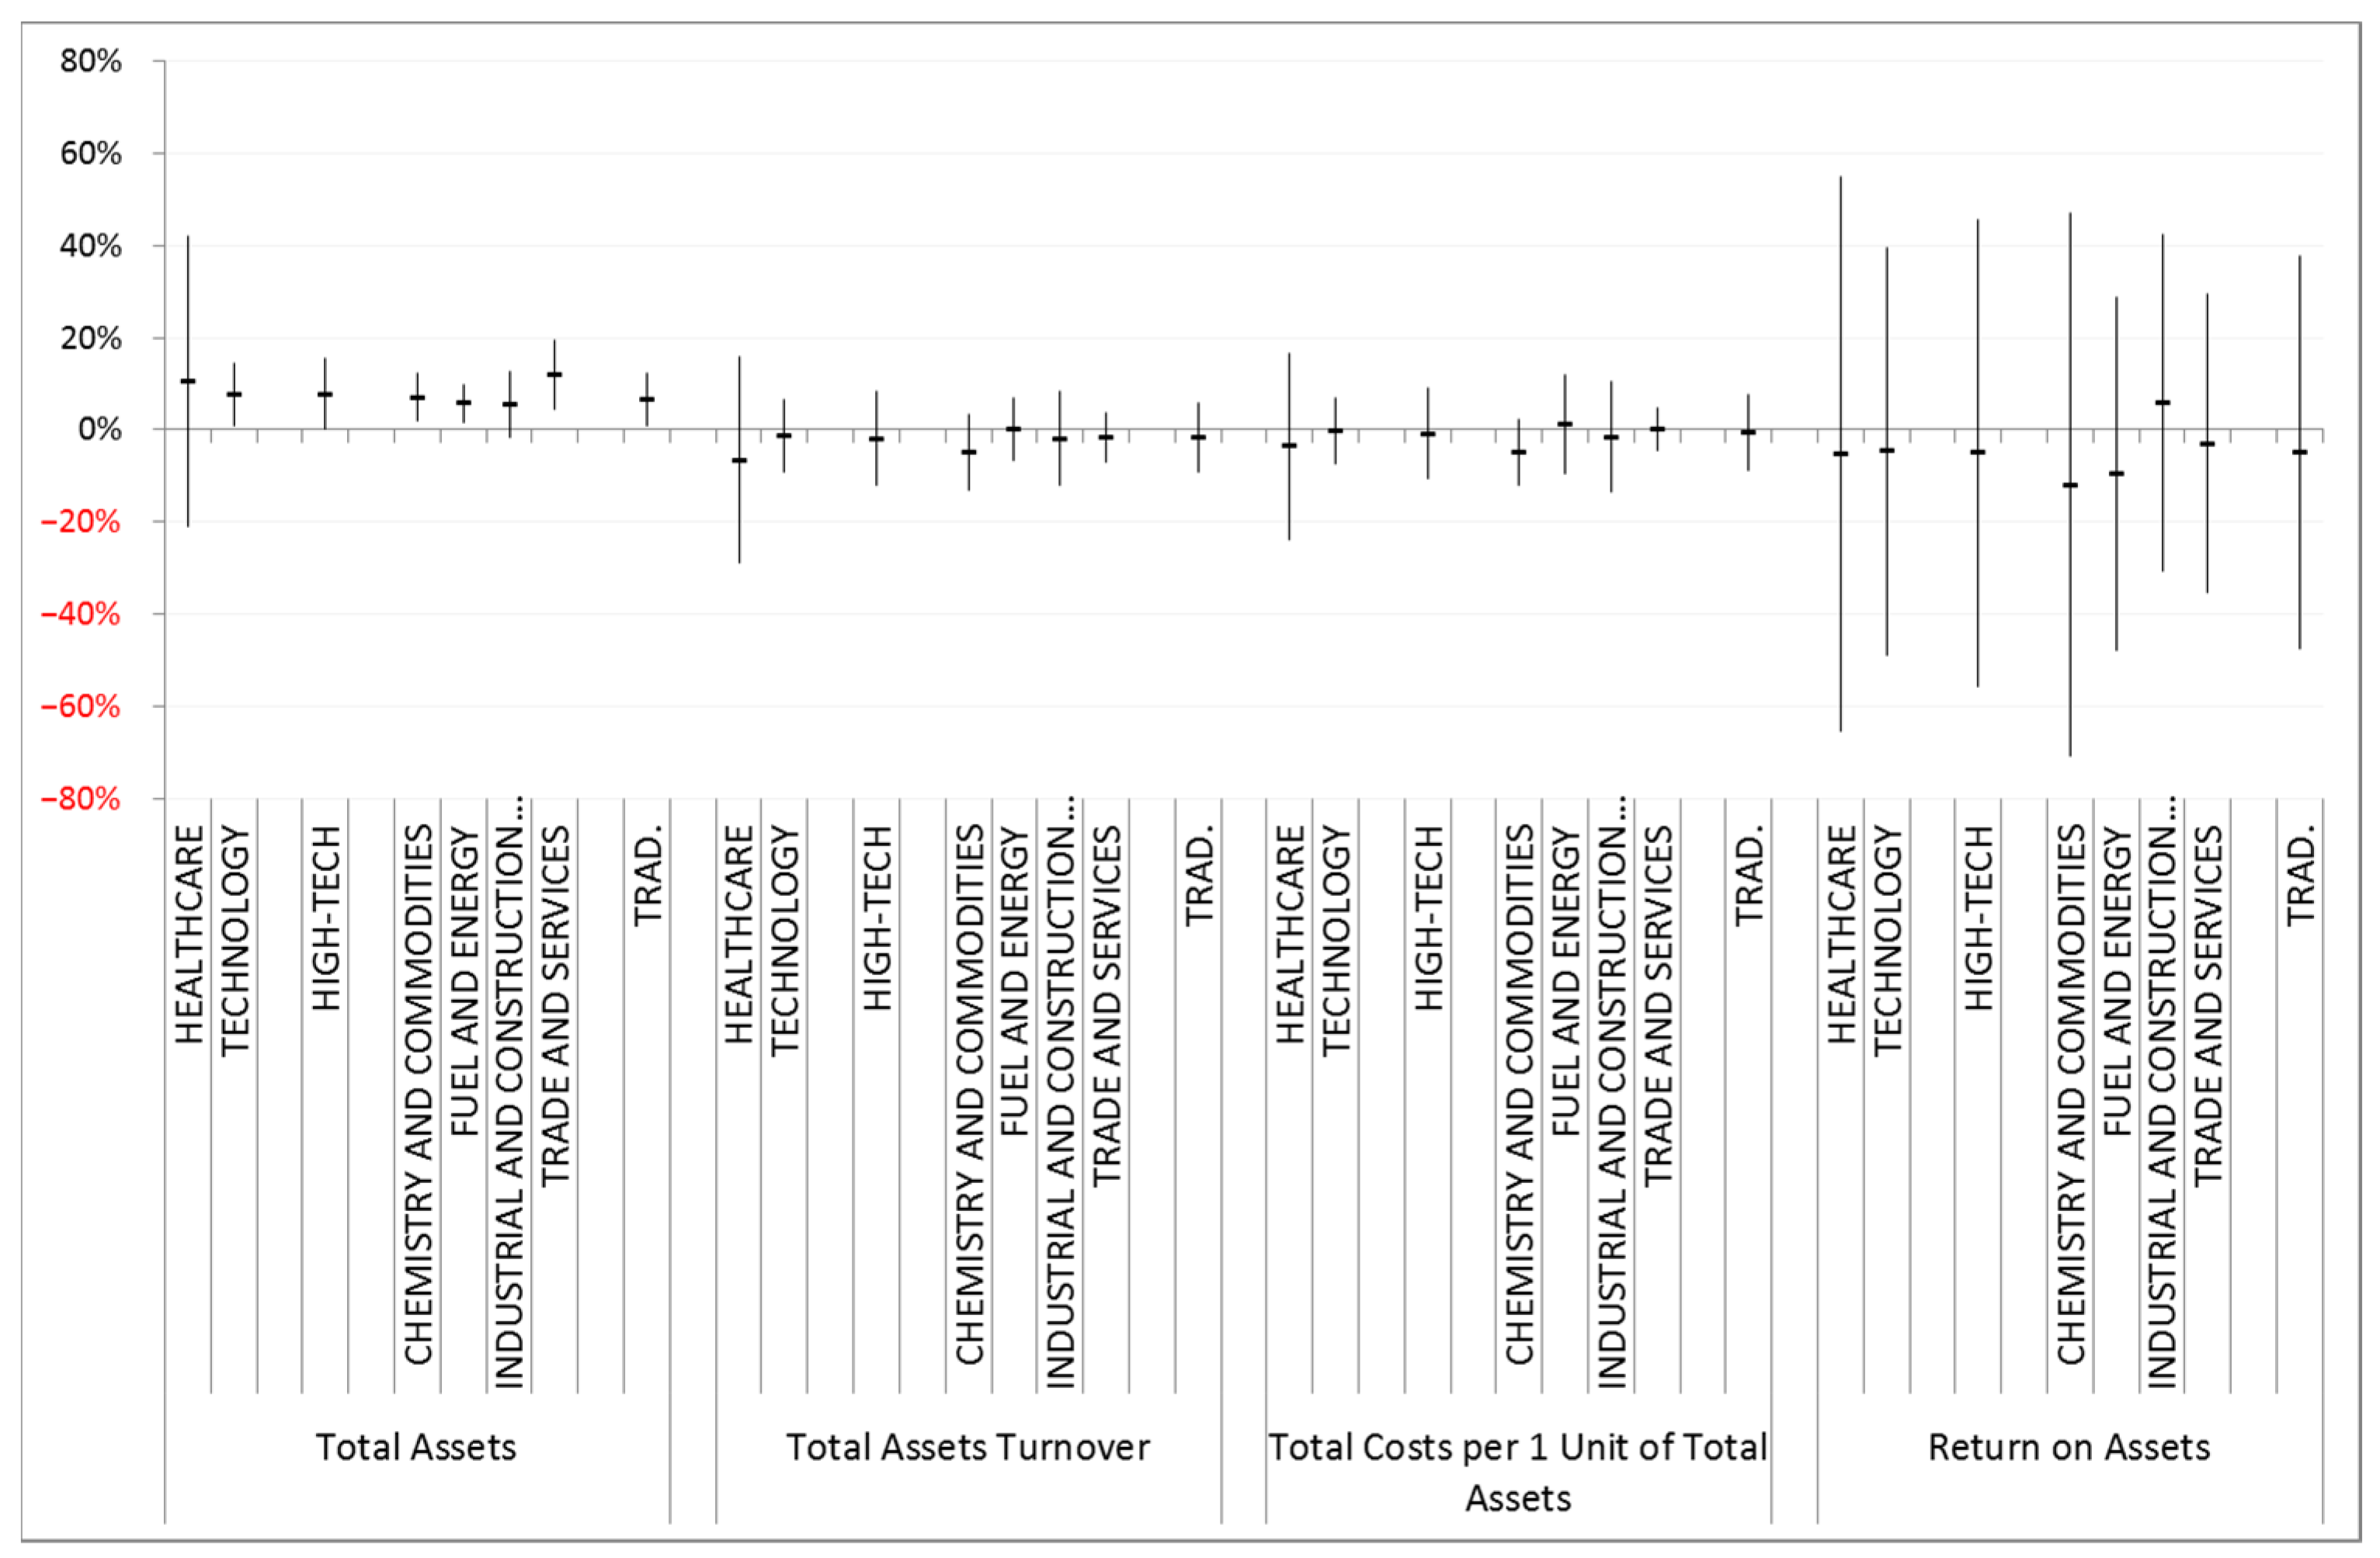
4.2. Business Risk Assessment in the Context of Innovativeness: The Asset Perspective
4.3. Comparative Analysis of Risk in the Context of Innovativeness in High-Tech and Traditional Enterprises
5. Discussion
6. Conclusions
6.1. Theoretical and Practical Implications
- raising awareness of the necessity of lifelong learning and the importance of innovation for social and civilisation development,
- supporting creativity and entrepreneurship at all levels of education and development,
- education in the field of risk management methods in enterprises,
- strengthening and promoting industries and enterprises that have the potential and achievements in the field of innovation,
- increasing the scale of financial aid for innovative entrepreneurs and enterprises,
- promoting Polish innovation in the country and in the world,
- using the best practices in risk management and innovation development, especially those related to developing economies,
- offering assistance to innovative enterprises in crisis.
- formulation of a comprehensive, universal method of risk assessment related to innovative activities;
- conducting a comparative risk-innovation analysis for a group of high-tech and traditional enterprises;
- risk assessment within individual enterprises, industries and individual groups;
- the possibility of using research results both by decision-makers from the macro and mesoeconomic level of the innovation system, as well as by managers of the surveyed enterprises.
6.2. Research Limitations and Further Research
Author Contributions
Funding
Institutional Review Board Statement
Informed Consent Statement
Data Availability Statement
Conflicts of Interest
Appendix A

| No. | Enterprise | Business Description |
|---|---|---|
| High-tech enterprises | ||
| Healthcare sector: | ||
| 1. | BIOMED LUBLIN | Manufacturer of medicinal preparations (prescription medications and OTC medications—over the counter), medical devices and laboratory reagents (used in biochemical and medical laboratories). |
| 2. | BIOTON | Manufacturer and distributor of biotechnological products (recombinant human insulin) and generic medications (mainly antibiotics). |
| 3. | CORMAY | Manufacturer of high-quality diagnostic reagents and distributor of world-class medical equipment. |
| 4. | MABION | Manufacturer of targeted medications that selectively target cancer cells, ensuring better effectiveness and lower toxicity of the therapy. |
| 5. | MEDICALGORITMICS | Provider of system and algorithmic solutions in cardiological diagnostics, in particular in the field of ECG signal analysis. |
| 6. | RYVU | Manufacturer of medications primarily used in the field of oncology. Develops several projects in both the clinical and preclinical stages. |
| 7. | VOXEL | Network of medical diagnostic centres that provide highly specialised services in the field of radiology and offer a comprehensive range of services and products related to the use of the latest technological achievements in medicine. |
| Technology sector: | ||
| 8. | ASSECO POLAND | Manufacturer of technologically advanced software for companies from key sectors of the economy. |
| 9. | ASSECO SEE | Provider of proprietary software and IT services in Southeast Europe. |
| 10. | CD PROJEKT | Game manufacturer as part of the CD Project Red development studio and their distributor through GOG.com. |
| 11. | CI GAMES | Manufacturer and publisher of video games. |
| 12. | COMARCH | Manufacturer of IT systems, including software, computer and network hardware, implementation, training and maintenance services. |
| 13. | COMP | Technology company specialising in solutions in the field of IT security, network security and solutions dedicated to the trade and services market. |
| 14. | CYFROWY POLSAT | Provider of comprehensive, integrated media and telecommunications services. |
| 15. | NETIA | Provides wired telephone services, voice telecommunications services, data transmission services, television services, mobile telephony and broadband Internet access |
| 16. | OPONEO.PL | The company sells tires and rims online. Currently, leading the tire industry in the country, also has over a dozen foreign shops in Europe and the USA. |
| 17. | ORANGE.PL | Leading provider of telecommunications services in Poland and Central and Eastern Europe. |
| 18. | PGS SOFTWARE | IT company offering services in the field of software development and IT outsourcing. Customers are mainly foreign companies, mainly from Great Britain, Scandinavian countries and Germany. |
| Traditional enterprises | ||
| Chemistry and commodities sector: | ||
| 19. | BOGDANKA | Hard coal manufacturer in Poland, standing out from the industry in terms of hard coal mining efficiency and investment plans. |
| 20. | CIECH | Production, trade and distribution of chemicals. |
| 21. | COGNOR | Operates in two main areas: production of semi-finished products and steel products. |
| 22. | GRUPA AZOTY | One of the key concerns in the fertiliser and chemical industry in Europe. |
| 23. | JSW | Largest manufacturer of high-quality type 35 (hard) coking coal and a significant manufacturer of coke in the European Union. |
| 24. | KĘTY | Production and sale of aluminum profiles and components, aluminum systems used in the construction industry, flexible packaging and polypropylene films. |
| 25. | KGHM | Leading European concern extracting copper ore and non-ferrous metals. |
| 26. | STALPRODUKT | Manufacturer and exporter of highly processed steel products: electrical transformer sheets, cold bent sections, road barriers and toroidal cores. |
| Fuel and energy sector: | ||
| 27. | ENEA | Manufacturer and distributor of electricity and heat. |
| 28. | KOGENERACJA | Manufacturer of electricity and heat generated in cogeneration. |
| 29. | LOTOS | Oil company dealing in the extraction and processing of crude oil as well as wholesale and retail sale of petroleum products. |
| 30. | PEP | Implementation of projects in the energy sector, ranging from the production of electricity from conventional and renewable sources, through the distribution of electricity and gas, to the sale and trade of energy and certificates of origin. |
| 31. | PGE | Lignite mining, electricity generation from fossil fuels and renewable energy sources, distribution and sale of electricity to end users. |
| 32. | PGNIG | Exploration and operation of natural gas and crude oil as well as import, storage, trade and distribution of gaseous and liquid fuels. |
| 33. | PKN ORLEN | Manufacturer and distributor of petroleum and petrochemical products. |
| 34. | TAURON | Distributor, seller and manufacturer of electricity. |
| Industrial and construction production sector: | ||
| 35. | APATOR | Manufacturer of measuring equipment and systems, as well as suppliers of modern solutions for the automation of electricity grid operation. |
| 36. | BUDIMEX | Offers services (most often as a general contractor) in the following infrastructure sectors: road, rail, airport, building construction, energy, industrial and ecological. |
| 37. | ERBUD | Business activity is carried out in general contracting in the following segments: cubature construction, road and engineering construction, industrial construction and engineering and service for the energy sector, as well as in the development segment. |
| 38. | FAMUR | Manufacturer of mining machinery and equipment (including mechanised longwall systems, systems for drilling drifts, underground transport systems and machines for open-pit mining). |
| 39. | INSTAL | Provides construction and assembly services in the field of industrial and construction installations, production of installation elements and steel structures as well as design, production and assembly of ventilation and air conditioning systems. |
| 40. | MANGATA | Industrial holding conducting business in 3 operating segments: automotive, fittings and industrial automation, fasteners. Group of companies distributing products to over 70 countries around the world. |
| 41. | MIRBUD | General contractor in the field of public utility, residential, industrial and road engineering. |
| 42. | POLIMEX MS | Engineering and service business. |
| 43. | TRAKCJA | Implementation of works related to the broadly understood rail and road infrastructure with the use of a modern machine park. |
| 44. | WIELTON | Manufacturer and seller of semi-trailers and trailers, as well as bodies for trucks. |
| Trade and services sector: | ||
| 45. | AB | The largest distribution network in the CEE region selling products of the world’s largest producers of modern technologies. |
| 46. | ASBIS | One of the leading distributors of information technology products in the emerging markets of Europe, the Middle East and Africa. |
| 47. | CCC | The largest footwear retail company in Central Europe and the largest footwear manufacturer in Europe. |
| 48. | EUROCASH | A leader in the wholesale distribution of FMCG products on the Polish market. |
| 49. | INTERCARS | The largest importer and distributor of spare parts for passenger cars and commercial vehicles. |
| 50. | LPP | A company that designs and distributes clothing in Poland and abroad. The brands offered by LPP differ in terms of target groups. It offers clothes for children (RE Kids brand, part of the RESERVED brand), teenagers (Cropp, House, SiNSAY) and adults (MOHITO, RESERVED and Tallinder). |
| 51. | VRG | The Group specialises in designing and distributing high-quality fashion collections for men and women as well as jewelery. It is the owner of trademarks in five main lines: Vistula, Bytom, Wólczanka, Deni Cler Milano and W.KRUK. |
Appendix B
| Me | QD = (Q3 − Q1)/2 | Me − QD | Me + QD | |
|---|---|---|---|---|
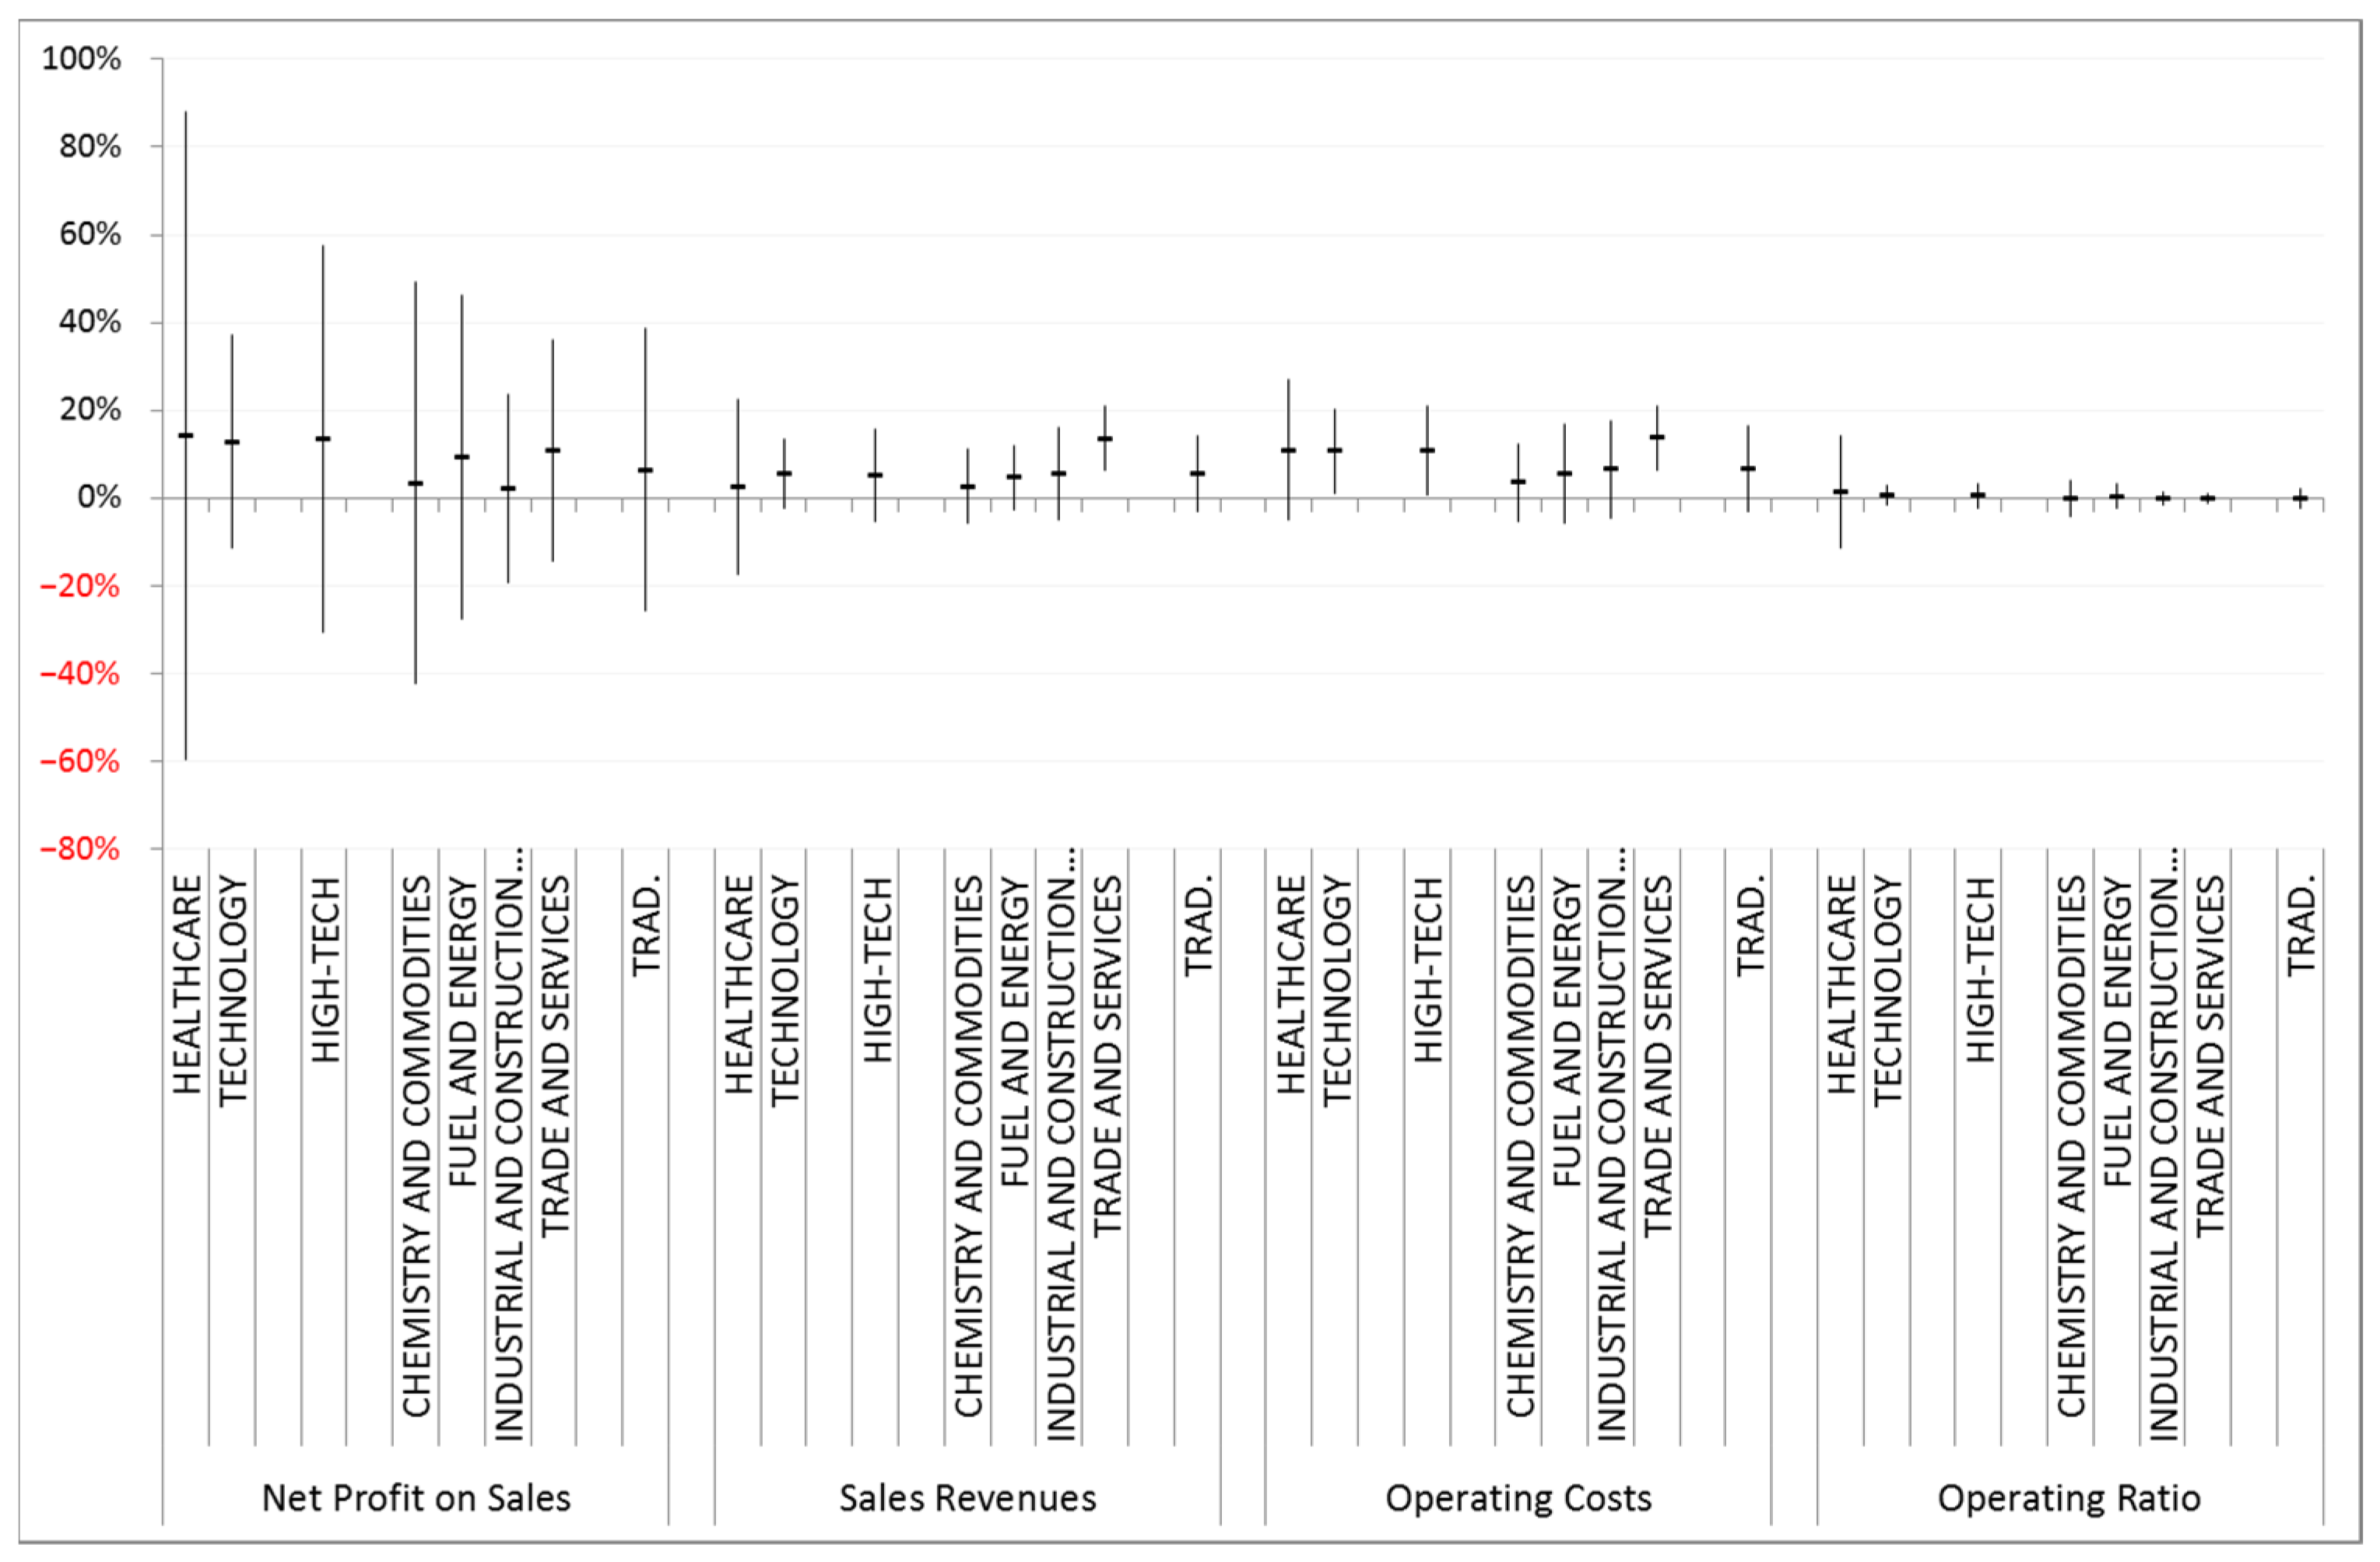
| Net Profit on Sales | ||||
| HEALTHCARE | 14% | 74% | −59% | 88% |
| TECHNOLOGY | 13% | 24% | −11% | 37% |
| HIGH-TECH | 14% | 44% | −30% | 58% |
| CHEMISTRY AND COMMODITIES | 3% | 46% | −42% | 49% |
| FUEL AND ENERGY | 9% | 37% | −28% | 46% |
| INDUSTRIAL AND CONSTRUCTION PRODUCTION | 2% | 22% | −19% | 24% |
| TRADE AND SERVICES | 11% | 25% | −14% | 36% |
| TRAD. | 7% | 32% | −26% | 39% |
| Sales Revenues | ||||
| HEALTHCARE | 3% | 20% | −17% | 23% |
| TECHNOLOGY | 6% | 8% | −2% | 14% |
| HIGH-TECH | 5% | 10% | −5% | 16% |
| CHEMISTRY AND COMMODITIES | 3% | 8% | −6% | 11% |
| FUEL AND ENERGY | 5% | 7% | −3% | 12% |
| INDUSTRIAL AND CONSTRUCTION PRODUCTION | 6% | 11% | −5% | 16% |
| TRADE AND SERVICES | 14% | 7% | 6% | 21% |
| TRAD. | 6% | 9% | −3% | 14% |
| Operating Costs | ||||
| HEALTHCARE | 11% | 16% | −5% | 27% |
| TECHNOLOGY | 11% | 10% | 1% | 20% |
| HIGH-TECH | 11% | 10% | 1% | 21% |
| CHEMISTRY AND COMMODITIES | 4% | 9% | −5% | 13% |
| FUEL AND ENERGY | 6% | 11% | −6% | 17% |
| INDUSTRIAL AND CONSTRUCTION PRODUCTION | 7% | 11% | −5% | 18% |
| TRADE AND SERVICES | 14% | 7% | 6% | 21% |
| TRAD. | 7% | 10% | −3% | 16% |
| Operating Ratio | ||||
| HEALTHCARE | 1% | 13% | −11% | 14% |
| TECHNOLOGY | 1% | 2% | −2% | 3% |
| HIGH-TECH | 1% | 3% | −2% | 3% |
| CHEMISTRY AND COMMODITIES | 0% | 4% | −4% | 4% |
| FUEL AND ENERGY | 1% | 3% | −2% | 3% |
| INDUSTRIAL AND CONSTRUCTION PRODUCTION | 0% | 1% | −1% | 1% |
| TRADE AND SERVICES | 0% | 1% | −1% | 1% |
| TRAD. | 0% | 2% | −2% | 2% |
References
- Hintzmann, C.; Lladós-Masllorens, J.; Ramos, R. Intangible Assets and Labour Productivity Growth. Economies 2021, 9, 82. [Google Scholar] [CrossRef]
- Li, G.; Wei, W. Financial development, openness, innovation, carbon emissions, and economic growth in China. Energy Econ. 2021, 97, 105194. [Google Scholar] [CrossRef]
- Maneejuk, P.; Yamaka, W. An analysis of the impacts of telecommunications technology and innovation on economic growth. Telecommun. Policy 2020, 44, 102038. [Google Scholar] [CrossRef]
- Zhou, B.; Zeng, X.; Jiang, L.; Xue, B. High-quality Economic Growth under the Influence of Technological Innovation Preference in China: A Numerical Simulation from the Government Financial Perspective. Struct. Chang. Econ. Dyn. 2020, 54, 163–172. [Google Scholar] [CrossRef]
- Mollaahmetoğlu, E.; Akçalı, B.Y. The Missing-Link between Financial Development and Economic Growth: Financial Innovation. Procedia Comput. Sci. 2019, 158, 696–704. [Google Scholar] [CrossRef]
- Thompson, M. Social capital, innovation and economic growth. J. Behav. Exp. Econ. 2018, 73, 46–52. [Google Scholar] [CrossRef]
- European Innovation Scoreboard 2021—Main Report. Available online: https://ec.europa.eu/docsroom/documents/46013 (accessed on 10 May 2022).
- Puertas, R.; Marti, L.; Guaita-Martinez, J.M. Innovation, lifestyle, policy and socioeconomic factors: An analysis of European quality of life. Technol. Forecast. Soc. Chang. 2020, 160, 120209. [Google Scholar] [CrossRef]
- Barciszewski, J.; Ciemerych, M.A.; Twardowski, T. Novel insights and innovations in biotechnology towards improved quality of life. New Biotechnol. 2019, 49, 58–65. [Google Scholar] [CrossRef]
- Woodside, A.G.; Bernal, P.M.; Coduras, A. The general theory of culture, entrepreneurship, innovation, and quality-of-life: Comparing nurturing versus thwarting enterprise start-ups in BRIC, Denmark, Germany, and the United States. Ind. Mark. Manag. 2016, 53, 136–159. [Google Scholar] [CrossRef]
- Matarazzo, B.; Teghem, J.O.R. for innovation and quality of life. Eur. J. Oper. Res. 2002, 139, 191–192. [Google Scholar] [CrossRef]
- Zapata-Cantu, L.; González, F. Challenges for Innovation and Sustainable Development in Latin America: The Significance of Institutions and Human Capital. Sustainability 2021, 13, 4077. [Google Scholar] [CrossRef]
- Krishna, V.V. Universities in the National Innovation Systems: Emerging Innovation Landscapes in Asia-Pacific. J. Open Innov. Technol. Mark. Complex. 2019, 5, 43. [Google Scholar] [CrossRef]
- Pradhan, R.P.; Arvin, M.B.; Bahmani, S.; Bennett, S.E. The innovation-growth link in OECD countries: Could other macroeconomic variables matter? Technol. Soc. 2017, 51, 113–123. [Google Scholar] [CrossRef]
- Freeman, C. Continental, national and sub-national innovation systems—Complementarity and economic growth. Res. Policy 2002, 31, 191–211. [Google Scholar] [CrossRef]
- Lundvall, B.-Å. National Innovation Systems: Toward a Theory of Innovation and Interactive Learning; Pinter: London, UK, 1992. [Google Scholar]
- Wang, Z.; He, Q.; Maas, G. Capacities of business incubator and regional innovation performance. Technol. Forecast. Soc. Chang. 2020, 158, 120125. [Google Scholar] [CrossRef]
- Roman, M.; Varga, H.; Cvijanovic, V.; Reid, A. Quadruple Helix Models for Sustainable Regional Innovation: Engaging and Facilitating Civil Society Participation. Economies 2020, 8, 48. [Google Scholar] [CrossRef]
- Batabyal, A.A.; Yoo, S.J. Schumpeterian creative class competition, innovation policy, and regional economic growth. Int. Rev. Econ. Financ. 2018, 55, 86–97. [Google Scholar] [CrossRef]
- Terapetritis, D.G. Discussing the Role of Universities in Fostering Regional Entrepreneurial Ecosystems. Economies 2019, 7, 119. [Google Scholar] [CrossRef]
- Spanellis, A.; MacBryde, J.; Dӧrfler, V. A dynamic model of knowledge management in innovative technology companies: A case from the energy sector. Eur. J. Oper. Res. 2020, 292, 784–797. [Google Scholar] [CrossRef]
- Hernández-Perlines, P.; Ariza-Montes, A.; Law, R. Innovative capacity, quality certification and performance in the hotel sector. Int. J. Hosp. Manag. 2019, 82, 220–230. [Google Scholar] [CrossRef]
- Gupta, A.K. Innovation dimensions and firm performance synergy in the emerging market: A perspective from Dynamic Capability Theory & Signalling Theory. Technol. Soc. 2021, 64, 101512. [Google Scholar] [CrossRef]
- Sharmelly, R.; Ray, P.K. Managing resource-constrained innovation in emerging markets: Perspectives from a business model. Technol. Soc. 2021, 65, 101538. [Google Scholar] [CrossRef]
- Wang, Y.; Pan, J.; Pei, R.; Yi, B.-W.; Yang, G. Assessing the technological innovation efficiency of China’s high-tech industries with a two-stage network DEA approach. Socio-Econ. Plan. Sci. 2020, 71, 100810. [Google Scholar] [CrossRef]
- Alarcón, J.C.; Aguilar, R.; Galán, J.G. Determinants of innovation output in Spanish knowledge-intensive service companies: Stability analysis throughout the economic crisis of 2008. Struct. Chang. Econ. Dyn. 2019, 49, 228–244. [Google Scholar] [CrossRef]
- Divisekera, S.; Nguyen, V.K. Determinants of innovation in tourism evidence from Australia. Tour. Manag. 2018, 67, 157–167. [Google Scholar] [CrossRef]
- Shvetsova, O.A.; Lee, S.-K. Living Labs in University-Industry Cooperation as a Part of Innovation Ecosystem: Case Study of South Korea. Sustainability 2021, 13, 5793. [Google Scholar] [CrossRef]
- Meidute-Kavaliauskiene, I.; Çiğdem, Ş.; Vasilis Vasiliauskas, A.; Yıldız, B. Green Innovation in Environmental Complexity: The Implication of Open Innovation. J. Open Innov. Technol. Mark. Complex. 2021, 7, 107. [Google Scholar] [CrossRef]
- Robbins, P.; O’Gorman, C.; Huff, A.; Moeslein, K. Multidexterity—A New Metaphor for Open Innovation. J. Open Innov. Technol. Mark. Complex. 2021, 7, 99. [Google Scholar] [CrossRef]
- Chi, N.T.K. Innovation capability: The impact of e-CRM and COVID-19 risk perception. Technol. Soc. 2021, 67, 101725. [Google Scholar] [CrossRef]
- Llopis, O.; D’Este, P.; Díaz-Faes, A.A. Connecting others: Does a tertius iungens orientation shape the relationship between research networks and innovation? Res. Policy 2020, 50, 104175. [Google Scholar] [CrossRef]
- Machokoto, M.; Areneke, G. Does innovation and financial constraints affect the propensity to save in emerging markets? Res. Int. Bus. Financ. 2020, 52, 101185. [Google Scholar] [CrossRef]
- da Silva, R.B.; Klotzle, M.C.; Figueiredo, A.C.; da Motta, L.F.J. Innovative intensity and its impact on the performance of firms in Brazil. Res. Int. Bus. Financ. 2015, 34, 1–16. [Google Scholar] [CrossRef]
- Weinreich, S.; Şahin, T.; Karig, M.; Vietor, T. Methodology for Managing Disruptive Innovation by Value-Oriented Portfolio Planning. J. Open Innov. Technol. Mark. Complex. 2022, 8, 48. [Google Scholar] [CrossRef]
- Regona, M.; Yigitcanlar, T.; Xia, B.; Li, R.Y.M. Opportunities and Adoption Challenges of AI in the Construction Industry: A PRISMA Review. J. Open Innov. Technol. Mark. Complex. 2022, 8, 45. [Google Scholar] [CrossRef]
- Mousa, M.; Nosratabadi, S.; Sagi, J.; Mosavi, A. The Effect of Marketing Investment on Firm Value and Systematic Risk. J. Open Innov. Technol. Mark. Complex. 2021, 7, 64. [Google Scholar] [CrossRef]
- Shahzad, M.F.; Khan, K.I.; Saleem, S.; Rashid, T. What Factors Affect the Entrepreneurial Intention to Start-Ups? The Role of Entrepreneurial Skills, Propensity to Take Risks, and Innovativeness in Open Business Models. J. Open Innov. Technol. Mark. Complex. 2021, 7, 173. [Google Scholar] [CrossRef]
- Mathew, A.O.; Jha, A.N.; Lingappa, A.K.; Sinha, P. Attitude towards Drone Food Delivery Services—Role of Innovativeness, Perceived Risk, and Green Image. J. Open Innov. Technol. Mark. Complex. 2021, 7, 144. [Google Scholar] [CrossRef]
- He, Y.; Ding, X.; Yang, C. Do environmental regulations and financial constraints stimulate corporate technological innovation? Evidence from China. J. Asian Econ. 2021, 72, 101265. [Google Scholar] [CrossRef]
- Ntsondé, J.; Aggeri, F. Stimulating innovation and creating new markets—The potential of circular public procurement. J. Clean. Prod. 2021, 308, 127303. [Google Scholar] [CrossRef]
- Hellström, T. Systemic innovation and risk: Technology assessment and the challenge of responsible innovation. Technol. Soc. 2021, 25, 369–384. [Google Scholar] [CrossRef]
- Demirel, P.; Kesidou, E. Stimulating innovation by user feedback on social media: The case of an online user innovation community. Technol. Forecast. Soc. Chang. 2019, 144, 295–302. [Google Scholar] [CrossRef]
- Tahirsylaj, A.S. Stimulating creativity and innovation through Intelligent Fast Failure. Think. Ski. Creat. 2012, 7, 265–270. [Google Scholar] [CrossRef]
- Szopik-Depczyńska, K.; Cheba, K.; Wiśniewska, J. Innovation, R&D and User-driven Innovation Activity in R&D Departments in Poland. The Multi-Criteria Analysis. Procedia Comput. Sci. 2020, 176, 2705–2713. [Google Scholar] [CrossRef]
- Miłek, D. Ocena innowacyjności polskiej gospodarki na tle krajów Unii Europejskiej. Nierówności Społeczne A Wzrost Gospod. 2019, 59, 61–82. [Google Scholar] [CrossRef]
- Lis, A.M.; Romanowska, E. Evaluation of Selected Innovation Policy Instruments on the Example of Poland. Procedia Soc. Behav. Sci. 2015, 213, 1028–1033. [Google Scholar] [CrossRef]
- Gajdzik, B.; Wolniak, R. Transitioning of Steel Producers to the Steelworks 4.0—Literature Review with Case Studies. Energies 2021, 14, 4109. [Google Scholar] [CrossRef]
- OECD; Eurostat. Oslo Manual 2018: Guidelines for Collecting, Reporting and Using Data on Innovation, 4th ed.; The Measurement of Scientific, Technological and Innovation Activities; OECD Publishing: Paris, France; Eurostat: Luxembourg, 2018. [Google Scholar] [CrossRef]
- Louçã, F. The elusive concept of innovation for Schumpeter, Marschak and the early econometricians. Res. Policy 2014, 43, 1442–1449. [Google Scholar] [CrossRef]
- Kurz, H.D. Innovations and profits: Schumpeter and the classical heritage. J. Econ. Behav. Organ. 2008, 67, 263–278. [Google Scholar] [CrossRef]
- Drejer, I. Identifying innovation in surveys of services: A Schumpeterian perspective. Res. Policy 2004, 33, 551–562. [Google Scholar] [CrossRef]
- Schumpeter, J. Teoria Rozwoju Gospodarczego; Wydawnictwo Naukowe PWN: Warszawa, Polska, 1960. [Google Scholar]
- Radomska, E. Innowacyjność jako wyzwanie rozwojowe—Uwarunkowania działalności innowacyjnej przedsiębiorstw. KNUV 2015, 4, 63–85. [Google Scholar]
- Blichfeldt, H.; Faullant, R. Performance effects of digital technology adoption and product & service innovation—A process-industry perspective. Technovation 2021, 105, 102275. [Google Scholar] [CrossRef]
- Zieliński, M.; Jonek-Kowalska, I. Does CSR affect the profitability and valuation of energy companies? An example from Poland. Energies 2021, 14, 3668. [Google Scholar] [CrossRef]
- Bradley, P. An Institutional Economics Framework to Explore Sustainable Production and Consumption. Sustain. Prod. Consum. 2021, 27, 1317–1339. [Google Scholar] [CrossRef]
- Ding, Q.; Khattak, S.I.; Ahmad, M. Towards sustainable production and consumption: Assessing the impact of energy productivity and eco-innovation on consumption-based carbon dioxide emissions (CCO2) in G-7 nations. Sustain. Prod. Consum. 2021, 27, 254–268. [Google Scholar] [CrossRef]
- Sumrin, S.; Gupta, S.; Asaad, Y.; Wang, Y.; Bhattacharya, S.; Foroudi, P. Eco-innovation for environment and waste prevention. J. Bus. Res. 2020, 122, 627–639. [Google Scholar] [CrossRef]
- Park, C.; Tantiyaswasdikul, K.; Evans, S.; Lertwattanaruk, P. Innovation catalysts for industrial waste challenges: Sri Lankan and Thai cases. Procedia Manuf. 2019, 33, 570–577. [Google Scholar] [CrossRef]
- Valdez-Juárez, L.E.; Castillo-Vergara, M. Technological Capabilities, Open Innovation, and Eco-Innovation: Dynamic Capabilities to Increase Corporate Performance of SMEs. J. Open Innov. Technol. Mark. Complex. 2021, 7, 8. [Google Scholar] [CrossRef]
- Pichlak, M.; Szromek, A.R. Eco-Innovation, Sustainability and Business Model Innovation by Open Innovation Dynamics. J. Open Innov. Technol. Mark. Complex. 2021, 7, 149. [Google Scholar] [CrossRef]
- Kordel, P.; Wolniak, R. Technology Entrepreneurship and the Performance of Enterprises in the Conditions of COVID-19 Pandemic: The Fuzzy Set Analysis of Waste to Energy Enterprises in Poland. Energies 2021, 14, 3891. [Google Scholar] [CrossRef]
- Chappin, M.M.H.; Oever, M.V.V.D.; Negro, S.O. An overview of factors for the adoption of energy efficient eco-innovation: The cases of the Dutch brewing and paper industry. J. Clean. Prod. 2020, 275, 124122. [Google Scholar] [CrossRef]
- De Giovanni, P.; Cariola, A. Process innovation through industry 4.0 technologies, lean practices and green supply chains. Res. Transp. Econ. 2020, 90, 100869. [Google Scholar] [CrossRef]
- Cai, X.; Zhu, B.; Xie, M. Can direct environmental regulation promote green technology innovation in heavily polluting industries? Evidence from Chinese listed companies. Sci. Total Environ. 2020, 746, 140810. [Google Scholar] [CrossRef] [PubMed]
- Baran, J.; Janik, A.; Ryszko, A.; Szafraniec, M. Eco-innovation in the V4 countries—Performance, drivers, barriers and progress towards circular economy. In Proceedings of the 29-th International Business Information Management Association Conference—Education Excellence and Innovation Management through Vision 2020: From Regional Development Sustainability to Global Economic Growth, Vienna, Austria, 3–4 May 2017; pp. 3258–3275. [Google Scholar]
- Karwot, J.; Ober, J. Safety management of water economy. Case study of the water and sewerage company. Manag. Syst. Prod. Eng. 2019, 27, 189–196. [Google Scholar] [CrossRef]
- Segarra-Oña, M.; Peiró-Signes, A.; Verma, R. Fostering innovation through stakeholders’ engagement at the healthcare industry: Tapping the right key. Health Policy 2020, 124, 895–901. [Google Scholar] [CrossRef] [PubMed]
- Saheb, T.; Izadi, L. Paradigm of IoT big data analytics in the healthcare industry: A review of scientific literature and mapping of research trends. Telemat. Inform. 2019, 41, 70–85. [Google Scholar] [CrossRef]
- Agarwal, N.; Brem, A.; Grottke, M. Towards a higher socio-economic impact through shared understanding of product requirements in emerging markets: The case of the Indian healthcare innovations. Technol. Forecast. Soc. Chang. 2018, 135, 91–98. [Google Scholar] [CrossRef]
- Vrontis, D.; Morea, D.; Basile, G.; Bonacci, I.; Mazzitelli, A. Consequences of technology and social innovation on traditional business model. Technol. Forecast. Soc. Chang. 2021, 170, 120877. [Google Scholar] [CrossRef]
- Cabral, B.P.; Lage de Sousa, F.; Canêdo-Pinheiro, M. Assessing the impacts of innovation barriers: A qualitative analysis of Brazil’s natural resources industry. Resour. Policy 2020, 68, 101736. [Google Scholar] [CrossRef]
- Wang, L.; Luo, G.; Sari, A.; Shao, X.-H. What nurtures fourth industrial revolution? An investigation of economic and social determinants of technological innovation in advanced economies. Technol. Forecast. Soc. Chang. 2020, 61, 120305. [Google Scholar] [CrossRef]
- Štěrbová, M.; Stojanovski, V.; Šálka, J. Innovating in a traditional sector: Innovation in forest harvesting in Slovakia and Macedonia. For. Policy Econ. 2019, 106, 101960. [Google Scholar] [CrossRef]
- Skoczkowski, T.; Verdolini, E.; Bielecki, S.; Kochański, M.; Korczak, K.; Węglarz, A. Technology innovation system analysis of decarbonisation options in the EU steel industry. Energy 2020, 212, 118688. [Google Scholar] [CrossRef] [PubMed]
- Mahdavimazdeh, H.; Saunders, C.; Dewald, K. Reconsidering the dynamics of innovation in the natural resource industries. Resour. Policy 2021, 72, 1020044. [Google Scholar] [CrossRef]
- Lu, N.; Wu, J.; Liu, Z. How Does Green Finance Reform Affect Enterprise Green Technology Innovation? Evidence from China. Sustainability 2022, 14, 9865. [Google Scholar] [CrossRef]
- Du, M.; Zhang, R.; Chai, S.; Li, Q.; Sun, R.; Chu, W. Can Green Finance Policies Stimulate Technological Innovation and Financial Performance? Evidence from Chinese Listed Green Enterprises. Sustainability 2022, 14, 9287. [Google Scholar] [CrossRef]
- O’Connell, V.; AbuGhazaleh, N.; Tahat, Y.; Whelan, G. The Impact of R&D Innovation Success on the Relationship between R&D Investment and Financial Leverage. J. Open Innov. Technol. Mark. Complex. 2022, 8, 129. [Google Scholar] [CrossRef]
- Javeed, S.A.; Teh, B.H.; Ong, T.S.; Chong, L.L.; Abd Rahim, M.F.B.; Latief, R. How Does Green Innovation Strategy Influence Corporate Financing? Corporate Social Responsibility and Gender Diversity Play a Moderating Role. Int. J. Environ. Res. Public Health 2022, 19, 8724. [Google Scholar] [CrossRef]
- Hu, Y.; Dai, X.; Zhao, L. Digital Finance, Environmental Regulation, and Green Technology Innovation: An Empirical Study of 278 Cities in China. Sustainability 2022, 14, 8652. [Google Scholar] [CrossRef]
- Zembura, W. Finansowanie innowacji. Studia Ekonomiczne. Zesz. Nauk. Uniw. Ekon. W Katowicach 2016, 305, 109–125. [Google Scholar]
- Rozwój Systemu Finansowego W Polsce W 2020 R. Available online: https://www.nbp.pl/systemfinansowy/rozwoj2020.pdf (accessed on 20 August 2022).
- Knight, F. Risk, Uncertainty and Profit; Hart, Schaffner and Marx: Boston, MA, USA, 1921. [Google Scholar]
- Deptuła, A.M. Analysis of Criteria Used in the Risk Assessment of Technical Innovations. Procedia Eng. 2017, 182, 135–142. [Google Scholar] [CrossRef]
- Klinke, A. Public understanding of risk and risk governance. J. Risk Res. 2021, 24, 2–13. [Google Scholar] [CrossRef]
- Sarin, S.; Sego, T.; Chanvarasuth, N. Strategic Use of Bundling for Reducing Consumers’ Perceived Risk Associated with the Purchase of New High-Tech Products. J. Mark. Theory Pract. 2003, 11, 71–83. [Google Scholar] [CrossRef]
- Jarus, T. Nie Ma Ryzyka, Nie Ma Innowacji. Available online: http://www.pi.gov.pl/parp/chapter_86196.asp?soid=A805BEAED1F24A8890FCF66E4AE57D13 (accessed on 15 June 2015).
- Keizer, J.A.; Halman, J.I.M. Diagnosing risk in radical innovation projects. Res. Technol. Manag. 2007, 50, 30–36. [Google Scholar] [CrossRef]
- Roper, S.; Tapinos, E. Taking risks in the face of uncertainty: An exploratory analysis of green innovation. Technol. Forecast. Soc. Chang. 2016, 112, 357–363. [Google Scholar] [CrossRef]
- Green, S.G.; Gavin, M.B.; Aiman-Smith, L. Assessing a multidimensional measure of radical technological innovation. IEEE Trans. Eng. Manag. 1995, 42, 203–214. [Google Scholar] [CrossRef]
- Heidenreich, S.; Spieth, P.; Petschnig, M. Ready, Steady, Green: Examining the Effectiveness of External Policies to Enhance the Adoption of Eco-Friendly Innovations. J. Prod. Innov. Manag. 2017, 34, 343–359. [Google Scholar] [CrossRef]
- Knut, F.L.; Simlai, P. The value premium, aggregate risk innovations, and average stock returns. Financ. Res. Lett. 2014, 11, 303–317. [Google Scholar] [CrossRef]
- Schultz, C.; Salomo, S.; Talke, K. Measuring new product portfolio innovativeness: How differences in scale width and evaluator perspectives affect its relationship with performance. J. Prod. Innov. Manag. 2013, 30, 93–109. [Google Scholar] [CrossRef]
- Phillips, F. Interconnections: A Systems History of Science, Technology, Leisure, and Fear. J. Open Innov. Technol. Mark. Complex. 2021, 7, 14. [Google Scholar] [CrossRef]
- Oudgou, M. Financial and Non-Financial Obstacles to Innovation: Empirical Evidence at the Firm Level in the MENA Region. J. Open Innov. Technol. Mark. Complex. 2021, 7, 28. [Google Scholar] [CrossRef]
- Eniola, A.A. The Entrepreneur Motivation and Financing Sources. J. Open Innov. Technol. Mark. Complex. 2021, 7, 25. [Google Scholar] [CrossRef]
- Tereshko, E.; Romanovich, M.; Rudskaya, I. Readiness of Regions for Digitalization of the Construction Complex. J. Open Innov. Technol. Mark. Complex. 2021, 7, 2. [Google Scholar] [CrossRef]
- Muhammad, F.; Ikram, A.; Jafri, S.K.; Naveed, K. Product Innovations through Ambidextrous Organizational Culture with Mediating Effect of Contextual Ambidexterity: An Empirical Study of IT and Telecom Firms. J. Open Innov. Technol. Mark. Complex. 2021, 7, 9. [Google Scholar] [CrossRef]
- Todd, M. Recession as the mother of innovation. Solid State Technol. 2010, 53, 22–26. [Google Scholar]
- Souitaris, V. Strategic influences of technological innovation in Greece. Br. J. Manag. 2001, 12, 131–147. [Google Scholar] [CrossRef]
- Hang, C.C.; Chen, J.; Subramian, A.M. Developing disruptive products for emerging economies: Lessons from Asian cases. Res. Technol. Manag. 2010, 53, 21–26. [Google Scholar] [CrossRef]
- Anthony, S.D.; Johnson, M.W.; Sinfiled, J.V.; Altman, E.J. The Innovators Guide to Growth—Putting Disruptive Innovation to Work; Harvard Business Press: Boston, MA, USA, 2008. [Google Scholar]
- Shandilya, N.; Marcoulaki, E.; Fransman, W. Perspective on a risk-based roadmap towards the implementation of the safe innovation approach for industry. Nano Impact 2020, 20, 100258. [Google Scholar] [CrossRef]
- Torugsa, N.A.; Arundel, A. Rethinking the effect of risk aversion on the benefits of service innovations in public administration agencies. Res. Policy 2017, 46, 900–910. [Google Scholar] [CrossRef]
- Wu, J.; Wu, Z. Integrated risk management and product innovation in China: The moderating role of board of directors. Technovation 2014, 34, 466–476. [Google Scholar] [CrossRef]
- Zaman, R.; Atawnah, N.; Irfan, S. Does corporate eco-innovation affect stock price crash risk? Br. Account. Rev. 2021, 53, 101031. [Google Scholar] [CrossRef]
- Zhou, B.; Li, Y.; Zhou, Z. Executive compensation incentives, risk level and corporate innovation. Emerg. Mark. Rev. 2021, 47, 100798. [Google Scholar] [CrossRef]
- García-Granero, A.; Llopis, Ó.; Alegre, J. Unravelling the link between managerial risk-taking and innovation: The mediating role of a risk-taking climate. J. Bus. Res. 2015, 68, 1094–1104. [Google Scholar] [CrossRef]
- Hock-Doepgen, M.; Clauss, T.; Cheng, C.-F. Knowledge management capabilities and organizational risk-taking for business model innovation in SMEs. J. Bus. Res. 2021, 130, 683–697. [Google Scholar] [CrossRef]
- Howell, A. ‘Indigenous’ innovation with heterogeneous risk and new firm survival in a transitioning Chinese economy. Res. Policy 2015, 44, 1866–1876. [Google Scholar] [CrossRef]
- Reguera-Alvarado, N.; Bravo, F. The impact of directors’ high-tech experience on innovation in low-tech firms. Innovation 2018, 20, 223–239. [Google Scholar] [CrossRef]
- Huang, P.; Yao, C. Key success factors in high-tech industry promoting knowledge management. J. Interdiscip. Math. 2018, 21, 509–517. [Google Scholar] [CrossRef]
- Bi, K.; Huang, P.; Ye, H. Risk identification, evaluation and response of low-carbon technological innovation under the global value chain: A case of the Chinese manufacturing industry. Technol. Forecast. Soc. Chang. 2015, 100, 238–248. [Google Scholar] [CrossRef]
- Drozdowski, G. Economic Calculus Qua an Instrument to Support Sustainable Development under Increasing Risk. J. Risk Financ. Manag. 2021, 14, 15. [Google Scholar] [CrossRef]
- Quiroga, M.C.; Martin, D.P. Technology foresight in traditional Bolivian sectors: Innovation traps and temporal unfit between ecosystems and institutions. Technol. Forecast. Soc. Chang. 2017, 119, 280–293. [Google Scholar] [CrossRef]
- Tafti, S.F.; Jahani, M.; Akbari, S. Explaining Evolutionary Trend of Strategic Planning from Traditional Economy to Innovation Economy. Procedia Soc. Behav. Sci. 2012, 58, 56–65. [Google Scholar] [CrossRef]
- Lee, S.; Nam, Y.; Son, H. Determinants of ICT innovations: A cross-country empirical study. Technol. Forecast. Soc. Chang. 2016, 110, 71–77. [Google Scholar] [CrossRef]
- Lee, C.; Kim, H.J.; Lee, D. Intra-industry innovation, spill overs, and industry evolution: Evidence from the Korean ICT industry. Telemat. Inform. 2017, 34, 1503–1513. [Google Scholar] [CrossRef]
- Faleye, O.; Kovacs, T.; Venkateswaran, A. Do better-connected CEOs innovate more. J. Financ. Quant. Anal. 2014, 49, 1201–1225. [Google Scholar] [CrossRef] [Green Version]
- Bernstein, S. Does going public affect innovation? J. Financ. 2015, 4, 1365–1403. [Google Scholar] [CrossRef]
- Hult, G.T.M.; Hurley, R.F.; Knight, G.A. Innovativeness: Its antecedents and impact on business performance. Ind. Mark. Manag. 2004, 33, 429–437. [Google Scholar] [CrossRef]
- Yunis, M.; Tarhini, A.; Kassar, A. The role of ICT and innovation in enhancing organizational performance: The catalysing effect of corporate entrepreneurship. J. Bus. Res. 2018, 88, 344–356. [Google Scholar] [CrossRef]
- Jin, Z.; Hewitt-Dundas, N.; Thompson, N.J. Innovativeness and performance: Evidence from manufacturing sectors. J. Strateg. Mark. 2004, 12, 255–264. [Google Scholar] [CrossRef]
- Calantone, R.J.; Harmancioglu, N.; Droge, C. Inconclusive innovation “returns”: A meta-analysis of research on innovation in new product development. J. Prod. Innov. Manag. 2010, 27, 1065–1081. [Google Scholar] [CrossRef]


| Sector | Enterprise |
|---|---|
| Traditional enterprises | |
| CHEMISTRY AND COMMODITIES | BOGDANKA; CIECH; COGNOR; GRUPA AZOTY; JSW; KĘTY; KGHM; STALPRODUKT |
| FUEL AND ENERGY | ENEA; KOGENERACJA; LOTOS; PEP; PGE; PGNIG; PKN ORLEN; TAURON |
| INDUSTRIAL AND CONSTRUCTION PRODUCTION | APATOR; BUDIMEX; ERBUD; FAMUR; INSTAL; MANGATA; MIRBUD; POLIMEX MS; TRAKCJA; WIELTON |
| TRADE AND SERVICES | AB; ASBIS; CCC; EUROCASH; INTERCARS; LPP; VRG |
| High-tech enterprises | |
| HEALTHCARE | BIOMED LUBLIN; BIOTON; CORMAY; MABION; MEDICALGORITMICS; RYVU; VOXEL |
| IT and ICT | ASSECO POLAND; ASSECO SEE; CD PROJEKT; CI GAMES; COMARCH; COMP; CYFROWY POLSAT; NETIA; OPONEO.PL; ORANGE.PL; PGS SOFTWARE (Wrocław, Poland) |
| Assessed Area | General Conclusions | Detailed Conclusions |
|---|---|---|
| Result on sales | Variation and higher risk in HIGH-TECH | Highest risk in HIGH-TECH: healthcare Highest risk in TRAD: chemistry and commodities |
| Sales revenues | Variation and higher risk in HIGH-TECH | Highest risk in HIGH-TECH: healthcare Highest risk in TRAD: industrial and construction production |
| Operation costs | Variation and higher risk in HIGH-TECH | Highest risk in HIGH-TECH: healthcare Highest risk in TRAD: fuel and energy; industrial and construction production |
| Cost level ratio | Variation and higher risk in HIGH-TECH | Highest risk in HIGH-TECH: healthcare Highest risk in TRAD: chemistry and commodities |
| Assets | Variation and higher risk in HIGH-TECH | Highest risk in HIGH-TECH: healthcare Highest risk in TRAD: trade and services |
| Asset productivity | Variation and higher risk in HIGH-TECH | Highest risk in HIGH-TECH: healthcare Highest risk in TRAD: industrial and construction production |
| Costs per unit of assets | Variation and higher risk in HIGH-TECH | Highest risk in HIGH-TECH: healthcare Highest risk in TRAD: industrial and construction production |
| Return on assets | Variation and higher risk in HIGH-TECH | Highest risk in HIGH-TECH: healthcare Highest risk in TRAD: chemistry and commodities |
Publisher’s Note: MDPI stays neutral with regard to jurisdictional claims in published maps and institutional affiliations. |
© 2022 by the authors. Licensee MDPI, Basel, Switzerland. This article is an open access article distributed under the terms and conditions of the Creative Commons Attribution (CC BY) license (https://creativecommons.org/licenses/by/4.0/).
Share and Cite
Nawrocki, T.L.; Jonek-Kowalska, I. Is Innovation a Risky Business? A Comparative Analysis in High-Tech and Traditional Industries in Poland. J. Open Innov. Technol. Mark. Complex. 2022, 8, 155. https://doi.org/10.3390/joitmc8030155
Nawrocki TL, Jonek-Kowalska I. Is Innovation a Risky Business? A Comparative Analysis in High-Tech and Traditional Industries in Poland. Journal of Open Innovation: Technology, Market, and Complexity. 2022; 8(3):155. https://doi.org/10.3390/joitmc8030155
Chicago/Turabian StyleNawrocki, Tomasz L., and Izabela Jonek-Kowalska. 2022. "Is Innovation a Risky Business? A Comparative Analysis in High-Tech and Traditional Industries in Poland" Journal of Open Innovation: Technology, Market, and Complexity 8, no. 3: 155. https://doi.org/10.3390/joitmc8030155
APA StyleNawrocki, T. L., & Jonek-Kowalska, I. (2022). Is Innovation a Risky Business? A Comparative Analysis in High-Tech and Traditional Industries in Poland. Journal of Open Innovation: Technology, Market, and Complexity, 8(3), 155. https://doi.org/10.3390/joitmc8030155