How Efficient Is the Implementation of Structural Funds Committed to Enhancing ICT Adoption in SMEs?


Abstract
:1. Introduction
- Financial: large spending required and difficulties in obtaining credit;
- Infrastructure: electricity costs, broadband, and consistent Internet connectivity;
- Organizational: a shortage of trained personnel;
- Technical: technological growth without proper preparation.
2. Literature Review
3. Methodology
3.1. The Weighted Russell Directional Distance Model
3.2. Robustness Assessment
3.3. Stochastic Frontier Analysis
4. Data and Assumptions
4.1. Input and Output Factors
4.1.1. The Rate of OPs’ Execution
4.1.2. Operations Supported
4.2. Environmental Factors
5. Analysis and Discussion of Results
5.1. Robustness Analysis
5.2. Analysis of SFA Regression Results
5.3. Efficiency after Input and Output Adjustments
6. Conclusions and Policy Implications
Author Contributions
Funding
Institutional Review Board Statement
Informed Consent Statement
Data Availability Statement
Acknowledgments
Conflicts of Interest
Appendix A

| Title in English | Date of Publication | Authors | Methods a | ||||||||||
|---|---|---|---|---|---|---|---|---|---|---|---|---|---|
| DR | LR | MD/DA | I | FG/FW | S | CS | B | E | SM | O | |||
| Ex-ante evaluation of financial instruments in Bourgogne-Franche-Comté, 2021–2027 | January 2021 | Francie Sadeski, Mathieu Boulestreau (francie.sadeski@technopolis-group.com) (accessed on 15 July 2022) | x | x | x | ||||||||
| Evaluation of the implementation of the Bourgogne and Franche-Comté OPs, 2014–2020 | July 2017 | Téritéo Aster Europe Dictys conseil (contact@teriteo.fr) (accessed on 15 July 2022) | x | x | x | x | |||||||
| Contribution to the Europe 2020 objectives of the ERDF and ESF Abruzzo OPs, 2014–2020 | February 2020 | Irs—Nomisma (www.irsonline.it—www.nomisma.it) (accessed on 15 July 2022) | x | x | |||||||||
| Annual evaluation of the Abruzzo ERDF OP 2014–2020 (2019) | July 2019 | IRS—Nomisma (IRS, www.irsonline.it—Nomisma, www.nomisma.it) (accessed on 15 July 2022) | x | x | |||||||||
| Evaluation of progress in implementing the EU Structural Funds Investments OP, 2014–2020 | December 2016 | PPMI Group (PPMI Group, GedimiNo av. 50, LT—01110 Vilnius, Lithuania, Tel.: +370-5-2620338, info@ppmi.lt, www.vpvi.lt/en) (accessed on 15 July 2022) | x | x | |||||||||
| Evaluation of financial instruments in Lithuania in 2014–2020 in both ERDF and ESF programmes | November 2017 | UAB “VG Consult” (accessed on 15 July 2022) | x | x | x | ||||||||
| The impact of ESI Funds in 2014–2020 and the priorities for 2021–2027 | June 2017 | ESTEP Vilnius (Adress: Olimpiečių g. 1A-26, LT-09200 Vilnius; Phone number: 85269-0120; Fax: 85269-0124) (accessed on 15 July 2022) | x | x | x | x | x | ||||||
| Mid-term Evaluation of the Structural Funds Investment OP, 2014–2020 | March 2019 | ESTEP (Olimpiečių g. 1A-26, LT-09200 Vilnius, Tel.: +852690120, info@estep.lt, www.estep.lt) (accessed on 15 July 2022) | x | x | x | x | x | ||||||
| Evaluation of financing of Lithuanian economic sectors: post 2020 | June 2019 | ESTEP & PricewaterhouseCoopers (ESTEP Vilnius, Tel: +85269-0120, info@estep.lt, www.estep.lt -UAB PricewaterhouseCoopers, Tel.: +370-(5)-239-2300, vilnius@lt.pwc.com, www.pwc.com) (accessed on 15 July 2022) | x | x | x | x | x | x | |||||
| Evaluation of measures to reduce the digital divide under the Toscana ERDF OP, 2014–2020–2019 | July 2019 | Ecoter—Resco (http://www.ecoter.it/attivita.html—http://www.resco-ricerche.it/) (accessed on 15 July 2022) | x | x | x | ||||||||
| Analysis of the market situation and suitable forms of support for the preparation of PA5 of the Technology and Applications for Competitiveness OP 2021–2027 | September 2020 | Association for European Funds (Association for European Funds, Budějovická 2056/96, 140 00 Prague 4, http://apef.cz/) (accessed on 15 July 2022) | x | x | x | x | |||||||
| Analysis of the ICT Thematic Objective in 2014–2020 | December 2016 | Dirección General de Fondos Comunitarios (Directorate-General for Community Funds Programming and Evaluation GS) | x | x | |||||||||
| Follow-up monitoring evaluation of ICT support under the ERDF OPs, 2014–2020 | January 2020 | Ministerio de Hacienda (www.hacienda.gob.es) (accessed on 15 July 2022) | x | x | |||||||||
| Evaluation of the Cantabria ERDF OP, 2017 | May 2017 | Cantabria Government (GobierNo de Cantabria, C/Peña Herbosa 29, 39003 Santander, Cantabria, Tel.: +942-207-100) (accessed on 15 July 2022) | x | x | x | x | x | ||||||
| Evaluation of the Alsace, Lorraine and Champagne-Ardenne ESF/ERDF OPs, 2014–2020 | June 2018 | Téritéo and Aster (sabourin@teriteo.fr) (accessed on 15 July 2022) | x | ||||||||||
| Evaluation of High Technology Network in Emilia Romagna, 2014–2020 | December 2019 | IRS- Nomisma (www.irsonline.it—Via Castiglione 4, 40124 Bologna—irsbo@irsonline.it; nomisma.it—Strada Maggiore, 44—40125 Bologna—info@nomisma.it) (accessed on 15 July 2022) | x | x | x | x | |||||||
| Evaluation of the Regional OP 2014–2020 technology transfer interventions | August 2019 | Fabrizio Tenna—Lattanzio Advisory Spa (www.lattanziokibs.com/ro) (accessed on 15 July 2022) | x | x | x | x | x | x | |||||
| Progress report on the Abruzzo ESF OP, 2014–2020 | December 2018 | IRS—NOMISMA (www.irsonline.it) | x | x | |||||||||
| Evaluation of Specific Objectives 3.5, 3.6 and 4.2 of the Enterprise and Innovation for Competitiveness OP, 2014–2020, in the Czech Republic | July 2019 | Daniel Mayer (Association for European Funds; www.apef.cz) (accessed on 15 July 2022) | x | x | x | ||||||||
| Annual evaluation report (2019) of the Toscana ESF OP, 2014–2020 | June 2020 | Ismeri Europa (www.ismerieuropa.com) (accessed on 15 July 2022) | x | x | |||||||||
| Evaluation report on implementation procedures and their digitalisation in the Bolzano ERDF OP, 2014–2020 | January 2020 | IRS—PTS clas (www.irsonline.it) (accessed on 15 July 2022) | x | x | x | x | |||||||
| Implementation of TO 11 and 2 in Italian OPs in 2014–2020 | May 2017 | Segreteria Tecnica comitato pilotaggio (accessed on 15 July 2022) | x | x | x | x | |||||||
| MS (2 Digit ISO) | Program Title | DMU | Output | Output | Input |
|---|---|---|---|---|---|
| Total Eligible Spending | Number of Operations | Total Eligible Costs Decided | |||
| ES | Andalucía—ERDF | 1 | 6,695,517 | 649 | 21,370,083 |
| FR | Aquitaine—ERDF/ESF/YEI | 2 | 13,534,588 | 99 | 17,402,571 |
| DE | Berlin—ERDF | 3 | 876,173 | 10 | 876,173 |
| FR | Bretagne—ERDF/ESF | 4 | 1,175,044 | 6 | 1,502,834 |
| ES | Castilla y León—ERDF | 5 | 3,356,883 | 66 | 3,478,014 |
| ES | Cataluña—ERDF | 6 | 3,233,273 | 3 | 7,401,115 |
| GR | Central Macedonia—ERDF/ESF | 7 | 3,860,885 | 410 | 4,538,729 |
| FR | Centre—ERDF/ESF/YEI | 8 | 1,763,215 | 14 | 3,540,598 |
| GR | Competitiveness Entrepreneurship and Innovation—GR—ERDF/ESF | 9 | 100,667,978 | 5457 | 275,856,182 |
| HU | Economic Development and Innovation Programme—HU—ERDF/ESF/YEI | 10 | 102,175,668 | 1271 | 202,847,237 |
| IT | Emilia-Romagna—ERDF | 11 | 9,781,930 | 725 | 30,248,825 |
| UK | England—ERDF | 12 | 41,078,593 | 18 | 74,764,788 |
| CZ | Enterprise and Innovation for Competitiveness—CZ—ERDF | 13 | 237,904,467 | 451 | 311,154,920 |
| GR | Epirus—ERDF/ESF | 14 | 4,593,855 | 144 | 4,593,855 |
| LT | EU Structural Funds Investments—LT—ERDF/ESF/CF/YEI | 15 | 7,607,793 | 210 | 7,786,656 |
| ES | Extremadura—ERDF | 16 | 1,560,112 | 810 | 4,823,735 |
| MT | Fostering a competitive and sustainable economy—MT—ERDF/CF | 17 | 182,337 | 1 | 5,000,000 |
| FR | Franche-Comté et Jura—ERDF/ESF | 18 | 5,982,231 | 6 | 8,210,556 |
| IT | Friuli-Venezia Giulia—ERDF | 19 | 248,601 | 1 | 671,429 |
| ES | Galicia—ERDF | 20 | 760,336 | 2 | 2,112,350 |
| LV | Growth and Employment—LV—ERDF/ESF/CF/YEI | 21 | 1,394,604 | 6 | 2,318,306 |
| FR | Haute-Normandie—ERDF/ESF/YEI | 22 | 243,167 | 2 | 373,794 |
| FR | Île-de-France et Seine—ESF/ERDF/YEI | 23 | 847,778 | 2 | 1,296,717 |
| BG | Innovations and Competitiveness—BG—ERDF | 24 | 33,942,154 | 228 | 38,612,352 |
| SK | Integrated Infrastructure—SK—ERDF/CF | 25 | 13,281,761 | 211 | 52,773,554 |
| IT | Lazio—ERDF | 26 | 1,906,215 | 733 | 16,669,118 |
| FR | Limousin—ERDF/ESF | 27 | 966,418 | 17 | 2,679,334 |
| PL | Lubelskie Voivodeship—ERDF/ESF | 28 | 21,893,553 | 85 | 41,255,981 |
| FR | Martinique—ERDF/ESF/YEI | 29 | 814,608 | 14 | 5,637,368 |
| PL | Mazowieckie Voivodeship—ERDF/ESF | 30 | 813,198 | 3 | 1,712,365 |
| ES | Melilla—ERDF | 31 | 68,486 | 2 | 1,170,261 |
| ES | Multi-regional Spain—ERDF | 32 | 58,864,158 | 5108 | 95,971,219 |
| ES | Murcia—ERDF | 33 | 1,963,414 | 155 | 3,167,696 |
| FR | Nord-Pas de Calais—ERDF/ESF/YEI | 34 | 340,394 | 2 | 3,281,904 |
| SE | North-Central Sweden—ERDF | 35 | 1,959,890 | 3 | 2,092,127 |
| PL | Opolskie Voivodeship—ERDF/ESF | 36 | 9,800,608 | 152 | 15,037,690 |
| ES | País Vasco—ERDF | 37 | 3,964,897 | 575 | 4,618,616 |
| FR | Picardie—ERDF/ESF/YEI | 38 | 311,847 | 6 | 1,632,728 |
| PL | Podkarpackie Voivodeship—ERDF/ESF | 39 | 10,827,667 | 120 | 11,479,570 |
| FR | Poitou-Charentes—ERDF/ESF | 40 | 3,238,795 | 22 | 5,495,141 |
| FR | Provence-Alpes-Côte d’Azur—ERDF/ESF/YEI | 41 | 329,249 | 1 | 251,294 |
| IT | Puglia—ERDF/ESF | 42 | 336,829 | 27 | 701,493 |
| FR | Rhône-Alpes—ERDF/ESF | 43 | 3,937,528 | 6 | 9,346,524 |
| DE | Sachsen—ERDF | 44 | 34,693,199 | 2184 | 51,464,402 |
| PL | Śląskie Voivodeship—ERDF/ESF | 45 | 20,359,931 | 218 | 27,139,088 |
| SE | Småland and islands—ERDF | 46 | 3,081,019 | 12 | 4,901,930 |
| SE | South Sweden—ERDF | 47 | 3,606,572 | 9 | 8,014,161 |
| FI | Sustainable growth and jobs—FI—ERDF/ESF | 48 | 21,515,886 | 394 | 29,109,235 |
| IT | Umbria—ERDF | 49 | 1,229,575 | 120 | 1,492,122 |
| SE | Upper Norrland—ERDF | 50 | 135,762 | 2 | 409,753 |
| PL | Warmińsko-Mazurskie Voivodeship—ERDF/ESF | 51 | 5,217,675 | 103 | 8,356,361 |
| Member State | Original | S1 (Eligible Spending) | S2 (Number of Operations) | GDP PPP PC | Population with Tertiary Education | Digital Skills | R&D Expenditures Business Sector | ICT Specialists | Product Process Innovators |
|---|---|---|---|---|---|---|---|---|---|
| ES | Andalucía—ERDF | 7,336,341.74 | 757.22 | 66.80 | 0.53 | 0.62 | 0.12 | 0.25 | 0.20 |
| FR | Aquitaine—ERDF/ESF/YEI | 0.00 | 708.41 | 88.41 | 0.62 | 0.52 | 0.29 | 0.23 | 0.62 |
| DE | Berlin—ERDF | 0.00 | 55.52 | 123.58 | 0.80 | 0.72 | 0.51 | 1.00 | 0.94 |
| FR | Bretagne—ERDF/ESF | 0.00 | 175.33 | 89.18 | 0.75 | 0.53 | 0.44 | 0.39 | 0.67 |
| ES | Castilla y León—ERDF | 0.00 | 134.21 | 84.83 | 0.79 | 0.62 | 0.31 | 0.23 | 0.27 |
| ES | Cataluña—ERDF | 0.00 | 119.80 | 106.87 | 0.86 | 0.67 | 0.34 | 0.46 | 0.36 |
| GR | Central Macedonia—ERDF/ESF | 37,508.77 | 154.50 | 52.20 | 0.64 | 0.35 | 0.15 | 0.19 | 1.00 |
| FR | Centre—ERDF/ESF/YEI | 0.00 | 524.67 | 86.81 | 0.55 | 0.50 | 0.42 | 0.18 | 0.65 |
| HU | Economic Development and Innovation Programme—HU—ERDF/ESF/YEI | 0.00 | 2710.43 | 70.78 | 0.20 | 0.36 | 0.44 | 0.43 | 0.33 |
| IT | Emilia-Romagna—ERDF | 7,762,830.87 | 1283.90 | 117.99 | 0.44 | 0.35 | 0.56 | 0.40 | 0.86 |
| UK | England—ERDF | 4,453,169.59 | 4090.02 | 102.49 | 0.69 | 0.93 | 0.46 | 0.65 | 0.53 |
| MT | Fostering a competitive and sustainable economy—MT—ERDF/CF | 1,488,592.08 | 817.31 | 98.76 | 0.50 | 0.66 | 0.13 | 0.66 | 0.64 |
| FR | Franche-Comté et Jura—ERDF/ESF | 0.00 | 759.80 | 83.83 | 0.57 | 0.49 | 0.47 | 0.18 | 0.59 |
| IT | Friuli-Venezia Giulia—ERDF | 193,744.84 | 74.33 | 104.10 | 0.40 | 0.34 | 0.32 | 0.41 | 0.67 |
| ES | Galicia—ERDF | 69,893.76 | 328.28 | 81.14 | 0.79 | 0.61 | 0.17 | 0.36 | 0.24 |
| LV | Growth and Employment—LV—ERDF/ESF/CF/YEI | 0.00 | 319.61 | 67.38 | 0.60 | 0.34 | 0.05 | 0.38 | 0.25 |
| FR | Haute-Normandie—ERDF/ESF/YEI | 119,057.98 | 20.67 | 86.40 | 0.47 | 0.48 | 0.37 | 0.16 | 0.54 |
| FR | Île-de-France et Seine—ESF/ERDF/YEI | 0.00 | 164.81 | 178.30 | 1.00 | 0.58 | 0.71 | 1.00 | 0.79 |
| SK | Integrated Infrastructure—SK—ERDF/CF | 18,424,203.78 | 2860.04 | 72.37 | 0.46 | 0.41 | 0.17 | 0.49 | 0.18 |
| IT | Lazio—ERDF | 11,366,082.33 | 0.00 | 112.36 | 0.44 | 0.34 | 0.23 | 0.99 | 0.79 |
| FR | Limousin—ERDF/ESF | 16,439.13 | 413.59 | 87.74 | 0.78 | 0.51 | 0.80 | 0.48 | 0.65 |
| PL | Lubelskie Voivodeship—ERDF/ESF | 2,571,361.29 | 2442.94 | 49.09 | 0.64 | 0.29 | 0.13 | 0.16 | 0.24 |
| FR | Martinique—ERDF/ESF/YEI | 1,257,031.70 | 834.37 | 73.52 | 0.37 | 0.43 | 0.02 | 0.21 | 0.51 |
| PL | Mazowieckie Voivodeship—ERDF/ESF | 0.00 | 249.19 | 60.81 | 0.57 | 0.31 | 0.13 | 0.05 | 0.25 |
| ES | Melilla—ERDF | 508,141.26 | 161.59 | 66.37 | 0.42 | 0.64 | 0.02 | 0.23 | 0.20 |
| ES | Murcia—ERDF | 0.00 | 293.41 | 74.59 | 0.52 | 0.64 | 0.17 | 0.13 | 0.24 |
| FR | Nord-Pas de Calais—ERDF/ESF/YEI | 804,669.95 | 535.20 | 83.54 | 0.66 | 0.52 | 0.24 | 0.32 | 0.64 |
| SE | North-Central Sweden—ERDF | 0.00 | 175.27 | 97.31 | 0.54 | 0.84 | 0.33 | 0.40 | 0.68 |
| PL | Opolskie Voivodeship—ERDF/ESF | 0.00 | 977.87 | 60.17 | 0.53 | 0.31 | 0.17 | 0.47 | 0.22 |
| FR | Picardie—ERDF/ESF/YEI | 389,272.52 | 239.42 | 83.54 | 0.66 | 0.52 | 0.24 | 0.32 | 0.64 |
| FR | Poitou-Charentes—ERDF/ESF | 0.00 | 707.91 | 88.41 | 0.62 | 0.52 | 0.29 | 0.23 | 0.62 |
| IT | Puglia—ERDF/ESF | 113,609.82 | 53.65 | 62.46 | 0.13 | 0.28 | 0.11 | 0.18 | 0.69 |
| FR | Rhône-Alpes—ERDF/ESF | 466,042.73 | 118.44 | 101.97 | 0.85 | 0.53 | 0.65 | 0.42 | 0.75 |
| DE | Sachsen—ERDF | 0.00 | 166.87 | 86.19 | 0.12 | 0.71 | 0.16 | 0.20 | 0.61 |
| PL | Śląskie Voivodeship—ERDF/ESF | 0.00 | 865.07 | 74.67 | 0.64 | 0.30 | 0.18 | 0.33 | 0.25 |
| SE | Småland and islands—ERDF | 0.00 | 670.80 | 104.24 | 0.59 | 0.90 | 0.50 | 0.43 | 0.89 |
| SE | South Sweden—ERDF | 0.00 | 947.83 | 105.49 | 0.82 | 0.85 | 0.72 | 0.80 | 0.98 |
| FI | Sustainable growth and jobs—FI—ERDF/ESF | 0.00 | 792.80 | 111.10 | 0.55 | 0.93 | 0.74 | 1.00 | 0.77 |
| IT | Umbria—ERDF | 132,621.38 | 44.08 | 85.03 | 0.38 | 0.33 | 0.18 | 0.41 | 0.69 |
| SE | Upper Norrland—ERDF | 236,142.84 | 27.04 | 114.95 | 0.61 | 0.88 | 0.18 | 0.49 | 0.80 |
| PL | Warmińsko-Mazurskie Voivodeship—ERDF/ESF | 0.00 | 745.82 | 50.55 | 0.36 | 0.31 | 0.09 | 0.16 | 0.18 |
References
- Alam, K.; Ali, M.A.; Erdiaw-Kwasie, M.; Shahiduzzaman, M.; Velayutham, E.; Murray, P.A.; Wiesner, R. Impact of ICTs on Innovation and Performance of Firms: Do Start-Ups, Regional Proximity and Skills Matter? Sustainability 2022, 14, 5801. [Google Scholar] [CrossRef]
- Fredette, J.; Marom, R.; Steinert, K.; Witters, L. The promise and peril of hyperconnectivity for organizations and societies. The Global Information Technology Report. World Economic Forum. 2012. Available online: https://www3.weforum.org/docs/GITR/2012/GITR_Chapter1.10_2012.pdf (accessed on 21 May 2022).
- Chege, S.M.; Wang, D.; Suntu, S.L. Impact of Information Technology Innovation on Firm Performance in Kenya. Inf. Technol. Dev. 2019, 26, 316–345. [Google Scholar] [CrossRef]
- Langley, D.J.; van Doorn, J.; Ng, I.C.L.; Stieglitz, S.; Lazovik, A.; Boonstra, A. The Internet of Everything: Smart Things and Their Impact on Business Models. J. Bus. Res. 2020, 122, 853–863. [Google Scholar] [CrossRef]
- Ruiz-Rodríguez, F.; Lucendo-Monedero, A.L.; González-Relaño, R. Measurement and Characterisation of the Digital Divide of Spanish Regions at Enterprise Level. A Comparative Analysis with the European Context. Telecommun. Policy 2018, 42, 187–211. [Google Scholar] [CrossRef]
- Kostis, A.; Ritala, P. Digital Artifacts in Industrial Co-Creation: How to Use Technology to Bridge the Provider-Customer Boundary. Calif. Manag. Rev. 2020, 62, 125–147. [Google Scholar] [CrossRef]
- Ranta, V.; Aarikka-Stenroos, L.; Väisänen, J.-M. Digital Technologies Catalyzing Business Model Innovation for Circular Economy—Multiple Case Study. Resour. Conserv. Recycl. 2021, 164, 105155. [Google Scholar] [CrossRef]
- Eaton, J.; Jinkins, D.; Tybout, J.R.; Xu, D. Two-Sided Search in International Markets (No. w29684). National Bureau of Economic Research. 2022. Available online: https://www.nber.org/system/files/working_papers/w29684/w29684.pdf (accessed on 1 July 2022).
- Chen, Y.-Y.K.; Jaw, Y.-L.; Wu, B.-L. Effect of Digital Transformation on Organisational Performance of SMEs. Internet Res. 2016, 26, 186–212. [Google Scholar] [CrossRef]
- Yunis, M.; El-Kassar, A.-N.; Tarhini, A. Impact of ICT-Based Innovations on Organizational Performance. J. Enterp. Inf. Manag. 2017, 30, 122–141. [Google Scholar] [CrossRef]
- Neirotti, P.; Raguseo, E.; Paolucci, E. How SMEs Develop ICT-Based Capabilities in Response to Their Environment. J. Enterp. Inf. Manag. 2018, 31, 10–37. [Google Scholar] [CrossRef]
- Zhang, M.; Hartley, J.L. Guanxi, IT Systems, and Innovation Capability: The Moderating Role of Proactiveness. J. Bus. Res. 2018, 90, 75–86. [Google Scholar] [CrossRef]
- Cenamor, J.; Parida, V.; Wincent, J. How Entrepreneurial SMEs Compete through Digital Platforms: The Roles of Digital Platform Capability, Network Capability and Ambidexterity. J. Bus. Res. 2019, 100, 196–206. [Google Scholar] [CrossRef]
- Price, L.; Shutt, J.; Sellick, J. Supporting Rural Small and Medium-Sized Enterprises to Take up Broadband-Enabled Technology: What Works? Local Econ. J. Local Econ. Policy Unit 2018, 33, 515–536. [Google Scholar] [CrossRef]
- Cuevas-Vargas, H.; Estrada, S.; Larios-Gómez, E. The Effects of ICTs as Innovation Facilitators for a Greater Business Performance. Evidence from Mexico. Procedia Comput. Sci. 2016, 91, 47–56. [Google Scholar] [CrossRef]
- Leviäkangas, P.; Mok Paik, S.; Moon, S. Keeping up with the Pace of Digitization: The Case of the Australian Construction Industry. Technol. Soc. 2017, 50, 33–43. [Google Scholar] [CrossRef]
- Taştan, H.; Gönel, F. ICT Labor, Software Usage, and Productivity: Firm-Level Evidence from Turkey. J. Product. Anal. 2020, 53, 265–285. [Google Scholar] [CrossRef]
- Skare, M.; Riberio Soriano, D. How Globalization Is Changing Digital Technology Adoption: An International Perspective. J. Innov. Knowl. 2021, 6, 222–233. [Google Scholar] [CrossRef]
- Guo, H.; Yang, Z.; Huang, R.; Guo, A. The Digitalization and Public Crisis Responses of Small and Medium Enterprises: Implications from a COVID-19 Survey. Front. Bus. Res. China 2020, 14, 19. [Google Scholar] [CrossRef]
- Akpan, I.J.; Udoh, E.A.P.; Adebisi, B. Small Business Awareness and Adoption of State-of-The-Art Technologies in Emerging and Developing Markets, and Lessons from the COVID-19 Pandemic. J. Small Bus. Entrep. 2020, 34, 123–140. [Google Scholar] [CrossRef]
- European Commission. Entrepreneurship and Small and Medium-Sized Enterprises (SMEs). 2022. Available online: https://ec.europa.eu/growth/smes_pt (accessed on 25 March 2022).
- Akter, S.; Michael, K.; Uddin, M.R.; McCarthy, G.; Rahman, M. Transforming Business Using Digital Innovations: The Application of AI, Blockchain, Cloud and Data Analytics. Ann. Oper. Res. 2020, 308, 7–39. [Google Scholar] [CrossRef]
- Haaker, T.; Ly, P.T.M.; Nguyen-Thanh, N.; Nguyen, H.T.H. Business Model Innovation through the Application of the Internet-of-Things: A Comparative Analysis. J. Bus. Res. 2021, 126, 126–136. [Google Scholar] [CrossRef]
- Martin, C.; Leurent, H. Technology and Innovation for the Future of Production: Accelerating Value Creation. Geneva Switzerland. World Economic Forum. 2017. Available online: http://www3.weforum.org/docs/WEF_White_Paper_Technology_Innovation_Future_of_Production_2017.pdf (accessed on 30 May 2022).
- Vial, G. Understanding Digital Transformation: A Review and a Research Agenda. J. Strateg. Inf. Syst. 2019, 28, 118–144. [Google Scholar] [CrossRef]
- Oberländer, M.; Beinicke, A.; Bipp, T. Digital Competencies: A Review of the Literature and Applications in the Workplace. Comput. Educ. 2020, 146, 103752. [Google Scholar] [CrossRef]
- Consoli, D. Literature Analysis on Determinant Factors and the Impact of ICT in SMEs. Procedia-Soc. Behav. Sci. 2012, 62, 93–97. [Google Scholar] [CrossRef]
- Lehner, F.; Sundby, M.W. ICT Skills and Competencies for SMEs: Results from a Structured Literature Analysis on the Individual Level. Impact Digit. Workplace 2017, 21, 55–69. [Google Scholar] [CrossRef]
- Horváth, D.; Szabó, R.Z. Driving Forces and Barriers of Industry 4.0: Do Multinational and Small and Medium-Sized Companies Have Equal Opportunities? Technol. Forecast. Soc. Chang. 2019, 146, 119–132. [Google Scholar] [CrossRef]
- Li, L.; Su, F.; Zhang, W.; Mao, J.-Y. Digital Transformation by SME Entrepreneurs: A Capability Perspective. Inf. Syst. J. 2017, 28, 1129–1157. [Google Scholar] [CrossRef]
- Ulas, D. Digital Transformation Process and SMEs. Procedia Comput. Sci. 2019, 158, 662–671. [Google Scholar] [CrossRef]
- Reis, J.; Amorim, M.; Melão, N.; Matos, P. Digital Transformation: A Literature Review and Guidelines for Future Research. Adv. Intell. Syst. Comput. 2018, 745, 411–421. [Google Scholar] [CrossRef]
- Fanelli, R.M. Barriers to Adopting New Technologies within Rural Small and Medium Enterprises (SMEs). Soc. Sci. 2021, 10, 430. [Google Scholar] [CrossRef]
- Azevedo, A.; Almeida, A. Grasp the Challenge of Digital Transition in SMEs—A Training Course Geared towards Decision-Makers. Educ. Sci. 2021, 11, 151. [Google Scholar] [CrossRef]
- Fitzgerald, M.; Kruschwitz, N.; Bonnet, D.; Welch, M. Embracing Digital Technology: A New Strategic Imperative; MIT Sloan Management Review: Cambridge, MA, USA, 2013; Volume 55, p. 1. Available online: https://emergenceweb.com/blog/wp-content/uploads/2013/10/embracing-digital-technology.pdf (accessed on 25 March 2022).
- Kane, G.C.; Palmer, D.; Phillips, A.N.; Kiron, D.; Buckley, N. Strategy, Not Technology, Drives Digital Transformation; MIT Sloan Management Review and Deloitte University Press: Cambridge, MA, USA, 2015; Volume 14, pp. 1–25. Available online: https://www.cubility.com.au/wp-content/uploads/2018/11/dup_strategy-not-technology-drives-digital-transformation.pdf (accessed on 1 July 2022).
- European Commission. Information and Communication Technologies. 2022. Available online: https://ec.europa.eu/regional_policy/en/policy/themes/ict/ (accessed on 25 March 2022).
- Pellegrin, J.; Colnot, L.; Arendt, Ł.; Bisaschi, L.; Catalano, G.; Martinaitis, Ž.; Micheletti, G. Research for REGI Committee-Digital Agenda and Cohesion Policy. European Parliament. 2018. Available online: https://www.europarl.europa.eu/RegData/etudes/STUD/2018/617485/IPOL_STU(2018)617485_EN.pdf (accessed on 30 May 2022).
- Ortiz, R.; Fernandez, V. Business Perception of Obstacles to Innovate: Evidence from Chile with Pseudo-Panel Data Analysis. Res. Int. Bus. Financ. 2022, 59, 101563. [Google Scholar] [CrossRef]
- Sörvik, J.; Kleibrink, A. Mapping EU Investments in ICT-Description of an Online Tool and Initial Observations; Publications Office of the European Union: Luxembourg, 2016; Available online: https://op.europa.eu/en/publication-detail/-/publication/6fd75d00-44d0-11e6-9c64-01aa75ed71a1/language-en (accessed on 30 May 2022).
- Taylor, P. The Importance of Information and Communication Technologies (ICTs): An Integration of the Extant Literature on ICT Adoption in Small and Medium Enterprises 2015. Available online: https://ssrn.com/abstract=2604205 (accessed on 18 November 2021).
- Rogers, E.M.; Singhal, A.; Quinlan, M.M. Diffusion of innovations. In An Integrated Approach to Communication Theory and Research, 2nd ed.; Stacks, D.W., Salwen, M.B., Eds.; Routledge: New York, NY, USA, 2014; pp. 432–448. [Google Scholar] [CrossRef]
- Tornatzky, L.G.; Fleischer, M. The Process of Technological Innovation; Lexington Books: Lanham, MA, USA, 1990; ISBN 9780669203486. [Google Scholar]
- Mbuyisa, B.; Leonard, A. The Role of ICT Use in SMEs towards Poverty Reduction: A Systematic Literature Review. J. Int. Dev. 2016, 29, 159–197. [Google Scholar] [CrossRef]
- Bach, M.P.; Zoroja, J.; Vukšić, V.B. Determinants of Firms’ Digital Divide: A Review of Recent Research. Procedia Technol. 2013, 9, 120–128. [Google Scholar] [CrossRef]
- Tarutė, A.; Gatautis, R. ICT Impact on SMEs Performance. Procedia-Soc. Behav. Sci. 2014, 110, 1218–1225. [Google Scholar] [CrossRef]
- Isensee, C.; Teuteberg, F.; Griese, K.-M.; Topi, C. The Relationship between Organizational Culture, Sustainability, and Digitalization in SMEs: A Systematic Review. J. Clean. Prod. 2020, 275, 122944. [Google Scholar] [CrossRef]
- Ramdani, B.; Raja, S.; Kayumova, M. Digital Innovation in SMEs: A Systematic Review, Synthesis and Research Agenda. Inf. Technol. Dev. 2022, 28, 56–80. [Google Scholar] [CrossRef]
- Thrassou, A.; Uzunboylu, N.; Vrontis, D.; Christofi, M. Digitalization of SMEs: A Review of Opportunities and Challenges. In The Changing Role of SMEs in Global Business. Palgrave Studies in Cross-Disciplinary Business Research, in Association with EuroMed Academy of Business; Thrassou, A., Vrontis, D., Weber, Y., Shams, S.M.R., Tsoukatos, E., Eds.; Palgrave Macmillan: London, UK, 2020; pp. 179–200. [Google Scholar] [CrossRef]
- Reggi, L.; Gil-Garcia, J.R. Addressing Territorial Digital Divides through ICT Strategies: Are Investment Decisions Consistent with Local Needs? Gov. Inf. Q. 2021, 38, 101562. [Google Scholar] [CrossRef]
- Reggi, L.; Scicchitano, S. Are EU Regional Digital Strategies Evidence-Based? An Analysis of the Allocation of 2007–13 Structural Funds. Telecommun. Policy 2014, 38, 530–538. [Google Scholar] [CrossRef]
- Kleibrink, A.; Niehaves, B.; Palop, P.; Sörvik, J.; Thapa, B.E.P. Regional ICT Innovation in the European Union: Prioritization and Performance (2008–2012). J. Knowl. Econ. 2015, 6, 320–333. [Google Scholar] [CrossRef]
- Ramdani, B.; Chevers, D.; Williams, D.A. SMEs’ Adoption of Enterprise Applications. J. Small Bus. Enterp. Dev. 2013, 20, 735–753. [Google Scholar] [CrossRef]
- Hanclova, J.; Rozehnal, P.; Ministr, J.; Tvrdikova, M. The Determinants of IT Adoption in SMEs in the Czech-Polish Border Areas. Inf. Technol. Dev. 2015, 21, 426–444. [Google Scholar] [CrossRef]
- Billon, M.; Lera-Lopez, F.; Marco, R. ICT Use by Households and Firms in the EU: Links and Determinants from a Multivariate Perspective. Rev. World Econ. 2016, 152, 629–654. [Google Scholar] [CrossRef]
- Chatzoglou, P.; Chatzoudes, D. Factors Affecting E-Business Adoption in SMEs: An Empirical Research. J. Enterp. Inf. Manag. 2016, 29, 327–358. [Google Scholar] [CrossRef]
- Billon, M.; Marco, R.; Lera-Lopez, F. Innovation and ICT Use by Firms and Households in the EU. Inf. Technol. People 2017, 30, 424–448. [Google Scholar] [CrossRef]
- Giotopoulos, I.; Kontolaimou, A.; Korra, E.; Tsakanikas, A. What Drives ICT Adoption by SMEs? Evidence from a Large-Scale Survey in Greece. J. Bus. Res. 2017, 81, 60–69. [Google Scholar] [CrossRef]
- Gómez-García, J.; del Rocio Moreno Enguix, M.; Gómez-Gallego, J.C. Estimation of the Efficiency of Structural Funds: A Parametric and Nonparametric Approach. Appl. Econ. 2012, 44, 3935–3954. [Google Scholar] [CrossRef]
- Charnes, A.; Cooper, W.W.; Rhodes, E. Measuring the Efficiency of Decision Making Units. Eur. J. Oper. Res. 1978, 2, 429–444. [Google Scholar] [CrossRef]
- Banker, R.D.; Charnes, A.; Cooper, W.W. Some Models for Estimating Technical and Scale Inefficiencies in Data Envelopment Analysis. Manag. Sci. 1984, 30, 1078–1092. [Google Scholar] [CrossRef]
- Gouveia, M.C.; Henriques, C.O.; Costa, P. Evaluating the Efficiency of Structural Funds: An Application in the Competitiveness of SMEs across Different EU Beneficiary Regions. Omega 2021, 101, 102265. [Google Scholar] [CrossRef]
- Henriques, C.; Viseu, C.; Trigo, A.; Gouveia, M.; Amaro, A. How Efficient Is the Cohesion Policy in Supporting Small and Mid-Sized Enterprises in the Transition to a Low-Carbon Economy? Sustainability 2022, 14, 5317. [Google Scholar] [CrossRef]
- Henriques, C.; Viseu, C.; Neves, M.; Amaro, A.; Gouveia, M.; Trigo, A. How Efficiently Does the EU Support Research and Innovation in SMEs? J. Open Innov. Technol. Mark. Complex. 2022, 8, 92. [Google Scholar] [CrossRef]
- Chen, P.-C.; Yu, M.-M.; Chang, C.-C.; Hsu, S.-H.; Managi, S. Nonradial Directional Performance Measurement with Undesirable Outputs: An Application to OECD and Non-OECD Countries. Int. J. Inf. Technol. Decis. Mak. 2015, 14, 481–520. [Google Scholar] [CrossRef]
- Tone, K. A Slacks-Based Measure of Efficiency in Data Envelopment Analysis. Eur. J. Oper. Res. 2001, 130, 498–509. [Google Scholar] [CrossRef]
- Henriques, C.O.; Marcenaro-Gutierrez, O.D. Efficiency of Secondary Schools in Portugal: A Novel DEA Hybrid Approach. Socio-Econ. Plan. Sci. 2021, 74, 100954. [Google Scholar] [CrossRef]
- Fried, H.O.; Lovell, C.A.K.; Schmidt, S.S.; Yaisawarng, S. Accounting for Environmental Effects and Statistical Noise in Data Envelopment Analysis. J. Product. Anal. 2002, 17, 157–174. [Google Scholar] [CrossRef]
- Aigner, D.; Lovell, C.A.K.; Schmidt, P. Formulation and Estimation of Stochastic Frontier Production Function Models. J. Econom. 1977, 6, 21–37. [Google Scholar] [CrossRef]
- Meeusen, W.; van Den Broeck, J. Efficiency Estimation from Cobb-Douglas Production Functions with Composed Error. Int. Econ. Rev. 1977, 18, 435. [Google Scholar] [CrossRef]
- Jondrow, J.; Knox Lovell, C.A.; Materov, I.S.; Schmidt, P. On the Estimation of Technical Inefficiency in the Stochastic Frontier Production Function Model. J. Econom. 1982, 19, 233–238. [Google Scholar] [CrossRef]
- Avkiran, N.; Rowlands, T. How to Better Identify the True Managerial Performance: State of the Art Using DEA. Omega 2008, 36, 317–324. [Google Scholar] [CrossRef]
- Bubbico, R.L.; de Michelis, N. The Financial Execution of Structural Funds. Regional Focus Working Paper n.3/2011. 2011. Available online: https://ec.europa.eu/regional_policy/sources/docgener/focus/2011_03_financial.pdf (accessed on 11 April 2022).
- Golany, B.; Roll, Y. An application procedure for DEA. Omega 1989, 17, 237–250. [Google Scholar] [CrossRef]
- Hollanders, H. Regional Innovation Scoreboard 2021; European Commission: Brussels, Belgium, 2021. [Google Scholar] [CrossRef]
- Neokosmidis, I.; Avaritsiotis, N.; Ventoura, Z.; Varoutas, D. Assessment of the Gap and (Non-)Internet Users Evolution Based on Population Biology Dynamics. Telecommun. Policy 2015, 39, 14–37. [Google Scholar] [CrossRef]
- Li, R.; Shiu, A. Internet Diffusion in China: A Dynamic Panel Data Analysis. Telecommun. Policy 2012, 36, 872–887. [Google Scholar] [CrossRef]
- Goldstein, R. Conditioning Diagnostics: Collinearity and Weak Data in Regression. Technometrics 1993, 35, 85–86. [Google Scholar] [CrossRef]
- James, G.; Witten, D.; Hastie, T.; Tibshirani, R. An Introduction to Statistical Learning; Springer: New York, NY, USA, 2021; ISBN 9781071614174. [Google Scholar]
- Dakpo, K.H.; Desjeux, Y.; Latruffe, L. sfaR: Stochastic Frontier Analysis Using R. R Package Version 0.1.1. 2022. Available online: https://CRAN.R-project.org/package=sfaR/ (accessed on 1 July 2022).
- Bukvić, I.B.; Babic, I.D.; Starcevic, D.P. Study on the Utilization of ational and EU Funds in Financing Capital Investments of ICT Companies. In Proceedings of the 44th International Convention on Information, Communication and Electronic Technology (MIPRO), Opatija, Croatia, 27 September–1 October 2021. [Google Scholar] [CrossRef]
- Martinez-Cillero, M.; Lawless, M.; O’Toole, C.; Slaymaker, R. Financial Frictions and the SME Investment Gap: New Survey Evidence for Ireland. Ventur. Cap. 2020, 22, 239–259. [Google Scholar] [CrossRef]
- Cooper, W.W.; Seiford, L.M.; Tone, K. Multi-Stage Use of Parametric and Non-Parametric Models. In Data Envelopment Analysis; Springer: New York, NY, USA, 2007; pp. 423–442. [Google Scholar] [CrossRef]


| Authors | Main Purpose | Methodologies | Variables |
|---|---|---|---|
| Ramdani et al. [53] | Study the technology, organization, and environment factors influencing SMEs’ adoption of enterprise applications | Partial least squares technique | Dependent variable: adoption of enterprise applications. Independent variables: technological construct—relative advantage, compatibility, complexity, trialability, observability; organizational construct—top management support, organizational readiness, ICT experience, size; environmental construct—industry, market scope, competitive pressure, external ICT support |
| Hanclova et al. [54] | Study the main determinants of the adoption of ICT in micro and SMEs in Czech–Polish Border Areas | Asymmetric dependence testing and ordinal regression models | Explained variable—ICT adoption; determinants, ordinal data—data sources, modules in information systems, software properties, ICT maintenance |
| Billon et al. [55] | Investigate whether there are regional trends in ICT adoption in Europe and the role of geographical features in explaining household and firm ICT usage | Multivariate and canonical correlation analysis | Dependent variables: individuals using the Internet, individuals using a computer, individuals ordering goods and services online, employees using a computer at work, and employees using the Internet at work. Independent variables: economic variables—regional gross domestic product (GDP) per capita, employment specialization—employment in high- and medium high-technology manufacturing sectors, employment in total knowledge-intensive services, share of service employment over total, economic activity rate, research and development expenditure; human capital—life-long learning and tertiary education; ICT user characteristics—population between 15 and 64 years, population density, percentage of the population living in densely populated areas; institutional factors—the quality of government and the fiscal decentralization index |
| Chatzoglou and Chatzoudes [56] | Create and experimentally evaluate an analytical model for studying the main reasons influencing Greek SMEs’ e-business use process | Exploratory factor analysis, confirmatory factor analysis, linear regression methods, and the structural equation modeling technique | Dependent variable: e-business adoption; independent variables: ICT infrastructure, Internet skills, firm size, firm scope, government support, consumer readiness |
| Billon et al. [57] | Explore the presence of trends that integrate innovation and the usage of ICT by firms in the EU, as well as the reasons behind them | Factorial and cluster analyses | Dependent variables: Individuals using the Internet, individuals using a computer, individuals ordering goods and services online, employees using a computer at work, and employees using the Internet at work. Independent variables: economic variables—regional GDP per capita; employment specialization—employment in high and medium high-technology manufacturing sectors, employment in total knowledge-intensive services, share of service employment over total, economic activity rate, research and development expenditure; human capital—life-long learning and tertiary education; ICT user characteristics—population between 15 and 64 years, population density, percentage of the population living in densely populated areas; institutional factors—the quality of government and the fiscal decentralization index |
| Giotopoulos et al. [58] | Find possible determinants of ICT adoption in Greek SMEs | Ordered probit models | Dependent variables: ICT adoption—ICT intentions, ICT infrastructure, Internet integration, e-sales, e-procurement. Independent variables: technological competencies—organizational innovation, research and development (R&D) activities, research collaborations; human capital—personnel with scientific background, personnel with ICT skills; internal organization—decentralized decision-making, visionary leadership; environmental and firm characteristics—firm size, industry, and location |
| Ruiz-Rodríguez et al. [5] | Categorize and quantify DD in Spanish regions and those in EU MSs using data from firms with more than 10 workers that have adopted ICTs | Propose an enterprise digital development index (EDDI) for MSs in the EU and Spanish regions through factor analysis and cluster analysis | ICT connectivity to Internet—enterprises connected to the Internet, enterprises that employ ICT specialists; ICT adoption—enterprises with ERP package software, enterprises with homepage, use of social networks, workers using computers, enterprises with online publicity; e-commerce—enterprises using e-invoices; e-government—enterprises sending e-invoices to the government |
| Reggi and Gil-Garcia [50] | Examine the link between local demands and investment choices aimed at reducing regional DD in the EU | Ordinary least square models | Dependent variables: EU funding allocations to broadband, e-government, ICT in SMEs, and e-inclusion; independent variables: households with broadband availability, digital individuals who used the Internet for interaction with public authorities, enterprises sharing electronic information on the supply chain, individuals who have never used the Internet, Quality of Government Index, GDP per capita |
| Code | Dimension |
|---|---|
| 4 | Productive investment linked to the cooperation between large enterprises and SMEs for developing information and communication technology (ICT) products and services, e-commerce, and enhancing demand for ICT Example of activities supported [40]: commerce and expand demand for ICT; encouragement and information initiatives (events, campaigns, consultation) aimed at increasing SME ICT preparedness, as well as the launch of innovative business ICT tools and solutions (ERP, CRM, cloud, among others) for SMEs. |
| 82 | ICT services and applications for SMEs (including e-commerce, e-business, and networked business processes), living labs, web entrepreneurs, and ICT start-ups). Example of activities supported [40]: Encourage the development of new advanced ICT solutions; collaboration between ICT companies and academic institutions through incentive and communication campaigns, events, seminars, and business consulting; commercialization and global marketing of ICT goods and services (consultation, promotion, marketing, involvement in tenders and expos, software localization); aid SMEs in the development of innovative applications and services, such as smart linked devices; smart housing and energy efficiency; ICT services and applications for health, SMEs in the health sector, domotic services. |
| Statistics | Total Eligible Spending | Number of Operations | Total Eligible Costs Decided |
|---|---|---|---|
| Mean | 15,861,300 | 409 | 28,169,468 |
| Median | 3,238,795 | 27 | 5,000,000 |
| Standard Deviation | 38,520,025 | 1068 | 63,497,428 |
| Minimum | 68,486 | 1 | 251,294 |
| Maximum | 237,904,467 | 5457 | 311,154,920 |
| Count | 51 | 51 | 51 |
| Variable | Operations Supported | Eligible Cost Decided | Total Eligible Spending |
|---|---|---|---|
| Operations supported | 1 | ||
| Eligible cost decided | 0.71 ** | 1 | |
| Total eligible spending | 0.77 ** | 0.91 ** | 1 |
| Environmental Factors | Mean | Standard Deviation | Min | Max |
|---|---|---|---|---|
| Population with tertiary education | 0.5767 | 0.1916 | 0.1156 | 1 |
| Digital skills | 0.5359 | 0.1949 | 0.2814 | 0.9318 |
| R&D expenditures business sector | 0.3105 | 0.2101 | 0.0215 | 0.8024 |
| ICT specialists | 0.4018 | 0.2527 | 0.0470 | 1 |
| Product process innovators | 0.5529 | 0.2511 | 0.1767 | 1 |
| GDPPPPpc | 87.72 | 23.9315 | 49.09 | 178.30 |
| Statistics | Efficiency | Total Eligible Spending | Number of Operations | Total Eligible Costs Decided | |
|---|---|---|---|---|---|
| Efficient DMUs | Mean | 1.09 | 46,026,233.00 | 1310.40 | 75,514,839.90 |
| Median | 1.07 | 9,217,730.00 | 339.50 | 9,633,113.00 | |
| Standard Deviation | 0.10 | 74,818,282.11 | 2108.72 | 118,719,405.31 | |
| Minimum | 1.00 | 329,249.00 | 1.00 | 251,294.00 | |
| Maximum | 1.31 | 237,904,467.00 | 5457.00 | 311,154,920.00 | |
| Count | 10 | 10 | 10 | 10 | |
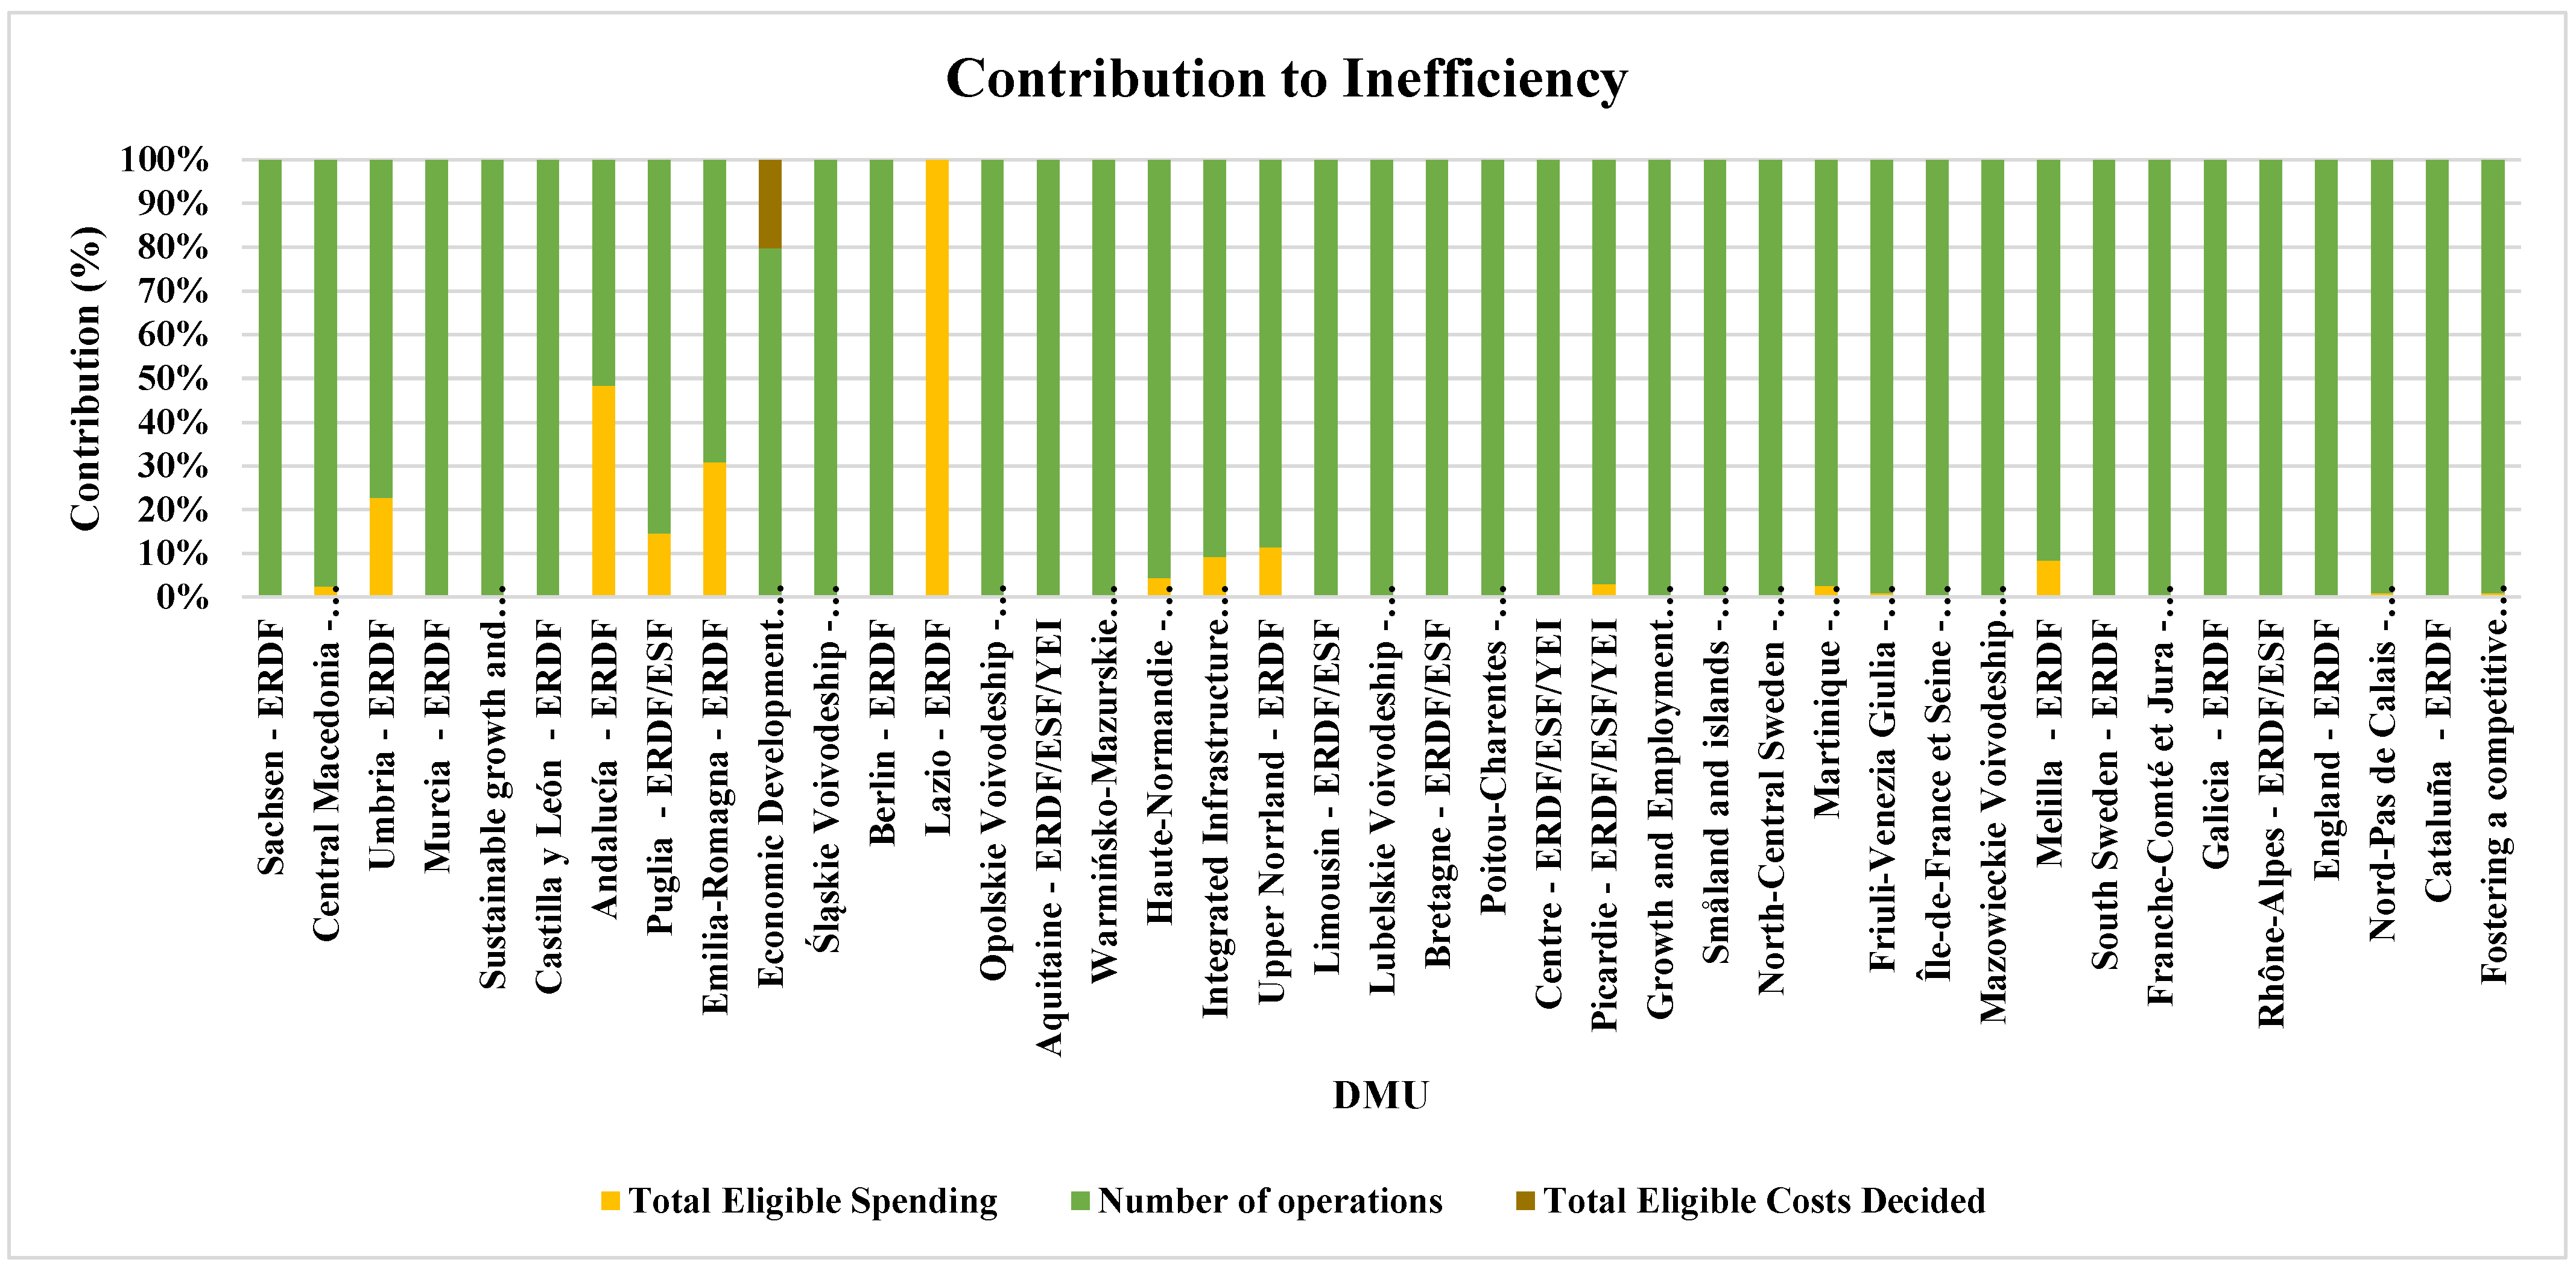
| Inefficient DMUs | Mean | −17.54 | 8,503,999.66 | 189.54 | 16,621,815.98 |
| Median | −6.21 | 1,963,414.00 | 14.00 | 4,901,930.00 | |
| Standard Deviation | 35.48 | 17,671,362.04 | 415.58 | 34,228,777.84 | |
| Minimum | −205.37 | 68,486.00 | 1.00 | 373,794.00 | |
| Maximum | 0.98 | 102,175,668.00 | 2184.00 | 202,847,237.00 | |
| Count | 41 | 41 | 41 | 41 |
| MS (2 Digit ISO) | OP | No. of Times as Benchmark | Rank | Total Eligible Spending | Number of Operations | Total Eligible Costs Decided |
|---|---|---|---|---|---|---|
| FR | Provence-Alpes-Côte d’Azur—ERDF/ESF/YEI | 21 | 1 | 329,249 | 1 | 251,294 |
| ES | Extremadura—ERDF | 30 | 2 | 1,560,112 | 810 | 4,823,735 |
| CZ | Enterprise and Innovation for Competitiveness—CZ—ERDF | 2 | 3 | 237,904,467 | 451 | 311,154,920 |
| ES | Multi-regional Spain—ERDF | 22 | 4 | 58,864,158 | 5108 | 95,971,219 |
| ES | País Vasco—ERDF | 25 | 5 | 3,964,897 | 575 | 4,618,616 |
| GR | Competitiveness Entrepreneurship and Innovation—GR—ERDF/ESF | 1 | 6 | 100,667,978 | 5457 | 275,856,182 |
| BG | Innovations and Competitiveness—BG—ERDF | 6 | 7 | 33,942,154 | 228 | 38,612,352 |
| LT | EU Structural Funds Investments—LT—ERDF/ESF/CF/YEI | 1 | 8 | 7,607,793 | 210 | 7,786,656 |
| GR | Epirus—ERDF/ESF | 4 | 9 | 4,593,855 | 144 | 4,593,855 |
| PL | Podkarpackie Voivodeship—ERDF/ESF | 1 | 10 | 10,827,667 | 120 | 11,479,570 |
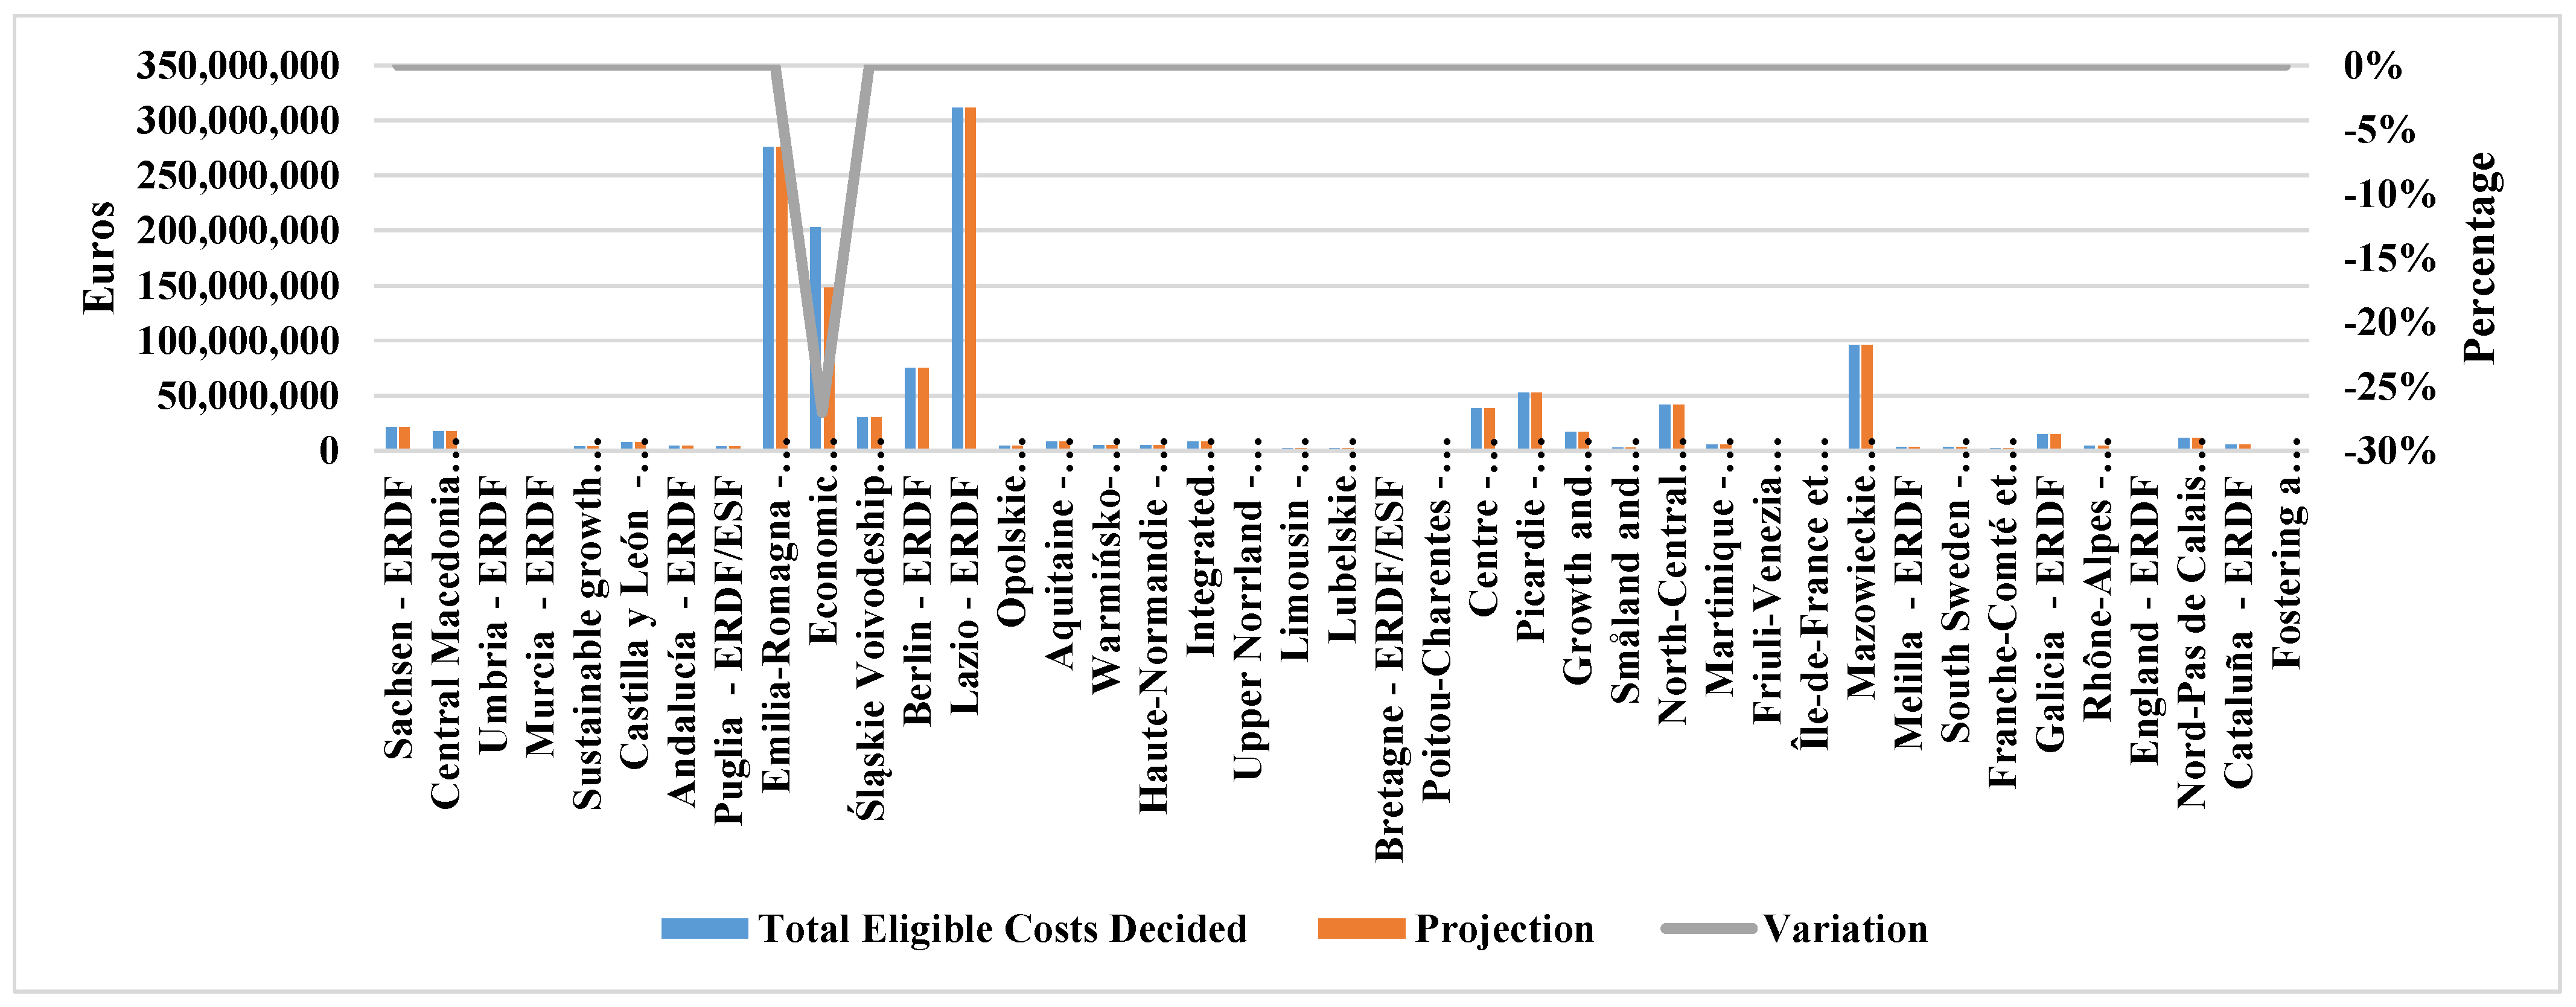
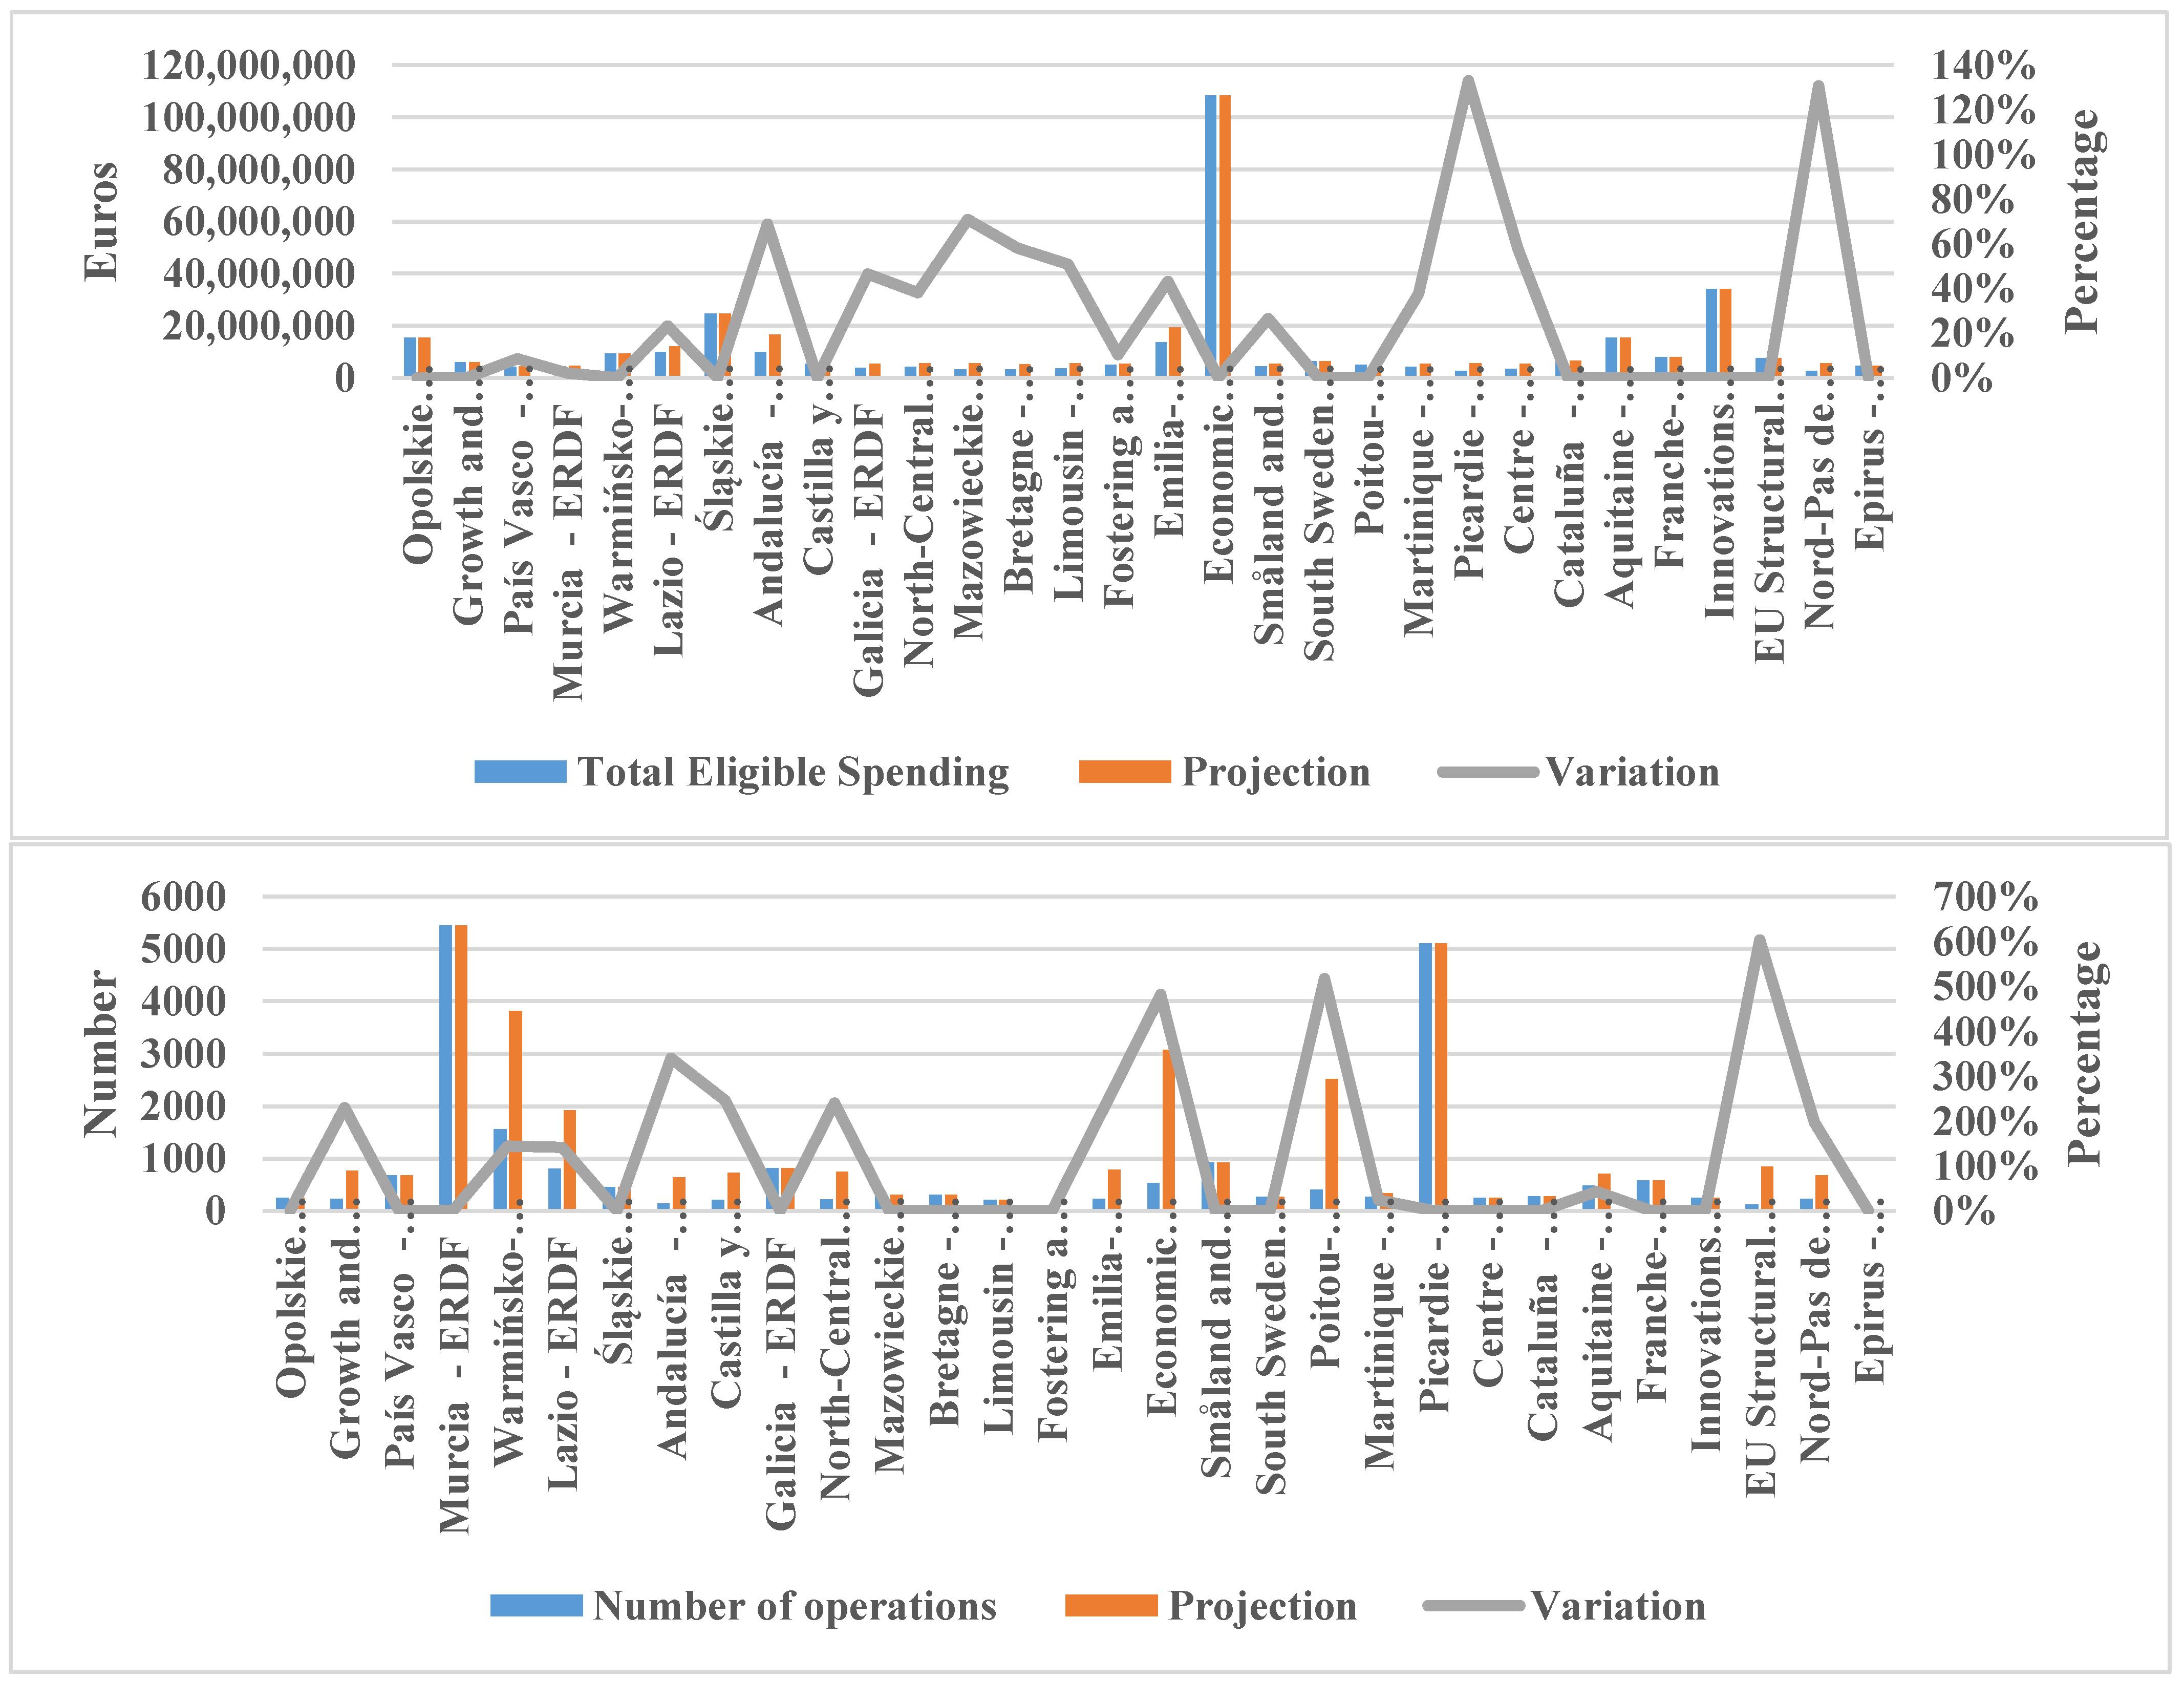
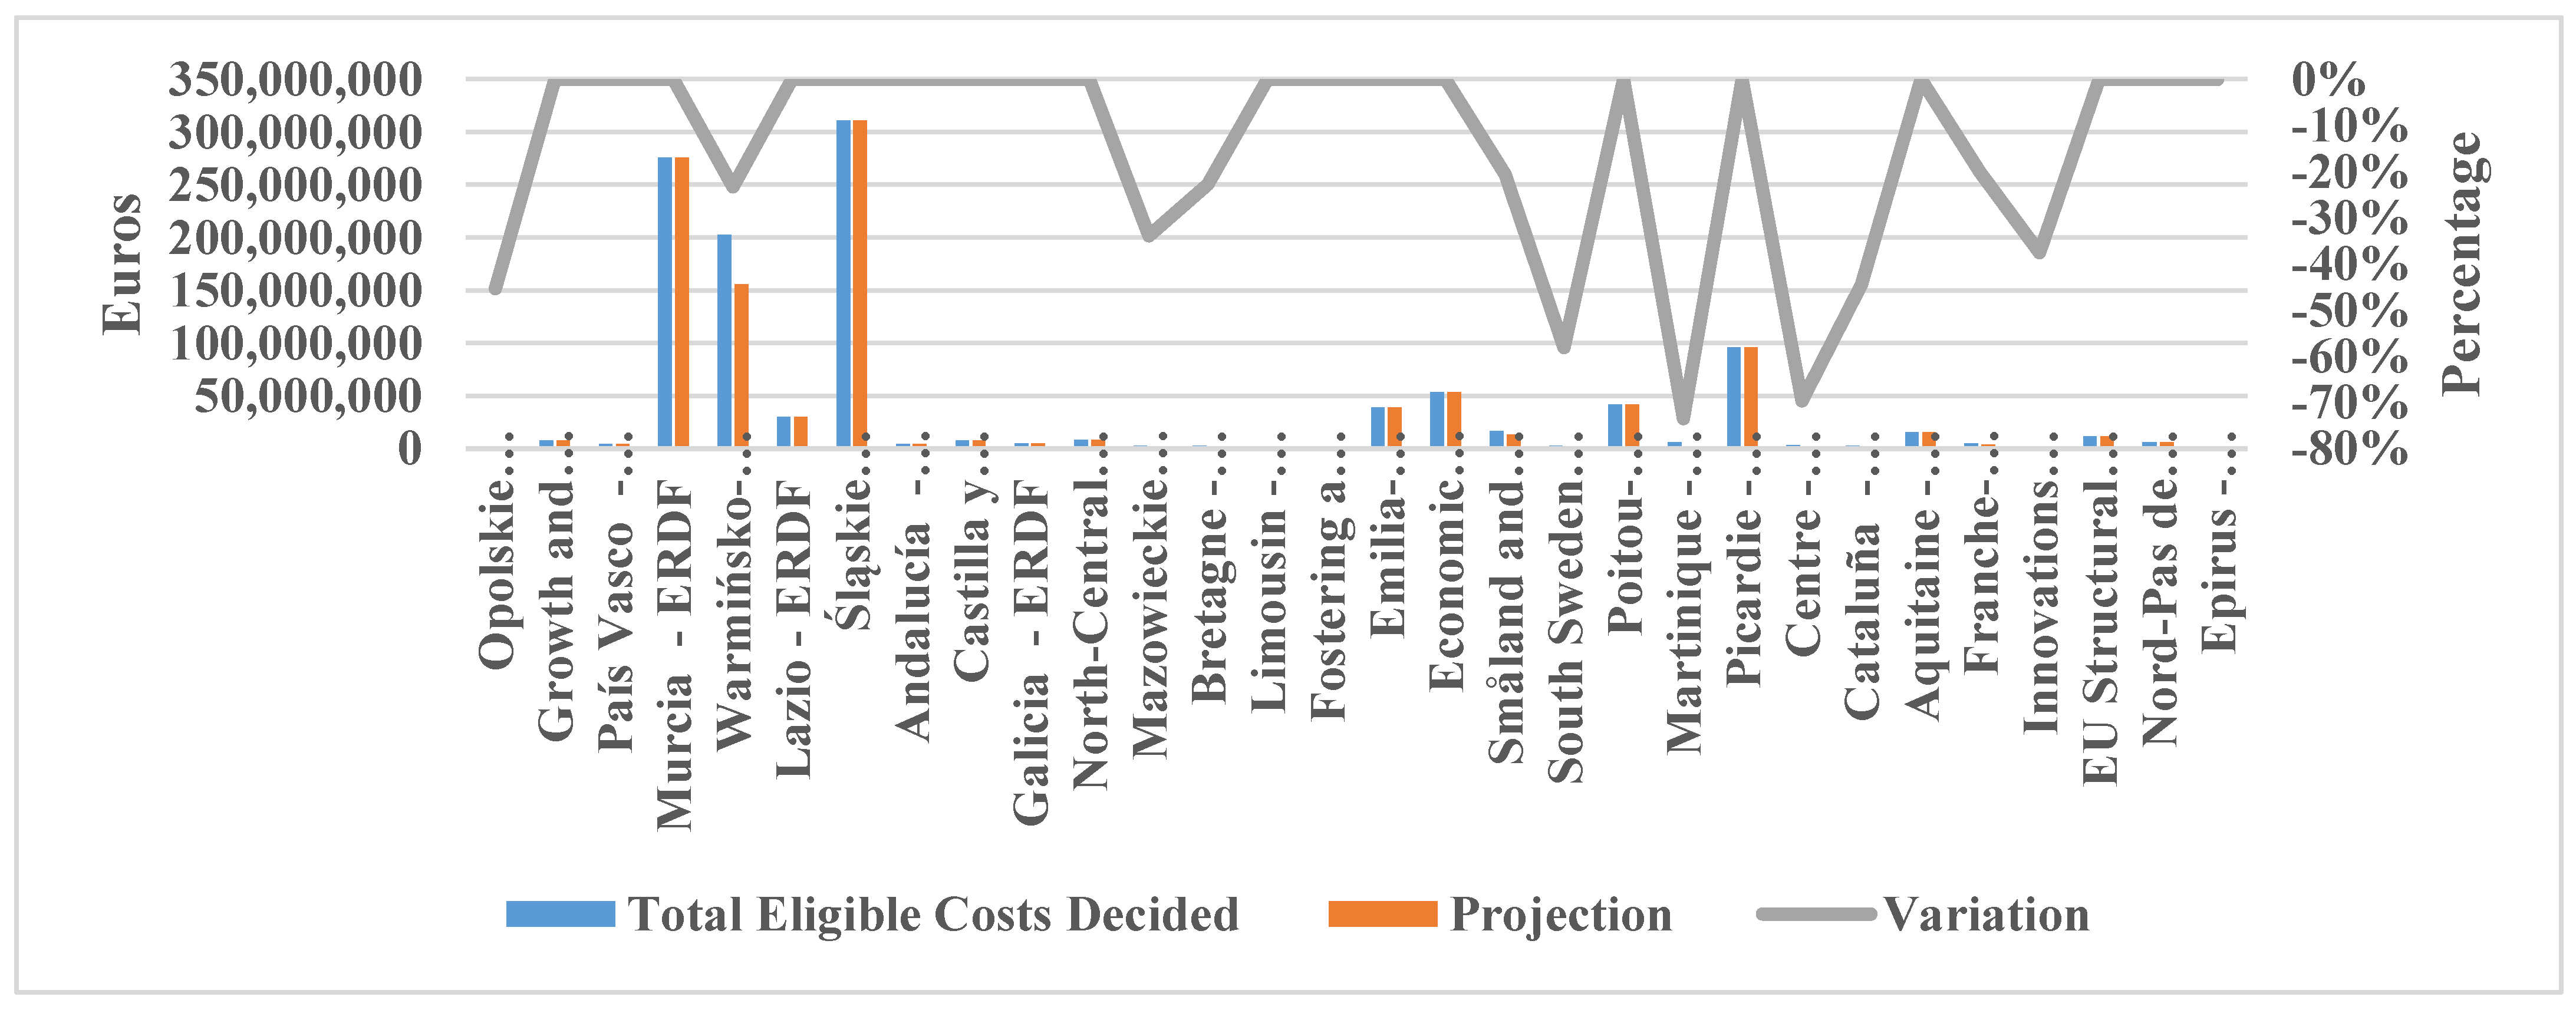
| Factor | Average Original | Average Projection | Variation |
|---|---|---|---|
| Total Eligible Spending | 8,504,000 | 9,912,457 | 17% |
| Number of Operations | 189.54 | 902.34 | 376% |
| Total Eligible Costs Decided | 16,621,816 | 15,284,716.33 | −8% |
| Variables | Population with Tertiary Education | Digital Skills | R&D Expenditures Business Sector | ICT Specialists | Product Process Innovators | GDP per Capita |
|---|---|---|---|---|---|---|
| Population with tertiary education | 1.00 | 0.32 * | 0.47 ** | 0.35 * | 0.16 | 0.44 ** |
| Digital skills | 0.32 * | 1.00 | 0.40 ** | 0.40 ** | 0.32 * | 0.48 ** |
| R&D expenditures business sector | 0.47 ** | 0.40 ** | 1.00 | 0.54 ** | 0.56 ** | 0.65 ** |
| ICT specialists | 0.35 * | 0.40 ** | 0.54 ** | 1.00 | 0.46 ** | 0.73 ** |
| Product process innovators | 0.16 | 0.32 * | 0.56 ** | 0.46 ** | 1.00 | 0.60 ** |
| GDPPPPPC | 0.44 ** | 0.48 ** | 0.65 ** | 0.73 ** | 0.60 ** | 1.00 |
| Variables | VIF |
|---|---|
| Population with tertiary education | 1.4767 |
| Digital skills | 2.2855 |
| R&D expenditures business sector | 2.5844 |
| ICT specialists | 2.6999 |
| Product process innovators | 2.0949 |
| GDPPPPPC | 3.2690 |
| Variables | Slacks | |
|---|---|---|
| Total Eligible Spending | Number of Operations | |
| Constant | −696,940 ** | 248.61 ** |
| Population with tertiary education | −4,007,800 ** | - |
| Digital skills | −3,279,600 ** | 205.16 ** |
| ICT specialists | 6,634,300 ** | 143.90 ** |
| Product process innovators | −3,805,600 ** | −83.38 ** |
| GDPPPPpc | 15,499 ** | −3.52 ** |
| Sigma-squared | 2.85 × 10¹³ ** | 1.08 × 10⁶ ** |
| Gamma | 0.97 * | 0.99 * |
| Log-likelihood function | −672.65 | −331.54 |
| Statistics | Efficiency | Total Eligible Spending | Number of Operations | Total Eligible Costs Decided | |
|---|---|---|---|---|---|
| Efficient DMUs | Mean | 1.05 | 31,428,303.50 | 1084.51 | 48,760,091.13 |
| Median | 1.03 | 5,110,867.00 | 334.43 | 1,394,419.50 | |
| Standard Deviation | 0.05 | 61,503,572.72 | 1736.75 | 99,207,159.68 | |
| Minimum | 1.00 | 329,249.00 | 1.00 | 251,294.00 | |
| Maximum | 1.18 | 237,904,467.00 | 5457.00 | 311,154,920.00 | |
| Count | 16 | 16 | 16 | 16 | |
| Inefficient DMUs | Mean | 0.42 | 12,630,063.32 | 387.06 | 18,756,611.31 |
| Median | 0.51 | 5,906,844.00 | 270.86 | 7,401,115.00 | |
| Standard Deviation | 0.53 | 19,135,345.69 | 287.45 | 36,006,785.23 | |
| Minimum | −1.89 | 2,426,946.00 | 120.00 | 1,502,834.00 | |
| Maximum | 0.89 | 108,321,040.00 | 1562.85 | 202,847,237.00 | |
| Count | 35 | 35 | 35 | 35 |
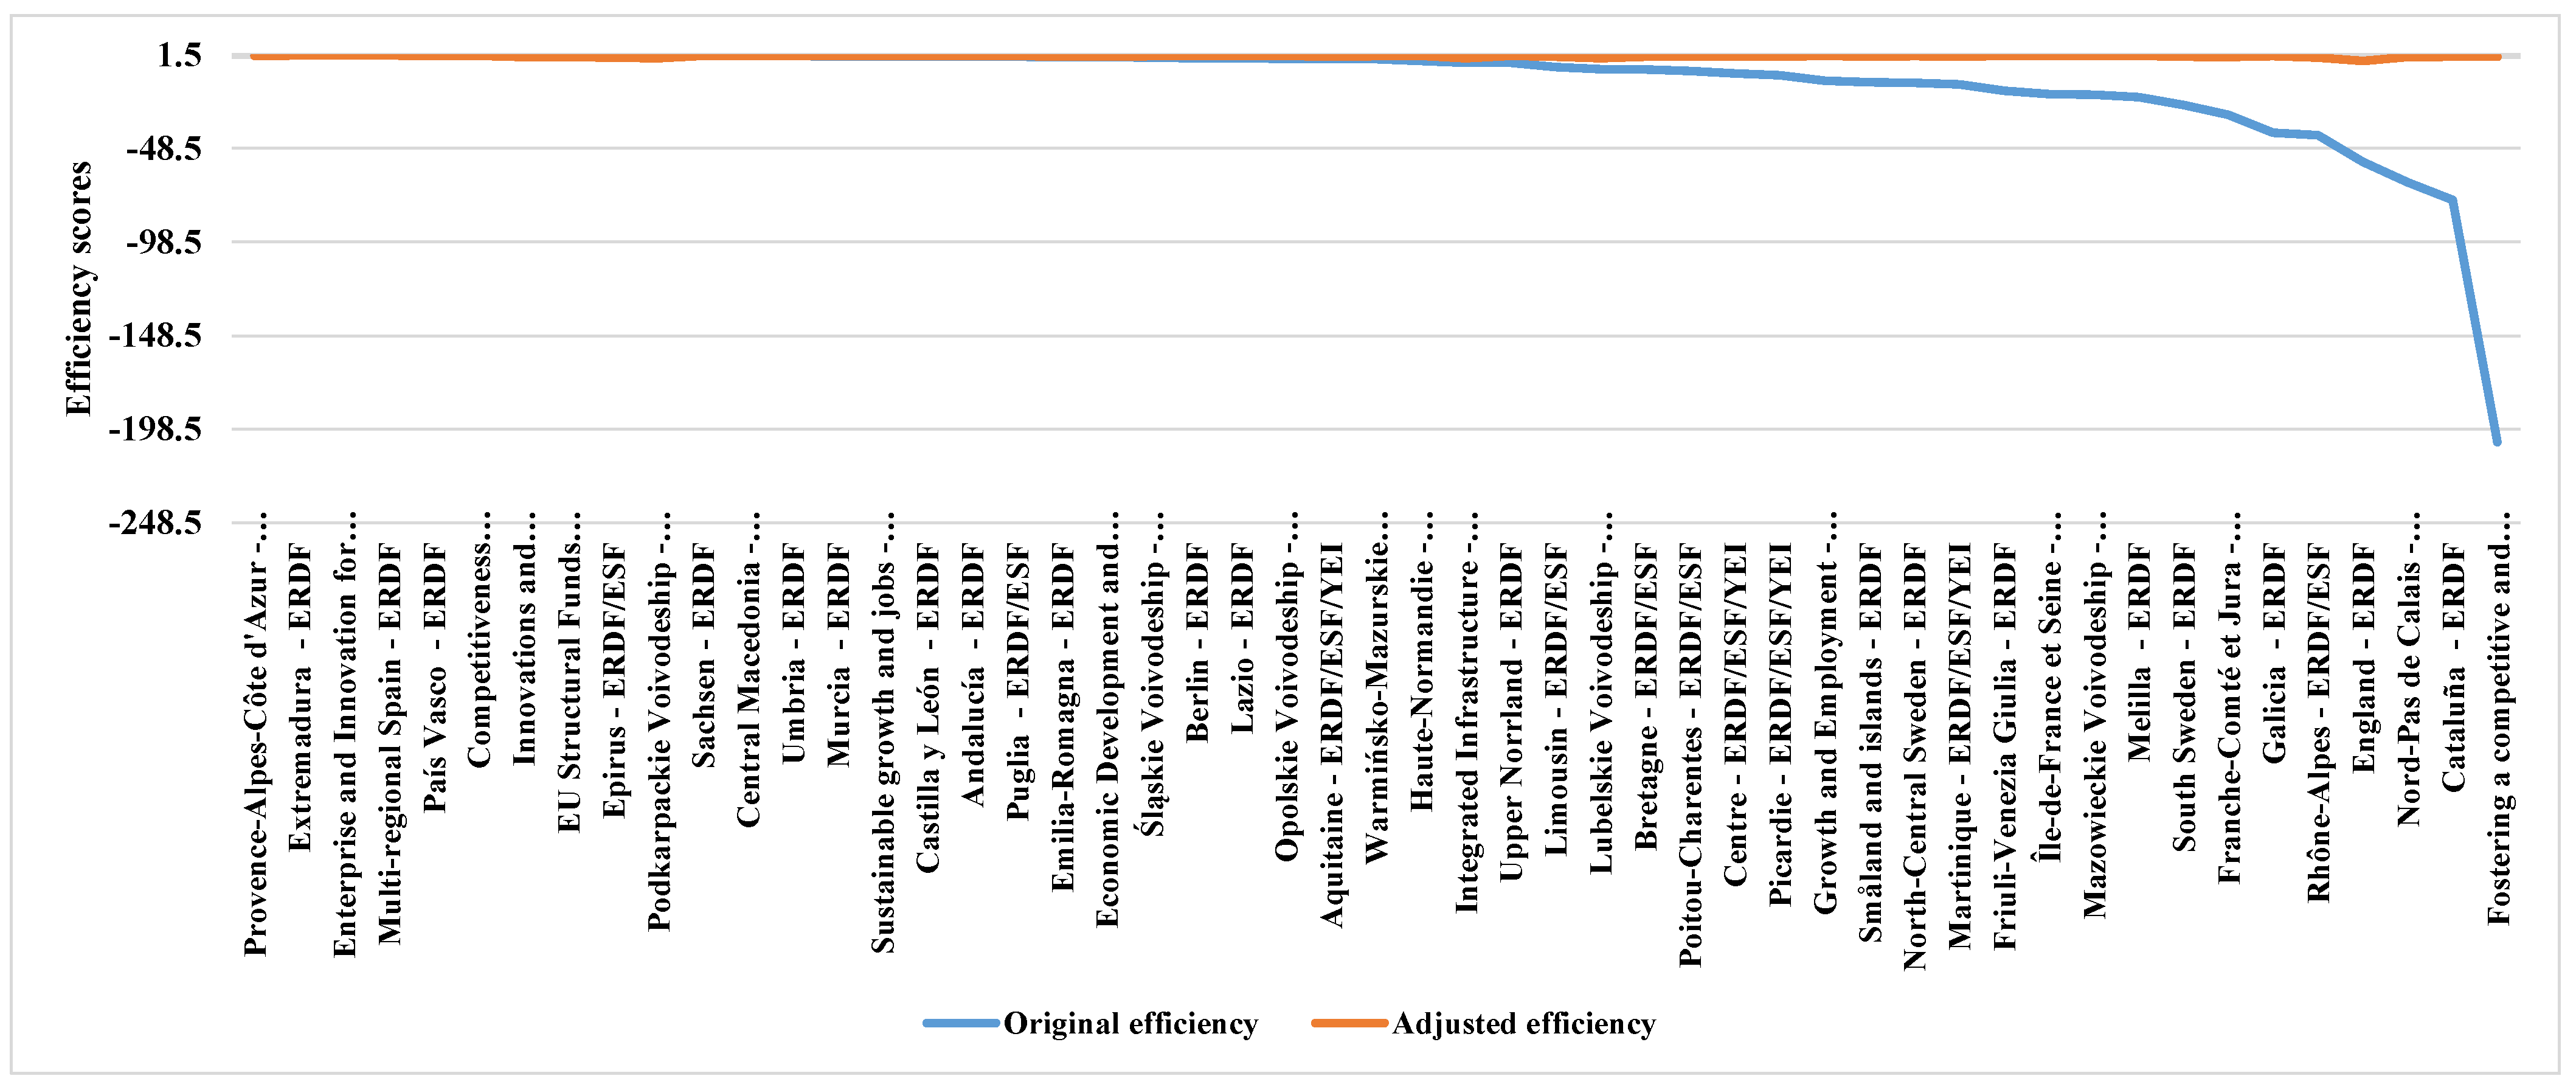
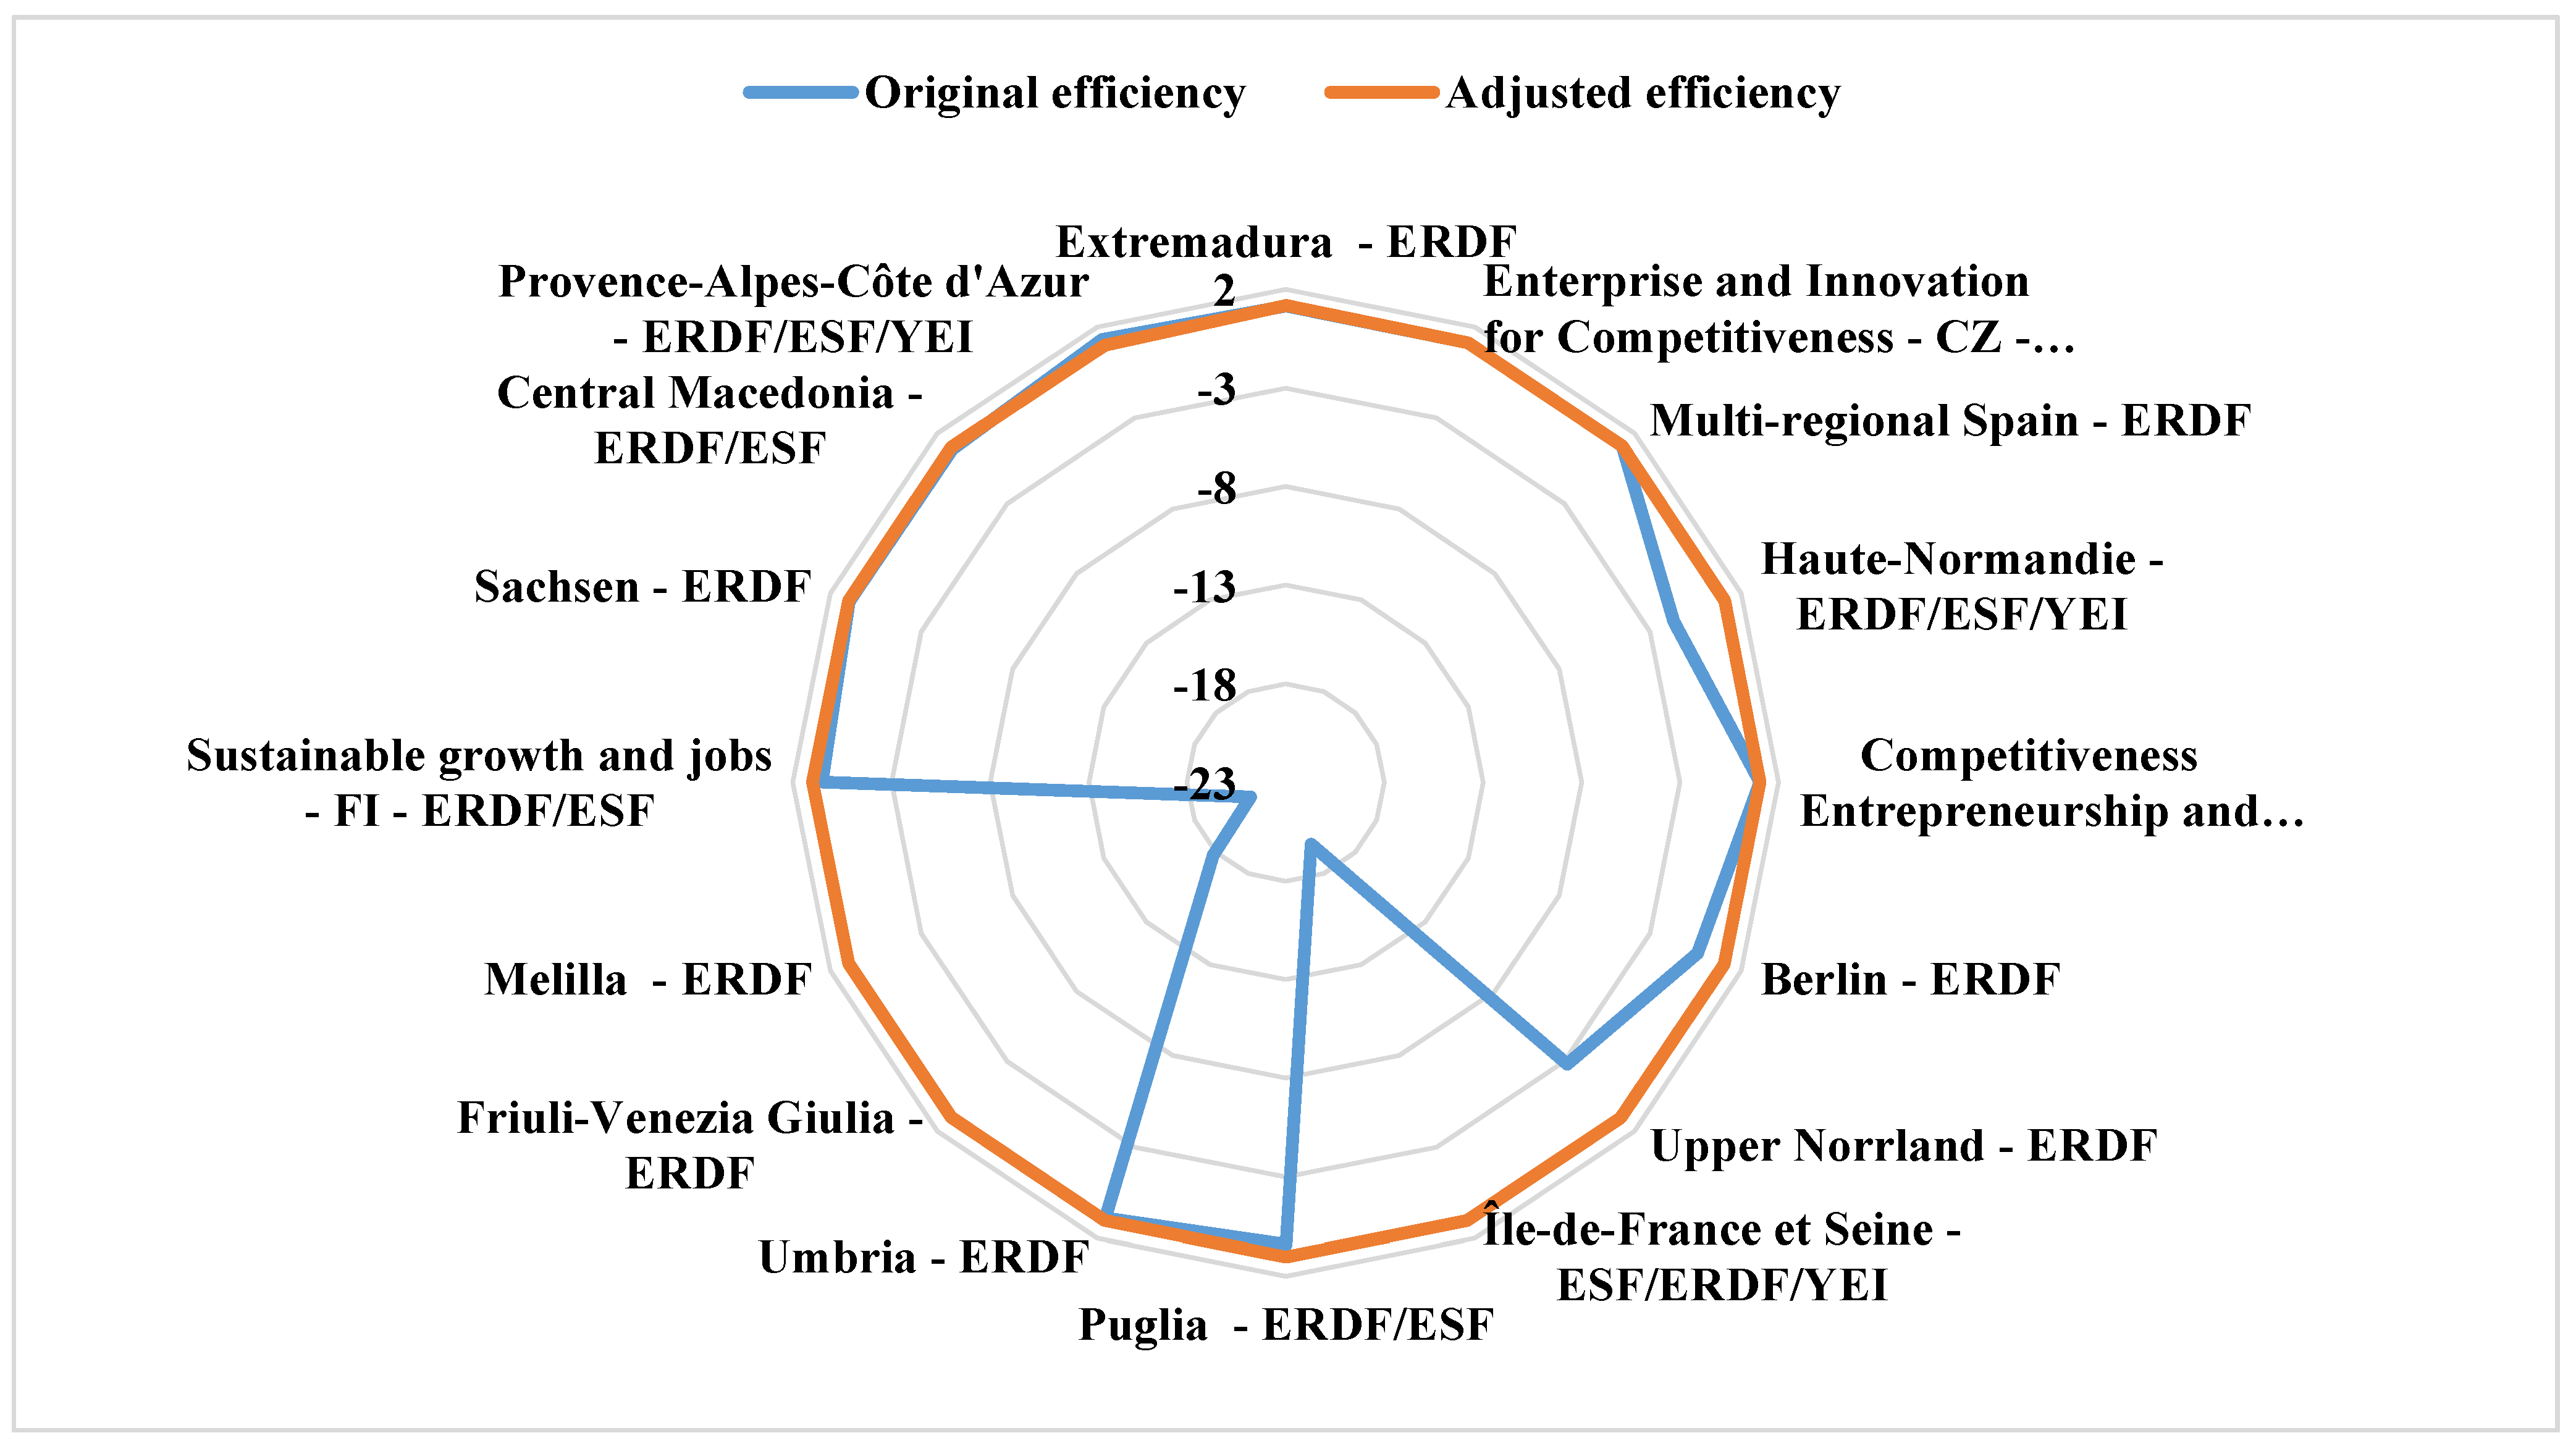
| MS (2 Digit ISO) | OP | Efficiency Score (without Adjusted Factors) | Efficiency Score (with Adjusted Factors) | No. of Times as Benchmark (without Adjusted Factors) | No. of Times as Benchmark (with Adjusted Factors) | Rank (without Adjusted Factors) | Rank (with Adjusted Factors) |
|---|---|---|---|---|---|---|---|
| FR | Provence-Alpes-Côte d’Azur—ERDF/ESF/YEI | 1.31 | 1.00 | 21 | 1 | 1 | 16 |
| ES | Extremadura—ERDF | 1.15 | 1.18 | 30 | 6 | 2 | 1 |
| CZ | Enterprise and Innovation for Competitiveness—CZ—ERDF | 1.14 | 1.14 | 2 | 3 | 3 | 2 |
| ES | Multi-regional Spain—ERDF | 1.13 | 1.12 | 22 | 19 | 4 | 3 |
| ES | País Vasco—ERDF | 1.07 | 0.88 | 25 | - | 5 | 19 |
| GR | Competitiveness Entrepreneurship and Innovation—GR—ERDF/ESF | 1.07 | 1.07 | 1 | 1 | 6 | 5 |
| BG | Innovations and Competitiveness—BG—ERDF | 1.02 | 0.40 | 6 | - | 7 | 43 |
| LT | EU Structural Funds Investments—LT—ERDF/ESF/CF/YEI | 1.01 | 0.39 | 1 | - | 8 | 44 |
| GR | Epirus—ERDF/ESF | 1.01 | 0.15 | 4 | - | 9 | 46 |
| PL | Podkarpackie Voivodeship—ERDF/ESF | 1.00 | −0.51 | 1 | - | 10 | 50 |
| FR | Haute-Normandie—ERDF/ESF/YEI | −1.71 | 1.08 | - | 2 | 27 | 4 |
| D | Berlin—ERDF | −0.39 | 1.05 | - | 11 | 22 | 6 |
| SE | Upper Norrland—ERDF | −2.81 | 1.03 | - | 0 | 29 | 7 |
| FR | Île-de-France et Seine—ESF/ERDF/YEI | −19.60 | 1.03 | - | 1 | 41 | 8 |
| IT | Puglia—ERDF/ESF | 0.42 | 1.03 | - | 3 | 18 | 9 |
| IT | Umbria—ERDF | 0.88 | 1.02 | - | 26 | 13 | 10 |
| IT | Friuli-Venezia Giulia—ERDF | −17.78 | 1.02 | - | 1 | 40 | 11 |
| ES | Melilla—ERDF | −21.05 | 1.02 | - | 1 | 43 | 12 |
| FI | Sustainable growth and jobs—FI—ERDF/ESF | 0.50 | 1.01 | . | 4 | 15 | 13 |
| DE | Sachsen—ERDF | 0.98 | 1.01 | . | 7 | 11 | 14 |
| GR | Central Macedonia—ERDF/ESF | 0.9 | 1.01 | . | 13 | 12 | 15 |
| Factor | Average Adjusted | Average Original | Average Projection (Adjusted) | Average Projection (Original) |
|---|---|---|---|---|
| Total Eligible Spending | 12,630,063 | 8,504,000 | 14,050,185 | 9,912,457 |
| Number of Operations | 387.06 | 189.54 | 934.29 | 902.34 |
| Total Eligible Costs Decided | 18,756,611 | 16,621,816 | 16,602,992.51 | 15,284,716.33 |
Publisher’s Note: MDPI stays neutral with regard to jurisdictional claims in published maps and institutional affiliations. |
© 2022 by the authors. Licensee MDPI, Basel, Switzerland. This article is an open access article distributed under the terms and conditions of the Creative Commons Attribution (CC BY) license (https://creativecommons.org/licenses/by/4.0/).
Share and Cite
Henriques, C.; Viseu, C. How Efficient Is the Implementation of Structural Funds Committed to Enhancing ICT Adoption in SMEs? J. Open Innov. Technol. Mark. Complex. 2022, 8, 147. https://doi.org/10.3390/joitmc8030147
Henriques C, Viseu C. How Efficient Is the Implementation of Structural Funds Committed to Enhancing ICT Adoption in SMEs? Journal of Open Innovation: Technology, Market, and Complexity. 2022; 8(3):147. https://doi.org/10.3390/joitmc8030147
Chicago/Turabian StyleHenriques, Carla, and Clara Viseu. 2022. "How Efficient Is the Implementation of Structural Funds Committed to Enhancing ICT Adoption in SMEs?" Journal of Open Innovation: Technology, Market, and Complexity 8, no. 3: 147. https://doi.org/10.3390/joitmc8030147
APA StyleHenriques, C., & Viseu, C. (2022). How Efficient Is the Implementation of Structural Funds Committed to Enhancing ICT Adoption in SMEs? Journal of Open Innovation: Technology, Market, and Complexity, 8(3), 147. https://doi.org/10.3390/joitmc8030147