Abstract
The traditional global food supply chains are not just complex, but they do not support the sustainability of agriculture. The business models with the greatest growth potential are those that would allow consumers to buy more directly from producers. Before COVID-19, these alternatives were not just popular but had a relatively high market share compared to post COVID-19 era. However, due to the pandemic and the changes in consumers’ purchasing behavior, the players of short food supply chains had to adapt to the new circumstances. This is why business model innovation is nowadays a priority, which means a substantial renewal of the value delivered to customers, and a significant transformation of the processes and activities of the company/network. The study aimed to examine the dynamic innovation through applied digital marketing solutions that could open up new sales channels and increase the competitiveness of the companies involved. Since Austria is one of the “greenest” countries, its consumers are interested in purchasing sustainably, so they strive to buy directly from the producers. This motivates the authors to use its representative sample to investigate how well adapted the Austrian direct sellers are to the unsteady circumstances. Based on a previous research framework, a principal component analysis was applied and the elements defined therein were the variables of non-hierarchical clustering. The used methods highlight the lack of online distribution and marketing of the farmer shops, which could multiply the harmful effects of the pandemic. The classification of the shops demonstrated the generally low share of innovative direct sellers. We conclude that in the new era, businesses that effectively apply open business innovation models will be able to compete in the market.
1. Introduction
Individuals often ignore the effect of their consumption on society and the planet while it may cause natural, social, and economic degradation. The increased consumption and modernization that belong to the 21st century damage the environment, which is mostly disregarded by society. Fisk published the ancestor of sustainable consumption in 1973 [1]. The author defined it as the efficient and rational use of resources concerning the global human population. One of the first appearances of sustainable consumption was published in the Brundtland report nearly twenty years later [2]. It identified sustainable consumption as a lifestyle that focuses on basic needs. At the same time, it minimizes pollution, toxic materials, natural resources, emissions of waste, and does not jeopardize the needs of future generations [2]. This idea developed further in the 2000s, when so-called green products became popular. The green shopper’s basket includes recyclable, ozone-friendly, organic fruit and vegetables, and products that are not tested on animals. Lately, the regional produced goods have been receiving more attention. The short food supply chain (SFSC) opposes the global food supply. Its main goal is to decrease the travel distance of the food and the number of mediators in the sale. It also strengthens the local producers (with higher prices) and develops social relations. One form of the SFSC is the farmer shop. In this alternative, not only is the distance shortened, but face-to-face interaction between consumer and producer is possible [3]. In many branches, the different shopping opportunities on offer can highlight the relation of sellers to the dynamics of open innovation. Not only can macroeconomic factors push the open-minded players towards the implementation of new solutions, but the presence of (supposed) new/unsatisfied consumer needs too. Through the sample of Austria—which is one of the greenest and most developed countries in the world [4]—the authors studied the application of dynamics of open innovation within the SFSC’s players.
The present research aims to fill the gap regarding the marketing innovation of direct sellers. COVID-19 represents a novelty context of the research due to fact that, during the pandemic, the online presence of all businesses had to be increased. The paper is structured as follows: after reviewing the literature on digital marketing, in Section 2, we present the process of data collection, methodology, and demonstrate the sample briefly. Section 3 illustrates the application of the formerly described methods and demonstrates the clusterization of the examined shops, too. In Section 4, the research findings are discussed with the statements of international publications. The Section 5 concludes the results and formulates recommendations for local agricultural businesses.
The innovation aspect of digital marketing tools in the SFSC sector is not widely studied, which obstructs the synthesis of the literature. Therefore, some of the proven and supposed effects of digital marketing-related studies were collected, to stress the relevance of these tools. In many cases, the role of e-marketing channels shows a composite image [5]. One study [6] surveyed business-to-consumer (B2C) managers to estimate the importance of the different digital marketing tools on a 7-point scale, where the higher number meant the greater relevance. According to their answers, 5.4 is the current importance of having a website, and many believed that this is going to be more critical in the future (5.8). The role of social media in organizational communication seems less critical (5), and according to the surveyed leaders, its importance will not change significantly in the future. Having a social media community right now is neutral (3.5), but it will be stressed shortly, according to the correspondents (4.8). The proper reaction to the negative comments through social media (4.9) seems a considerable activity. The surveyed leaders plan to focus on it more (6.1); however, taking advantage of the positive feedback (4.2) is not as important as mitigating the damage of adverse reactions, and they even want to increase the usage of it (5.7). From the above-described analysis, we can see, generally, that the website is considered the first line of online attendance, but the growing importance of social media can be seen as well.
Another work [7] studied 150 firms to see the connection between sales and the usage of different digital marketing channels. Classical online advertising (0.869) and email marketing (0.873) had the highest Pearson correlation coefficients (its value’s absolute range is between 1 and 0, where the higher the rate, the stronger the connection. If this value is close to 0, then there is no connection, in other cases, the number’s sign shows the direction of the connection) at the reliable significance level (0.05). Still, social media (0.84) and SEO (Search Engine Optimization) (0.84) also increased the sales level significantly (0.08 significance level). Based on this research, text messaging, affiliate marketing, and SEA (Search Engine Advertising) did not belong to the significantly effective channels.
According to [8], for B2C companies, approximately 12% of the spending on marketing operations is recommended. The classical channels lose single-digit percentages each year, while the digital marketing spend increases by double-digits year after year. Significantly, email marketing and social media have displaced the television, newspaper, and radio ads, which tend to continue in the future. Email marketing brings quite good results. According to one study [8], more than half of the companies (regardless of their profile) realize 20% of their overall revenue from this channel, and the ROI (return on investment) of it is also high (e.g., Coke’s Facebook ads resulted in ROI above 150%). Another work [9] analyzed the Finnish SMEs’ investment in digital marketing. Based on the respondents, more than every third company allocate less than 5% of their marketing budget to one of the digital marketing channels. In their case, the website, SEO, and social media stay in the first three places. A further study [10] investigated B2C companies’ attitudes toward advertisement focusing on social media. The surveyed companies believed that paid advertising in social media is essential, especially for effective communication; however, they were not satisfied with the coherence and transparency of these sites. It could be the reason why their ads are sporadic on social media. Another publication [11] examined European SMEs’ online marketing activities. Within micro-companies (less than ten employees), social media is the most widespread tool implemented internally (76%). Thirteen percent do not use it, and the rest of the firms outsource it or mix the outsourcing with internal work. It is important to stress that it is the platform’s usage and not investment in ads. The companies manage websites, analytics, and email, while SEO and SEA are less popular. Not only do such companies rarely apply these features, but these tools are often not used at all.
When the same companies asked which tool they would improve in the future, more than 40% would implement significant improvements in SEO. A bit less than 40% would focus on social media and analytics. Nearly one-third of the surveyed firms do not want to improve their SEA at all. According to these companies, the limitation of their online marketing usage comes from the lack of human resources and the absence of relevant skills among the existing workforce.
The above-reviewed works highlight some easy-to-implement marketing-related innovations. The implementation of these simple techniques can have a huge effect on the players’ business models too. The first appearance of this term can be dated back to the 1950s, however, it became popular in the 1990s [12]. According to one study [13], a business model describes how a business creates, delivers, and captures value. Earlier, only those companies with appropriate internal resources could increase their revenue through their innovations (added value) [14]. However, nowadays there is intense competition between leading and start-up companies, despite the latter have limited access to their own R&D, since they can purchase other’s innovations [15]. According to [16], the open-innovation will be dominant in the management of organizations, because, among other factors, the business models [17,18,19], the organizational design and boundaries [20,21,22,23], and the leadership and culture of the businesses [24] adapt to it. A company with strong abilities in dynamic innovation is also able to profitably build and renew its resources, assets, and capabilities, and reorganize them as necessary to respond to market changes [25].
This ability could be well studied in Austria during the pandemic because in 2019 the Austrian consumers preferred to buy local products directly from the producers [26], however, one year later, during the pandemic, the quantity of all the examined goods purchased decreased from the direct sellers [27,28]. This can be explained by the one-stop-shop regulation (only those retailers could work, where “everything” could be bought), which could open up opportunities for business model innovation. This regulation (macroeconomic factor) was the “last warning” for the producers when they still could recover their missing online attendance.
2. Materials and Methods
This section provides a brief insight into the data collection process, the introduction of applied methods, a short presentation of the sample, and the used framework.
2.1. Data Collection
The study is based on the search engine of MEIN-BAUERNHOF [29]. It is one of Austria’s most extensive online farmer shops databases. The website offers the same service in Germany, Switzerland, Luxembourg, Italy, and the Netherlands. The farmers can register there for free, adding a point of sale, a short description, and contact information with business hours. The list of available products and the type of farming could also be recorded. Aggregately, more than 2745 Austrian farmer shops are found in this database. The proportion of conventional and organic shops is not far apart. On the website, 57% of the shops were traditional, and 43% were organic.
Based on one study [30], 36,000 direct sellers exist in Austria. However, the exact number of farmer shops cannot be defined. If we compare Germany’s data (10,280) to Austria’s, we can suppose that the country which is four times smaller has four times fewer farmer shops, so based on this assumption, the database size should be close to the reality.
Before determining the sample size, the data were weighted to ensure that the sample was representative in terms of primary activity and region. The details of the weighted model are seen in Table A2 (Appendix A).
The sample’s descriptive statistics are based on 1589 conventional farmer shops’ data, which is the population of this research. Since this study is representative, it reduces the number of analyzed shops, so the proper definition of sample size is essential. Based on the sample size determination table presented in another study [31], which can be considered a fundamental work on representativeness, 310 farmer shops were defined. Krejcie and Morgan’s sample size calculation is based on the following equation:
where:
s = required sample size;
Χ2 = the table value of chi-square for 1 degree of freedom at the desired confidence level;
N = the population size;
P = the population proportion;
d = the degree of accuracy expressed as a proportion;
The classification of the shops is based on the given primary activities of the website. We should consider that the farmer shops regularly offer more specialized products in parallel (e.g., eggs and meat or fruits and vegetables). To identify the shops’ main activity, we had to classify them according to their introductions, name, logo, and the available online surfaces where they could emphasize their profile. The data were collected between 14 October 2021 and 17 November 2021.
The limitation of this study can be the free registration on the site, which could cause the over-representation of “internet-based” shops. Duplicated registrations also could appear, and we should consider the eliminated shops that are not deleted from the database. It has to be emphasized that all the recorded farms have to produce and sell their goods directly to the consumers, because officially these are collected by the website, however, improper registrations also could be found [29].
2.2. Methods
The collected data was studied by principal component analysis (PCA). It defines the most important directions of variability in a data matrix and converts the original variables into new axes. These new axes are not correlated; that is how the total variation in the data in only a few principal components could be mainly demonstrated [32]. The starting point of PCA is a database of p variables and n measurements, as seen below:
| X1 | X2 | ⋯ | Xp | |
| 1 | X12 | X12 | ⋯ | X1p |
| 2 | X21 | X22 | ⋯ | X2p |
| ⋮ | ⋮ | ⋮ | ⋱ | ⋮ |
| n | Xn1 | Xn2 | ⋯ | Xnp |
The first principal component is the next linear combination of the variables :
which varies from measurement to measurement. The only condition is that the coefficients sum squared must satisfy that:
This condition on ensures that the variance of will be as large as possible. If no such condition were imposed, could be increased simply by increasing any value. This is based on the fact that, for independent variables, sum variance is formed by quadratic weights:
The second principal component is a linear combination of the variables.
Two conditions must be satisfied: first, the sum of the coefficients squared must fulfill
and thus will be as large as possible, and secondly, and must not be correlated. The third principal component is a linear combination of the variables.
It must satisfy the following conditions: on the one hand, will be maximal if, for the sum of coefficients squared, it is fulfilled that
on the other hand, cannot correlate with and [33]. The so-identified components used as the variables of Ward’s hierarchical clustering method. The applied agglomerative hierarchical procedure puts all the analyzed data at the beginning in separated groups, and step by step, they are joined according to the different sizes between objects. At the end of this process, all the objects belong to one group [34]. The suggested number of the classes is defined as the needed number of the clusters in the K-means method. A non-hierarchical clustering method groups the data into several clusters according to their similarity. The clusters’ labels are determined by the counted distances between each cluster center. These calculations can be done by Euclidean, Manhattan, or Chebychev distance. In the current work, in accordance with the published scientific articles, Euclidean distance was used. The applied method aims to minimize the sum of squared distances between all the points and cluster centers, which is the reason why it is essential to detect and remove outliers [35,36].
2.3. The Sample
The share of the farmer shops according to their primary activity shows major differences. Most farmer shops deal with meat (23%), but fruits (17%) and vegetables (15%) are also often proffered. The high share of “other” (11%) could be explained by the high amount of housing services, which previously was in many cases just an extra opportunity and not a primary activity. The lowest share of farmer shops belongs to the category of eggs (4%). Based on the used search engine, farmer shops focusing on mushrooms, pasta, fish, and non-alcoholic products are less represented. These low-share stores can cumulatively be named “smaller shops”. Their share is 5%.
When we examine the number of farmer shops according to their location, we can observe a vast difference between the regions (Figure 1). The center part of Austria has the highest number of registered farmer shops, while to lowest could be found in the capital. The different shares could be explained by many factors, but this is not the issue of the current research.
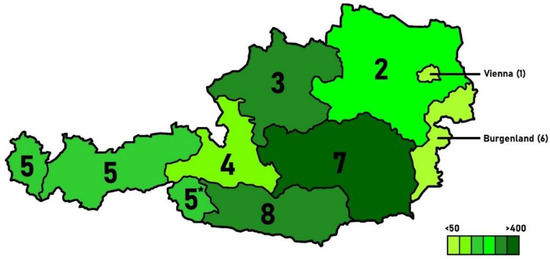
Figure 1.
The number of farmer shops by region according to their postal code.
2.4. The Framework
One research study [37] established the research framework, which examined the Greek Food SMEs with it (Table 1). This work has four categories and 25 attributes used to evaluate the examined farmer shops’ online surfaces. Dummy variables evaluated the registered shops.

Table 1.
The variables on which the evaluation is based.
Since analyzing all the digital marketing tools (online ads, SEM, affiliate marketing, direct marketing, social media ads) is hardly done, this paper is concentrated on the usage of the above-defined platforms and online stores.
3. Results
Clustering is obligatory to achieve a general overview and formulate statements and suggestions in line with the analyzed farmer shops’ innovation activity. Using dummy variables during this method is not the most appropriate idea, since the Euclidean distance meant that to overcome the symmetry and break the ties in any reasonable way is hardly feasible. Despite these criticisms, the analyzed variables cannot be measured properly; however, the required differences could be well demonstrated.
Principal component analysis (PCA) was used to reduce the dataset’s dimensionality and define the variables for the classification. According to the Kaiser–Meyer–Olkin measure of sampling adequacy, the sample is ideal (0.862) for PCA. To identify the right number of components, the Kaiser’s rule was used. According to this measurement (Table 2), the first seven components should be used, which would explain 77% of the variance since their eigenvalues are greater than 1.
Table 2.
Principal Component Analysis.
However, the screen plot Figure A1 (Appendix A) indicates that after the third component, the graph starts to be flat. Even though the original framework was divided into four factors, separating it into three is more obvious based on the plot, and it still explains 57% of the variance.
After the PCA, three new categories/main components were determined. The distribution of the attributes changed significantly, as seen in Table A1 (Appendix A). The so-called “Basic” component includes the contact information, some farm- and product-related details and the prices from the online store (product and delivery), as well as the delivery time. In addition, Facebook and Instagram also belong to this category. The “Extra” component also could be named “convenience”, because card payment and identification were listed here, as well as the job opportunities. The “Marketing” category, meanwhile, contained YouTube, Twitter, Sign-up, and Newsletter. Based on these components, hierarchical clustering was placed. Ward’s method was applied to clarify the ideal number of clusters; however, the classification was done by the K-means method since the hierarchical clustering instead used “complementary” rather than non-hierarchical methods [38]. The statistical test identified one outlier, but the falsely highlighted shop was just an extreme point since nearly all the examined attributes were available in its case. Since there was a significant gap between the coefficients of the Agglomeration Schedule and its visualization, three clusters were defined. However, the researchers’ intuition suggested a higher number of clusters since, during the data collection, it became clear that the used digital marketing tools by the farmer shops are missing differently. Therefore, because of the high share of these digitally underdeveloped surfaces’ distortion effects, the authors did not find proper the three clusters that were suggested by Ward’s method. Several publications [39,40,41] were made in the field of marketing communications of SMEs, and these papers created the theoretical background in the estimation of ideal cluster numbers. All of these studies defined four groups. On the other hand, because more than five clusters are not optimal during the classification [35], the methodology was run with different clusters. Pseudo F statistic was used to identify which total number of groups statistically fits better to the database, and it proved the accuracy of the theoretical assumption (Table 3).
Table 3.
Pseudo F statistic.
When the F value decreases, the within-cluster variance stays static/increases, or the between-cluster variance decreases [42]. The F value of “Extra” decreased (compared to the case when fewer clusters were defined), but the F value of the “Basic” and “Marketing” increased, and all these values were measured at a 0.001 significance level. The final cluster centers and the included number of shops that were distinguished are seen in Table 4.
Table 4.
The final cluster centers and clusters.
The shortest distance between final cluster centers was measured between the “Star” and the “Developing” groups. This means a farmer shop is not just existing in the digital world but is open for innovation and the highest level is easily accessible. The widest distance between final cluster centers was located between the “Offline” and the “Star” groups, which could be explained by the massive gap in the mindsets of the farmers. Based on the specified characteristics of the sample, the following type of online farmer shops could be distinguished:
- Offline: These shops are not available online at all. They are not innovative.
- Beginner: These shops have a website, maybe they use one of the popular social media platforms (Facebook, Instagram) or have a primitive online shop (order through email). Typically, these farmer shops do not provide online high consumer satisfaction. These players have basic knowledge about trends, however, do not want or cannot implement new approaches.
- Developing: These shops offer nearly two-thirds of the basic features, providing higher consumer satisfaction. Modern online shops are already available at this level. Still, the comfort (card) and the security (identification) during the payment are not included. With some “extra” or “marketing” activity, they could easily become challengers or even stars. They have already invested in innovative solutions; however, these were not extensive enough.
- Star: These farmer shops are the most innovative since they adapted mostly to the new circumstances. Only these players provide some “Extra” and cover nearly the whole “Basic” features spectrum. Their online shops on their sites make ordering easy; however, they do not seek out consumers. It is important to stress that even the “best” group has a low performance of “Marketing”. Newsletter, Sign-up, and FAQ easily could be implemented, which could increase the service level. However, one YouTube channel could significantly increase their online appearance.
The ANOVA table (Table 5) was used to determine which variable differentiates the most between the clusters.
Table 5.
The variables effect on classifying.
The F value indicates that the “Basic” factor has the highest F value (4449.5), which means that this variable has the most significant influence on the formation of clusters. This observation strengthens the statement that the first step into the online world is decisive for the farmer shops. According to the same table, “Marketing” has the lowest effect on classifying. It could be explained by the lack of online attendance, which mitigates the diversifying impact of marketing. We must point out the high proportion of non-innovative farmer shops. The first cluster (offline) contains more than 50% of the shops. The “Beginner” group could be an “ideal one” for many farmer shops since the profitable online sale of perishable products (need of an online store) in the case of farmers raises questions, but only one in four of the examined shops belonged to this cluster. The developing cluster provides more basic features, but zero extra is given, and the non-existent marketing activity does not let these shops become stars. Only 13% of the examined shops belong to this cluster, but the weak online services would be easy and, in many cases, free to improve in order to reach even the “challenger” position. We can say less than 8% of the studied shops offer the highest online service. It cannot properly be identified when the members of this cluster changed/extended their business model through the dynamic of open innovation, but at the date of data collection, they operated a more digital model. It has to be emphasized that only one shop provides everything to a comfortable online information and food purchasing service (in this case, the multilanguage surface, job opportunities, and FAQ were not available). This fake outlier lights up how well a business can differentiate itself through the innovation. The missing services, in many cases, could easily be built-in, but the examined direct sellers even ignore the retention of the existing consumers.
4. Discussion
Despite the topic of digital marketing being widely studied, its application for business issues, especially in the agri-food sector, is incomplete. To get any basis for the comparison the main components of the studied e-marketing aspect were separately confronted with other studies. One work [43] studied farmers’ usage of social media. The article examined Welsh lamb and beef producers in the present issue. Less than 6% of the whole sample used social media for farm issues and the authors identified the crucial role of age in it. According to their work, the younger farmers use this opportunity more. Another paper [44] analyzed the social media penetration in Spain. The researchers compared the conventional and organic olive oil producers’ active social media accounts. The measured difference between them (28%) was examined with the chi-squared test that stated the higher number of organic farms’ active social media accounts could not be explained by chance. The further examination of the data with the Mann–Whitney U test identified the difference in the distribution of posts, so not only was the number of registered organic olive oil accounts higher, but their online activity was too. The interaction rates (likes, engagement rate, followers, replies) were also statistically significant in favor of organic farms. The researchers emphasize the limited demand for organic olive oil as a reason why these producers try to apply all the available forms of marketing. In consonance with our findings, these papers highlight the low share of social media usage within the agricultural companies. The age and the type of farming also could affect the application of these platforms, however the current work focused on a general overview.
One study [45] analyzed the e-commerce aspect of dairy farms in Slovakia. The researchers stated that the farmers prefer to sell their goods directly from the yard, while the less popular marketing channel was the online shop. Eight out of ten surveyed did not use it at all, which supposes the total lack of e-commerce opportunity in these cases. The study explained this phenomenon with the consumers’ need for personal or at least telephone contact with the farmer. Another work [46] is based on the Local Foods Marketing Practices Survey (LFMPS) that was recorded by USDA’s National Agricultural Statistics Service. The authors studied the direct marketing opportunities for rural farms in the USA. The study revealed only eight percent of the farms that sell directly to the consumers had an online marketplace. These producers’ sales were on average four times higher than farms without online shops, which sold vegetables with lower probability. Similarly to our findings, the formerly cited works also disclosed the low share of online stores within the direct sellers.
In international publications, we can find a couple of reasons why smaller shops were not forced yet to be presented online. According to [47], only certain food is purchased through the internet since the consumers prefer to buy non-perishable food products. Another reason could be lower turnover because offline shops generate higher sales [48]. These smaller stores have to consider the costs of logistics and especially the return of perishable products, too [49,50]. This could be the reason why even in the USA, only 8% of farmers who sell food direct to the consumers had online marketplaces in 2015. Those who (re)acted quickly and entered into the online marketing and sales during the pandemic could increase their turnover dramatically [51]. According to one study [52], between August 2019 and May 2020 in the USA, the sales of local and regional food e-commerce increased by 360%, the number of orders became nearly two times higher, and the average basket size increased by 71%. This pandemic taught the companies that when the customers are forced to change their purchasing behavior they move towards online shopping [53], so they have to be presented online, however, according to [54], regarding the agricultural SMEs, despite of the current digital age, the role of word-of-mouth (WoM) is still crucial.
The above-collected studies show a general low intention for digital innovation, even the significant effect of digital marketing is measured. Since the business model [55], design [56,57,58,59] in addition the leadership and culture [60,61] of the organizations’ are also closely related to dynamic innovation, these factors also could affect this phenomenon. In the current case could be supposed that the Austrians do not want to shop online, however according to the [62], 24% of the surveyed want to keep their new online habits created last year. The highly evaluated simple usage (24%), the non-stop availability (17%), and the great assortment (16%) of the web stores impressed the consumers the most. So, these features could presumably increase the competitiveness and sales in the SFSC branch.
We have to stress the limitation of this paper too. First of all, the used representative database could contain duplicated data and information about already closed farmer shops. A comprehensive analysis of dynamic innovation from the perspective of digital marketing is hardly feasible since the researchers cannot observe the exact date of business model shifts. The current work measured only the “basics” of e-marketing, which are easily and (in most cases) freely accessible for every farm. The usage of dummy variables also could worsen the results, because the clustering is ideally based on non-binary variables. As a future research direction, the characterization of the farms’ leaders could be given because many articles have studied the relation between the leaders’ character and the applied marketing strategy [53,54,63,64]. However, a comprehensive analysis of farm leaders has not yet been published. Nowadays, food sharing and social supermarket businesses tend to grow (in the food sector), especially in developed countries. Since their “charity” work is rather focused on the promotion of sustainability and waste reduction—the implementation of this aspect could address new consumers for the farmer shop too. The study of effective waste management in this branch could be an innovative direction.
5. Conclusions
Online retail has been rising, and the appearance of COVID-19 speeded up its growing tendency. The pandemic did not affect only this, but it highlighted the importance of SFSC also. The current work studied through one of the greenest countries’ representative samples how the farmer shops manage their digital marketing. The analyzed producers’ online marketing activity revealed serious shortcomings that can significantly weaken their performance even in a short period. Based on the research framework, the applied principal component analysis defined three new categories. The factor loads exposed that not only a working website and a working online store but also some of the social media platforms (Facebook, Instagram) are considered “Basic” marketing tools. Despite this, in many cases, even the latter-mentioned free and easy-to-use surfaces were not used. The high share of offline shops characterizes the low representation of digital innovation well within the studied stores. The direction of development can be found in the extension of the “Basic” tools, while the implementation of “Marketing” tools such as Twitter, YouTube, or the Sign-up function on the website is not used at all. The “Extra” features such as identification during the payment or card payment could be accessible if a “Star” shop is found, however, the probability of this is very low. The disclosed phenomena highlight the unexploited fields and thus the potential directions regarding digital innovation in the SFSC sector, which should gain more attention from the producers’ side. Since globalization integrates the economy of all countries around the world, the appearance of unsteady circumstances (pandemics, economic crises, and war conflicts) within one of the members can cause significant effects on the whole globe. Although the pandemic taught us how harmful it can be if the supply chains are long, the reorganization of these complex networks is resource-intensive. The macroeconomic factors change fast and, in some cases, even the governments cannot control them, so the companies have to learn to adapt to the constantly changing conditions. Thus, we can conclude that the open mindset of producers is essential because dynamic innovation can be one of their businesses’ success factors.
Author Contributions
Conceptualization, I.F., J.P., J.F.; methodology, I.F., P.L.; software, A.C., J.P.; validation, I.F.; formal analysis, A.C.; investigation, A.C.; resources, A.C.; data curation, I.F.; writing—original draft preparation, A.C., J.P.; writing—review and editing, I.F., P.L.; visualization, A.C.; supervision, I.F.; project administration, I.F., P.L.; funding acquisition, I.F., J.F. All authors have read and agreed to the published version of the manuscript.
Funding
This research received no external funding.
Institutional Review Board Statement
Not applicable.
Informed Consent Statement
Not applicable.
Data Availability Statement
Not applicable.
Conflicts of Interest
The authors declare no conflict of interest.
Appendix A

Figure A1.
Scree plot of the eigenvalues. Note: 24 attributes defined since consumer feedback was not used at all by any shops.
Figure A1.
Scree plot of the eigenvalues. Note: 24 attributes defined since consumer feedback was not used at all by any shops.

Table A1.
The defined main components and their loadings to evaluate the studied farmer shops’.
Table A1.
The defined main components and their loadings to evaluate the studied farmer shops’.
| Basic | Extra | Marketing | |
|---|---|---|---|
| 0.895 | −0.380 | −0.086 | |
| 0.882 | −0.397 | −0.089 | |
| Phone | 0.896 | −0.392 | −0.090 |
| Home | 0.889 | −0.366 | −0.086 |
| Sitemap | 0.896 | −0.398 | −0.093 |
| Multilingual | 0.225 | 0.083 | −0.117 |
| FAQ | 0.068 | −0.117 | 0.341 |
| Logo, name | 0.890 | −0.393 | −0.089 |
| History | 0.714 | −0.152 | 0.097 |
| Certifications | 0.333 | −0.160 | 0.117 |
| HR | 0.564 | 0.015 | 0.240 |
| Job | 0.045 | −0.114 | −0.031 |
| E-commerce | 0.734 | 0.502 | −0.210 |
| Prices | 0.727 | 0.534 | −0.202 |
| Card | 0.561 | 0.625 | −0.014 |
| Identification | 0.528 | 0.621 | −0.014 |
| Delivery time | 0.538 | 0.524 | −0.065 |
| Delivery cost | 0.704 | 0.582 | −0.176 |
| 0.668 | −0.038 | 0.124 | |
| 0.221 | −0.017 | 0.643 | |
| YouTube | 0.336 | 0.122 | 0.387 |
| 0.392 | 0.065 | 0.233 | |
| Sign-up | 0.205 | 0.248 | 0.727 |
| Newsletters | 0.217 | 0.016 | 0.532 |
Note: Based on the Principal Component Analysis these loadings were defined.
Table A2.
Number of the examined farmer shops according to their region and primary activity.
Table A2.
Number of the examined farmer shops according to their region and primary activity.
| Activity | Region | ||||||||
|---|---|---|---|---|---|---|---|---|---|
| 1 | 2 | 3 | 4 | 5 | 6 | 7 | 8 | 5 * | |
| Vegetable | 1 | 5 | 3 | 8 | 4 | 1 | 1 | 16 | 7 |
| Fish | 0 | 0 | 0 | 0 | 0 | 0 | 0 | 2 | 1 |
| Dairy products | 0 | 1 | 0 | 8 | 1 | 3 | 0 | 8 | 5 |
| Alcoholic beverages | 0 | 2 | 2 | 3 | 0 | 0 | 1 | 23 | 1 |
| Spice | 0 | 2 | 1 | 2 | 0 | 1 | 1 | 12 | 1 |
| Fruit | 0 | 2 | 6 | 12 | 0 | 1 | 1 | 27 | 5 |
| Egg | 0 | 1 | 1 | 3 | 0 | 1 | 0 | 3 | 3 |
| Non-alcoholic b. | 0 | 0 | 1 | 3 | 0 | 0 | 1 | 2 | 2 |
| Mushroom | 0 | 0 | 0 | 0 | 0 | 0 | 0 | 0 | 0 |
| Other | 0 | 1 | 1 | 7 | 10 | 1 | 0 | 11 | 12 |
| Meat | 0 | 1 | 6 | 19 | 4 | 4 | 2 | 22 | 14 |
| Pasta | 0 | 0 | 0 | 0 | 0 | 0 | 0 | 1 | 0 |
| Number of shops | 1 | 15 | 20 | 65 | 11 | 13 | 7 | 127 | 51 |
The regions are represented with numbers from 1–5 * according to their postal codes, as it was explained in the “sample” chapter.
References
- Fisk, G. Criteria for a Theory of Responsible Consumption. J. Mark. 1973, 37, 24–31. [Google Scholar] [CrossRef]
- Brundtland, G.H. Our common future-Call for action. Environ. Conserv. 1987, 14, 291–294. [Google Scholar] [CrossRef]
- Ortner, M. Bäuerliche Direktvermarktung von A bis Z. 2017. Available online: https://ooe.lko.at/b%C3%A4uerliche-direktvermarktung-von-a-bis-z+2400+2949784. (accessed on 23 May 2022).
- Greiling, D.; Grüb, B. Sustainability reporting in Austrian and German local public enterprises. J. Econ. Policy Reform 2014, 17, 209–223. [Google Scholar] [CrossRef]
- Mitchell, R.W.; Wooliscroft, B.; Higham, J. Sustainable market orientation: A new approach to managing marketing strategy. J. Macromarket. 2010, 30, 160–170. [Google Scholar] [CrossRef]
- Herhausen, D.; Miočević, D.; Morgan, R.E.; Kleijnen, M.H.P. The digital marketing capabilities gap. Ind. Mark. Manag. 2020, 90, 276–290. [Google Scholar] [CrossRef]
- Afrina, Y.; Sadia, T.; Kaniz, F. Effectiveness of Digital Marketing in the Challenging Age: An Empirical Study. Int. J. Manag. Sci. Bus. Adm. 2015, 1, 69–80. [Google Scholar]
- Kaur, S.J. Reviewing Investment Trends &Roi of Digital Marketing Channels in New Age Marketing. Int. J. Adv. Innov. Res. 2019, 6, 173. [Google Scholar]
- Taiminen, H.; Karjaluoto, H. The usage of digital marketing channels in SMEs. J. Small Bus. Enterp. Dev. 2015, 22, 633–651. [Google Scholar] [CrossRef]
- Silva, S.C.E.; Duarte, P.A.O.; Almeida, S.R. How companies evaluate the ROI of social media marketing programmes: Insights from B2B and B2C. J. Bus. Ind. Mark. 2020, 35, 2097–2110. [Google Scholar] [CrossRef]
- Cadiddu, F.; Moi, L.; Pitrová, J.; Pilař, L.; Jääskeläinen, P. Online Marketing Challenges of Micro and Small Companies, Xamk Beyond 2020. Your Serv.–Bus. Dev. Coop. Sustain. 2020, 2020, 67–77. [Google Scholar]
- DaSilva, C.M.; Trkman, P. Business model: What it is and what it is not. Long Range Plan. 2014, 47, 379–389. [Google Scholar] [CrossRef]
- Osterwalder, A.; Pigneur, Y. Business Model Generation: A Handbook for Visionaries, Game Changers, and Challengers; John Wiley & Sons: Hoboken, NJ, USA, 2010. [Google Scholar]
- Hossain, M.; Islam, K.M.Z.; Sayeed, M.A.; Kauranen, I. A comprehensive review of open innovation literature. J. Sci. Technol. Policy Manag. 2016, 7, 2–25. [Google Scholar] [CrossRef]
- Chesbrough, H. Managing open innovation. Res. Manag. 2004, 47, 23–26. [Google Scholar] [CrossRef]
- Trott, P.; Hartmann, D.A.P. Why’open innovation’is old wine in new bottles. Int. J. Innov. Manag. 2009, 13, 715–736. [Google Scholar] [CrossRef]
- Chesbrough, H. The logic of open innovation: Managing intellectual property. Calif. Manag. Rev. 2003, 45, 33–58. [Google Scholar] [CrossRef]
- Chesbrough, H.W. Why companies should have open business models. MIT Sloan Manag. Rev. 2007, 48, 22. [Google Scholar]
- Chesbrough, H.; Schwartz, K. Innovating business models with co-development partnerships. Res. Manag. 2007, 50, 55–59. [Google Scholar] [CrossRef]
- Chesbrough, H.W. Open Innovation: The New Imperative for Creating and Profiting from Technology; Harvard Business Press: Boston, MA, USA, 2003. [Google Scholar]
- Dahlander, L.; Wallin, M.W. A man on the inside: Unlocking communities as complementary assets. Res. Policy 2006, 35, 1243–1259. [Google Scholar] [CrossRef]
- Dittrich, K.; Duysters, G. Networking as a means to strategy change: The case of open innovation in mobile telephony. J. Prod. Innov. Manag. 2007, 24, 510–521. [Google Scholar] [CrossRef]
- Jacobides, M.G.; Billinger, S. Designing the boundaries of the firm: From “make, buy, or ally” to the dynamic benefits of vertical architecture. Organ. Sci. 2006, 17, 249–261. [Google Scholar] [CrossRef]
- Dodgson, M.; Gann, D.; Salter, A. The role of technology in the shift towards open innovation: The case of Procter & Gamble. R D Manag. 2006, 36, 333–346. [Google Scholar]
- Teece, D.J. Business models and dynamic capabilities. Long Range Plan. 2018, 51, 40–49. [Google Scholar] [CrossRef]
- RollAMA (b) Motivanalyse August 2019. Available online: https://amainfo.at/fileadmin/user_upload/Fotos_Dateien/amainfo/Presse/Marktinformationen/Allgemein/Konsumverhalten_Allgemein.pdf (accessed on 12 March 2022).
- RollAMA (a) RollAMA Sonderauswertung Direktvermarktung. 2019. Available online: https://b2b.amainfo.at/fileadmin/user_upload/images/NWK/Bilder_Blogbeiträge/RollAMA_Präsentation_Direktvermarktung_und_Regionalität.pdf (accessed on 12 March 2022).
- Agrarmarkt Austria Marketing RollAMA Total Entwicklung der RollAMA Märkte. 2021. Available online: https://amainfo.at/konsumenten/marktinfo/marktinformationen/marktentwicklung-details (accessed on 2 October 2021).
- MEIN-BAUERNHOF. WWW.MEIN-BAUERNHOF.DE. 2021. Available online: https://mein-bauernhof.de (accessed on 17 November 2021).
- Österreich, L. Im Spannungsfeld Zwischen Wunsch und Wirklichkeit; 2020. Available online: https://www.lko.at/lk-österreich-veröffentlicht-jahresbericht-2020-21+2400+3418399 (accessed on 2 October 2021).
- Krejcie, R.V.; Morgan, D.W. Determining Sample Size for Research Activities. Educ. Psychol. Meas. 1970, 30, 607–610. [Google Scholar] [CrossRef]
- Smith, G.L. Principal component analysis: An introduction. Anal. Proc. R. Soc. Chem. 1991, 28, 150–151. [Google Scholar]
- Joliffe, I.T.; Morgan, B. Principal component analysis and exploratory factor analysis. Stat. Methods Med. Res. 1992, 1, 69–95. [Google Scholar] [CrossRef] [PubMed]
- Žmuk, B. Quality of Life Indicators in Selected European Countries: Hierarchical Cluster Analysis Approach. Croat. Rev. Econ. Bus. Soc. Stat. 2015, 1, 42–54. [Google Scholar] [CrossRef]
- Amri, Y.; Fadhilah, A.L.; Fatmawati; Setiani, N.; Rani, S. Analysis Clustering of Electricity Usage Profile Using K-Means Algorithm. IOP Conf. Ser. Mater. Sci. Eng. 2016, 105, 12020. [Google Scholar] [CrossRef]
- Bansal, A.; Sharma, M.; Goel, S. Improved K-mean Clustering Algorithm for Prediction Analysis using Classification Technique in Data Mining. Int. J. Comput. Appl. 2017, 157, 35–40. [Google Scholar] [CrossRef]
- Vlahvei, A.; Notta, O.; Grigoriou, E. Establishing a Strong Brand Identity Through a Website: The Case of Greek Food SMEs. Procedia Econ. Financ. 2013, 5, 771–778. [Google Scholar] [CrossRef][Green Version]
- Fahim, A. K and starting means for k-means algorithm. J. Comput. Sci. 2021, 55, 101445. [Google Scholar] [CrossRef]
- Ližbetinová, L.; Štarchoň, P.; Lorincová, S.; Weberová, D.; Pruša, P. Application of cluster analysis in marketing communications in small and medium-sized enterprises: An empirical study in the Slovak Republic. Sustainability 2019, 11, 2302. [Google Scholar] [CrossRef]
- Gabrielli, V.; Balboni, B. SME practice towards integrated marketing communications. Mark. Intell. Plan. 2010, 28, 275–290. [Google Scholar] [CrossRef]
- Gellynck, X.; Banterle, A.; Kühne, B.; Carraresi, L.; Stranieri, S. Market orientation and marketing management of traditional food producers in the EU. Br. Food J. 2012, 114, 481–499. [Google Scholar] [CrossRef]
- Caliñski, T.; Harabasz, J. A Dendrite Method Foe Cluster Analysis. Commun. Stat. 1974, 3, 1–27. [Google Scholar] [CrossRef]
- Morris, W.; James, P. Social media, an entrepreneurial opportunity for agriculture-based enterprises. J. Small Bus. Enterp. Dev. 2017, 24, 1028–1045. [Google Scholar] [CrossRef]
- Bernal Jurado, E.; Fernández Uclés, D.; Mozas Moral, A.; Medina Viruel, M.J. Agri-food companies in the social media: A comparison of organic and non-organic firms. Econ. Res. Istraz. 2019, 32, 321–334. [Google Scholar] [CrossRef]
- Horská, E.; Petriľák, M.; Šedík, P.; Nagyová, Ľ. Factors Influencing the Sale of Local Products through Short Supply Chains: A Case of Family Dairy Farms in Slovakia. Sustainability 2020, 12, 8499. [Google Scholar] [CrossRef]
- O’Hara, J.K.; Low, S.A. Online Sales: A Direct Marketing Opportunity for Rural Farms? J. Agric. Appl. Econ. 2020, 52, 222–239. [Google Scholar] [CrossRef]
- Rogus, S.; Guthrie, J.F.; Niculescu, M.; Mancino, L. Online Grocery Shopping Knowledge, Attitudes, and Behaviors Among SNAP Participants. J. Nutr. Educ. Behav. 2019, 52, 539–545. [Google Scholar] [CrossRef]
- Haseba, H.; Martin, S. The Impact of Demographic Variables and Consumer Shopping Orientations on the Purchasing Preference for Different Product Categories in the Context of Online Grocery Shopping. J. Mark. Consum. Res. 2019, 52, 21–32. [Google Scholar] [CrossRef]
- Rohmer, S.U.K.; Claassen, G.D.H.; Laporte, G. A two-echelon inventory routing problem for perishable products. Comput. Oper. Res. 2019, 107, 156–172. [Google Scholar] [CrossRef]
- Martinez, O.; Tagliaferro, B.; Rodriguez, N.; Athens, J.; Abrams, C.; Elbel, B. EBT Payment for Online Grocery Orders: A Mixed-Methods Study to Understand Its Uptake among SNAP Recipients and the Barriers to and Motivators for Its Use. J. Nutr. Educ. Behav. 2018, 50, 396–402.e1. [Google Scholar] [CrossRef] [PubMed]
- Roggeveen, A.L.; Sethuraman, R. How the COVID-19 Pandemic May Change the World of Retailing. J. Retail. 2020, 96, 169–171. [Google Scholar] [CrossRef]
- Thilmany, D.; Canales, E.; Low, S.A.; Boys, K. Local Food Supply Chain Dynamics and Resilience during COVID-19. Appl. Econ. Perspect. Policy 2021, 43, 86–104. [Google Scholar] [CrossRef]
- Sharma, A.; Jhamb, D. Changing Consumer Behaviours towards Online Shopping-an Impact of COVID-19. Acad. Mark. Stud. J. 2020, 24, 1–10. [Google Scholar]
- Wicaksono, T.; Nugroho, A.D.; Lakner, Z.; Dunay, A.; Illés, C.B. Word of Mouth, Digital Media, and Open Innovation at the Agricultural SMEs. J. Open Innov. Technol. Mark. Complex. 2021, 7, 91. [Google Scholar] [CrossRef]
- Van der Meer, H. Open innovation–the Dutch treat: Challenges in thinking in business models. Creat. Innov. Manag. 2007, 16, 192–202. [Google Scholar] [CrossRef]
- Yun, J.J.; Zhao, X.; Jung, K.; Yigitcanlar, T. The culture for open innovation dynamics. Sustainability 2020, 12, 5076. [Google Scholar] [CrossRef]
- Christensen, J.F.; Olesen, M.H.; Kjær, J.S. The industrial dynamics of Open Innovation—Evidence from the transformation of consumer electronics. Res. Policy 2005, 34, 1533–1549. [Google Scholar] [CrossRef]
- Vlaisavljevic, V.; Medina, C.C.; Van Looy, B. The role of policies and the contribution of cluster agency in the development of biotech open innovation ecosystem. Technol. Forecast. Soc. Chang. 2020, 155, 19987. [Google Scholar] [CrossRef]
- Tao, J.; Magnotta, V. How air products and chemicals “identifies and accelerates”. Res. Manag. 2006, 49, 12–18. [Google Scholar] [CrossRef]
- Fleming, L.; Waguespack, D.M. Brokerage, boundary spanning, and leadership in open innovation communities. Organ. Sci. 2007, 18, 165–180. [Google Scholar] [CrossRef]
- Witzeman, S.; Slowinski, G.; Dirkx, R.; Gollob, L.; Tao, J.; Ward, S.; Miraglia, S. Harnessing external technology for innovation. Res. Manag. 2006, 49, 19–27. [Google Scholar] [CrossRef]
- Omar, H. Nets E-Com Report. 2020. Available online: https://www.nets.eu/Media-and-press/news/Documents/Nets-e-commerce-2020-international.pdf (accessed on 7 February 2022).
- Olanrewaju, A.S.T.; Whiteside, N.; Hossain, M.A.; Mercieca, P. The Influence of Social Media on Entrepreneur Motivation and Marketing Strategies in a Developing Country; Springer International Publishing: New York, NY, USA, 2018. [Google Scholar]
- Deelert, J.; Jaturat, N.; Kuntonbutr, C. the Mediating Effect of Erp Management on the Relationship Between Toe Framework and Organizational Performance. Int. J. Manag. 2020, 11, 391–414. [Google Scholar] [CrossRef]

Publisher’s Note: MDPI stays neutral with regard to jurisdictional claims in published maps and institutional affiliations. |
© 2022 by the authors. Licensee MDPI, Basel, Switzerland. This article is an open access article distributed under the terms and conditions of the Creative Commons Attribution (CC BY) license (https://creativecommons.org/licenses/by/4.0/).