Article

Business Digital Maturity in Europe and Its Implication for Open Innovation

by
Magdalena Tutak
1,* and
Jarosław Brodny
2,*
1
Faculty of Mining, Safety Engineering and Industrial Automation, Silesian University of Technology, 44-100 Gliwice, Poland
2
Faculty of Organization and Management, Silesian University of Technology, 44-100 Gliwice, Poland
*
Authors to whom correspondence should be addressed.
J. Open Innov. Technol. Mark. Complex. 2022, 8(1), 27; https://doi.org/10.3390/joitmc8010027
Submission received: 21 December 2021 / Revised: 17 January 2022 / Accepted: 18 January 2022 / Published: 19 January 2022

Abstract

:
This paper presents the results of a study aimed at assessing the level of business digital maturity in Europe and at analyzing similarities between companies in terms of implemented Industry 4.0 technologies. The digital transformation of production and service enterprises has become a common direction of development for all economic sectors. The very idea of Industry 4.0 has become synonymous with innovation and is the basis for business development. The role and importance of these transformations are also recognized by the EU which has been promoting and supporting the development of an innovative digital economy for many years. However, individual EU countries differ in terms of digital business maturity due to the implementation of Industry 4.0 technology. The article addresses this problem by presenting the results of a comprehensive study of the implementation of Industry 4.0 digital technologies in enterprises in the EU-27 countries and by assessing similarities between these countries in terms of these technologies. The similarity analysis was carried out using the k-means method. The Gini coefficient and Lorenz curves were utilized to determine the unevenness of the implementation of these technologies in individual countries, and the Weighted Aggregated Sum Product Assessment method was used to assess the level of digital maturity. The research was based on eight selected determinants (indicators) that characterize the most important technologies related to Industry 4.0. The results showed high diversity among EU countries in terms of digital maturity. Scandinavian countries (Finland and Denmark) and Malta were found to be leaders in this area, while the weakest results were reported for Greece, Romania, Bulgaria, Hungary, and Latvia. The findings provide a lot of new information about the current state of development of the digital economy in EU countries, which should be used in both the development and implementation of new solutions related to economic digitalization policy in this region.

1. Introduction

The digital transformation of manufacturing and service companies is related to the dynamic development of information and communication technologies (ICT) and refers to the general concept of the fourth industrial revolution [1,2,3]. The term Industry 4.0 was introduced in 2011 by a group of German scientists during the Hannover Messe Fair, which symbolized the beginning of the fourth industrial revolution [4].
The digital transformation process is significantly changing manufacturing and service activities, business models and processes, consumption, and a number of other areas of life [5,6,7]. Its importance has also been highlighted by the global SARS COVID-19 pandemic, which began in China in late 2019. In the months following its onset, a significant proportion of companies took even more intensive measures to change their business models and forms of operation. This mainly concerned the production processes themselves but also concerned sales channels and customer service. The implementation of digital solutions in companies has enabled companies to strengthen their competitive advantage.
The pandemic has made it clear that companies must use innovative solutions to survive in the modern economy. Digitalization processes accelerate the development of all industries and ensure their connectivity, speed, and control, including easy access to data on production, customers, and market status [8,9,10,11].
The changes associated with the introduction of digital transformation in manufacturing companies cause huge structural and social alterations. In practically every area of enterprise activity, the effects of these changes can be noted, with their nature being immensely diverse. Although some of them are considered positive, negative effects can also be observed.
In the context of global sustainable development (in accordance with the UN Sustainable Development Goals [12]), the fourth industrial revolution is expected to reduce the amount of material that is used and primary energy consumption as well as to generally improve working conditions. At the business level, it is expected that the concept of Industry 4.0 will enhance quality management processes, mainly through the increased automation of production processes. Moreover, Industry 4.0 has the potential to create sustainable industrial value, focusing on all three dimensions of sustainable development: economic, social, and environmental [13,14].
On the other hand, the transformation process may also affect the deterioration of social relations. This mainly concerns the expected change in worker competencies. This, in turn, may contribute to digital exclusion and the creation of structural unemployment. For these reasons, the policies of national governments play an extremely important role in the process of digital transformation. Today, virtually all countries realize that economic development is closely linked to this process.
The role and importance of digital transformation are also emphasized by the EU, which has been promoting the development of the digital economy for many years. In 2021, the Digital Europe Program was launched. Its goal is to financially support the digital transformation of European societies and economies. Much earlier, in 2015, the European Commission (EC) developed the so-called Single Digital Market Strategy, which aims to identify and collect data that will allow for the social and economic assessment of processes related to digital transformation. The importance of business digitization is also evidenced by its inclusion in the EU policy strategy for 2019–2024 [15,16]. However, individual EU countries differ in terms of the digital maturity of enterprises, which is the result of the implementation of the idea of Industry 4.0. In this context, it becomes expedient to assess this process and to determine similarities between individual EU countries. The designation of groups of similar countries creates opportunities for joint action to improve the degree of digitization and to apply for funding for the implementation of this idea.
Since previous publications on Industry 4.0 issues failed to address the identification of similarities between countries in terms of digital business maturity, there is a research gap that this paper aims to fill. In this regard, the following three research questions were formulated:
  • What is the concentration of the use of Industry 4 technologies in EU enterprises?
  • What is the level of digital maturity among the EU countries?
  • In which of the Industry 4.0 technologies that have been implemented in enterprises do individual EU countries show similarities?
In order to answer these questions, the present research was conducted on the basis of eight selected determinants characterizing the main Industry 4.0 technologies that have been implemented in the enterprises of the EU countries.
With regard to the above considerations, two main factors were recognized that prove the originality of this work. The first factor is the broad scope of the research, which takes the eight most important technologies identified within Industry 4.0 into account, namely artificial intelligence, big data, cloud computing, 3D printing, robotization, the integration of internal process, integration with customers/suppliers, and cybersecurity. The second factor relates to the research methods used (concentration measures such as the Gini coefficient and the Lorenz curve, the Weighted Aggregated Sum Product Assessment (WASPAS) method from multiple-criteria decision making (MCDM) group of methods, and the k-means clustering method). The Gini coefficient and the Lorentz curve methods were used to study the concentration of Industry 4.0 technology use in the enterprises of the EU-27, while the WASPS method was used to assess digital maturity, and the k-means method was used to analyze similarities between the EU countries in terms of the Industry 4.0 technologies that have been implemented in enterprises. The use of these methods increases the scientific value of the research and makes the results more credible. The results obtained while assessing the digital maturity and similarities of the EU countries also have a utilitarian value. They can be used to develop and implement new strategies and operational programs that are related to building an innovative economy in individual countries and in the entire EU based on knowledge. The similarities between countries also create opportunities for their cooperation in the joint implementation of Industry 4.0 technologies. Moreover, it is reasonable to claim that this work presents a new and original approach to the issue of digital business maturity in EU countries, and the purpose of the research, the results of which are presented in this paper, was to determine the similarities between EU countries in terms of the digital maturity of their enterprises.

2. Theoretical Background

2.1. Industry 4.0

The concept of Industry 4.0 was launched in Germany in 2011 and is closely related to digital transformation [17]. This concept, as a strategic initiative of the German government, was adopted as part of the action plan “High-Tech Strategy 2020” in 2011 to revolutionize the production process [18,19]. Thus, the idea of Industry 4.0 encompasses the digital transformation of the entire industrial, service, and consumer markets, from the emergence of smart manufacturing to the digitization of all of the channels necessary for the flow of all resources and value [20,21,22,23]. So far, nine core technology pillars have been identified and have been shown to have a significant impact on industrial and service activities in this regard. These pillars include big data analytics, optimization and simulation, cloud technologies, virtual and augmented reality (VR/AR), horizontal and vertical systems integration, Industrial Internet of Things (IIoT), incremental technologies (3D printing), autonomous robots, and cyber security [24,25,26].
The implementation of technologies related to these pillars in enterprises aims to increase competitiveness, efficiency, and productivity of the production process; increase safety levels; reduce costs; and support real-time decision-making processes, among other aspects. Therefore, the basis of the Industry 4.0 concept is the integration of various systems through the use of digital resources, which, by communicating with one another, can make certain decisions and perform various operations with much less human involvement than before [27]. Basic Industry 4.0 technologies along with references from the literature are summarized in Table 1.
Recently, there has been a steady increase in the number of publications devoted to the subject of assessing readiness for Industry 4.0 and digital maturity. These issues have been addressed in different papers. Table 2 summarizes the most important works devoted to this topic.

2.2. Open Innovation Dynamics in the Context of Industry 4.0

It is a great challenge to implement modern technologies in companies for the purpose of their digitalization. Along with development, knowledge is becoming increasingly important. Innovations, advanced technologies as well as knowledge and the ability to acquire and process it are the basis for both building a positive image of a company and remaining on the market [21,41]. All of these factors determine the level of innovativeness of both enterprises and the whole economy [42]. Transforming the knowledge possessed or transferred by enterprises into products or services affects their success and a competitive advantage. In recent years, this advantage has been increasingly achieved through the use of the concept of open innovation (OI) [43], which is the driving force behind a balanced business [44]. In this concept, the development of modern companies is possible when patents, licenses for inventions, or other innovative solutions are acquired from other entities. The practical use of this concept enables an enterprise to achieve a high level of efficiency at a low cost. Therefore, it is increasingly used by companies, including those in the SME sector [45,46,47].
Many publications have emphasized that OI is an appropriate path to sustain the dynamics of a company’s innovation processes [48]. Both OI scholars and practitioners agree that openness at the company level presents challenges as well as managerial barriers that require specific skills and internal adjustments [49,50,51].
Open innovation refers to the creation of new values by combining the markets and technologies of different companies beyond their borders as well as by introducing novel and combined business models [52,53]. Digital transformation and information technology (IT) contribute to the development of OI in companies [54,55]. Some research [55,56,57,58,59,60,61,62,63,64,65,66,67,68] shows that many companies refer to OI as an important source of competitive advantage in the context of the ongoing digital transformation.

3. Materials and Methods

3.1. Data

In order to investigate the variation in the level of digital business maturity in the European Union countries, data from the European Statistical Office database were used [59]. The data cover the area of ICT usage in enterprises in terms of e-business and ICT security. Additionally, they concern enterprises (with more than 10 employees) classified according to NACE Rev. 2, i.e., in manufacturing, electricity, gas and steam, water supply, sewerage and waste management, construction, wholesale and retail trade sectors, etc. [60].
In order to study the similarities between EU countries in terms of the level of digital business maturity, eight determinants (indicators) related to the main areas of Industry 4.0. were selected, namely artificial intelligence, 3D printing, big data analytics, robotics, cloud computing services, integration with customers/suppliers, supply chain management, the integration of internal processes, and cybersecurity. Due to the lack of complete data for the IoT area, this determinant was not included in the present research.

3.2. The Gini Coefficient

Descriptive statistics methods (including mean, median, the coefficient of variation, kurtosis, and skewness), the Gini concentration coefficient, the Lorenz curve, and the Pearson’s linear correlation coefficient were used to analyze and present the results.
In the first stage of the study, basic descriptive statistics of the studied population were determined. Then, an inequality measure was studied to examine the use of selected Industry 4.0 technologies in manufacturing and service enterprises in the EU-27 countries. For this purpose, the Gini coefficient, determined from Equation (1), was used [61]:
G ( y ) = i = 1 n ( 2 i n 1 ) × y i n 2 × y ¯
where n is the number of observations, y i is the value of the i-th observation, and y ¯ is the average value of all of the observations [39]:
y ¯ = 1 n i = 1 n y i
The value of the Gini coefficient was determined for each analyzed Industry 4.0 technology separately. The value of this coefficient makes it possible to determine the degree of concentration of the use of a given technology in the EU countries. If the use of a given technology is only reported in one country, then the Gini coefficient equals 1. If this coefficient is reported in more countries, then its value decreases. If the value is closer it is to 0, then it indicates an even distribution of the use of a given Industry 4.0 technology among the EU countries.
The graphical representation of the concentration of use of Industry 4.0 technologies in the EU enterprises is the Lorenz curve. The data for the Lorenz curve are determined from Equation (3) [61]:
x 0 = z 0 = 0 x h = h n z h = i = 1 h y i i = 1 n y i
With sorted observations, y i , which are non-negative values 0 y 1 y 2 y n , is a polyline that apexes, for h = 0, 1, …, n.
In the next step, the correlations between individual 4.0 technologies were determined according to Equations (4) and (5):
r ( x , y ) = c o v ( x , y ) σ x σ y
where:
c o v ( x , y ) = E ( x × y ) ( E ( x ) × E ( y ) )
where (x,y) is the r-Pearson correlation coefficient between variables x and y; cov(x,y) is the covariance between variables x and y; σ is the standard deviation from the population; and E is the expected value.

3.3. The WASPAS Method

The WASPAS method was used to assess the level of digital maturity of enterprises in the EU-27 countries. The Weighted Sum Model (WSM) is one of the multi-criteria decision-making methods that can be used to evaluate multiple alternatives in terms of a number of decision criteria. The general assumption of this method is that a given MCDM problem is based on m alternatives and n decision criteria. Each criterion has a specific weight wj, and xij is the weighted value of variant i when it is evaluated against criterion j [62,63].
The total relative importance of alternative i, denoted as Q i ( 1 ) , is defined as follows:
Q i ( 1 ) = j = 1 n x i j ¯ w j
where linear normalization of the initial values of the criteria is used, i.e., for stimulants:
x i j ¯ = x i j m a x x i j
or for destimulants:
x i j ¯ = m i n x i j x i j
According to the weighted product model (WPM), the total relative importance of alternative i, denoted as Q i ( 2 ) , is defined as follows:
Q i ( 2 ) =   j = 1 n ( x i j ¯ ) w j
Assuming an increase in ranking relevance i, and, respectively, decision-making efficiency, a joint WSM and WPM criterion for determining the total importance of alternatives, called the weighted aggregate sum product assessment method, was proposed:
Q j = j = 1 n x i j ¯ w j + ( 1 λ ) j = 1 n ( x i j ¯ ) w j ,   = 0 , 1 .
A value of λ = 0.5 was used to assess the digital maturity level of enterprises in the EU-27 countries. Qj takes values in the range [0, 1]. Higher values of alternatives indicate a more favorable solution.
The Shannon’s entropy method was used to determine the weights of the assumed determinants (indicators). The algorithm for determining the weights is as follows:
To construct the decision matrix according to equation.
To construct the normalized decision matrix:
x i j = x i j i = 1 m x i j
To determine entropy:
E j = k t = 1 m x i j l n ( n i j )
where:
k = 1 l n ( n )
where nij is the proportion of samples in time t in the i indicator.
To determine the entropy variation level for each criterion (the degree of intrinsic divergence of scores from subsequent criteria) from equation:
d j = 1 e j
To determine the weights (degree of importance) of the criteria according to equation:
w i = 1 E j j = 1 n ( 1 E j )

3.4. The K-Means Method

The presented multidimensional comparative analysis was carried out using the taxonomic concept of a multidimensional object, which is a statistical unit. In this case, the multidimensional object (characterized by many variables) are European Union countries.
The non-hierarchical cluster analysis algorithm—the k-means method—was utilized for analysis. It consists of assigning n objects to a given a priori number of k clusters. The goal was to find and extract groups (clusters) of similar objects from the studied population. The similarity of objects located in one cluster should be as large as possible, while separate clusters together with the objects forming them should differ from one another as much as possible. Moving objects between clusters takes as long as it takes for the variations within the clusters to become minimized and for the variations between separate clusters become maximized [64].
Usually, as a result of using the k-means method for grouping, the average values of variables for each cluster are examined in each dimension in order to estimate how much these clusters differ from one another. The F-statistic derived from the analysis of variance performed in each dimension is an indicator of how well a given dimension discriminates against other clusters.
The k-means method aims to find the extreme of the objective function, which is defined by the following relationship [64]:
J = i = 1 k d t D i s i m ( c i , d t )
The research algorithm for the k-means method consists of the following stages [64]:
  • Determine the number of clusters a priori —k. To calculate the number of clusters, the following Equation (2) was used [64,65,66].
    k n 2
    where k is number of clusters, and n is number of alternatives (countries).
  • Assign cases (EU countries) to individual clusters on the basis of designated Euclidean distances dij for individual cases Pi from the centers of clusters mi. The Euclidean distance is determined based on the following relationship
    d i j x j m i = l = 1 k ( x i j m x l j ) 2
  • Determine new cluster centers using the cumulative method based on the equation:
    m x l , i ( 1 ) = 1 N i j = 1 N i x l j ( 0 )
  • Determine the displacement of the clusters ∆m:
    Δ m = m i ( 0 ) m i ( 1 )
  • Assign cases to new clusters.
  • Determine new cluster centers.

4. Results

4.1. Preliminary Statistical Analysis

The indicators that were used for the study were pre-processed, and their basic statistical parameters were determined (average, maximum, minimum, standard deviation, and the coefficient of variation) as were the correlation coefficients. The basic descriptive statistics are summarized in Table 3, and the values of Pearson’s linear correlation coefficient are summarized in Table 4.
The set of determinants presented in Table 3 is characterized by a large spread of the coefficient of variation. Thus, these determinants meet the condition of diagnostic features, which must show significant variation within the studied community (>10%). The highest value of the coefficient of variation was reported for the determinant “the analysis of big data internally using machine learning and was over 117%”. The lowest value (13.94%) was reported for the determinant “ICT security measure used: strong password authentication”.
The signs of the differences between the median and mean values of a given determinant show the direction of the asymmetry of distribution. A positive sign (median greater than the mean) characterizes the left-sided asymmetry, indicating the predominance of countries with high values of a given determinant. A negative sign is associated with the right-sided asymmetry, indicating the predominance of countries with lower values of a given determinant. The left-sided asymmetry was found for the determinants the use of 3D printing, the use of industrial or service robots, and ICT security measure used: strong password authentication.
The analysis of the correlation coefficients (Table 4) showed that the highest positive values of this coefficient were found between the determinants enterprises sending eInvoices (suitable for automated processing) and the purchase of cloud computing services used over the Internet (0.73), the use of 3D printing, the use of industrial or service robots (0.69), the purchase of cloud computing services used over the Internet, and the use of 3D printing (0.6). A negative correlation was only reported between the determinants the use of industrial or service robots and the analysis of big data internally using machine learning (−0.09).
In the next stage, the Gini coefficient was established. This coefficient was used to determine the concentration of Industry 4.0 technologies in the EU-27 enterprises, and the results are presented in Table 5. This coefficient was determined for each Industry 4.0 technology indicator separately. It is a widely used measure of inequality. The number of observations was 27 (i.e., all EU-27 countries).
The Gini coefficient was found to be highest for the analysis of big data internally using machine learning (0.459). The highest number of enterprises using this technology was found in Ireland (20%) and Malta (12%). A moderate concentration of the results for enterprises sending e-invoices was found to amount to 0.375. This technology was mainly reported to be used in Italy (95%) and Finland (83%). The lowest value of this coefficient was found for ICT security measure used: strong password authentication, and it amounted to 0.078, which means that the EU-27 countries used this technology almost equally in all of the studied enterprises. On average, this technology was used by 74% of the EU-27 enterprises, with Finland showing the highest values (91%), and Romania showing the lowest values (53%).
The variation in the use of Industry 4.0 technologies is shown by the Lorenz concentration curve (Figure 1).

4.2. Results of the Ranking and Assessment of the Level of Business Digital Maturity in the EU-27 Countries

In the next stage, fundamental research was conducted, which involved creating a ranking of the EU countries by the level of digital maturity of the enterprises in these countries. The basis for making this ranking was the assessment of the digital maturity of these countries, which was carried out using the WASPAS method. All of the diagnostic variables that were adopted for the analysis (indicators characterizing Industry 4.0 technologies) were stimulants. The values of the weights for these indicators, which were determined by the entropy method, are presented in Table 6.
The highest weights, which were determined by the entropy method, were given to indicators for the technologies that were the least frequently used by companies in the EU countries, namely artificial intelligence used for big data analysis and 3D printing technology. On the other hand, the lowest weight values were given to the strong password authentication of cybersecurity technology because this type of protection against cyber threats is the cheapest and has been the most widely used technology for many years. The determined values of WSM, WPM, and the final indicator in the WASPAS method as well as the classification of the EU-27 countries in terms of the level of the digital maturity of their enterprises are presented in Table 7.
Based on the determined values of the WASPAS Q j indicator when it was treated as a measure of digital maturity of the EU-27 countries and its standard deviations, the digital maturity level classes were determined. The following division into four classes was adopted:
(1)
Class 4: Expert:
Q j Q j ¯ + s Q j
(2)
Class 3: Experienced:
Q j ¯ + s Q j > Q j Q j ¯
(3)
Class 2: Intermediate:
Q j ¯ > Q j Q j ¯ s Q j
(4)
Class 1: Novice:
Q j < Q j ¯ s Q j
where Q j is the digital maturity indicator of a country, Q j ¯ is the mean value of the Q j indicator for the population of countries under study, and s Q j is the standard deviation from the mean value of the Q j indicator determined for the population of countries.
Based on the results, each of the studied countries was classified into one of four classes of digital maturity. The results are shown in graphical form in Figure 2.
The results showed that Denmark, Malta, and Finland were in the “Expert” class for digital business maturity. The “Experienced” class included Belgium, Germany, Ireland, Spain, Croatia, Italy, the Netherlands, Slovenia, and Sweden, and the “Intermediate” class included Czechia, Estonia, France, Cyprus, Lithuania, Luxembourg, Austria, Poland, Portugal, and Slovakia. The “Novice” class, in turn, included Hungary, Romania, Bulgaria, Greece, and Latvia.

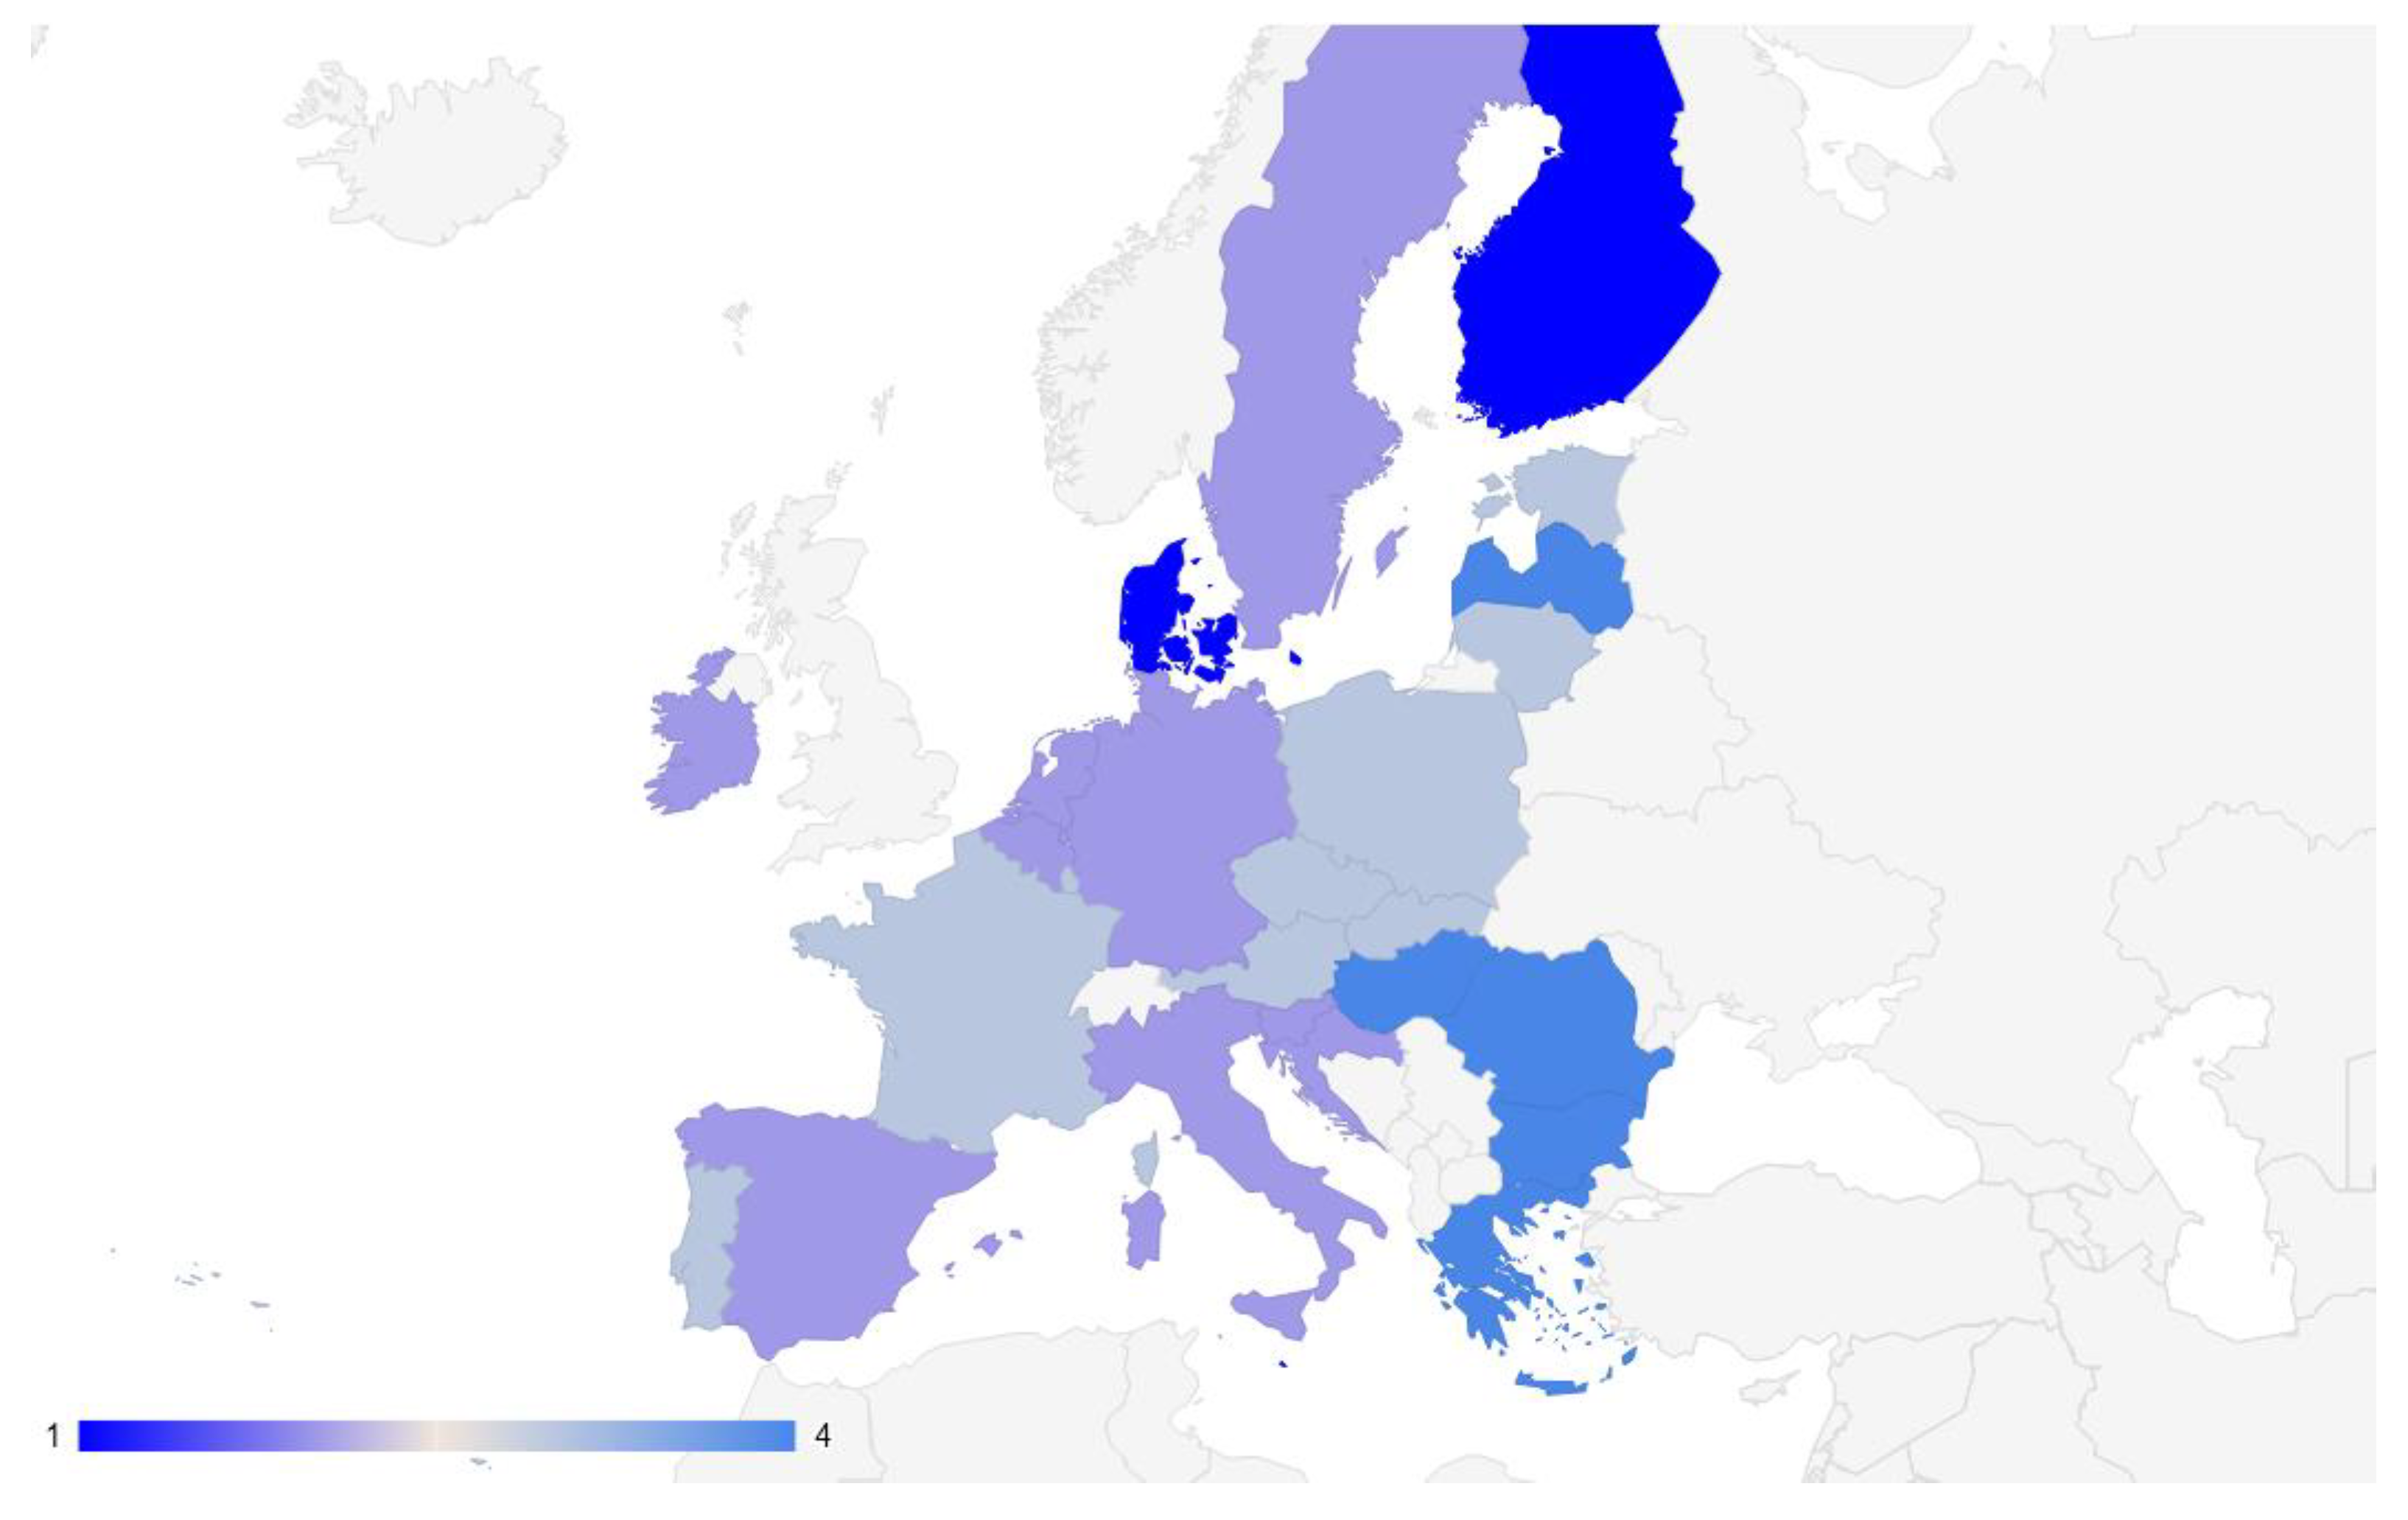
4.3. Results of the Similarity Analysis of the EU Countries in Terms of Digital Business Maturity

In order to unambiguously identify groups of countries that were similar in terms of digital maturity and characterized by the similarity of implemented Industry 4.0 technologies in companies, the EU countries were divided into four clusters in accordance with the assumption of an optimal number. Countries inside one cluster are the most similar to one another in terms of the determinants of digital business maturity while also being different from countries in other clusters. By contrast, the countries inside the same cluster show the greatest similarity when they are as close to one another as possible (Table 8).
The basic descriptive statistics characterizing the digital business maturity of the EU countries for each cluster are presented in Table 9, and the mean values of the determinants are presented in Figure 2.
When analyzing the data presented in Table 8 and Figure 3, it can be seen that countries with the highest level of digital maturity are located in clusters 1 and 4. Countries from cluster 1, i.e., Belgium, Ireland, Malta, and the Netherlands, were found to have the highest mean values of the determinants the analysis of big data internally using machine learning, the analysis of big data internally from any data source, and ICT security measure used: strong password authentication. On the other hand, countries from cluster 4, namely Denmark, Estonia, Italy, Slovenia, Finland, and Sweden, were reported to have the highest mean values of the determinants the use of industrial or service robots, the purchase of cloud computing services used over the internet, and enterprises sending eInvoices, suitable for automated processing. The countries in clusters 1 and 4 were found to belong to the Expert and Experienced digital maturity levels. The lowest level of digital maturity was reported for the countries from cluster 2 (Greece, Spain, France, Croatia, Lithuania, Austria, and Romania) and cluster 3 (Bulgaria, Czech Republic, Germany, Cyprus, Latvia, Luxembourg, Hungary, Poland, Portugal, and Slovakia). The countries in these clusters were found to belong to the Intermediate and Novice digital maturity levels.
Countries from cluster 1 (Belgium, Ireland, Malta, and the Netherlands) and 4 (Denmark, Estonia, Italy, Slovenia, Finland, and Sweden) can be classified as digital leaders in terms of digital business maturity. In these countries, when compared to other EU countries, the level of technologies related to the infrastructure of Industry 4.0 was found to be immensely high, i.e., the use 3D printing, the use industrial or service robots, enterprises that have ERP software, the purchase of cloud computing services used over the internet, and technologies related to big data and artificial intelligence: the analysis of big data internally using machine learning and the analysis of big data internally from any data source. Countries from cluster 1 (Belgium, Ireland, Malta, and the Netherlands) can be classified as having a high level of digital maturity that is focused on the use of big data in artificial intelligence and for various types of analysis. At the same time, the infrastructure of Industry 4.0 is at a relatively good level in these countries.
By contrast, the Scandinavian countries (Sweden, Finland, and Denmark) were found to have the highest level of digital maturity among the countries in clusters 1 and 4. Finland and Sweden are among the most digitized countries in the world. In Finland, companies are very keen to use digital technology for cloud computing services. In Sweden, on the other hand, they use it to improve efficiency, productivity, and sales. Additionally, in Denmark, more and more companies are using cloud computing and electronic invoicing. As many as 50% of companies in Denmark use ERP systems, the second highest result in the EU after Belgium. It is interesting to note that among the Western countries, only Belgium, the Netherlands, and Ireland achieved a high level of enterprise digitization and robotization. The high score is due to the extensive use of big data technologies or the use of cloud computing services, among other aspects. The degree of digital business maturity in these countries exceeds the EU average.
Countries from clusters 2 and 3 can be classified as having medium and low levels of digital business maturity. They use technologies that have been well known for many years that are related to the areas of integration with customers/suppliers, supply chain management (Enterprises that have ERP software), and the integration of internal processes (enterprises sending eInvoices). However, they are lagging behind other EU countries in terms of more modern technologies. Many of these countries belong to the so-called New Union, which extends from the area of Central and Eastern Europe. Moreover, cluster 3 includes Germany, where the concept of Industry 4.0 was created. The values of the determinants of digital maturity indicate that in this country, more intensive activities are needed in the use of technologies for the analysis of both big data sets and artificial intelligence. The situation was also found to be similar in France and Spain.
Based on the analyses, diversity measures were determined both between and within the studied clusters, along with the degrees of freedom (df) (Table 10).
The obtained F-statistic values, which represents the ratio of diversity between clusters to diversity within clusters, allowed the authors to identify the most important clustering variables in terms of their discriminatory power. This means that the higher the F-statistic for a given variable, the more important it is for the assignment of the EU countries to particular clusters. The analysis of variance carried out for the determinants of digital business maturity in the EU countries showed that the biggest role in the assignment of the EU countries to particular clusters was played by the determinant “enterprises sending eInvoices”. The value of the F-statistic for this determinant was found to be the highest and amounted to 33.17. The second most significant determinant was “the purchase of cloud computing services used over the Internet” (F-statistic = 27.08). The least significant in terms of assigning the EU countries to clusters due to the criterion adopted was the determinant “the use industrial or service robots”, for which the value of the F-statistic was only 1.22. It should be emphasized, however, that each determinant ultimately influenced the grouping of the EU countries into homogeneous clusters in terms of digital business maturity.

5. Discussion

5.1. Business Digital Transformation in Europe

The presented literature review and the results indicate that changes related to the implementation of the idea of Industry 4.0 are complex processes and require large investments. Another important factor is also the awareness and social acceptance of their implementation. The determined digital maturity classes are treated as measures for the effectiveness of the implementation of digital solutions in the companies from the EU countries under study.
Thus, the main objective of the conducted research was to assess the level of digital maturity of the EU-27 countries in terms of implemented Industry 4.0 technologies in the enterprises from these countries. In addition, a similarity analysis based on the level of this maturity was also conducted. The WASPAS method was used to assess digital maturity and to identify groups of similar countries in terms of implemented technologies in enterprises (the k-means method). The research was based on a set of eight selected indicators (determinants), which characterized the most important Industry 4.0 technologies.
The importance of the fourth industrial revolution and related technologies has been presented in many papers (e.g., [67,68,69,70,71,72,73,74,75,76]). Their results clearly indicate that companies more often perceive Industry 4.0 technologies as being very important and necessary for their development, and companies are increasingly eager to use them [77,78,79]. However, the degree of their application is very diverse, which can also be seen in the results obtained in this study. Although EU countries are among the most economically developed countries, the degree of digital readiness of individual countries shows great variation.
Based on the results, the most developed countries in terms of the implementation of Industry 4.0 technologies (included in the study) include Denmark, Malta, and Finland. Companies from Belgium, Germany, Ireland, Spain, Croatia, Italy, the Netherlands, Slovenia, and Sweden also show positive results. The high position of the Scandinavian countries is due to the fact that they are among the best digitized countries in the world. Businesses in Finland are eager to use digital technologies for cloud computing services and electronic invoices, while in Denmark, about 50% of companies use ERP systems. On the other hand, enterprises in Malta are very good at using cloud technologies and big data. The same is true for Sweden, where companies are making extensive use of digital technologies to improve their efficiency, productivity, and sales.
When compared to the group of leaders, the Czech Republic, Estonia, France, Cyprus, Lithuania, Luxembourg, Austria, Poland, Portugal, and Slovakia were found to show slightly worse results, while Latvia, Greece, Hungary, Romania, and Bulgaria were found to show the worst results.
With regard to the assessment of the level of business digital maturity in the EU-27 countries, in the case of the best and the weakest group of countries, our results coincide with the results of the Digital Economy and Society Index (DESI)) to a large extent [80]. The differences in the ranking are, obviously, associated with the research methodology, i.e., with different indicators adopted for the analysis and the fact that the DESI index applies to entire societies of countries and not only enterprises.
Moreover, the results also indicate that the enterprises in most of the countries of the so-called old union (EU-14) are definitely at a higher technological level. As many as nine of the countries in this group are described as “Expert” (Denmark and Finland) and “Experienced” (Belgium, Germany, Ireland, Spain, Italy, the Netherlands, and Sweden). Four countries among the EU-14 are characterized by the “Intermediate” level and only one (Greece) by the “Novice” level. The high level of technological sophistication of these countries is due to their better economic situation compared to the “new EU” countries, greater investment in research and development, and longer experience with free-market enterprises, among other reasons. This makes these companies more willing to invest in new innovative technologies in order to improve their competitiveness.
Among the new EU countries, i.e., the countries that joined the European community after 2004, the highest level of digital maturity was found in Malta, Croatia, and Slovenia. The worst situation, on the other hand, was reported in countries with the lowest GDP—Bulgaria, Romania, and Hungary. In order for the economies of these countries as well as the entire EU-13 group of Central and Eastern European countries (except Malta and Cyprus) to reach a higher level of development, it is necessary to provide them with substantive and economic support. It is necessary for the more technologically developed countries to show greater solidarity [81].
A difficult situation can mainly be found in Bulgaria, Romania, and Hungary, whose digital maturity rating is lowest. One of the reasons for this is the level of awareness and knowledge of companies regarding the implementation of new technologies and their importance to their business. Knowledge of the advantages and opportunities of building an innovative knowledge-based economy is crucial for the economic transformation of countries with the lowest digital maturity scores.
A significant barrier to the implementation of Industry 4.0 solutions in many developing countries is the lack of financial resources and uncertainty about the return on investment in Industry 4.0 technologies [77,82,83,84,85], the lack of adequate staff [86] and the need to retrain personnel [82,87,88], technology integration issues [89], the problem of ensuring the reliability and stability of systems, which is a key factor in machine-to-machine communication [90], as well as legal issues [91,92,93]. It is also necessary to emphasize the role of organizational culture in digital transformation and in the implementation of Industry 4.0 solutions [94,95,96].
The discussion presented here only concerns the most important part of the research, which relates to the formulated research questions. The results made it possible to determine the concentration of technology use in the EU countries, to assess the level of digital maturity of these countries, and to determine similarities between them in this regard.

5.2. The Relation between Digital Transformation and Open Innovation in Europe

Digital transformation poses various challenges for businesses. Governments and policy makers in European countries are taking a number of initiatives to engage enterprises in IO and to promote collaboration models that are oriented towards facilitating the adoption of new digital technologies [97]. Therefore, open innovation is inextricably linked to the digital development of companies in European countries [98,99,100]. The importance of OI and digitalization was already recognized by the EU a decade ago when it launched Innovation Union as one of the seven flagship initiatives of the Europe 2020 agenda [101]. Open innovations were also promoted as one of the three key policy objectives in the 2015 EU Research and Innovation Framework [102]. In the era of Industry 4.0, companies have no other choice but to collaborate and acquire external knowledge due to shortened innovation and product life cycles [103]. Therefore, an open knowledge sharing approach that could take place in an innovative environment is inevitable. Such exchange, in the context of the presented research results, should especially occur between countries with a high (“Expert”) level of business digital maturity and countries with a low (“Novice”) level of this maturity. Leader countries should support countries that are less developed in terms of innovation, organization, and science when transitioning to innovative digital solutions. Indeed, building a common European economy requires broad cooperation and a solidarity approach by all of its members.

6. Limitations and Future Directions

Based on the research and its results, it is possible to formulate their limitations as well as directions for future research.
In terms of the limitations of the presented results, the research concerned all types of enterprises, both large enterprises (250 and more employees) and SMEs (less than 250 employees). Therefore, it is reasonable to conduct research on business digital maturity for large enterprises and those in the SME sector. This will allow for a full diagnosis of the state of their digitalization based on their size. Studies comparing the digital maturity of enterprises from different economic sectors (according to NACE Rev. 2) as well as from the same economic sectors and of different sizes will also provide valuable information. Such research will allow a diagnosis regarding the innovativeness of European companies.
In terms of the limitations of the research in question, we should also mention the availability of indicators that characterize innovation and implemented digital technologies in European companies. The most popular innovative technologies related to Industry 4.0 and digitalization were used for the research. However, as far as the availability of data in the Eurostat database is concerned, it is reasonable to extend this research with other indicators, including those related to the knowledge and skills of the staff

7. Conclusions

The fourth industrial revolution is inextricably linked to the development of communication and information technologies. Therefore, it can be assumed that the scope and scale of implemented solutions related to these technologies show the digital maturity of individual countries and their groups. It is also obvious that the most valuable solution for individual countries and their groups, is the state in which these technologies are used in both production and service enterprises. Globalization and the free-market economy prefer companies and countries whose economic activity is based on innovative solutions, which undoubtedly include those related to Industry 4.0 technologies.
It is both popular and important to examine the digitization process of the world economy for individual countries and groups of companies. This is because it shows how this process takes place in different regions and countries and which of the latest technologies find practical application.
The ongoing global pandemic caused by the SARS-Co-19 coronavirus confirms the great importance of new technologies in practically all areas of economic and social life. This is very visible in the EU, a region that has been particularly severely affected by the pandemic and, at the same time, is one of the regions that is most actively supporting the processes related to the digitization of the economy and of public life. Therefore, it is fully justified to undertake research to assess the degree of digitization of individual EU countries and to delineate their similar groups.
The present work also refers to this subject, but in a slightly different manner. It presents the results of the similarity analysis of the EU countries in terms of digital business maturity. Indeed, as mentioned earlier, free market companies should be the main adopters of digital solutions. This original approach was aimed at identifying groups of countries where enterprises had a similar state of digitization. Obviously, this division can also be treated as an assessment of this process.
The analysis was performed using one of the non-hierarchical clustering methods—the k-means method. The research was based on the set of eight determinants of digital maturity, which characterized eight areas that are relevant to the process of digital transformation of enterprises.
The results indicate a high differentiation rate among the EU countries in terms of digital maturity. The leaders in this process are undoubtedly the Scandinavian countries (Denmark and Finland) and Malta. The lowest results were noted in Greece, Latvia, Romania, Bulgaria, and Hungary. This diversity also shows that some countries are lagging far behind in terms of the digitalization of the economy. Thus, from the perspective of the EU, the right direction would be to strive to make these levels more equal.
The findings also show the complex challenges the EU authorities have to face to reduce these differences and to increase the pace of digital transformation to meet global competition. However, the digital transformation process requires large financial outlays as well as organizational and social changes. Individual countries, especially smaller and less wealthy countries, may find it increasingly difficult to implement the process of change. Therefore, it becomes necessary to build different types of “digital coalitions” between countries and companies in order to face the competition and to improve both the quality and safety of the lives of citizens.
The designation of groups of similar countries creates great opportunities for cooperation between countries from these groups. This mainly concerns applying for EU funds, the implementation of common digital policy, cooperation between companies, building a society 4.0, the integration of systems, cyber security, and many other areas related to the processes of digitization and robotization.
Thus, it can be concluded that digitalization of individual countries and regions is a necessary and inevitable process for building an innovative knowledge-based economy. The pace of change in individual countries, as indicated by the results, varies greatly and depends on many factors. Therefore, in order for the EU to maintain its position as one of the leaders in the implementation of new, innovative technologies, must support and monitor the digitalization processes in individual countries.

Author Contributions

Conceptualization, M.T. and J.B.; methodology, J.B. and M.T.; software, M.T. and J.B.; formal analysis, J.B. and M.T.; investigation, J.B. and M.T.; resources, M.T. and J.B.; data curation, M.T. and J.B.; writing—original draft preparation, M.T. and J.B.; writing—review and editing, J.B. and M.T.; visualization, M.T.; supervision, M.T. and J.B.; project administration, M.T. and J.B.; funding acquisition, M.T. All authors have read and agreed to the published version of the manuscript.

Funding

This research received no external funding.

Institutional Review Board Statement

Not applicable.

Informed Consent Statement

Not applicable.

Data Availability Statement

Not applicable.

Conflicts of Interest

The authors declare no conflict of interest.

References

  1. Alqahtani, A.Y.; Gupta, S.M.; Nakashima, K. Warranty and maintenance analysis of sensor embedded products using internet of things in industry 4.0. Int. J. Prod. Econ. 2019, 208, 483–499. [Google Scholar] [CrossRef]
  2. Cristians, A.; Methven, J.M. Industry 4.0: Fundamentals and a quantitative analysis of benefits through a discrete event simulation. Challenges for technology innovation: An agenda for the future. Proc. Int. Conf. Sustain. Smart Manuf. 2017, 2016, 177–182. [Google Scholar]
  3. Jazdi, N. Cyber physical systems in the context of Industry 4.0. In Proceedings of the 2014 IEEE International Conference on Automation, Quality and Testing, Robotics, Cluj-Napoca, Romania, 22–24 May 2014; pp. 14–16. [Google Scholar]
  4. Lee, J. Industry 4.0 in big data environment. Ger. Harting Mag. 2013, 1, 8–10. [Google Scholar]
  5. Gholami, H.; Abu, F.; Lee, J.K.Y.; Karganroudi, S.S.; Sharif, S. Sustainable Manufacturing 4.0—Pathways and Practices. Sustainability 2021, 13, 13956. [Google Scholar] [CrossRef]
  6. Bellantuono, N.; Nuzzi, A.; Pontrandolfo, P.; Scozzi, B. Digital Transformation Models for the I4.0 Transition: Lessons from the Change Management Literature. Sustainability 2021, 13, 12941. [Google Scholar] [CrossRef]
  7. Tripathi, V.; Chattopadhyaya, S.; Mukhopadhyay, A.K.; Sharma, S.; Singh, J.; Pimenov, D.Y.; Giasin, K. An Innovative Agile Model of Smart Lean–Green Approach for Sustainability Enhancement in Industry 4.0. J. Open Innov. Technol. Mark. Complex. 2021, 7, 215. [Google Scholar] [CrossRef]
  8. Eremina, Y.; Lace, N.; Bistrova, J. Digital maturity and corporate performance: The case of the Baltic States. J. Open Innov. Technol. Mark. Complex. 2019, 5, 54. [Google Scholar] [CrossRef] [Green Version]
  9. Shim, S.-O.; Park, K.; Choi, S. Sustainable Production Scheduling in Open Innovation Perspective under the Fourth Industrial Revolution. J. Open Innov. Technol. Mark. Complex. 2018, 4, 42. [Google Scholar] [CrossRef] [Green Version]
  10. Silva, F.; Resende, D.; Amorim, M.; Borges, M. A Field Study on the Impacts of Implementing Concepts and Elements of Industry 4.0 in the Biopharmaceutical Sector. J. Open Innov. Technol. Mark. Complex. 2020, 6, 175. [Google Scholar] [CrossRef]
  11. Hizam-Hanafiah, M.; Soomro, M.A. The Situation of Technology Companies in Industry 4.0 and the Open Innovation. J. Open Innov. Technol. Mark. Complex. 2021, 7, 34. [Google Scholar] [CrossRef]
  12. UN Sustainable Development Goals. Available online: https://sdgs.un.org/goals (accessed on 15 December 2021).
  13. Stock, T.; Seliger, G. Opportunities of sustainable manufacturing in industry 4.0. Procedia CIRP 2016, 40, 536–541. [Google Scholar] [CrossRef] [Green Version]
  14. Herceg, I.V.; Kuc, V.; Mijušković, V.M.; Herceg, T. Challenges and driving forces for industry 4.0 implementation. Sustainability 2020, 12, 4208. [Google Scholar] [CrossRef]
  15. European Parliament. The Ubiquitous Digital Single Market. 2015. Available online: https://www.europarl.europa.eu/factsheets/en/sheet/43/powszechny-jednolity-rynek-cyfrowy (accessed on 3 December 2021).
  16. European Commission. Digital Europe Programme: A Proposed €7.5 Billion of Funding for 2021–2027. Available online: https://ec.europa.eu/digital-single-market/en/news/digital-europe-programme-proposed-eu75-billion-funding-2021-2027 (accessed on 3 December 2021).
  17. Kagermann, H.; Wahlster, W.; Helbig, J. Recommendations for Implementing the Strategic Initiative Industrie 4.0: Final Report of the Industrie 4.0 Working Group; Forschungsunion: Berlin, Germany, 2013. [Google Scholar]
  18. Kong, X.T.; Zhong, R.Y.; Zhao, Z.; Shao, S.; Li, M.; Lin, P.; Chen, Y.; Wu, W.; Shen, L.; Yu, Y.; et al. Cyber physical ecommerce logistics system: An implementation case in Hong Kong. Comput. Ind. Eng. 2020, 139, 106170. [Google Scholar] [CrossRef]
  19. Manavalan, E.; Jayakrishna, K. A review of Internet of Things (IoT) embedded sustainable supply chain for industry 4.0 requirements. Comput. Ind. Eng. 2018, 127, 925–953. [Google Scholar] [CrossRef]
  20. Schroeder, A.; Bigdeli, A.Z.; Zarcos, C.G.; Baines, T. Capturing the benefits of industry 4.0: A business network perspective. Prod. Plan. Control 2019, 30, 1305–1321. [Google Scholar] [CrossRef]
  21. Ober, J. Innovation Adoption: Empirical Analysis on the Example of Selected Factors of Organizational Culture in the IT Industry in Poland. Sustainability 2020, 12, 8630. [Google Scholar] [CrossRef]
  22. Brodny, J.; Tutak, M. Assessing the level of digitalization and robotization in the enterprises of the European Union Member States. PLoS ONE 2021, 16, e0254993. [Google Scholar] [CrossRef] [PubMed]
  23. Brodny, J.; Tutak, M. Assessing the level of digital maturity of enterprises in the Central and Eastern European countries using the MCDM and Shannon’s entropy methods. PLoS ONE 2021, 16, e0253965. [Google Scholar] [CrossRef] [PubMed]
  24. Pivoto, D.G.S.; de Almeida, L.F.F.; da Rosa Righi, R.; Rodrigues, J.J.P.C.; Lugli, A.B.; Alberti, A.M. Cy-berphysical systems architectures for industrial internet of things applications in Industry 4.0: A literature review. J. Manuf. Syst. 2021, 58, 176–192. [Google Scholar] [CrossRef]
  25. Rüßmann, M.; Lorenz, M.; Gerbert, P.; Waldnerm, M.; Justus, J.; Engel, P.; Harnisch, M. Industry 4.0: The future of productivity and growth in manufacturing industries. Boston Consult. Group 2015, 9, 54–89. [Google Scholar]
  26. Sony, M.; Naik, S. Key ingredients for evaluating Industry 4.0 readiness for organizations: A literature review. Benchmark. Int. J. 2019, 27, 2213–2232. [Google Scholar] [CrossRef]
  27. Gilchrist, A. Industry 4.0: The Industrial Internet of Things; Springer: Berlin/Heidelberg, Germany, 2016. [Google Scholar]
  28. Ahuett-Garza, H.; Kurfess, T. A brief discussion on the trends of habilitating technologies for Industry 4.0 and Smart manufacturing. Manuf. Lett. 2018, 15, 60–63. [Google Scholar] [CrossRef]
  29. Guoping, L.; Yun, H.; Aizhi, W. Fourth industrial revolution: Technological drivers, impacts and coping methods. Chin. Geogr. Sci. 2017, 27, 626–637. [Google Scholar]
  30. Caiazzo, F. Laser-aided directed metal deposition of Ni-based superalloy powder. Opt. Laser Technol. 2018, 103, 193–198. [Google Scholar] [CrossRef]
  31. Dombrowski, U.; Richter, T.; Krenkel, P. Interdependencies of Industrie 4.0 & lean production systems—A use case analysis. Procedia Manuf. 2017, 1, 1061–1068. [Google Scholar]
  32. Liu, Y.; Xu, X. Industry 4.0 and cloud manufacturing: A comparative analysis. J. Manuf. Sci. Eng. 2017, 139, 034701. [Google Scholar] [CrossRef]
  33. Xu, L.D.; Xu, E.L.; Li, L. Industry 4.0: State of the art and future trends. Int. J. Prod. Res. 2018, 56, 2941–2962. [Google Scholar] [CrossRef] [Green Version]
  34. Schuh, G.; Anderl, R.; Jürgen, J.; Gausemeier, J.; Michael, T.; Hompel, M.; Wahlster, W. Industrie 4.0 Maturity Index; Acatech National Academy of Science and Engineering: Berlin, Germany, 2017. [Google Scholar]
  35. Basll, J.; Doucek, P. A metamodel for evaluating enterprise readiness in the context industry 4.0. Information 2019, 10, 89. [Google Scholar] [CrossRef] [Green Version]
  36. Lichtblau, K.; Stich, V.; Bertenrath, R.; Blum, M.; Bleider, M.; Millack, A.; Schmitt, K.; Schmitz, E.; Schröter, M. IMPULS—Industrie 4.0 Readiness. Aachen-Köln: Impuls-Stiftung des VDMA. 2015. Available online: https://www.industrie40-readiness.de (accessed on 15 December 2021).
  37. Pacchini, A.P.T.; Lucatoa, W.C.; Facchini, F.; Mummolo, G. The degree of readiness for the implementation of Industry 4.0. Comput. Ind. 2019, 113, 103125. [Google Scholar] [CrossRef]
  38. Mittal, S.; Khan, M.A.; Romero, D.; Wuest, T. A critical review of Smart Manufacturing & Industry 4.0 maturity models: Implications for small and medium size enterprises (SMEs). J. Manuf. Syst. 2018, 49, 194–214. [Google Scholar]
  39. Schumacher, A.; Erol, S.; Sihn, W. A maturity approach for assessing Industry 4.0 readiness and maturity of manufacturing enterprises. Procedia Cirp 2016, 52, 161–166. [Google Scholar] [CrossRef]
  40. Corallo, A.; Lazoi, M.; Lezzi, M. Cybersecurity in the context of industry 4.0: A structured classification of critical assets and business impacts. Comput. Ind. 2020, 114, 103165. [Google Scholar] [CrossRef]
  41. Rajapathirana, R.P.J.; Hui, Y. Relationship between innovation capability, innovation type, and firm performance. J. Innov. Knowl. 2018, 3, 44–55. [Google Scholar] [CrossRef]
  42. Tylżanowski, R. Using Open Innovation Concept in Development of Modern Enterpris. Available online: https://repozytorium.uwb.edu.pl/jspui/bitstream/11320/10911/1/R_Tylzanowski_Wykorzystanie_koncepcji_Open_Innovation_w_rozwoju_wspolczesnych_przedsiebiorstw.pdf (accessed on 15 December 2021).
  43. Chesbrough, H.W. Open Innovation: The New Imperative for Creating and Profiting from Technology; Harvard Business Press: Harvard, MA, USA, 2003. [Google Scholar]
  44. Yuana, R.; Prasetio, E.A.; Syarief, R.; Arkeman, Y.; Suroso, A.I. System Dynamic and Simulation of Business Model Innovation in Digital Companies: An Open Innovation Approach. J. Open Innov. Technol. Mark. Complex. 2021, 7, 219. [Google Scholar] [CrossRef]
  45. Radziwon, A.; Bogers, M. Open innovation in SMEs: Exploring inter-organizational relationships in an ecosystem. Technol. Forecast. Soc. Chang. 2019, 146, 573–587. [Google Scholar] [CrossRef]
  46. Almeida, F. Open-Innovation Practices: Diversity in Portuguese SMEs. J. Open Innov. Technol. Mark. Complex. 2021, 7, 169. [Google Scholar] [CrossRef]
  47. Surya, B.; Menne, F.; Sabhan, H.; Suriani, S.; Abubakar, H.; Idris, M. Economic Growth, Increasing Productivity of SMEs, and Open Innovation. J. Open Innov. Technol. Mark. Complex. 2021, 7, 20. [Google Scholar] [CrossRef]
  48. Bogers, M.; Zobel, A.K.; Afuah, A.; Almirall, E.; Brunswicker, S.; Dahlander, L.; Frederiksen, L.; Gawer, A.; Gruber, M.; Haefliger, S.; et al. The open innovation research landscape: Established perspectives and emerging themes across different levels of analysis. Ind. Innov. 2017, 24, 8–40. [Google Scholar] [CrossRef]
  49. Chiaroni, D.; Chiesa, V.; Frattini, F. The Open Innovation Journey: How firms dynamically implement the emerging innovation management paradigm. Technovation 2011, 31, 34–43. [Google Scholar] [CrossRef]
  50. Lichtenthaler, U. Open innovation: Past research, current debates, and future directions. Acad. Manag. Perspect. 2011, 25, 75–93. [Google Scholar]
  51. Ferraris, A.; Santoro, G.; Dezi, L. How MNC’s subsidiaries may improve their innovative performance? The role of external sources and knowledge management capabilities. J. Knowl. Manag. 2017, 21, 540–552. [Google Scholar] [CrossRef]
  52. Chesbrough, H.W. The era of open innovation. Manag. Innov. Chang. 2006, 127, 34–41. [Google Scholar]
  53. Chesbrough, H. Business model innovation: Opportunities and barriers. Long Range Plan. 2010, 43, 354–363. [Google Scholar] [CrossRef]
  54. Witt, U. Capitalism as a complex adaptive system and its growth. J. Open Innov. Technol. Mark. Complex. 2017, 3, 12. [Google Scholar] [CrossRef] [Green Version]
  55. Yun, J.J.; Won, D.; Park, K. Dynamics from open innovation to evolutionary change. J. Open Innov. Technol. Mark. Complex. 2016, 2, 7. [Google Scholar] [CrossRef] [Green Version]
  56. West, J.; Bogers, M. Leveraging External Sources of Innovation: A Review of Research on Open Innovation. J. Prod. Innov. Manag. 2013, 31, 814–831. [Google Scholar] [CrossRef]
  57. Mawson, S.; Brown, R. Entrepreneurial acquisitions, open innovation and UK high growth SMEs. Ind. Innov. 2016, 24, 382–402. [Google Scholar] [CrossRef]
  58. Felin, T.; Zenger, T.R. Closed or Open Innovation? Problem Solving and the Governance Choice. Res. Policy 2014, 43, 914–925. [Google Scholar] [CrossRef]
  59. Eurostat. Database. Available online: https://ec.europa.eu/eurostat/web/main/data/database (accessed on 3 December 2021).
  60. Eurostat. Statistical Classification of Economic Activities in the European Community, Rev. 2. Available online: https://ec.europa.eu/eurostat/ramon/nomenclatures/index.cfm?TargetUrl=LST_NOM_DTL&StrNom=NACE_REV2&StrLanguageCode=EN (accessed on 3 December 2021).
  61. Rokicki, T.; Perkowska, A. Diversity and Changes in the Energy Balance in EU Countries. Energies 2021, 14, 1098. [Google Scholar] [CrossRef]
  62. Brauers, W.K.M.; Zavadskas, E.K. Robustness of MULTIMOORA: A Method for Multi-Objective Optimization. Informatica 2012, 23, 1–25. [Google Scholar] [CrossRef]
  63. Zavadskas, E.K.; Turskis, Z.; Antucheviciene, J.; Zakarevicius, A. Optimization of weighted aggregated sum product assessment. Elektron. Elektrotech. 2012, 122, 3–6. [Google Scholar] [CrossRef]
  64. Brodny, J.; Tutak, M. Analyzing Similarities between the European Union Countries in Terms of the Structure and Volume of Energy Production from Renewable Energy Sources. Energies 2020, 13, 913. [Google Scholar] [CrossRef] [Green Version]
  65. Mardia, K.V.; Kent, J.T.; Bibby, J.M. Multivariate Analysis. In Probability and Mathematical Statistics; Academic Press: Cambridge, MA, USA, 1979. [Google Scholar]
  66. Brodny, J.; Tutak, M. The analysis of similarities between the European Union countries in terms of the level and structure of the emissions of selected gases and air pollutants into the atmosphere. J. Clean. Prod. 2021, 279, 123641. [Google Scholar] [CrossRef] [PubMed]
  67. GfK Enigma Umfrage in Mittelständischen Unternehmen Zum Thema Digitalisierung—Bedeutung für den Mittelstand im Auftrag der DZ Bank. Available online: https://www.dzbank.de/content/dam/dzbank_de/de/library/presselibrary/pdf_dokumente/DZ_Bank_Digitalisierung_Grafiken.pdf (accessed on 3 December 2021).
  68. Schulz, A. Industrie 4.0 Steht Noch Ganz am Anfang. Available online: https://www.flyacts.com/industrie-4-0-steht-noch-ganz-am-anfang/ (accessed on 3 December 2021).
  69. Kelkar, O.; Heger, R.; Dao, D.K. Studie Industrie 4.0—Eine Standortbestimmung der Automobil- und Fertigungsindustrie. Available online: https://www.mhp.com/fileadmin/mhp.de/assets/studien/MHP-Studie_Industrie4.0_V1.0.pdf (accessed on 3 December 2021).
  70. Lusarczyk, B. Industry 4.0—Are We Ready? Pol. J. Manag. Stud. 2018, 17, 232–248. [Google Scholar] [CrossRef]
  71. Brozzi, R.; Forti, D.; Rauch, E.; Matt, D.T. The Advantages of Industry 4.0 Applications for Sustainability: Results from a Sample of Manufacturing Companies. Sustainability 2020, 12, 3647. [Google Scholar] [CrossRef]
  72. Ghobakhloo, M. The future of manufacturing industry: A strategic roadmap toward Industry 4.0. J. Manuf. Technol. Manag. 2018, 29, 910–936. [Google Scholar] [CrossRef] [Green Version]
  73. Tortorella, G.L.; Giglio, R.; van Dun, D. Industry 4.0 adoption as a moderator of the impact of lean production practices on operational performance improvement. Int. J. Oper. Prod. Manag. 2019, 39, 860–886. [Google Scholar] [CrossRef]
  74. Szabo, R.Z.; Vuksanović Herceg, I.; Hanák, R.; Hortovanyi, L.; Romanová, A.; Mocan, M.; Djuričin, D. Industry 4.0 Implementation in B2B Companies: Cross-Country Empirical Evidence on Digital Transformation in the CEE Region. Sustainability 2020, 12, 9538. [Google Scholar] [CrossRef]
  75. Kamble, S.S.; Gunasekaran, A.; Sharma, R. Analysis of the driving and dependence power of barriers to adopt industry 4.0 in Indian manufacturing industry. Comput. Ind. 2018, 101, 107–119. [Google Scholar] [CrossRef]
  76. Gottge, S.; Menzel, T.; Forslund, H. Industry 4.0 technologies in the purchasing process. Ind. Manag. Data Syst. 2020, 120, 730–748. [Google Scholar] [CrossRef]
  77. PWC. Opportunities and Challenges of the Industrial Internet. Available online: https://www.pwc.pl/pl/pdf/industry-4-0.pdf (accessed on 3 December 2021).
  78. Rolinek, L.; Kopta, D.; Plevny, M.; Rost, M.; Kubecova, J.; Vrchota, J.; Marikova, M. Level of process management implementation in SMEs and some related implications. Transform. Bus. Econ. 2015, 14, 360–377. [Google Scholar]
  79. Vrchota, J.; Pech, M. Readiness of Enterprises in Czech Republic to Implement Industry 4.0: Index of Industry 4.0. Appl. Sci. 2019, 9, 5405. [Google Scholar] [CrossRef] [Green Version]
  80. DESI. Digital Economy and Society Index 2020. Available online: https://ec.europa.eu/digital-single-market/en/digital-economy-and-society-index-desi (accessed on 3 February 2021).
  81. Novak, J.; Purta, M.; Marciniak, T.; Ignatowicz, K.; Rozenbaum, K.; Yearwood, K. The Rise of Digital Challengers. How Digitization Can Become the Next Growth Engine for Central and Eastern Europe; Digital/McKinsey: Atlanta, GA, USA, 2018. [Google Scholar]
  82. Erol, S.; Jäger, A.; Hold, P.; Ott, K.; Sihn, W. Tangible industry 4.0: A scenario-based approach to learning for the future of production. Procedia CIRP 2016, 54, 13–18. [Google Scholar] [CrossRef]
  83. Kiel, D.; Müller, J.M.; Arnold, C.; Voigt, K.I. Sustainable industrial value creation: Benefits and challenges of Industry 4.0. Int. J. Innov. Manag. 2017, 21, 1740015. [Google Scholar] [CrossRef]
  84. Müller, J.; Voigt, K.-I. Industrie 4.0 für kleine und mittlere Unternehmen. Prod. Manag. 2016, 3, 28–30. [Google Scholar]
  85. Adolph, S.; Tisch, M.; Metternich, J. Challenges and approaches to competency development for future production. Educ. Altern. 2014, 12, 1001–1010. [Google Scholar]
  86. Vrchota, J.; Mařiková, M.; Řehoř, P.; Rolínek, L.; Toušek, R. Human Resources Readiness for Industry 4.0. J. Open Innov. Technol. Mark. Complex. 2020, 6, 3. [Google Scholar] [CrossRef] [Green Version]
  87. Shamim, S.; Cang, S.; Yu, H.; Li, Y. Management approaches for Industry 4.0: A human resource management perspective. In Proceedings of the 2016 IEEE Congress on Evolutionary Computation (CEC), Vancouver, BC, Canada, 24–29 July 2016; pp. 5309–5316. [Google Scholar]
  88. Karre, H.; Hammer, M.; Kleindienst, M.; Ramsauer, C. Transition towards an Industry 4.0 State of the LeanLab at Graz University of Technology. Procedia Manuf. 2017, 9, 206–213. [Google Scholar] [CrossRef]
  89. Zhou, K.; Liu, T.; Zhou, L. Industry 4.0: Towards future industrial opportunities and challenges. In Proceedings of the 12th International Conference on Fuzzy Systems and Knowledge Discovery (FSKD), Zhangjiajie, China, 15–17 August 2015; pp. 2147–2152. [Google Scholar]
  90. Sung, T.K. Industry 4.0: A Korea perspective. Technol. Forecast. Soc. Chang. 2018, 132, 40–45. [Google Scholar] [CrossRef]
  91. Orzes, G.; Rauch, E.; Bednar, S.; Poklemba, R. Industry 4.0 Implementation Barriers in Small and Medium Sized Enterprises: A Focus Group Study. In Proceedings of the 2018 IEEE International Conference on Industrial Engineering and Engineering Management (IEEM), Bangkok, Thailand, 16–19 December 2018; pp. 1348–1352. [Google Scholar]
  92. Raj, A.; Dwivedi, G.; Sharma, A.; de Sousa Jabbour, A.B.L.; Rajak, S. Barriers to the adoption of industry 4.0 technologies in the manufacturing sector: An inter-country comparative perspective. Int. J. Prod. Econ. 2020, 224, 107546. [Google Scholar] [CrossRef]
  93. Ingaldi, M.; Ulewicz, R. Problems with the Implementation of Industry 4.0 in Enterprises from the SME Sector. Sustainability 2020, 12, 217. [Google Scholar] [CrossRef] [Green Version]
  94. von Leipzig, T.; Gamp, M.; Manz, D.; Schöttle, K.; Ohlhausen, P.; Oosthuizen, G.; Palm, D.; von Leipzig, K. Initialising customer-orientated digital transformation in enterprises. Procedia Manuf. 2017, 8, 517–524. [Google Scholar] [CrossRef]
  95. Vey, K.; Fandel-Meyer, T.; Zipp, J.S.; Schneider, C. Learning & Development in Times of Digital Transformation: Facilitating a Culture of Change and Innovation. Int. J. Adv. Corp. Learn. 2017, 10, 22. [Google Scholar] [CrossRef] [Green Version]
  96. Bertello, A.; De Bernardi, P.; Ricciardi, F. Open Innovation for Digital Transformation in Low- and Medium-Tech SMEs: Analysis of Pre-competitive Collaborative Projects. In Exploring Innovation in a Digital World. Lecture Notes in Information Systems and Organisation; Ceci, F., Prencipe, A., Spagnoletti, P., Eds.; Springer: Cham, Switzerland, 2021; Volume 51. [Google Scholar]
  97. Dodgson, M.; Gann, D.; Salter, A. The role of technology in the shift towards open innovation: The case of Procter & Gamble. R&D Manag. 2006, 36, 333–346. [Google Scholar] [CrossRef]
  98. Natalicchio, A.; Messeni Petruzzelli, A.; Garavelli, A.C. Markets for ideas. Literature review and unanswered questions. Technovation 2014, 34, 65–76. [Google Scholar] [CrossRef]
  99. Agostini, L.; Gastaldi, L.; Savino, T.; Appio, F.P. The Digitalization of the Innovation Process: Challenges and Opportunities from a Managerial Perspective. Available online: http://www.emeraldgrouppublishing.com/authors/writing/calls.htm?id=7345 (accessed on 15 December 2021).
  100. Del Vecchio, P.; Di Minin, A.; Messeni Petruzzelli, A. Big Data for Open Innovation: Unveiling Challenges and Opportunities. Available online: http://www.continuous-innovation.net/events/cimworkshops/2016/cfp-si-big-data-and-open-innovation.pdf (accessed on 15 December 2021).
  101. European Commission. Innovation Union. Available online: https://ec.europa.eu/info/research-and-innovation/strategy/past-research-and-innovation-policy-goals/innovation-union_en (accessed on 15 December 2021).
  102. European Commission. Open Innovation Resources. Available online: https://ec.europa.eu/info/research-and-innovation/strategy/past-research-and-innovation-policy-goals/open-innovation-resources_en (accessed on 15 December 2021).
  103. Enkel, E.; Heil, S.; Hengstler, M.; Wirth, H. Exploratory and exploitative innovation: To What Extent do the Dimensions of Individual Level Absorptive Capacity Contribute? Technovation 2017, 60, 29–38. [Google Scholar] [CrossRef]
Figure 1. Lorenz concentration curves for Industry 4.0 technologies used in the EU enterprises for 2019 ((a)—analysis of big data internally using machine learning, (b)—3D printing, (c)—use of industrial or service robots, (d)—analysis of big data internally from any data source, (e)—cloud computing services, (f)—enterprises sending e-invoices, suitable for automated processing, (g)—ERP software package to share information between different functional areas, (h)—ICT security measure used: strong password authentication) (own elaboration).
Joitmc 08 00027 g001
Figure 2. Division of the EU countries into four digital maturity classes (own elaboration).
Joitmc 08 00027 g002
Figure 3. Summary of the mean values of the determinants of digital business maturity in the EU countries in individual clusters (own elaboration).
Joitmc 08 00027 g003
Table 1. Basic technologies of Industry 4.0.
SourcesThe Described Technologies of Industry 4.0
[28]Big data; autonomous robots; Internet of Things; additive manufacturing; artificial intelligence
[29]Big data; autonomous robots; horizontal and vertical system integration; Internet of Things; cyber security; cloud computing; additive mfg.; augmented reality
[30]Internet of Things; additive mfg.; augmented reality
[31]Big data; horizontal and vertical system integration; Internet of Things; cloud computing; augmented reality; cyber–physical systems
[32]Big data; autonomous robots; simulation; horizontal and vertical system integration; Internet of Things; cyber security; cloud computing; additive mfg.; augmented reality; cyber–physical systems; artificial intelligence
[33]Horizontal and vertical system integration; Internet of Things; cloud computing; cyber–physical systems
Table 2. Publications devoted to the subject of assessing readiness for industry 4.0 and digital maturity.
SourcesMaturity and Readiness Models
[34]ACATECH Maturity Index
[35]The Singapore Smart Industry Readiness Index
[36]IMPULS—Industry 4.0 Readiness
[37]The degree of readiness for the implementation of Industry 4.0—a structure based on the Society of Automotive Engineers (SAE) J4000 standard
[38]DREAMY—Digital Readiness Assessment Maturity Approach
[39]A maturity approach for assessing Industry 4.0 readiness and maturity of manufacturing enterprises
[40]Assessing Industry 4.0 readiness in manufacturing—based on PCA methods
Table 3. Basic descriptive statistics of the indicators adopted for the study.
IndicatorsMeanMedianMinMaxStandard DeviationCoefficient
of Variation, %
SkewnessKurtosis
Analysis of big data internally using machine learning3.412.001.0020.004.01117.753.2711.88
Use of 3D printing4.595.002.009.001.9542.390.36−0.51
Use of industrial or service robots6.447.002.0013.002.5639.760.290.24
Analysis of big data internally from any data source12.379.003.0029.007.5260.790.75−0.66
Purchase of cloud computing services used over the internet38.2233.0011.0075.0017.4245.570.57−0.62
Enterprises sending eInvoices, suitable for automated processing29.8922.009.0095.0022.8076.271.581.86
Enterprises that have ERP software35.7835.0014.0053.009.5926.81−0.13−0.45
ICT security measure used: strong password authentication73.7074.0053.0091.0010.2713.94−0.32−0.64
Table 4. Pearson correlation matrix for the indicators adopted for the study.
X1X2X3X4X5X6X7X8
X11.000.12−0.090.580.450.060.030.36
X20.121.000.690.510.600.330.440.43
X3−0.090.691.000.330.400.470.560.36
X40.580.510.331.000.540.080.450.44
X50.450.600.400.541.000.730.340.36
X60.060.330.470.080.731.000.170.11
X70.030.440.560.450.340.171.000.20
X80.360.430.360.440.360.110.201.00
Notes: X1—analysis of big data internally using machine learning; X2—use of 3D printing; X3—use of industrial or service robots; X4—analysis of big data internally from any data source; X5—purchase of cloud computing services used over the internet; X6—enterprises sending eInvoices, suitable for automated processing; X7—enterprises that have ERP software; X8—ICT security measure used: strong password authentication.
Table 5. The value of the Gini coefficient for the use of Industry 4.0 technologies in the EU enterprises.
Technology Artificial Intelligence3D PrintingBig Data AnalyticsRoboticsCloud Computing ServicesHorizontal IntegrationVertical IntegrationCybersecurity
Indicator Analysis big data internally using machine learningUse of 3D printingAnalysis of big data internally from any data sourceUse of industrial or service robotsPurchase of cloud computing services used over the internetEnterprises sending eInvoices, suitable for automated processingEnterprises that have ERP softwareICT security measure used: strong password authentication
Gini coefficient0,4590.2340.2160.32960.2500.3750.1500.078
Table 6. Weights for indicators used in the study regarding digital maturity of the EU countries.
Technology Artificial Intelligence3D PrintingBig Data AnalyticsRoboticsCloud Computing ServicesHorizontal IntegrationVertical IntegrationCybersecurity
Indicator Analysis of big data internally using machine learningUse of 3D printingAnalysis of big data internally from any data sourceUse of industrial or service robotsPurchase of cloud computing services used over the internetEnterprises sending eInvoices, suitable for automated processingEnterprises that have ERP softwareICT security measure used: strong password authentication
Weight of indicator0.260.260.130.110.060.150.020.01
Table 7. Values for WSM, WPM, and WASPAS indicators as well as the ranking of individual EU countries.
Countries WSM   Q i ( 1 ) WPM   Q i ( 2 ) WASPAS   Q j Ranking
Belgium0.4960.0680.2828
Bulgaria0.2220.0270.12523
Czechia0.3680.0460.20714
Denmark0.7170.1050.4111
Germany0.4250.0540.2409
Estonia0.3150.0450.18018
Ireland0.5120.0660.2894
Greece0.1940.0250.10925
Spain0.4060.0610.23310
France0.3800.0510.21613
Croatia0.4040.0560.23012
Italy0.5040.0630.2847
Cyprus0.2950.0310.16320
Latvia0.1870.0260.10626
Lithuania0.3030.0470.17519
Luxembourg0.3340.0450.18917
Hungary0.2140.0280.12124
Malta0.6640.1030.3832
Netherlands0.5030.0730.2885
Austria0.3590.0520.20515
Poland0.2580.0320.14522
Portugal0.3570.0510.20416
Romania0.1790.0250.10227
Slovenia0.4100.0540.23211
Slovakia0.2830.0340.15821
Finland0.6550.0990.3773
Sweden0.4960.0770.2876
Table 8. Elements of clusters with distances form centers.
Cluster 1Distances from
the Center of Cluster 1
Cluster 2Distances from
the Center of Cluster 2
Cluster 3Distances from
the Center of Cluster 3
Cluster 4Distances from
the Center of Cluster 4
Belgium5.68Greece7.58Bulgaria6.70Denmark8.12
Ireland6.53Spain4.31Czechia4.02Estonia7.24
Malta3.73France5.44Germany4.73Italy10.63
Netherlands3.82Croatia8.89Cyprus5.30Slovenia10.88
Lithuania3.80Latvia3.99Finland10.09
Austria4.36Luxembourg4.68Sweden8.36
Romania8.65Hungary7.15
Poland1.51
Portugal4.97
Slovakia1.61
Table 9. Descriptive statistics of clusters.
MeanStandard DeviationVariance
Cluster 1–4 Objects
Analysis of big data internally using machine learning9.757.9362.92
Use of 3D printing5.502.526.33
Use of industrial or service robots6.252.998.92
Analysis of big data internally from any data source24.753.4011.58
Purchase of cloud computing services used over the internet52.501.001.00
Enterprises sending eInvoices, suitable for automated processing23.003.1610.00
Enterprises that have ERP software package40.2512.12146.92
ICT security measure used: strong password authentication79.505.3228.33
Cluster 2–7 objects
Analysis of big data internally using machine learning2.291.111.24
Use of 3D printing3.711.381.90
Use of industrial or service robots6.002.164.67
Analysis of big data internally from any data source10.145.4029.14
Purchase of cloud computing services used over the internet27.719.1283.24
Enterprises sending eInvoices, suitable for automated processing24.8610.99120.81
Enterprises that have ERP software package 38.4310.15102.95
ICT security measure used: strong password authentication63.716.8246.57
Cluster 3–10 objects
Analysis big data internally using machine learning1.500.710.50
Use of 3D printing4.201.622.62
Use of industrial or service robots5.801.933.73
Analysis of big data internally from any data source8.804.7622.62
Purchase of cloud computing services used over the internet26.206.7645.73
Enterprises sending eInvoices, suitable for automated processing14.102.425.88
Enterprises that have ERP software 31.208.4070.62
ICT security measure used: strong password authentication77.907.2652.77
Cluster 4–6 objects
Analysis of big data internally using machine learning3.671.512.27
Use of 3D printing5.672.345.47
Use of industrial or service robots8.173.4311.77
Analysis of big data internally from any data source12.677.5056.27
Purchase of cloud computing services used over the internet61.0012.85165.20
Enterprises sending eInvoices, suitable for automated processing66.6718.60345.87
Enterprises that have ERP software package 37.338.3169.07
ICT security measure used: strong password authentication74.5013.35178.30
Table 10. Analysis of variance for digital maturity determinants.
Determinants Between SSdfInside SSdfFSignificance p
Analysis of big data internally using machine learning206.513212.01237.470.001
Use of 3D printing17.16381.36231.620.21
Use of industrial or service robots23.483147.18231.220.32
Analysis of big data internally from any data source775.763694.54238.560.0005
Purchase of cloud computing services used over the internet6146.6431740.032327.080.0000001
Enterprises sending eInvoices, suitable for automated processing10975.5832537.092333.170.00000002
Enterprises that have ERP software package 353.2732039.40231.330.29
ICT security measure used: strong password authentication1012.8031730.83234.490.013
Publisher’s Note: MDPI stays neutral with regard to jurisdictional claims in published maps and institutional affiliations.

