Article

The Impact of COVID-19 on the Dynamic Topology and Network Flow of World Stock Markets

1
Department of Business Administration, Iqra University, Karachi 75850, Pakistan
2
School of Finance and Economics, Jiangsu University, Zhenjiang 212013, China
*
Author to whom correspondence should be addressed.
J. Open Innov. Technol. Mark. Complex. 2021, 7(4), 241; https://doi.org/10.3390/joitmc7040241
Submission received: 22 October 2021 / Revised: 22 November 2021 / Accepted: 23 November 2021 / Published: 6 December 2021

Abstract

:
Studies examining the impact of COVID-19 using network dynamics are scant and tend to evaluate a specific local stock market. We present a thorough investigation of 58 world stock market networks using a complex network approach spanning across the uncertain times that have resulted from the coronavirus outbreak. First, we use the daily closing prices of the world stock market indices to construct dynamic complex networks and sixteen minimum spanning tree (MST) maps for the period from December 2019 to March 2021. Second, we present the topological evolution properties of time-varying MSTs by applying normalized tree length, diameter, average path length, and centrality measures. Moreover, the empirical results suggest that (1) the highest correlation among the world stock markets is observed during the first wave of the COVID-19 pandemic in the months of February–March 2020; (2) most of the MSTs appear lower in hierarchy, and many chain-like structures are formed due to the sheer impact of pandemic-related crises; (3) Germany remained a hub node in many of the MSTs; and (4) the tree severely contracted during the first wave of the COVID-19 outbreak (during the months of February and March 2020) and expanded slightly afterwards. Moreover, the results obtained from this study can be used for the development of financial stability policies and stock market regulations worldwide.

1. Introduction

It all started on 31 December 2019, when Wuhan, a major city in China, reported a bulk of cases of an illness presenting with pneumonia-like symptoms. Quickly after these reports began, COVID-19 had affected the whole of China and had spread all around the world. As of 5 May 2021, there were around 155.5 million confirmed cases and slightly more than 3.2 million COVID-19-related deaths worldwide (WHO situations reports, available at https://www.who.int/emergencies/diseases/novel-coronavirus-2019/situation-reports (assessed on 5 May 2021). The World Health Organization has already officially stated that the spread of COVID-19 has created a global pandemic. Presently, there is huge amount of uncertainty regarding the severity of this crisis, and its direction is unknown. However, it has been established that this pandemic will have serious implications for the economy, and therefore, the impact of the pandemic on financial markets is quite considerable [1]. Uncoordinated administrative reactions and country-wide lockdowns have paused economic activities and have disrupted the supply and demand chain. Numerous countries have pledged individual country-specific and global rescue packages to minimize the economic implications of the COVID-19 crisis [2]. However, the uncertain times that have been caused by the COVID-19 crisis and its negative effects on the stability of the world’s financial markets [3] remain largely unstudied.
As expected, the financial impact of the pandemic on the world’s financial markets is huge when considering the fact that the rapid spread of the virus affected almost every economic sector. In addition, COVID-19 resulted in abrupt price changes in the world stock markets; for example, the US stock market hit the circuit breaker mechanism for the first time in over two decades [4]; the South Korean stock market, KOSPI, dropped below 1600 points during the pandemic [5]; and the Indian Sensex index witnessed a rapid decline of 13.2% in the month of March 2020, which was due to the lockdown and restriction measures that were implemented by various governments. A few studies have examined the impact of COVID-19 on financial markets and have found severe negative effects on various stock markets around the world [6,7,8]. However, the limitation of the existing studies that are related to COVID-19 is that they fail to consider the interdependency and dynamic evolution of stock markets.
In this paper, we contribute to the existing literature by examining the dynamic correlation-based networks of 58 world stock markets during the uncertain times caused by the COVID-19 pandemic using the network-based minimum spanning tree (MST) method. The main aim of our study is to inspect the time-varying world stock market networks and, more significantly, to explore the flow of the network structures and their connectedness. In addition, the existing literature mostly focuses on stock market performance; therefore, this study examines the topological evolution of MSTs and world stock market performance during the ongoing global pandemic. Finally, the timeline used in this study allows for a comprehensive investigation of world stock market networks and their topological evolution by encompassing both the first and second waves of the COVID-19 pandemic. An analysis of the world stock markets using a network-based method would be useful for investors in order for them to make better decisions and for policy makers to ensure stability by observing the changing influence and connectedness of the world stock markets during the present periods of crisis and contagion.
The remainder of this paper is structured as follows: Section 2 reviews the existing literature on COVID-19 as well as financial network literature. Section 3 introduces the minimum spanning tree methodology and network topology measures. Section 4 briefly explains the data. Section 5 presents the empirical results, and Section 6 concludes the paper.

2. Literature Review

The spread of the COVID-19 outbreak was unprecedented, and because of this, it has produced wider uncertainty and is considered to be a great test for the stability and resilience of the world financial system [9]. Numerous studies examining the impact of the pandemic on financial markets have emerged within a short span of time. For example, Ref. [10] used the wavelet method to assess the impact of COVID-19 on currency and cryptocurrency markets from January to May 2020. Despite using a relatively short period, they demonstrated that the COVID-19 outbreak fueled panic, resulting in greater coherence among the panic index and the price movements of various currencies. In addition, Ref. [11] found a substantial increase in the return and volume of cryptocurrencies under financial market stress that served as safe-haven instruments for the investors during the pandemic period. Further, the results of [12] highlighted that the government restrictions that were placed on commercial activities led to unusual reactions in the US stock market during the pandemic. Moreover, Ref. [13] used the GARCH model to examine volatility using 12 sectoral indices that were listed in the Tunisian stock market (TSE) between January 2016 and April 2020. Their results found continuing volatilities and significant asymmetric effects among various sectors during the COVID-19 pandemic.
Numerous methods have been used in exploring the extent of COVID-19 outbreak on the stock market performance. The authors of [14] used a panel Vector Autoregressive (pVAR) model and found negative oil stock returns due to the uncertainty created by the COVID-19 pandemic. Furthermore, Ref. [15] applied the traditional event study method on the companies listed in the Chinese stock market between July 2019 and March 2020. In addition to identifying negative abnormal returns during post-event trading days in the Chinese stock market, their results also showed a wide spread of negative investor sentiments due to the COVID-19 crisis. Similarly, Ref. [16] used event study methodology and showed that the event of the US stock market crash during the month of March 2020 was triggered mostly by the COVID-19 pandemic. While investigating the effect of the COVID-19 pandemic on the Australian stock market, Ref. [17] used the dynamic conditional correlation fractionally integrated generalized autoregressive conditional heteroskedasticity (DCC-FIGARCH) model and found a substantial increase in the dynamic correlations among the Chinese and Australian stock market sector indices, along with a negative effect of the COVID-19 pandemic on numerous sectors. Moreover, Ref. [18] employed the smooth transition HAR model on stock markets of the G7 member countries, and their results show varied intensity and timings of the crisis in all countries, In addition, their results demonstrate that the COVID-19 pandemic severely affected the performance of the two key sectors of consumer services and health care. To examine stock market connectedness in the time of the COVID-19 pandemic, Ref. [19] used the network analysis method and found higher density and clustering in the Hong Kong stock market. Similarly, Ref. [20] used the complex network method on twenty global stock markets between August 2019 and March 2020. Their findings showed high network centrality, shorter distance, and faster transmission among the stock networks during the COVID-19 time period.
Previous researchers have embraced complex network models in studying the static and dynamic properties of the stock market networks. For example, Ref. [21] examined the dynamic properties of S&P 100 constituent networks through the analysis based on rolling correlations and minimum spanning trees, concluding a dense tree network with a higher sectorial clustering. The authors of [22] proposed the dynamic spanning tree (DST), and found an influential node of the Hong Kong financial market in the Asia-Pacific region. In addition, Ref. [23] found numerous reactions and dynamics among the 57 stock market indices by using the dynamic correlation method. The authors of [24] used the rolling correlation coefficients (RCC) technique based on different time widows on the German stock market, and their results demonstrate structural breaks in the evolution of the global distance. Moreover, numerous studies used the minimum spanning tree (MST) approach to investigate the network structures and topology of the local stock markets, for example, the UK stock market [25,26], Brazil stock market [27], China stock market [28,29], Vietnam stock market [30], German stock market [31], Turkey stock market [32], Italy stock market [33], and Pakistan Stock market [34,35].
Moreover, fewer studies have examined the interdependency and dynamic evolution of the global stock market indices. The authors of [36] examined 51 global stock indices using the dynamic conditional correlation method, and found that European stock markets acted as an information transmission hub in the tree structure. The authors of [37] found a star-like minimum spanning tree structure of the 20 financial market indices prior to the crisis that turned out to be a chain-like structure during the crisis period. In addition, the results in [38] demonstrate regional clustering, and strong integration during the economic crises between 21 stock indices. Recently, Ref. [39] constructed Pearson-correlation-based and partial-correlation-based minimum spanning tree structures of the 57 world stock markets, and their results found two large clusters belonging to the European and Asia-Pacific regions. Moreover, their results show tight correlations among various nodes of the network during the financial crisis time period of 2008. After applying MST on the 38 global indices, Ref. [40] experienced weakening in the form of a reduction in the edge numbers of the key nodes after the crisis event.
Since stock markets are termed as complex systems [41], empirical analysis based on complex networks has been the new worldwide focus [42,43,44]. However, the literature concerning the association between topological evolution of the stock network and market performance appears to be sparse; these studies therefore provide mechanisms to better comprehend topology variations in the stock networks and perform risk management perspectives. Hence, this is a first study to uncover dynamic world stock networks and topological evolution using a complex network method by covering an extensive timeline including the first and second wave of the COVID-19 pandemic.

3. Methodology

This paper constructed dynamic networks based on the rolling window approach. The rolling correlation coefficients are converted into their respective distance matrices and world stock market networks are formed. It is possible to form the correlations among a combination of stocks having a specific time window. Where P i ( t ) is the closing price of stock s i , and logarithm return for s i at time of [ t t , t ] , this can be written as:
Y i ( t ) = l n   P i ( t ) l n P i ( t t )
As the literature suggests, daily log returns are employed when t = 1 . For any given stock indices of s i and s j , we form the two closing price time series with a window of length L , which will be used to obtain subsets in an evolution of windows: [ 1 , L ] ,   [ 2 ,   L + 1 ] ,   . At any specific window, having the two time series of closing prices, it is likely to extract the log return time series through Equation ( 1 ) among stock indices s i and s j . Thereafter, the Pearson correlation coefficient among the stock indices is given as [45]:
C i j = r i   r j r i   r j ( r i 2 r i 2 )   ( r j 2 r j 2 )  
where .. represents the mean value. In a network, the correlation coefficients band is among [ 1 ,   1 ] , which produce the subsequent scenarios:
  • C i j = 0 : specify no correlation among the two stock indices.
  • C i j = 1 : specify perfect correlation among two stock indices.
  • C i j = 1 : specify negative or inverse correlation among two stock indices.
This paper comprises N = 58 world stock market indices, and therefore the correlation matrix shows an outlook of the complex system among 58 ( 58 1 ) / 2 pairs of stock links. By following Mantegna [45], the correlation matrix is further used to transform the distance d i j among stock pairs of s i and s j , denoted by:
d i j = 2 ( 1 C i j )
We apply the algorithm in [46] to an undirected graph G = ( N ,   E ,   W ) in formation of the MST. Moreover, the rolling window technique is largely used in the literature to construct dynamic network [47,48,49]. While relying on complex network theory, the study connects all pairs of nodes conforming to the distance matrix D m = ( d i , j m ) . In addition, the dynamic minimum spanning trees of numerous lengths L are obtained by dividing the timeline through the rolling window technique, and in this paper L is one month. The minimum spanning tree, represented as T , combines the graph-joining nodes N by forming N 1 links [50]:
T = ( i , j ) ϵ T d i j

Network Topology Properties

This paper examines the topological evolution of the dynamical MST structures. A network N = ( V , E ) is a graph containing a number of vertices V and a set of connections or edges E . In a stock network model, the stocks are mentioned as the vertices V , and the connection among two stocks i and j is described as the link e i j , associating the two vertices v i and v j . In this section, the topological properties of the normalized tree length (NTL), diameter, average path length (APL), and several common centrality measures are used for the world stock market networks.
To examine the length of the MST networks, normalized tree length [51] can be calculated using the following formula:
L ( t ) = 1 ( N 1 ) ( i , j ) T t   d i j
where T t is the edge set of MST networks, and d i j is the distance between stocks i and j . The average path length is defined as the average distance among two stock indexes in the world stock market network [52], as given below:
L ( t ) = 1 1 2 N ( N 1 )   i j   d i j
Degree of centrality of stock i is defined as:
C D ( i ) = j = 1 N A i j N 1
where A i j is the constituent of the i -th row and j -th column within an adjacency matrix A . The greater the value of C D ( i ) , the more power stock i carries in influencing other stocks of the network [53]. Closeness centrality assesses the shortest routes among all the nodes of the network, and allocates a score on every node while relying on its sum of shortest paths. It is a measure of the tendency of the information flow from one node to all other nodes of the network [54]. It is defined as:
C ( i ) = 1 d i = N 1 j = 1 N d i j
Betweenness centrality measures the degree to which a node lies on the paths among other nodes, where a higher number represents greater influences of the node in the overall network to transfer information [55]. The mathematical formula for the betweenness centrality is:
CB   ( k ) = s k t ϵ V   σ s t   ( k ) σ s t
where σ s t is the total number of shortest links.

4. Data

This paper makes use of the daily closing prices of the 58 world stock market indices between 2 December 2019 and 31 March 2021. We begin the sample construction by extracting the data of confirmed COVID-19 cases by country from the world health organization (WHO) coronavirus dashboard (available at: https://COVID19.who.int/info/ (accessed on 31 March 2021). Thereafter, the data for the world stock markets indices were downloaded from www.investing.com (accessed on 1 April 2021) website over the same period. Before running the analysis, stock indices are arranged in their respective continents and colored in the MSTs accordingly. Table A1 in Appendix A presents the list of the world stocks classified into their respective continents and colored accordingly in the MST, along with the first reported date of a confirmed COVID-19 case in the particular country. Previous studies examined the impact of COVID-19 on the stock markets by dividing the timeline into sub-periods of pre- and during the pandemic [7,56]. However, in order to examine the connectedness of each and every stock, we construct sixteen MSTs and studied their topological properties during the uncertain times of the global pandemic (COVID-19).

5. Findings

In this section, we present the findings of the minimum spanning tree analysis to measure the structural changes of N = 58 world stock indices, and analyze the topology evolution with respect to the COVID-19 crisis.

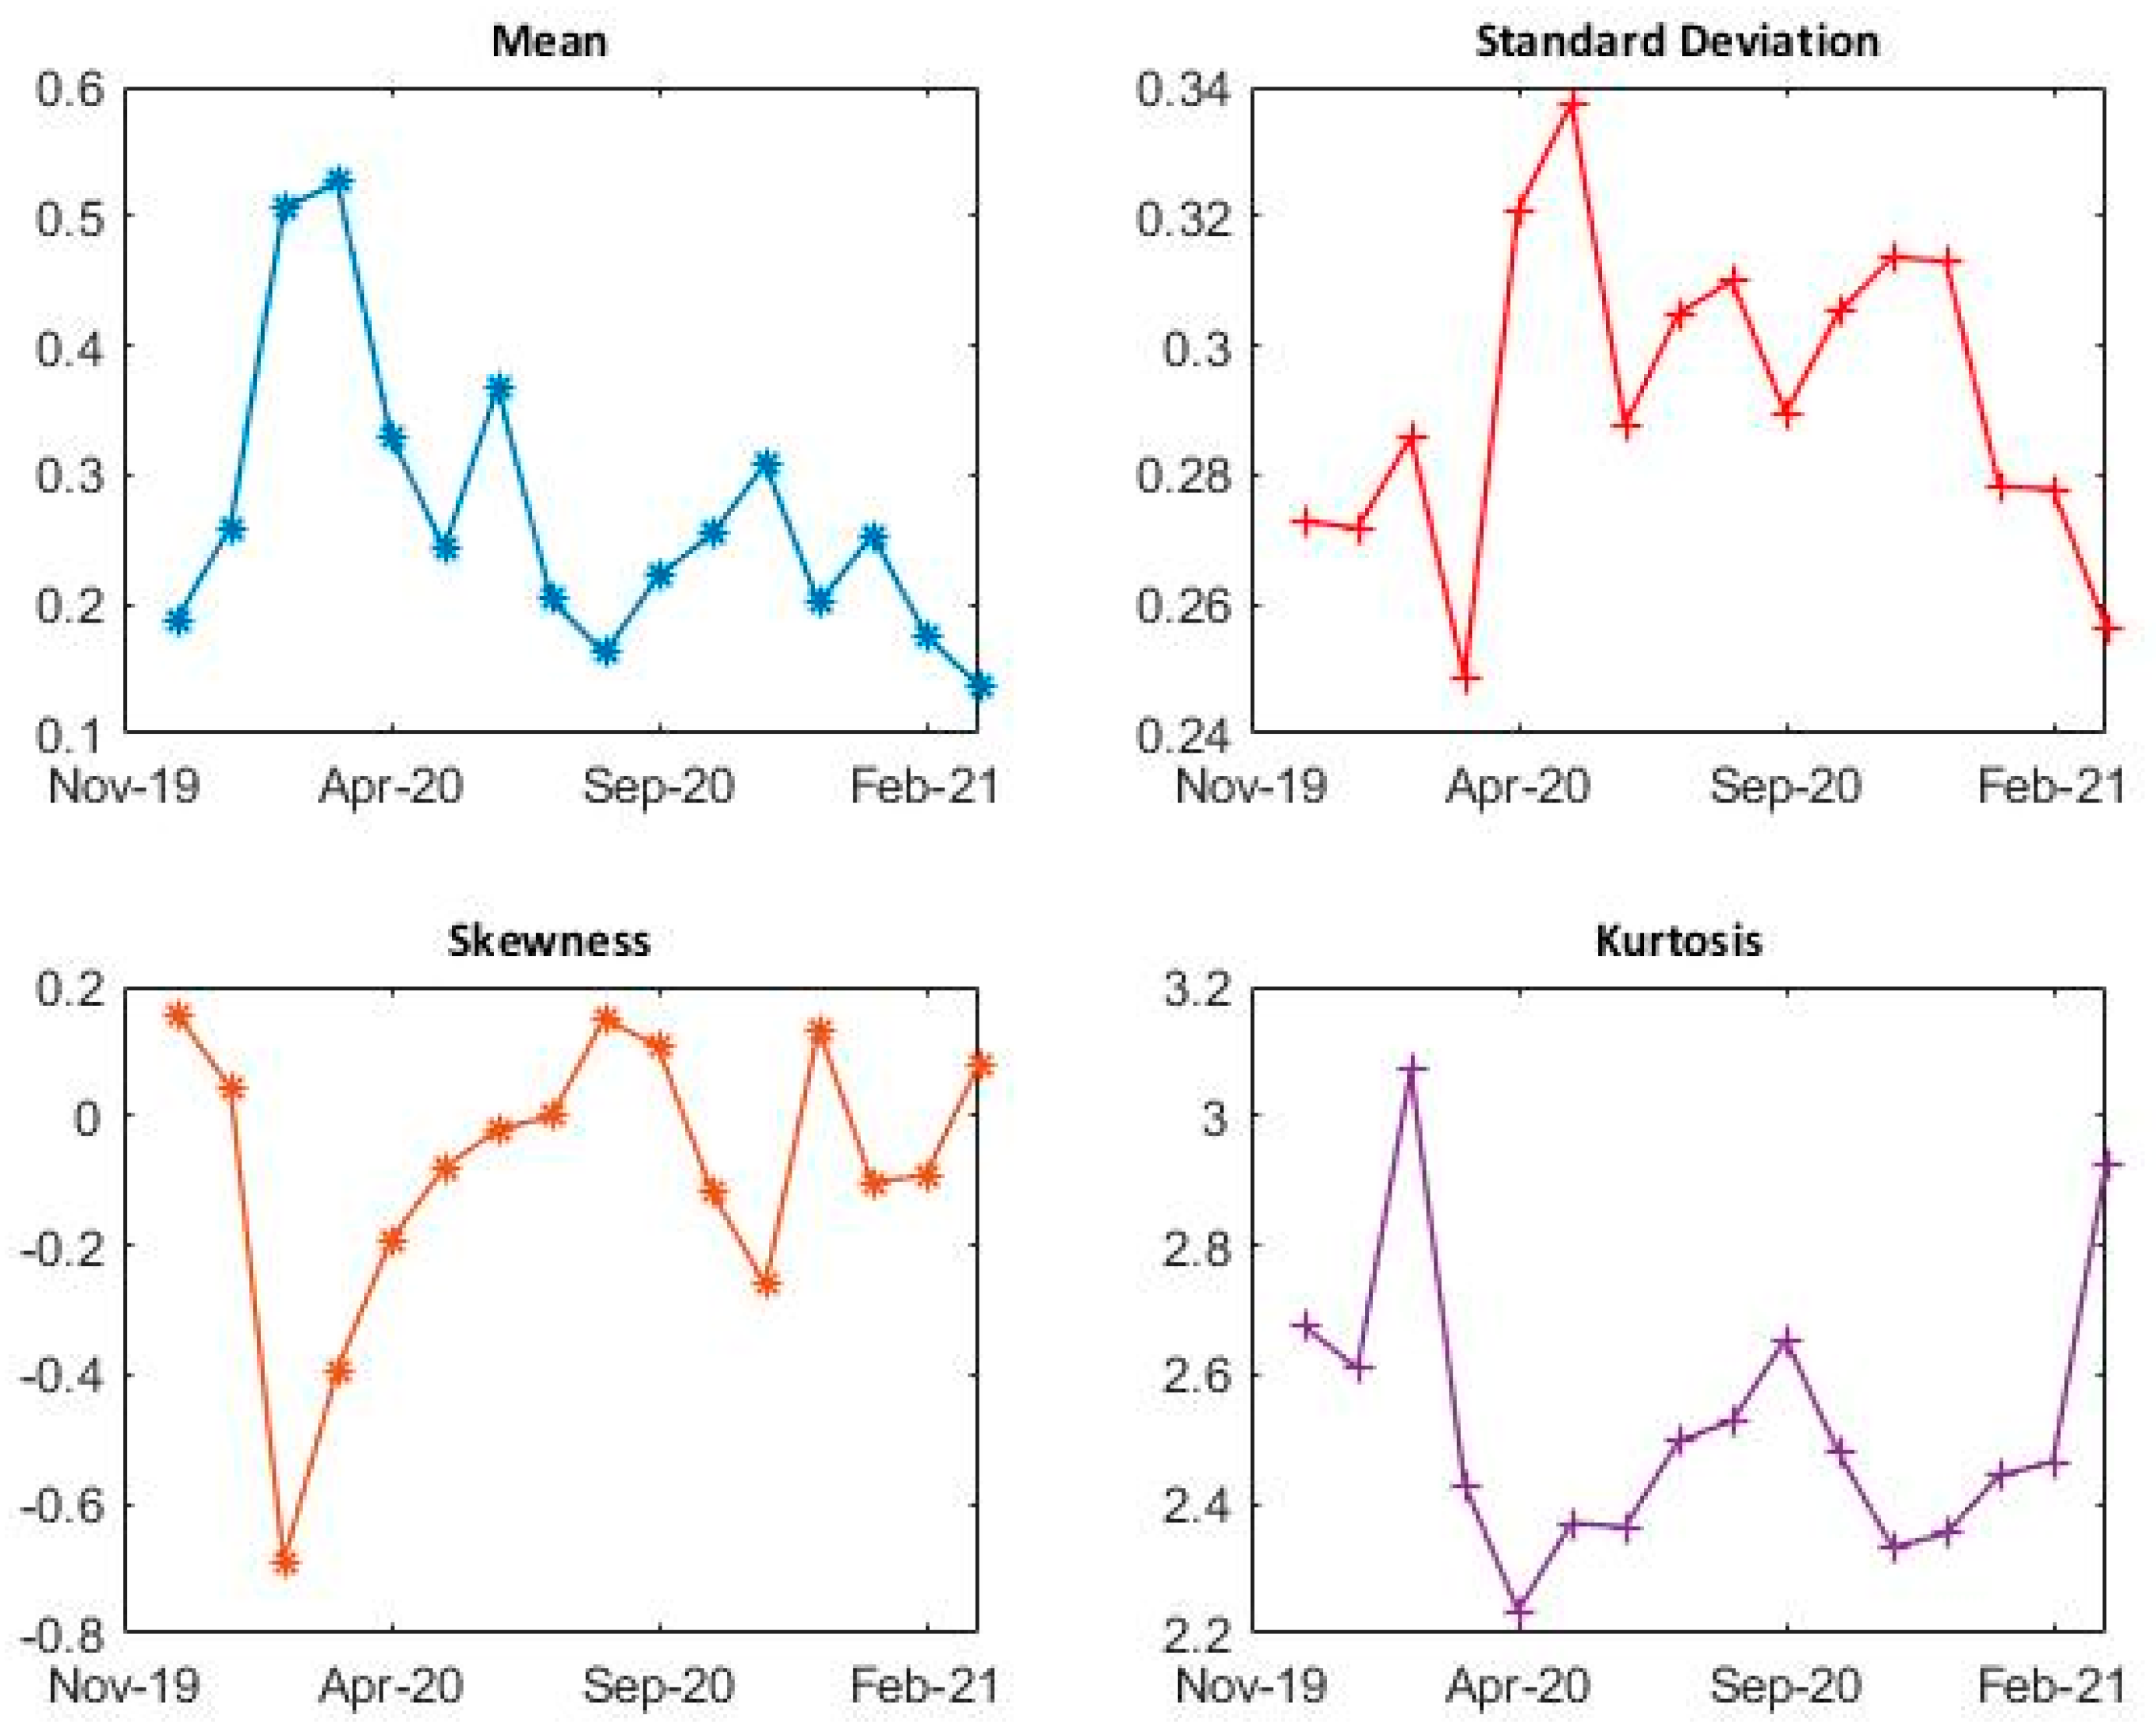
5.1. Dynamic Correlation Coefficients

The moving window correlation coefficients were used to assess the dynamics between world stock market indices during the uncertain time, starting from 2 December 2019 to 31 March 2021. Therefore, sixteen non-overlapping monthly windows were formed and the statistics of the dynamic correlation matrices are presented in Figure 1. The results show a tremendous increase in the mean correlations during the months of February–March 2020, the time when the first major wave of the global pandemic struck most of the countries of the world. The highest mean correlation among world stock markets is observed during the month of March 2020 of 0.5264, thus representing strong clusters. However, the highest standard deviation among the world stock markets of 0.3376 is noticed during the month of May 2020. These patterns align well with a sudden and irregular decrease near the infectious shock and pandemic outbreak. In addition, we observed that almost all return series of the world stock markets were designated by excess kurtosis, signifying a leptokurtic distribution with fat tails. Moreover, most of the correlation matrices show skewness towards left, as reflected by the significant negative value of the skewness. The results also show less correlation with the Chinese stock market, the country where the global pandemic initiated, with all the other stock markets of the world. However, a strong interaction and higher correlation is noticed between all the other stock markets of the world. Among the most correlated stock markets were those in the European region, due to a higher integration, as proved by previous studies [57]. In a nutshell, all of these findings show extreme uncertainty, higher correlation, and a volatile turbulent period for the world stock markets, which is not unusual given the negative external shocks exerted by the black swan event of COVID-19 [12,58,59].

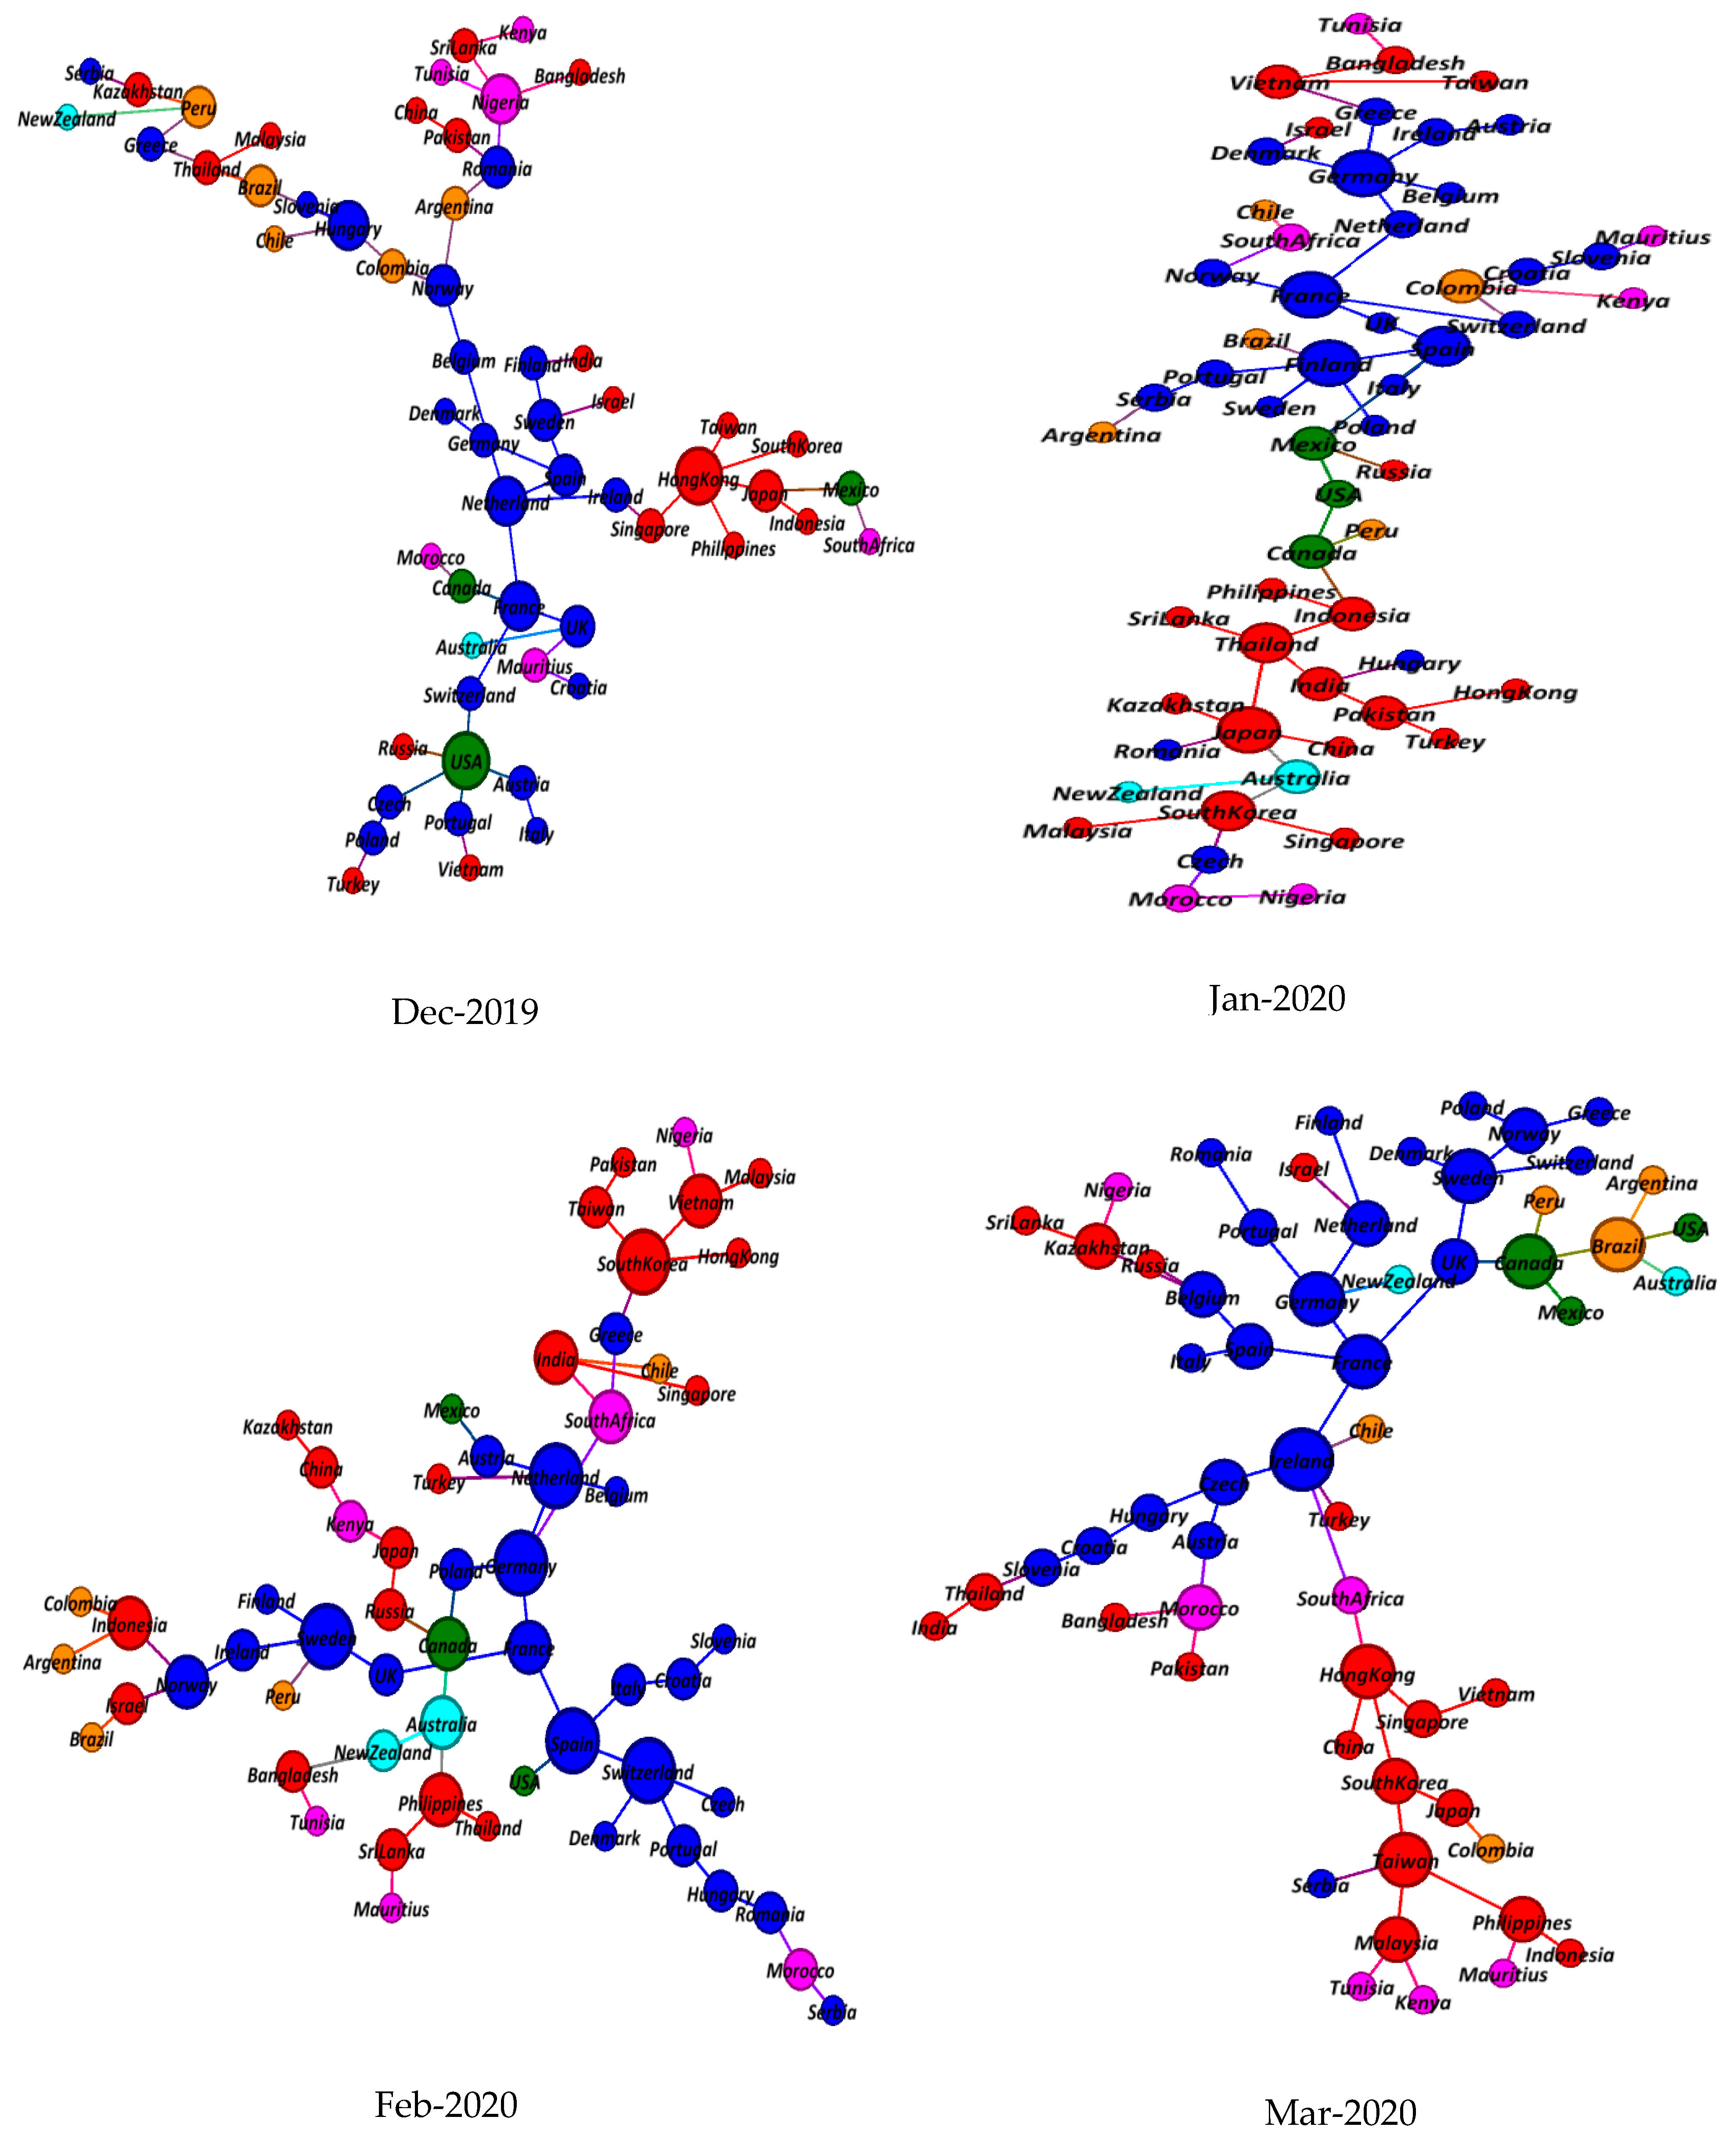
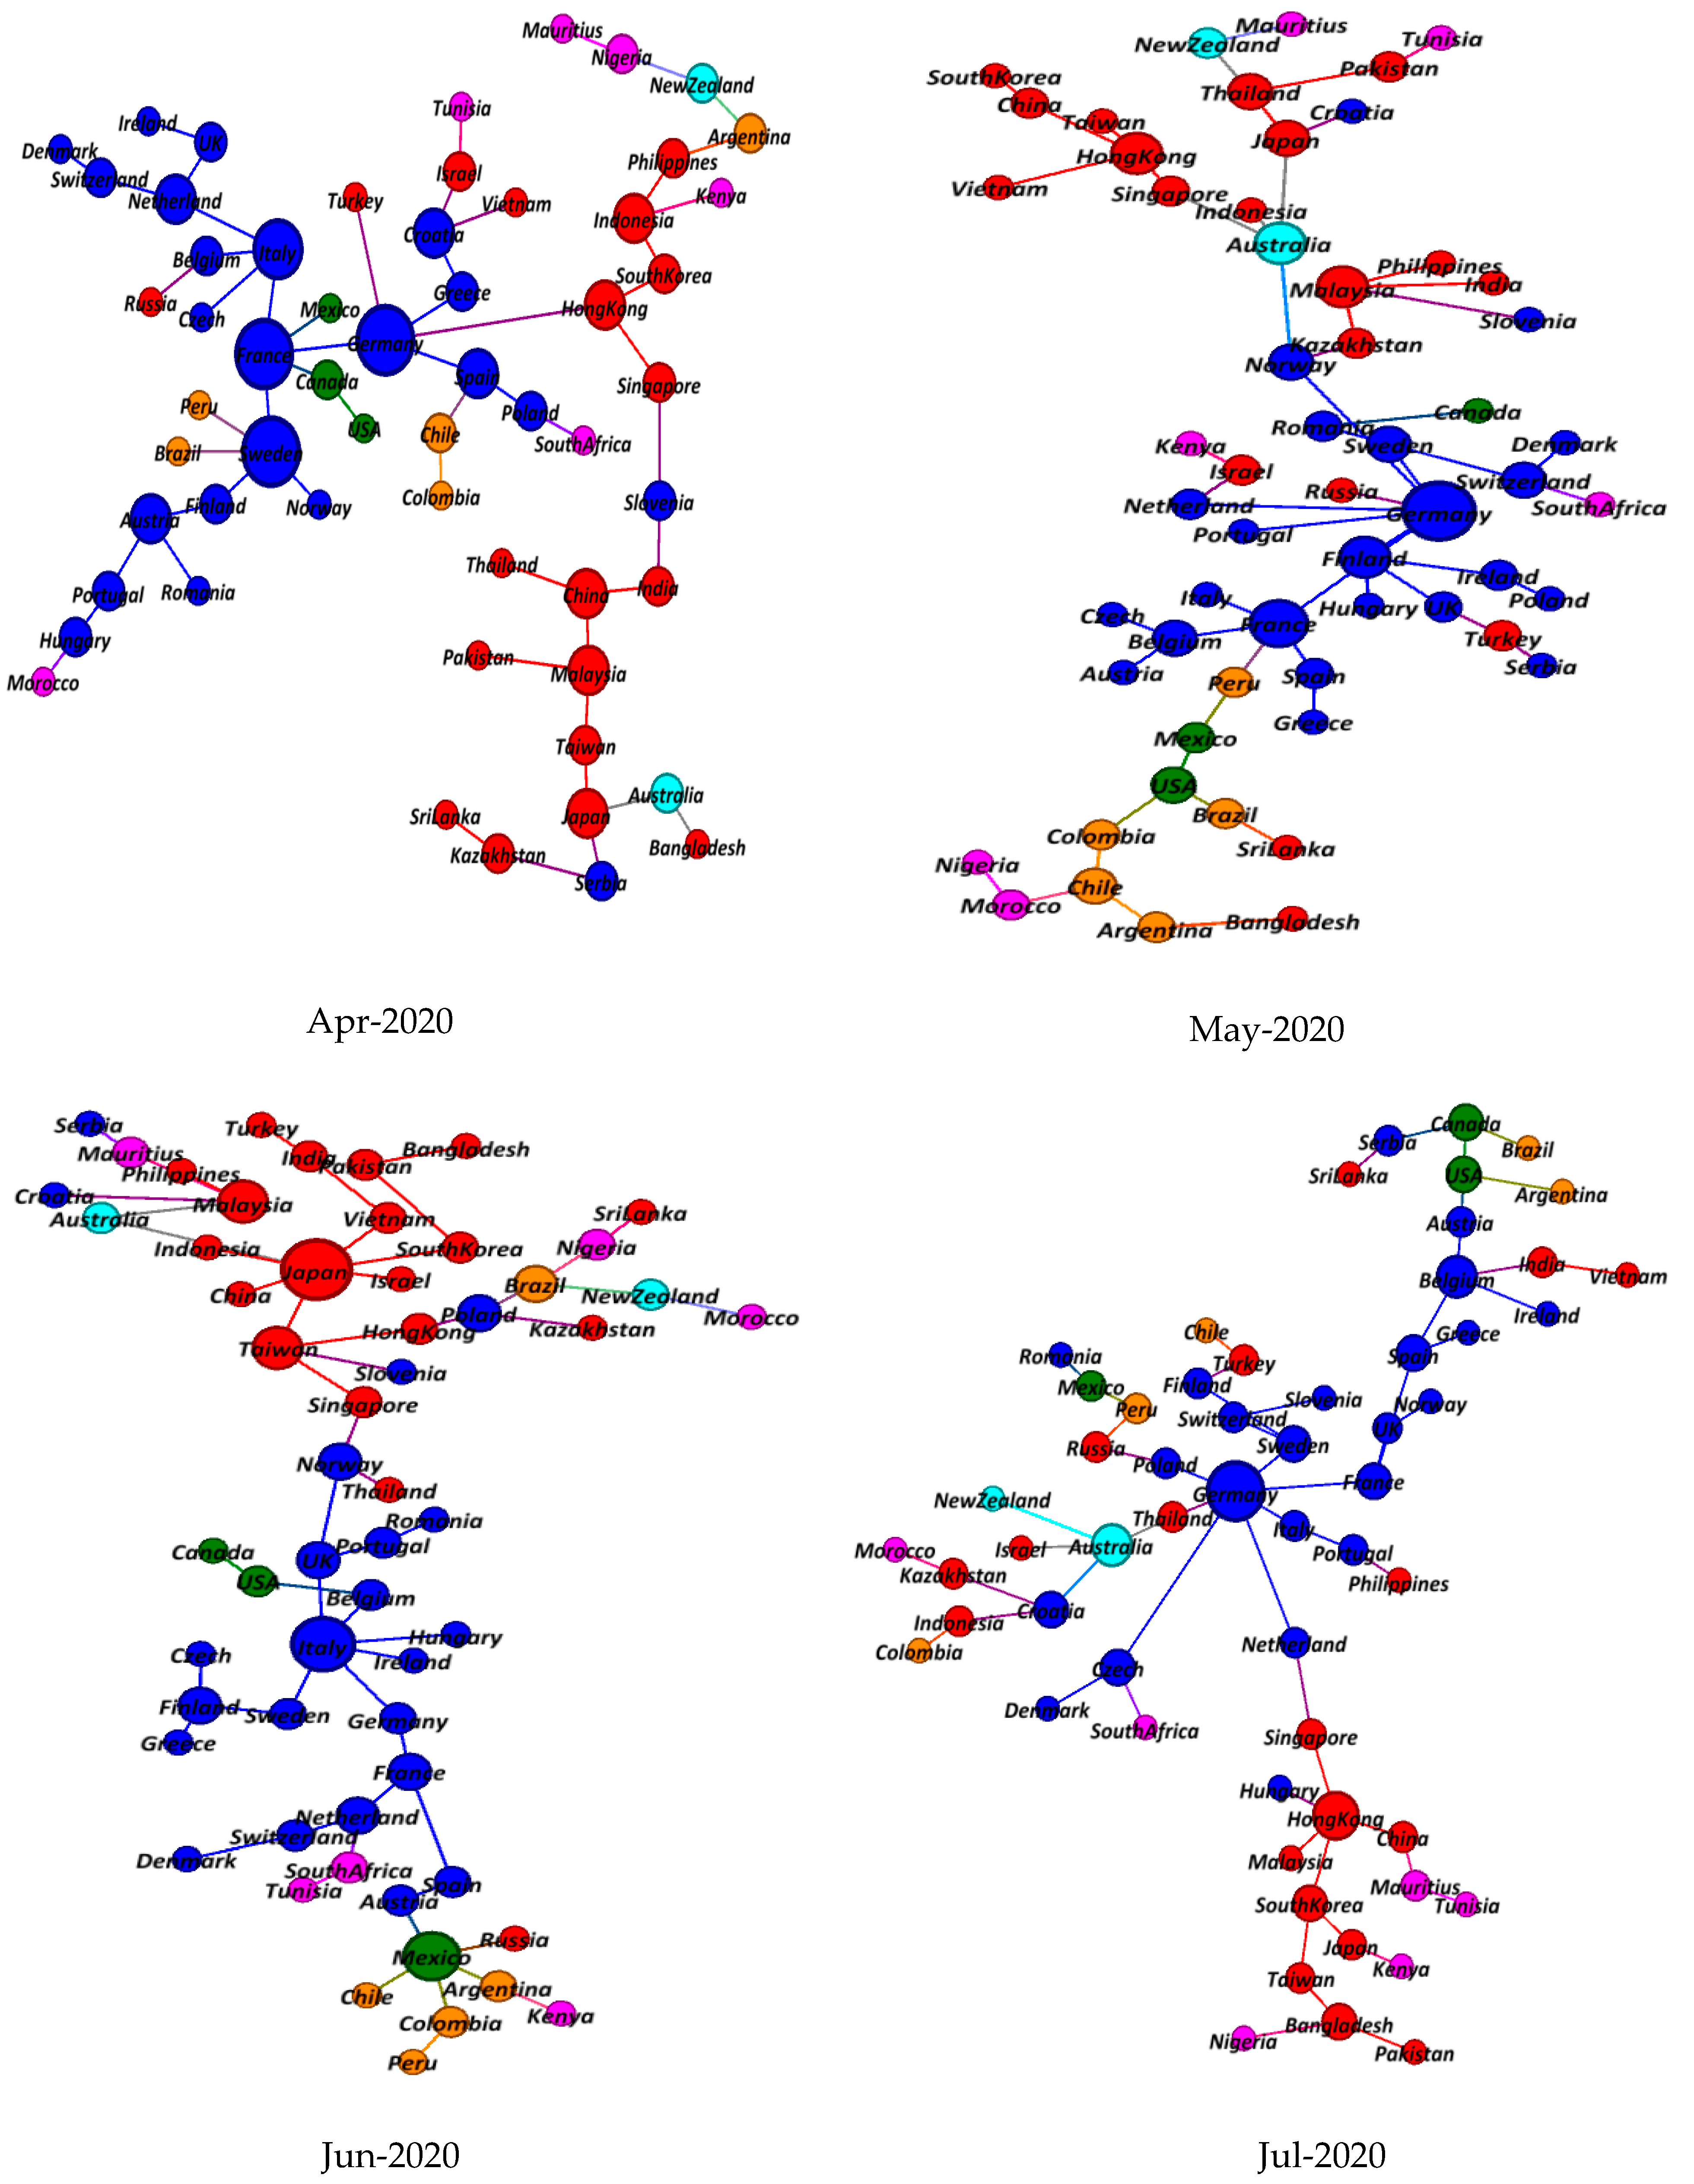
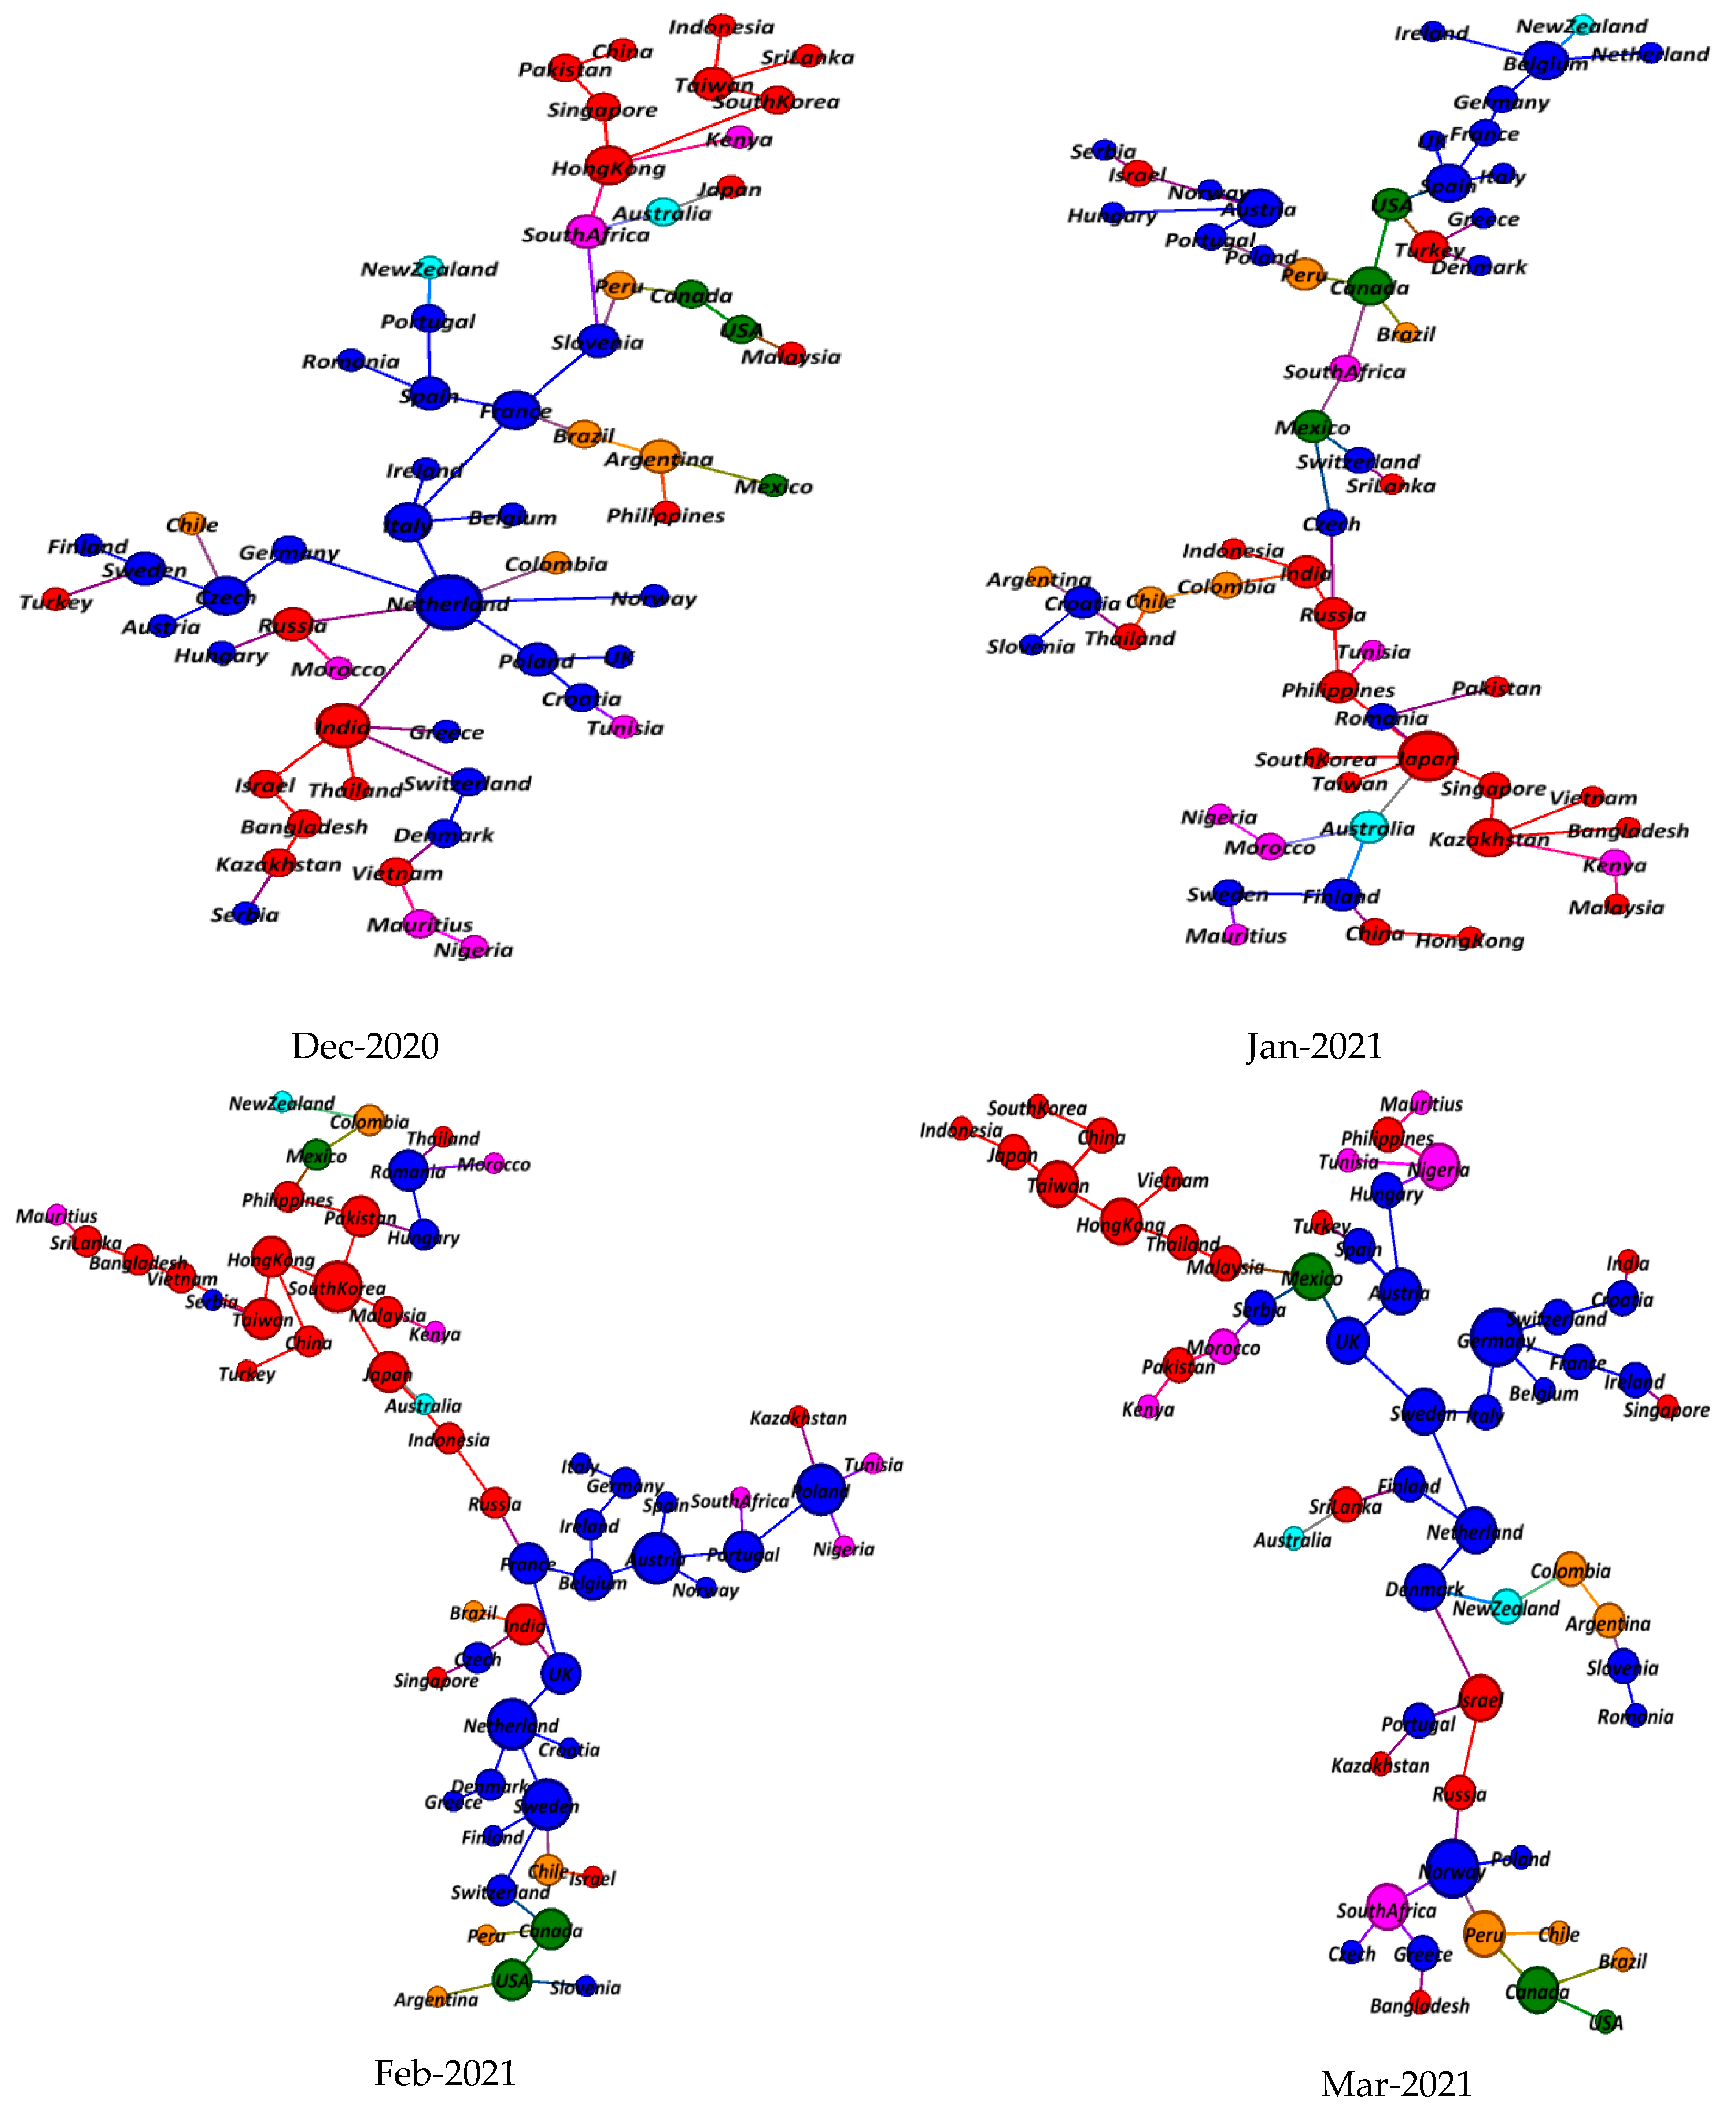
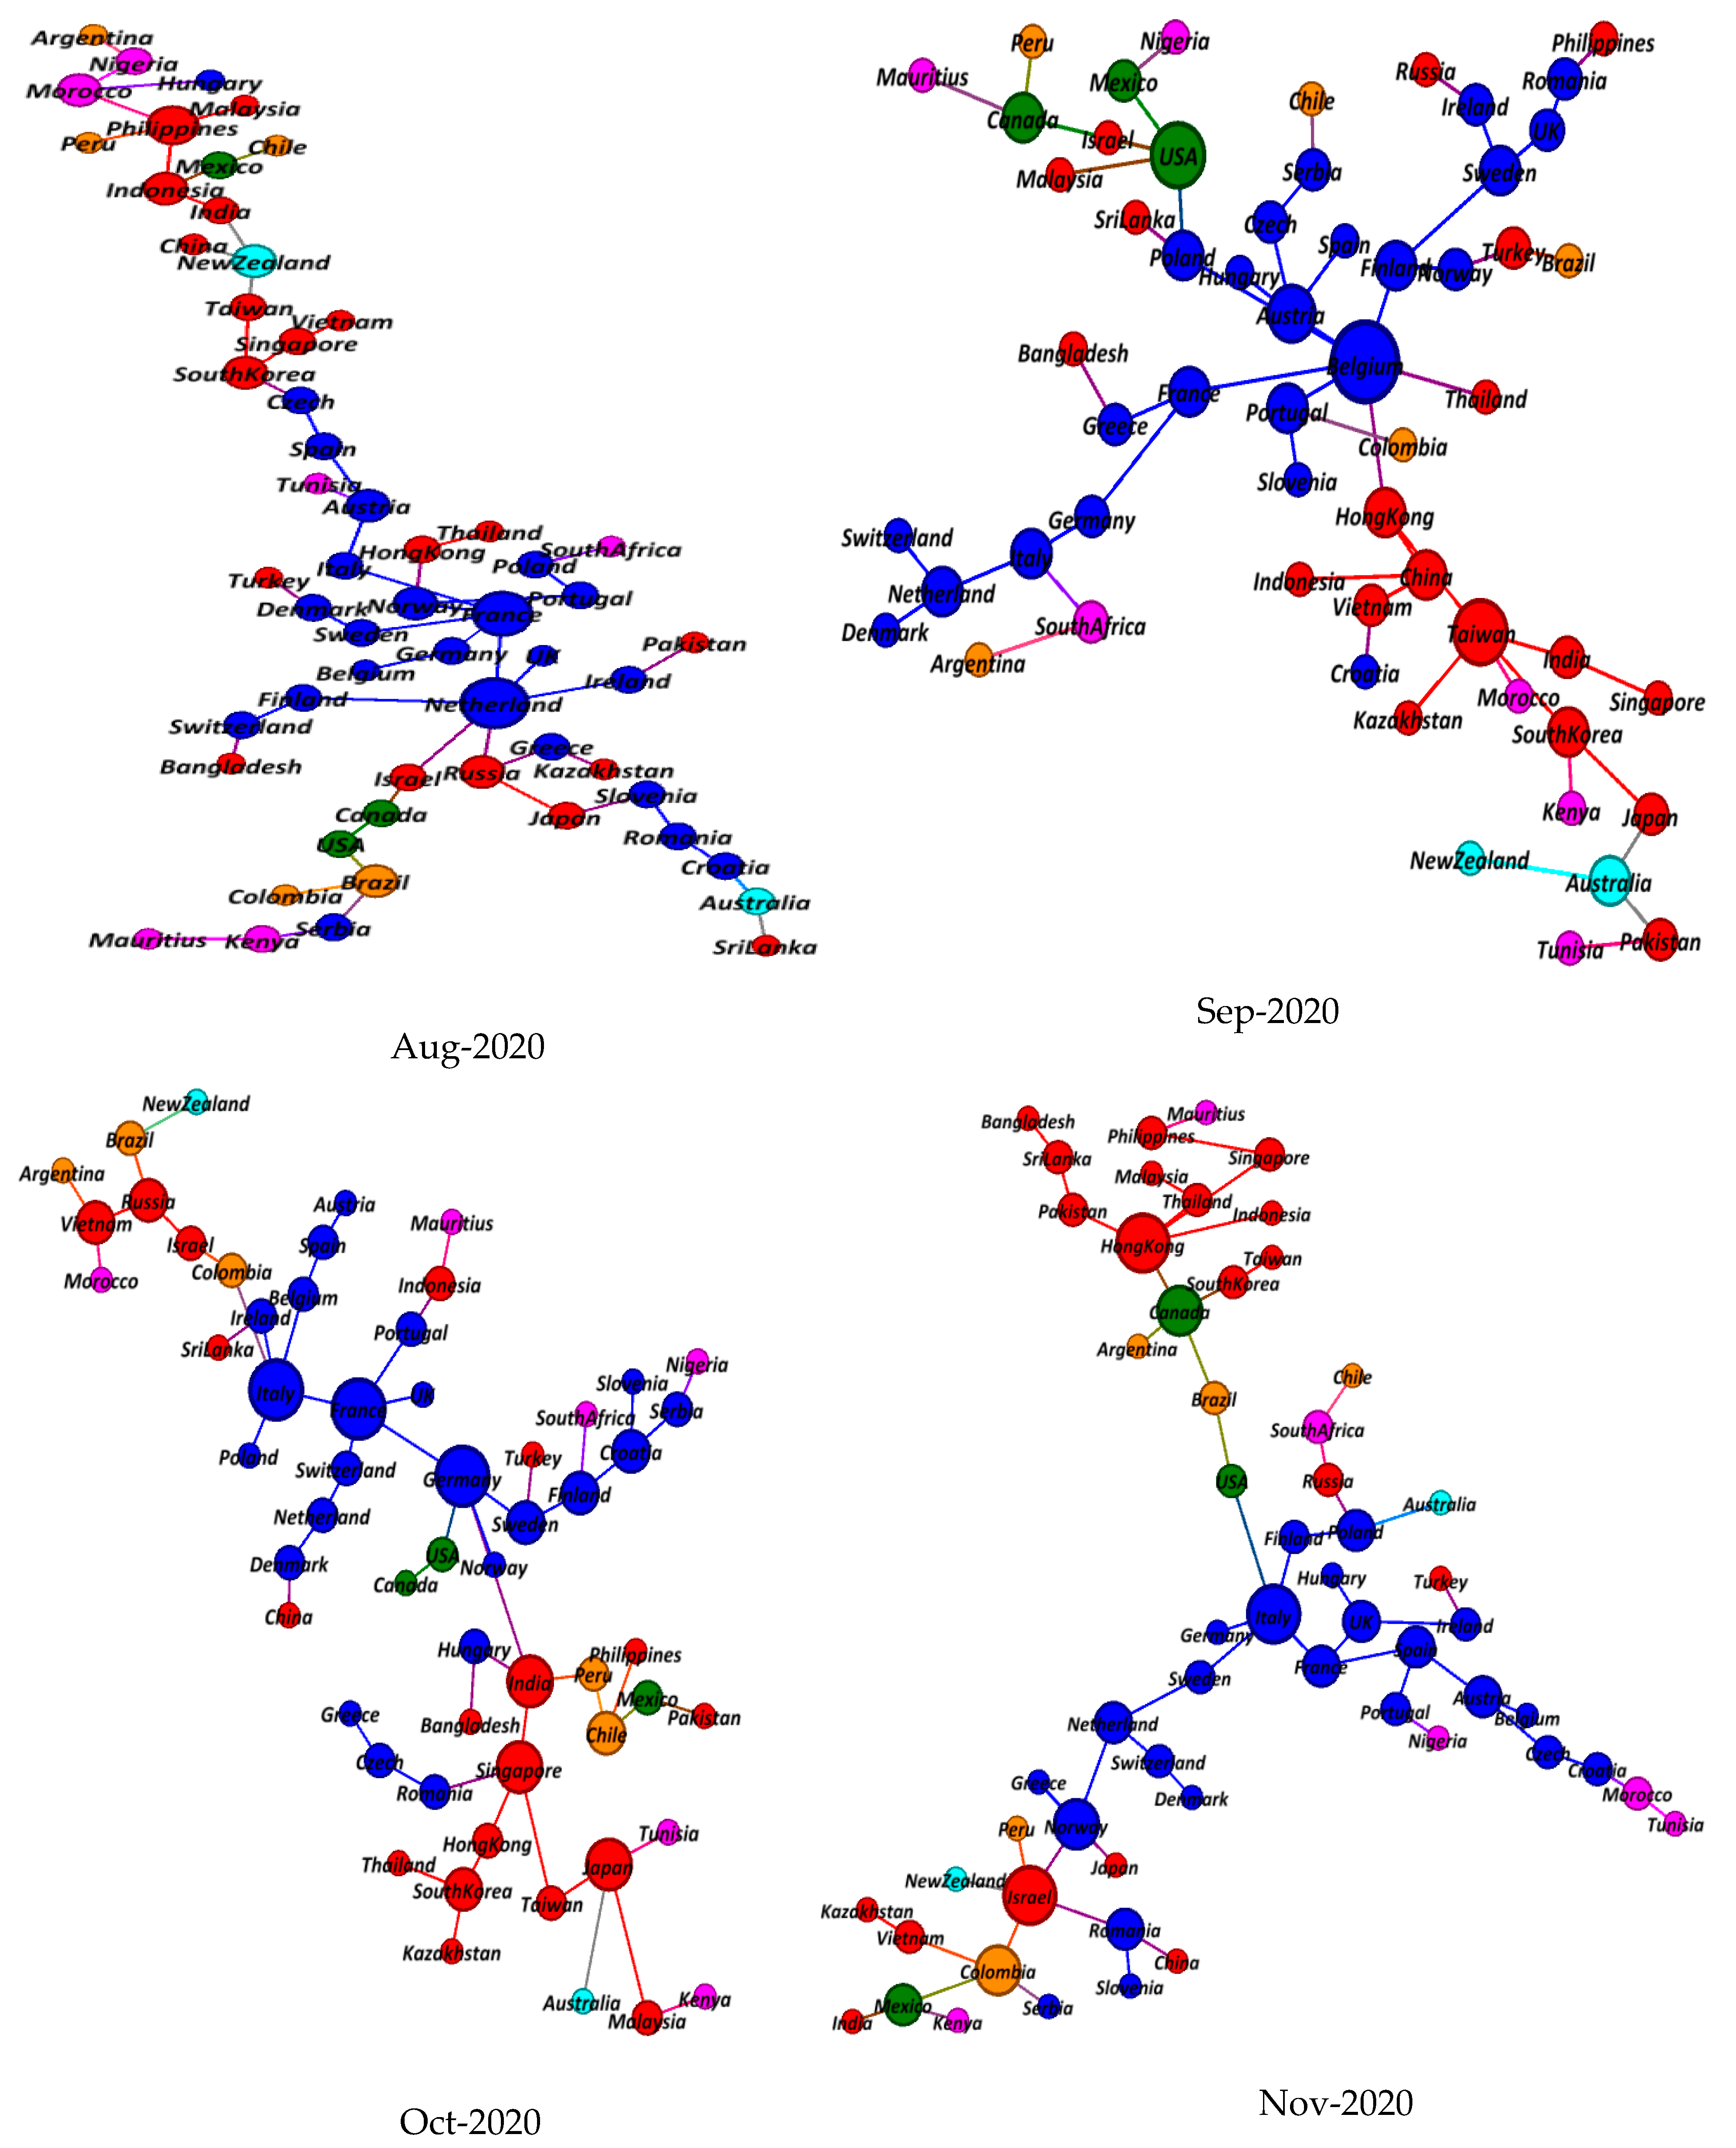
5.2. Minimum Spanning Tree Results

This subsection presents the minimum spanning tree maps from the starting month of the COVID-19 period until March 2021. Every node in the MST network presents a stock market, with a total of 58 world stock indices, as used in this paper. The moving window technique is used to construct sixteen monthly MST maps in order to examine the structural changes, evolving connectivity, and influence of the world stock markets indices. All nodes are sized based on their centrality score and classified by different colors based on their geographical region, as mentioned in Table A1 in Appendix A.
Figure 2 shows a comparison of the MST maps from December 2019 to March 2020. We immediately observe the non-hierarchical structure of the MSTs due to the turbulent timeline and uncertainty, where no influential stock markets are observed, resulting in an absence of big clusters in the center. These kinds of structures are commonly formed during the events of crisis, as reported in previous studies [35,60]. Early during December 2019, the MST structure shows two important nodes, Hong Kong and the USA, connecting directly with just five other nodes of the network. However, after China reported a cluster of cases having symptoms, these important nodes immediately lost their important position and were replaced by the European country nodes of Finland, France, and Germany, connected directly to five other nodes in the MST during the month of January 2020. In addition, the degree of connectivity remained low during the first wave of the COVID-19 outbreak, having a maximum degree of connection to five nodes during the months of December 2019, January 2020, March 2020, and April 2020, combined with four degrees of connections during the month of February 2020. This represents interactions between the stock markets making small clusters, and lower hierarchy, which makes the world stock market structures less resistant [61]. Furthermore, these findings show that stock markets responded negatively to the growth in the number of confirmed cases and reported deaths related to it. Moreover, the first phase of COVID-19 created a global uncertainty shock that impacted world stock markets, aggravated investors sentiments, and increased volatility.
Figure 3 presents comparative MST Maps from April 2020 to July 2020. The results show a slight increase in the degree of connections from five to seven between May and July 2020. In addition, the two most connected nodes wre Germany during the months of May and July 2020, while Japan remained significant node in the month of June 2020. In addition, all other nodes occupied less influential positions in the tree. The pivotal stock market of Germany connects mostly with the major European stock markets of Sweden, Finland, Netherland, and France. Furthermore, the results present a small number of clusters during the crisis time of the global pandemic within the European and Asian regions. The split of clusters and small cluster formation is a reflection of different responses due to the uncertainty and risks constituted by the COVID-19 pandemic.
The MST maps of world stock market indices between August and November 2020 are presented in Figure 4. We can find several notable structural changes in the MST, with varied influential stock markets occupying important positions in the tree. The central elements of the structures presented represent varied core nodes, consisting of the Netherlands connected with six other nodes, and Belgium connected with seven nodes of the network during the months of August and September 2020, respectively. However, the degree of connection declined thereafter, and remained just five in the next two months, comprising five core nodes of France, Germany, Italy, Hong Kong, and Israel. Furthermore, the results show that USA and Taiwan were connected to five other nodes of the network during the month of September. It is not surprising that the largest stock market of the USA did not take an influential position among most of the MSTs, which is possibly due to a greater connection among the European stock markets [17,39], in addition to being the utmost affected country of the global pandemic. Similarly, the stock markets from the African region (e.g., JSE 40, Kenya NSE 20, MASI, NSE 30, SEMDEX, TUNINDEX) did not form any cluster, and present a dispersed position in all the MSTs.
During the last month of December 2020, the European stock market of the Netherlands remained a key node, having seven degrees of connections, followed by the core node of India with five direct connections, as seen in Figure 5. The Netherlands is one of the competitive markets in the European region, but during the month of December 2020, the government made strict restrictions to curb the effects of the COVID-19 pandemic. In addition, the government of the Netherlands banned flights from the neighboring country of the United Kingdom, where a new variant of COVID-19 was detected. Therefore, the influential node changed position between January 2021 and March 2021. In addition, the connectivity of MSTs dropped immensely from seven in the month of December 2020 to six during the month of January 2021, and four in the months of February and March 2021. In terms of key nodes, Japan appeared as influential node, followed by Austria, and Germany in the subsequent three months. While comparing all the evolving MSTs, the results reveal several chain-like MST structures, the absence of an influential stock market, and low connectivity. Moreover, the results show that the first wave (early 2020) and second wave (early 2021) of the COVID-19 outbreak implied less connectivity and vulnerable MST structures. The risks and severe uncertainty posed by COVID-19 led to minor cluster formation in a few MSTs, having no major cluster. In addition, Germany remained a hub node in the majority of the dynamic MSTs; however, it was not a super-hub node. Furthermore, the results show that world’s largest stock market of the USA did not occupy a central position in most of the MSTs, commonly due to the severe hit of the global pandemic. Moreover, the Asian influential and competitive stock markets of China and Singapore remained less connected, and did not occupy the center hub position among the entire period. To conclude, all of these findings support the evidence of external and global common crisis events, which can severely affect the stability of different markets [34,62,63].

5.3. Topological Evolution Properties of MSTs

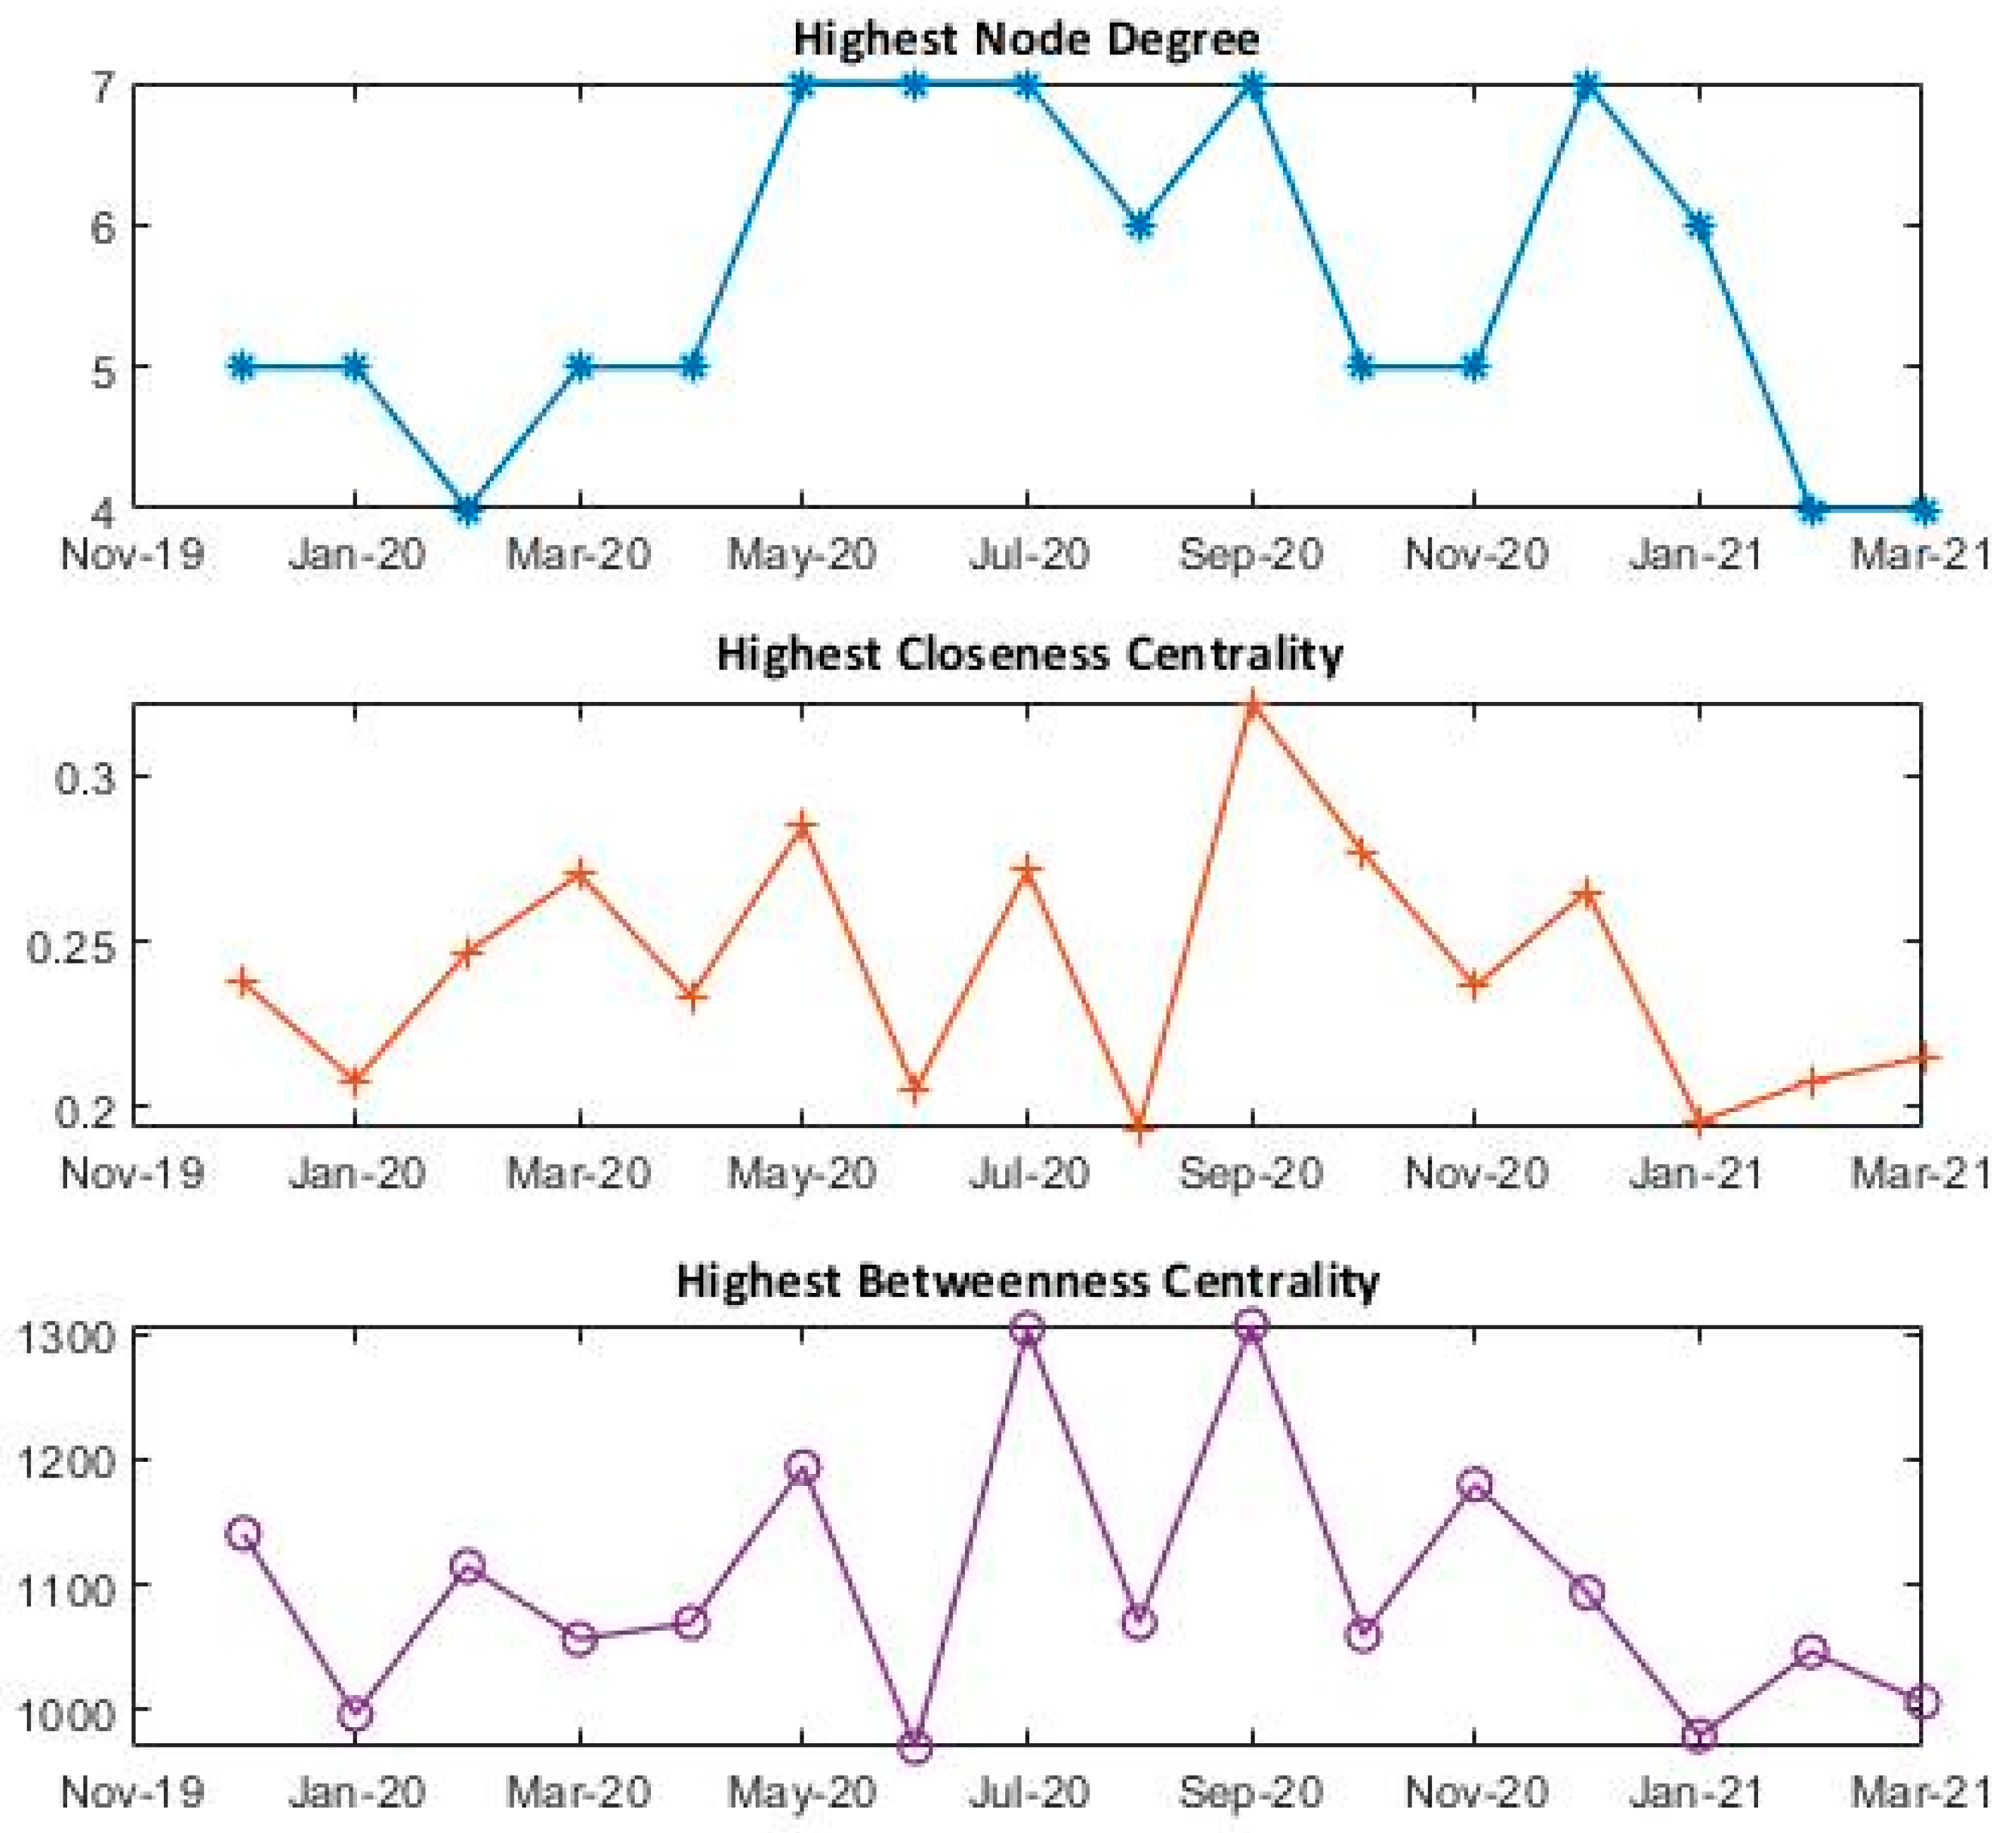
5.3.1. Centrality Analysis

Centrality methods are useful in recognizing the relative influence of the stock markets. We examine centrality structures of the world stock market networks using the degree of centrality, betweenness centrality, and closeness centrality to measure the evolution properties of the time-varying MST maps. Table 1 presents the frequency of node degree distribution, which clearly shows flat structures of MSTs, where the majority of the 58 stock markets of the world contain a small degree of centrality. The turbulent COVID-19 timeline shows that a number of nodes are connected with just one node of the network during the first and second wave of the COVID-19 pandemic. Further, the results confirm the formation of small clusters and the appearance of the hub nodes but not the super-hub nodes, possibly due to reconfiguration, during the consecutive months of May, June, July, September, and December 2020. Moreover, Figure 6 shows the highest node degree, highest betweenness centrality, and highest closeness centrality of the world stock market networks. The range of the highest node degree remained from 4 to 7, the highest betweenness centrality remained from 971 to 1307, and for the highest closeness centrality the range varied from 0.1939 to 0.3220, over the entire time. Furthermore, the results demonstrate the most significant node of Belgium, with the highest closeness centrality score of 0.3220, and highest betweenness centrality score of 1307 during the month of September 2020. The node with the highest betweenness centrality represents a greater influence on the overall network.
In addition, the key European stock market of Germany occupies the top position by appearing a majority of five times in the MSTs, with the highest betweenness and centrality scores. This represents the significance of the European stock markets containing a high number of short routes, and therefore, representing a strong intermediary role in all the MSTs. It is also worth noticing that none of the stock markets from any other continent apart from Europe occupied the top position with the highest betweenness centrality, and highest closeness centrality value, thus representing fewer links and a lower degree of influence in all the tree structures. In addition, it is observed that betweenness centrality declines during turbulent times [64], which aligns well with our results during the time of the first wave (early 2020) and second wave (early 2021) of COVID-19, where low scores of betweenness centrality of the MST are observed.

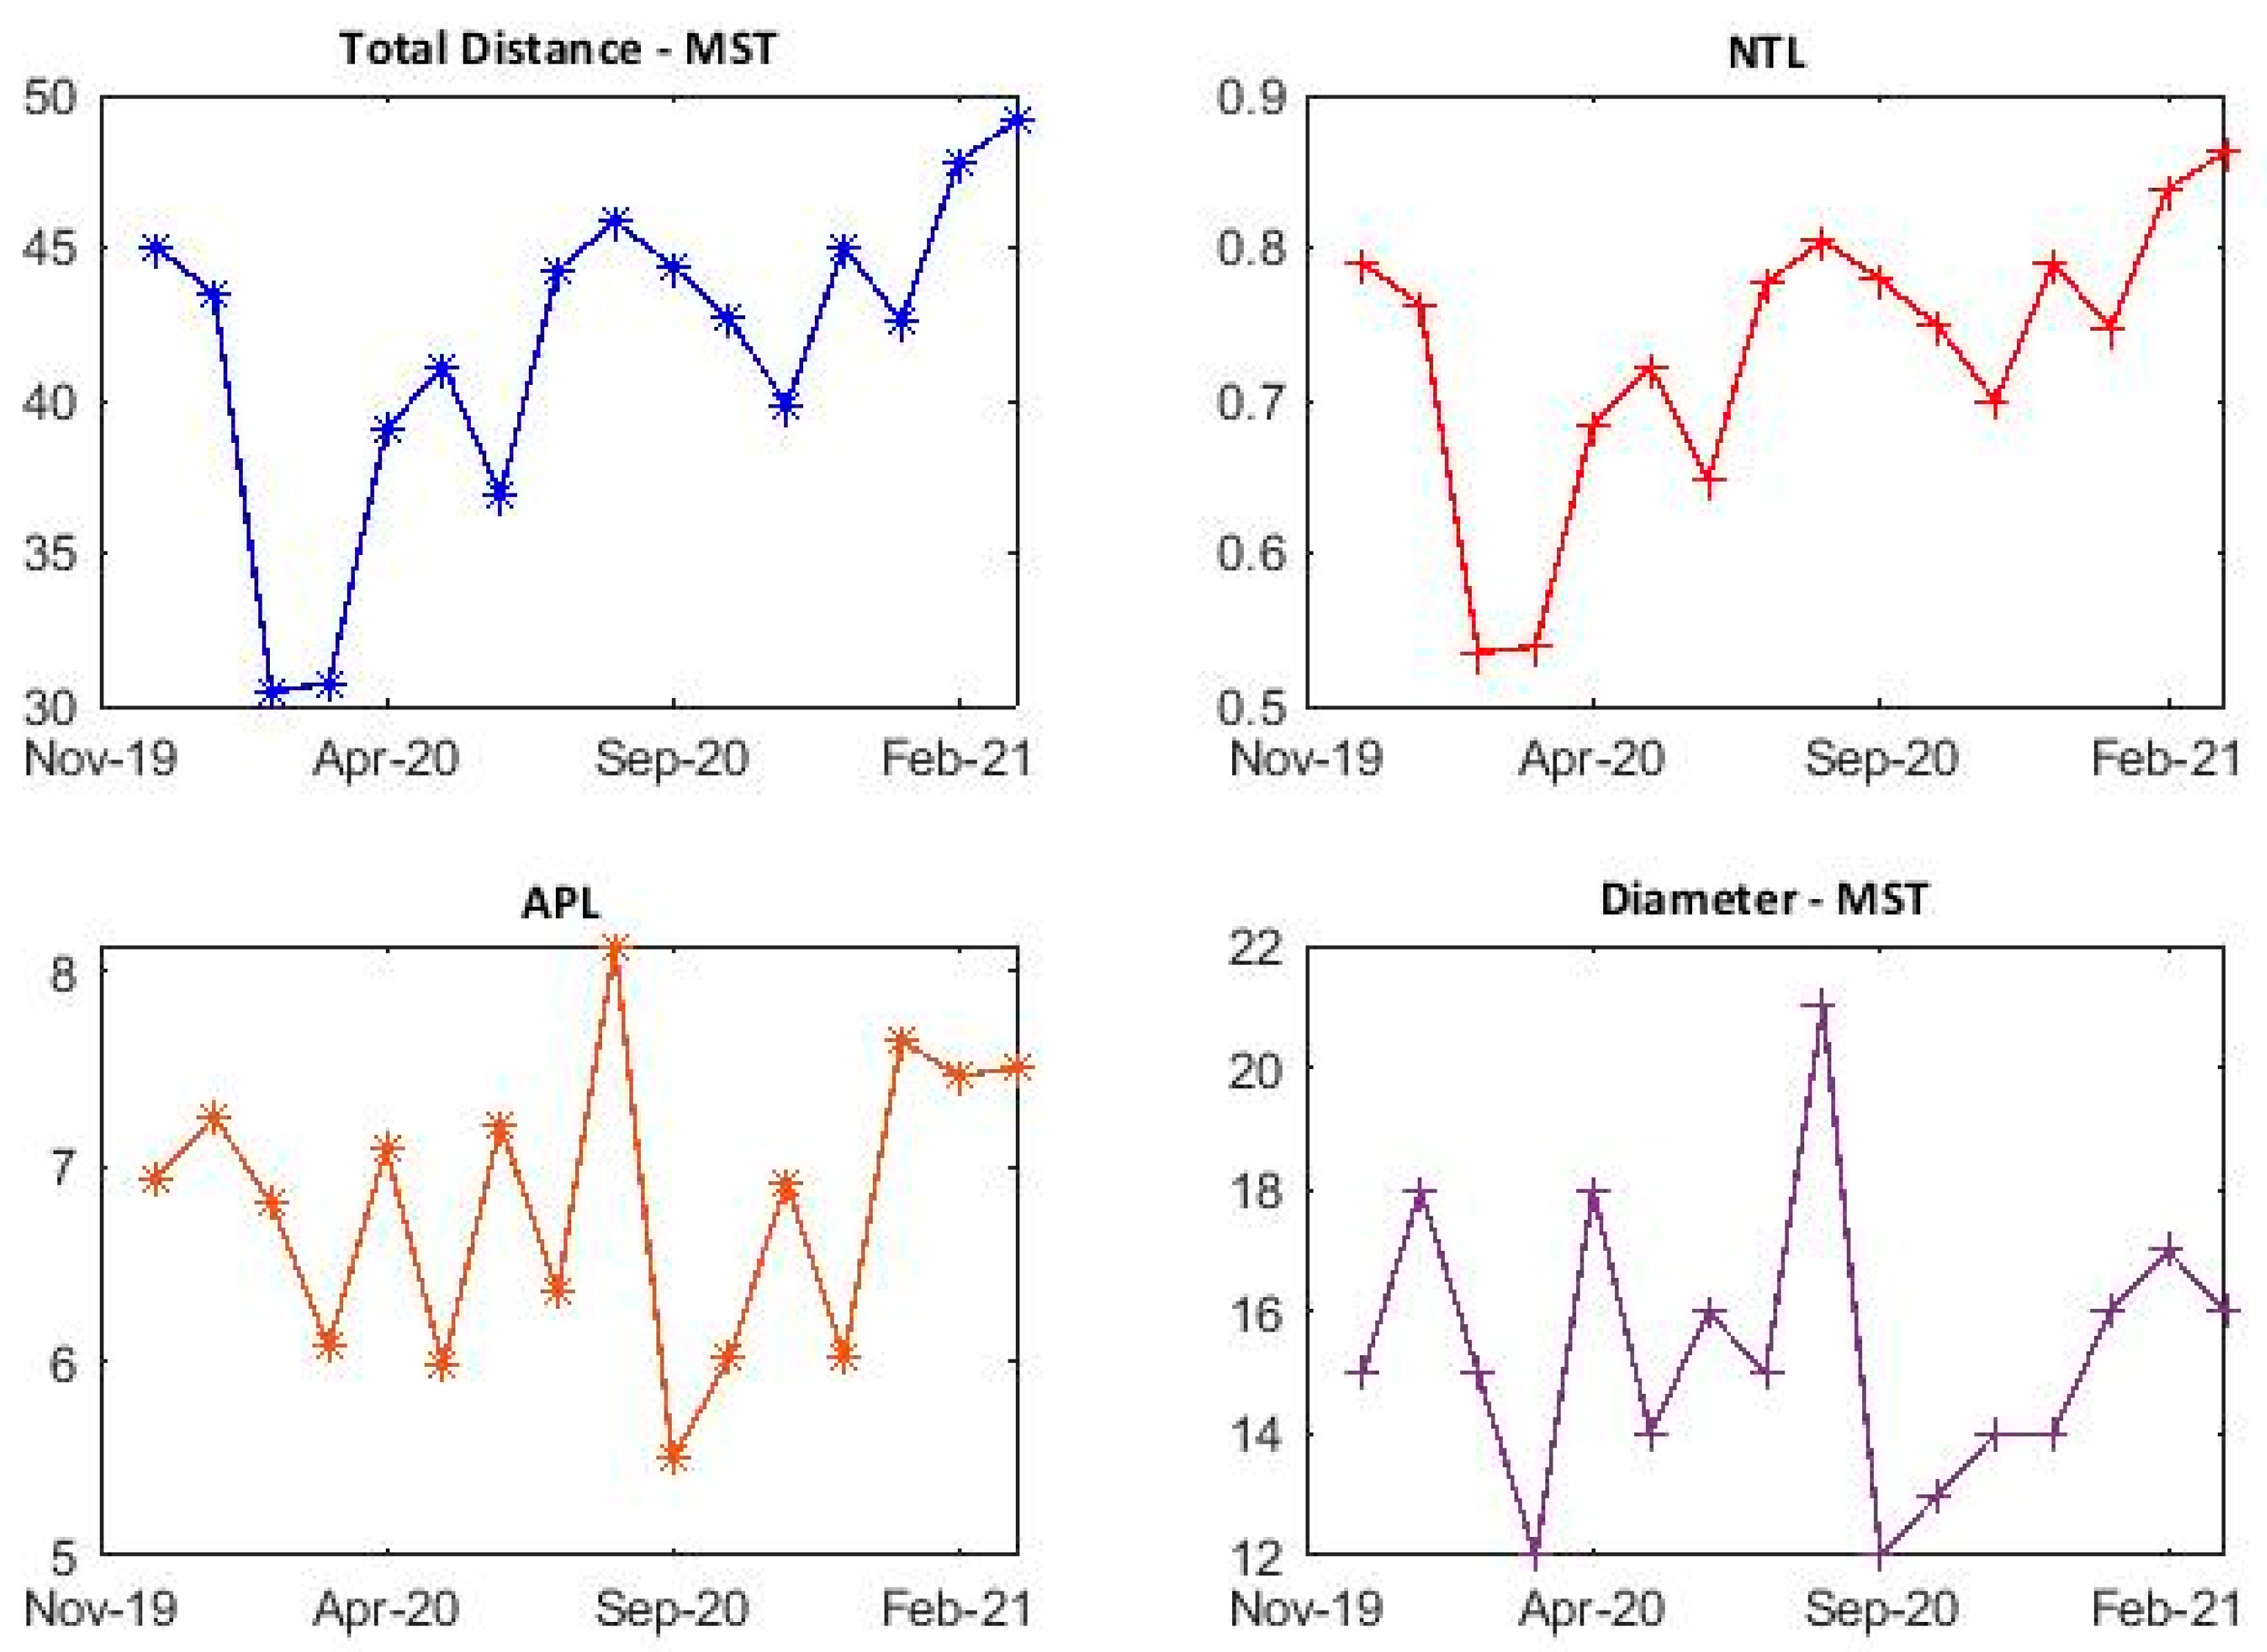
5.3.2. Analysis of Dynamic Normalized Tree Length, Average Path Length and Diameter

To observe the effects of the global pandemic (COVID-19) on the tree structures of the world stock markets, we use robust measures of time-varying normalized tree length (NTL), total distance, diameter, and average path length (APL) of all the MSTs, as shown in Figure 7. The time-varying APL represents the fluctuation pattern and information escalation of the world stock market networks. In addition, NTL results show tremendous decline and extreme contraction in the world stock market networks during the months of February and March 2020. Moreover, the diameter of MSTs shed its value during these two months, and a lowest value of 12 was observed during the month of March 2020. This shows that the initial news of the pandemic spread extreme chaos by affecting all the stock markets of the world, as shown in previous studies [62,63,64]. However, the world stock network started expanding slowly thereafter, with a maximum expansion taking place during the month March 2021 of 0.8624 compared to an NTL value of 0.5351 in the month of February 2020. Accordingly, NTL witness a sharp decline when stock markets confront extreme risk [34,47], as happened due to the pandemic in the form of extreme network contraction.

6. Conclusions

This paper presents a thorough investigation by taking into account 58 world stock market indices to examine the impact of COVID-19 on the network structures and topology evolution. The rolling window approach was adopted to construct 16 monthly MSTs over an extensive period, covering both the first and second wave of the COVID-19 pandemic (from December 2019 to March 2021). In addition, the topological properties of all the time-varying MSTs were evaluated, along with a comparison of the structural changes and market performances.
The dynamic correlations revealed a tremendous increase in the mean correlations in the world stock markets during the first wave of COVID-19. In addition, the Chinese stock market was found to be loosely correlated with other major stock markets of the world. With regard to the dynamic MSTs, one could see that MST appeared lower in hierarchy, due to the turbulent timeline. The formation of small clusters was also observed, where a pivotal stock market of Germany remained a hub node among many of the MSTs but not a super-hub node, which was connected mostly with the major European stocks markets of Sweden, Finland, the Netherlands, and France. In addition, the results revealed several chain-like MST structures, the absence of influential stock markets, and low connectivity, specifically during the first wave of the COVID-19 outbreak.
In addition to producing the time-varying MST maps of world stock markets, the paper presents topological evolution properties by applying the centrality measures of degree of centrality, betweenness centrality, and closeness centrality, along with the robust network measures of normalized tree length, diameter, and average path length. The centrality measures confirmed the evidence of several chain-like MST structures, and small clusters possibly due to reconfiguration. Furthermore, the results reveal the strong intermediary roles of major European stock markets, along with a notable finding of the absence of stock markets from any other region in the top influential positions in all the MSTs. Moreover, the dynamic NTL witnessed an extreme network contraction, where diameter shed its value during the first wave of COVID-19 outbreak, representing the spread of extreme chaos by the COVID-19 pandemic, which has affected all the stock markets of the world.
The results revealed in this study are useful for institutional and retail investors when making effective investing decisions, along with risk management during the uncertain time of the global pandemic. Moreover, it is observed that the complex financial networks can implicitly define the transmission mechanism and measurement of the systemic risks. Therefore, this study could be used for the development of financial stability policies and stock market regulations worldwide. With COVID-19 affecting all the economic sectors, open innovation models are rapidly applied that serve as useful tools in optimizing resource allocation, improving market trading systems, reducing volatility, managing risks, and achieving stability, that provide greater benefits to the individual and institutional investors, and policy makers worldwide. Further research could be carried by examining the dynamic network flow of time-varying foreign exchange networks throughout the global pandemic. In addition, future studies could use various entropy measures to discover the crisis flow of the financial network.

Author Contributions

Conceptualization, B.A.M.; methodology, B.A.M.; software, B.A.M.; validation, B.A.M.; formal analysis, B.A.M.; investigation, B.A.M.; resources, B.A.M.; data curation, B.A.M.; writing—original draft preparation, B.A.M.; writing—review and editing, B.A.M. and H.Y.; visualization, B.A.M.; supervision, H.Y.; project administration, B.A.M. and H.Y.; funding acquisition, B.A.M. All authors have read and agreed to the published version of the manuscript.

Funding

This research received no external funding.

Institutional Review Board Statement

Not applicable.

Informed Consent Statement

Not applicable.

Data Availability Statement

The datasets used during the current study are available from the corresponding author on reasonable request.

Conflicts of Interest

The authors declare no conflict of interest.

Appendix A

Table A1. List of countries with the respective stock index, classified by geographical region, color in the MST, and the reporting date when the first COVID-19 case was confirmed by the country.
S. NoCountryStock IndexContinentColor in MSTReporting Date of 1st COVID-19 Confirmed Case
1USADow Jones Industrial AverageNorth AmericaGreen22 January 2020
2NetherlandAEXEuropeBlue27 February 2020
3AustriaAustrian Traded IndexEuropeBlue25 February 2020
4BelgiumBEL 20EuropeBlue4 February 2020
5BrazilIBOVESPASouth AmericaOrange26 February 2020
6FranceCAC 40EuropeBlue24 January 2020
7GermanyDAX PERFORMANCE-INDEXEuropeBlue27 January 2020
8CanadaS&P/TSX Composite indexNorth AmericaGreen26 January 2020
9Hong KongHang Seng IndexAsiaRed22 January 2020
10SpainIBEX 35EuropeBlue1 February 2020
11IrelandISEQ 20EuropeBlue29 February 2020
12IndonesiaJakarta Composite IndexAsiaRed2 March 2020
13South KoreaKOSPIAsiaRed22 January 2020
14ArgentinaMERVALSouth AmericaOrange3 March 2020
15MexicoIPC MEXICONorth AmericaGreen28 February 2020
16JapanNikkei 225AsiaRed22 January 2020
17SwedenOMX Stockholm 30 IndexEuropeBlue31 January 2020
18SwitzerlandSMIEuropeBlue25 February 2020
19TaiwanTSEC weighted indexAsiaRed21 January 2020
20ChinaSSE Composite IndexAsiaRed31 December 2019
21AustraliaS&P/ASX 200OceaniaCyan26 January 2020
22GreeceAthens General CompositeEuropeBlue26 February 2020
23SerbiaBELEX15EuropeBlue6 March 2020
24RomaniaBETEuropeBlue26 February 2020
25TurkeyBIST 100AsiaRed11 March 2020
26SloveniaBlue-Chip SBITOPEuropeBlue5 March 2020
27HungaryBudapest SEEuropeBlue4 March 2020
28ColombiaCOLCAPSouth AmericaOrange6 March 2020
29CroatiaCROBEXEuropeBlue25 February 2020
30Sri LankaCSE All-ShareAsiaRed27 January 2020
31BangladeshDhaka Stock Exchange BroadAsiaRed8 March 2020
32MalaysiaFTSE Bursa Malaysia KLCIAsiaRed25 January 2020
33ItalyFTSE MIBEuropeBlue31 January 2020
34UKFTSE 100EuropeBlue31 January 2020
35ChileS&P CLX IPSASouth AmericaOrange3 March 2020
36South AfricaJSE Top 40AfricaMagenta5 March 2020
37KazakhstanKASEAsiaRed13 March 2020
38KenyaKenya NSE 20AfricaMagenta13 March 2020
39PakistanKSE 100AsiaRed26 February 2020
40RussiaMOEXAsiaRed31 January 2020
41MoroccoMoroccan All Shares (MASI)AfricaMagenta2 March 2020
42NigeriaNSE 30AfricaMagenta28 February 2020
43NorwayOSE BenchmarkEuropeBlue26 February 2020
44PhilippinesPSEi CompositeAsiaRed30 January 2020
45PortugalPSI 20EuropeBlue2 March 2020
46Czech RepublicPXEuropeBlue1 March 2020
47IndiaS&P BSE SensexAsiaRed30 January 2020
48PeruS&P Lima GeneralSouth AmericaOrange6 March 2020
49MauritiusSEMDEXAfricaMagenta18 March 2020
50ThailandSET IndexAsiaRed22 January 2020
51SingaporeSTI IndexAsiaRed23 January 2020
52IsraelTA 35AsiaRed21 February 2020
53TunisiaTUNINDEXAfricaMagenta2 March 2020
54VietnamVN 30AsiaRed23 January 2020
55PolandWIG 30EuropeBlue4 March 2020
56FinlandOMX Helsinki 25EuropeBlue29 January 2020
57DenmarkOMX Copenhagen 20EuropeBlue27 February 2020
58New ZealandNZX 50OceaniaCyan28 February 2020

References

  1. Goodell, J.W. COVID-19 and finance: Agendas for future research. Financ. Res. Lett. 2020, 35, 101512. [Google Scholar] [CrossRef] [PubMed]
  2. Nicola, M.; Alsafi, Z.; Sohrabi, C.; Kerwan, A.; Al-Jabir, A.; Iosifidis, C.; Agha, M.; Agha, R. The Socio-Economic Implications of the Coronavirus and COVID-19 Pandemic: A Review. Int. J. Surg. 2020, 78, 185–193. [Google Scholar] [CrossRef]
  3. Baker, S.R.; Bloom, N.; Davis, S.J.; Kost, K.J.; Sammon, M.C.; Viratyosin, T. The unprecedented stock market impact of COVID-19. Natl. Bur. Econ. Res. 2020. [Google Scholar] [CrossRef]
  4. Bahrini, R.; Filfilan, A. Impact of the novel coronavirus on stock market returns: Evidence from GCC countries. Quant. Financ. Econ. 2020, 4, 640–652. [Google Scholar] [CrossRef]
  5. Bora, D.; Basistha, D. The outbreak of COVID-19 pandemic and its impact on stock market volatility: Evidence from a worst-affected economy. J. Public Aff. 2021, e2623. [Google Scholar] [CrossRef] [PubMed]
  6. He, P.; Sun, Y.; Zhang, Y.; Li, T. COVID–19’s Impact on Stock Prices Across Different Sectors—An Event Study Based on the Chinese Stock Market. Emerg. Mark. Financ. Trade 2020, 56, 2198–2212. [Google Scholar] [CrossRef]
  7. Liu, H.; Manzoor, A.; Wang, C.; Zhang, L.; Manzoor, Z. The COVID-19 Outbreak and Affected Countries Stock Markets Response. Int. J. Environ. Res. Public Health 2020, 17, 2800. [Google Scholar] [CrossRef] [PubMed] [Green Version]
  8. Ozkan, O. Impact of COVID-19 on stock market efficiency: Evidence from developed countries. Res. Int. Bus. Financ. 2021, 58, 101445. [Google Scholar] [CrossRef]
  9. Baker, S.R.; Bloom, N.; Davis, S.J.; Terry, S.J. Covid-Induced Economic Uncertainty. Natl. Bur. Econ. Res. 2020. [Google Scholar] [CrossRef]
  10. Umar, Z.; Gubareva, M. A time–frequency analysis of the impact of the Covid-19 induced panic on the volatility of currency and cryptocurrency markets. J. Behav. Exp. Financ. 2020, 28, 100404. [Google Scholar] [CrossRef]
  11. Corbet, S.; Hou, Y.; Hu, Y.; Larkin, C.; Oxley, L. Any port in a storm: Cryptocurrency safe-havens during the COVID-19 pandemic. Econ. Lett. 2020, 194, 109377. [Google Scholar] [CrossRef]
  12. Baker, S.R.; Bloom, N.; Davis, S.J.; Kost, K.; Sammon, M.; Viratyosin, T. The Unprecedented Stock Market Reaction to COVID-19. Rev. Asset Pricing Stud. 2020, 10, 742–758. [Google Scholar] [CrossRef]
  13. Fakhfekh, M.; Jeribi, A.; Ben Salem, M. Volatility dynamics of the Tunisian stock market before and during the COVID-19 outbreak: Evidence from the GARCH family models. Int. J. Financ. Econ. 2021, 1–14. [Google Scholar] [CrossRef]
  14. Salisu, A.A.; Ebuh, G.U.; Usman, N. Revisiting oil-stock nexus during COVID-19 pandemic: Some preliminary results. Int. Rev. Econ. Financ. 2020, 69, 280–294. [Google Scholar] [CrossRef]
  15. Sun, Y.; Wu, M.; Zeng, X.; Peng, Z. The impact of COVID-19 on the Chinese stock market: Sentimental or substantial? Financ. Res. Lett. 2021, 38, 101838. [Google Scholar] [CrossRef]
  16. Mazur, M.; Dang, M.; Vega, M. COVID-19 and the march 2020 stock market crash. Evidence from S&P1500. Financ. Res. Lett. 2021, 38, 101690. [Google Scholar]
  17. Gunay, S.; Bakry, W.; Al-Mohamad, S. The Australian Stock Market’s Reaction to the First Wave of the COVID-19 Pandemic and Black Summer Bushfires: A Sectoral Analysis. J. Risk Financ. Manag. 2021, 14, 175. [Google Scholar] [CrossRef]
  18. Izzeldin, M.; Muradoğlu, Y.G.; Pappas, V.; Sivaprasad, S. The impact of Covid-19 on G7 stock markets volatility: Evidence from a ST-HAR model. Int. Rev. Financ. Anal. 2021, 74, 101671. [Google Scholar] [CrossRef]
  19. So, M.K.P.; Chu, A.M.Y.; Chan, T.W.C. Impacts of the COVID-19 pandemic on financial market connectedness. Financ. Res. Lett. 2021, 38, 101864. [Google Scholar] [CrossRef]
  20. Lai, Y.; Hu, Y. A study of systemic risk of global stock markets under COVID-19 based on complex financial networks. Phys. A Stat. Mech. Its Appl. 2021, 566, 125613. [Google Scholar] [CrossRef]
  21. Lyócsa, Š.; Výrost, T.; Baumöhl, E. Stock market networks: The dynamic conditional correlation approach. Phys. A Stat. Mech. Its Appl. 2012, 391, 4147–4158. [Google Scholar] [CrossRef]
  22. Sensoy, A.; Tabak, B.M. Dynamic spanning trees in stock market networks: The case of Asia-Pacific. Phys. A Stat. Mech. Its Appl. 2014, 414, 387–402. [Google Scholar] [CrossRef]
  23. Song, D.M.; Tumminello, M.; Zhou, W.-X.; Mantegna, R.N. Evolution of worldwide stock markets, correlation structure, and correlation-based graphs. Phys. Rev. E 2011, 84, 026108. [Google Scholar] [CrossRef] [PubMed] [Green Version]
  24. Brida, J.G.; Risso, W.A. Hierarchical structure of the German stock market. Expert Syst. Appl. 2010, 37, 3846–3852. [Google Scholar] [CrossRef]
  25. Coelho, R.; Hutzler, S.; Repetowicz, P.; Richmond, P. Sector analysis for a FTSE portfolio of stocks. Phys. A Stat. Mech. Its Appl. 2007, 373, 615–626. [Google Scholar] [CrossRef] [Green Version]
  26. Memon, B.A.; Yao, H. Correlation structure networks of stock market during terrorism: Evidence from Pakistan. Data Sci. Financ. Econ. 2021, 1, 117–140. [Google Scholar] [CrossRef]
  27. Tabak, B.M.; Serra, T.R.; Cajueiro, D.O. Topological properties of stock market networks: The case of Brazil. Phys. A Stat. Mech. Its Appl. 2010, 389, 3240–3249. [Google Scholar] [CrossRef]
  28. Zhuang, R.; Hu, B.; Ye, Z. Minimal spanning tree for Shanghai-Shenzhen 300 Stock Index. In Proceedings of the 2008 IEEE Congress on Evolutionary Computation, IEEE World Congress on Computational Intelligence, Hong Kong, China, 1–6 June 2008; pp. 1417–1424. [Google Scholar]
  29. Yao, H.; Lu, Y.; Memon, B.A. Impact of US-China Trade War on the Network Topology Structure of Chinese Stock Market. J. Asian Bus. Strategy 2019, 9, 235–250. [Google Scholar] [CrossRef]
  30. Nguyen, Q.; Nguyen, N.K.K.; Nguyen, L.H.N. Dynamic topology and allometric scaling behavior on the Vietnamese stock market. Phys. A Stat. Mech. Its Appl. 2019, 514, 235–243. [Google Scholar] [CrossRef]
  31. Birch, J.; Pantelous, A.A.; Soramäki, K. Analysis of Correlation Based Networks Representing DAX 30 Stock Price Returns. Comput. Econ. 2016, 47, 501–525. [Google Scholar] [CrossRef] [Green Version]
  32. Kantar, E.; Keskin, M.; Deviren, B. Analysis of the effects of the global financial crisis on the Turkish economy, using hierarchical methods. Phys. A Stat. Mech. Its Appl. 2012, 391, 2342–2352. [Google Scholar] [CrossRef]
  33. Coletti, P.; Murgia, M. The network of the Italian stock market during the 2008–2011 financial crises. Algorithmic Financ. 2016, 5, 111–137. [Google Scholar] [CrossRef] [Green Version]
  34. Memon, B.A.; Yao, H. Structural Change and Dynamics of Pakistan Stock Market during Crisis: A Complex Network Perspective. Entropy 2019, 21, 248. [Google Scholar] [CrossRef] [Green Version]
  35. Memon, B.A.; Yao, H.; Tahir, R. General election effect on the network topology of Pakistan’s stock market: Network-based study of a political event. Financ. Innov. 2020, 6, 2. [Google Scholar] [CrossRef] [Green Version]
  36. Yin, K.; Liu, Z.; Liu, P. Trend analysis of global stock market linkage based on a dynamic conditional correlation network. J. Bus. Econ. Manag. 2017, 18, 779–800. [Google Scholar] [CrossRef] [Green Version]
  37. Kumar, S.; Deo, N. Correlation and network analysis of global financial indices. Phys. Rev. E 2012, 86, 026101. [Google Scholar] [CrossRef] [Green Version]
  38. Setiawan, K. On the Dynamic of Stock Market Integration: A Minimum Spanning Tree Analysis. Int. J. Econ. Policy Stud. 2011, 6, 43–68. [Google Scholar] [CrossRef]
  39. Wang, G.-J.; Xie, C.; Stanley, H.E. Correlation Structure and Evolution of World Stock Markets: Evidence from Pearson and Partial Correlation-Based Networks. Comput. Econ. 2018, 51, 607–635. [Google Scholar] [CrossRef]
  40. Li, B.; Pi, D. Analysis of global stock index data during crisis period via complex network approach. PLoS ONE 2018, 13, e0200600. [Google Scholar] [CrossRef] [PubMed]
  41. Shi, Y.; Zheng, Y.; Guo, K.; Jin, Z.; Huang, Z. The Evolution Characteristics of Systemic Risk in China’s Stock Market Based on a Dynamic Complex Network. Entropy 2020, 22, 614. [Google Scholar] [CrossRef]
  42. Liu, L.; Cao, Z.; Liu, X.; Shi, L.; Cheng, S.; Liu, G. Oil security revisited: An assessment based on complex network analysis. Energy 2020, 194, 116793. [Google Scholar] [CrossRef]
  43. Drożdż, S.; Kwapień, J.; Oświęcimka, P.; Stanisz, T.; Wątorek, M. Complexity in Economic and Social Systems: Cryptocurrency Market at around COVID-19. Entropy 2020, 22, 1043. [Google Scholar] [CrossRef] [PubMed]
  44. Guo, H.; Zhao, X.; Yu, H.; Zhang, X. Analysis of global stock markets’ connections with emphasis on the impact of COVID-19. Phys. A Stat. Mech. Its Appl. 2021, 569, 125774. [Google Scholar] [CrossRef]
  45. Mantegna, R.N. Hierarchical structure in financial markets. Eur. Phys. J. B-Condens. Matter Complex Syst. 1999, 11, 193–197. [Google Scholar] [CrossRef] [Green Version]
  46. Kruskal, J.B. On the Shortest Spanning Subtree of a Graph and the Traveling Salesman Problem. Proc. Am. Math. Soc. 1956, 7, 48–50. [Google Scholar] [CrossRef]
  47. Huang, C.; Zhao, X.; Su, R.; Yang, X.; Yang, X. Dynamic network topology and market performance: A case of the Chinese stock market. Int. J. Financ. Econ. 2020, 1–17. [Google Scholar] [CrossRef]
  48. Memon, B.A.; Yao, H.; Aslam, F.; Tahir, R. Network Analysis of Pakistan stock market during the turbulence of Economic Crisis, Business. Manag. Educ. 2019, 17, 269–285. [Google Scholar]
  49. Jia, X.; An, H.; Sun, X.; Huang, X.; Wang, L. Evolution of world crude oil market integration and diversification: A wavelet-based complex network perspective. Appl. Energy 2017, 185, 1788–1798. [Google Scholar] [CrossRef]
  50. Onnela, J.P.; Chakraborti, A.; Kaski, K.; Kertész, J. Dynamic asset trees and Black Monday. Phys. A Stat. Mech. Its Appl. 2003, 324, 247–252. [Google Scholar] [CrossRef] [Green Version]
  51. Onnela, J.P.; Chakraborti, A.; Kaski, K.; Kertsz, J.; Kanto, A. Asset Trees and Asset Graphs in Financial Markets. Phys. Scr. 2003, T106, 48. [Google Scholar] [CrossRef]
  52. Yao, H.; Memon, B.A. Network topology of FTSE 100 Index companies: From the perspective of Brexit. Phys. A Stat. Mech. Its Appl. 2019, 523, 1248–1262. [Google Scholar] [CrossRef]
  53. Marsden, P.V. Network Centrality, Measures of. In International Encyclopedia of the Social & Behavioral Sciences, 2nd ed.; Wright, J.D., Ed.; Elsevier: Oxford, UK, 2015; pp. 532–539. [Google Scholar]
  54. Golbeck, J. Chapter 3-Network Structure and Measures. In Analyzing the Social Web; Golbeck, J., Ed.; Morgan Kaufmann: Boston, MA, USA, 2013; pp. 25–44. [Google Scholar]
  55. Brandes, U. A faster algorithm for betweenness centrality. J. Math. Sociol. 2001, 25, 163–177. [Google Scholar] [CrossRef]
  56. Abuzayed, B.; Bouri, E.; Al-Fayoumi, N.; Jalkh, N. Systemic risk spillover across global and country stock markets during the COVID-19 pandemic. Econ. Anal. Policy 2021, 71, 180–197. [Google Scholar] [CrossRef]
  57. Mokni, K.; Mansouri, F. Conditional dependence between international stock markets: A long memory GARCH-copula model approach. J. Multinatl. Financ. Manag. 2017, 42–43, 116–131. [Google Scholar] [CrossRef]
  58. Baig, A.S.; Butt, H.A.; Haroon, O.; Rizvi, S.A.R. Deaths, panic, lockdowns and US equity markets: The case of COVID-19 pandemic. Financ. Res. Lett. 2021, 38, 101701. [Google Scholar] [CrossRef]
  59. Hong, H.; Bian, Z.; Lee, C.-C. COVID-19 and instability of stock market performance: Evidence from the U.S. Financ. Innov. 2021, 7, 12. [Google Scholar] [CrossRef]
  60. Plerou, V.; Gopikrishnan, P.; Nunes Amaral, L.A.; Meyer, M.; Stanley, H.E. Scaling of the distribution of price fluctuations of individual companies. Phys. Review. E Stat. Phys. Plasmas Fluids Relat. Interdiscip. Top. 1999, 60, 6519–6529. [Google Scholar] [CrossRef] [Green Version]
  61. He, J.; Deem, M.W. Structure and response in the world trade network. Phys. Rev. Lett. 2010, 105, 198701. [Google Scholar] [CrossRef] [Green Version]
  62. Al-Awadhi, A.M.; Alsaifi, K.; Al-Awadhi, A.; Alhammadi, S. Death and contagious infectious diseases: Impact of the COVID-19 virus on stock market returns. J. Behav. Exp. Financ. 2020, 27, 100326. [Google Scholar] [CrossRef] [PubMed]
  63. O’Donnell, N.; Shannon, D.; Sheehan, B. Immune or at-risk? Stock markets and the significance of the COVID-19 pandemic. J. Behav. Exp. Financ. 2021, 30, 100477. [Google Scholar] [CrossRef]
  64. Sansa, N.A. The Impact of the COVID-19 on the Financial Markets: Evidence from China and USA. Electron. Res. J. Soc. Sci. Humanit. 2020, 2, 29–39. [Google Scholar] [CrossRef]
Figure 1. Time-varying basic statistics of the dynamic correlation matrices.
Joitmc 07 00241 g001
Figure 2. Comparison of dynamics MSTs of the world stock market network from December 2019 to March 2020.
Joitmc 07 00241 g002
Figure 3. Comparison of dynamic MSTs of the world stock market network from April 2020 to July 2020.
Joitmc 07 00241 g003
Figure 4. Comparison of dynamic MSTs of the world stock market network from August 2020 to November 2020.
Joitmc 07 00241 g004
Figure 5. Comparison of dynamic MSTs of the world stock market network from December 2020 to March 2021.
Joitmc 07 00241 g005
Figure 6. Highest centrality measures for each of the MSTs of the world stock network.
Joitmc 07 00241 g006
Figure 7. Dynamic evolution of total distance, normalized tree length (NTL), average path length (APL), and diameter of MST.
Joitmc 07 00241 g007
Table 1. Frequency of node degree distribution of time-varying MSTs.
DegreeFrequency of Node Degree
Dec-19Jan-20Feb-20Mar-20Apr-20May-20Jun-20Jul-20Aug-20Sep-20Oct-20Nov-20Dec-20Jan-21Feb-21Mar-21
124282330222625231927242526262419
22015209231821222815211918161724
3889119879812788101213
44367142211334552
52401311112331000
60000001010000100
70000011101001000
Publisher’s Note: MDPI stays neutral with regard to jurisdictional claims in published maps and institutional affiliations.

