Abstract
Global customer consciousness for more sustainable products and government requirements for a more sustainable industry have motivated cosmetics small and medium industries (SMIs) to innovate the strategy by integrating sustainability principles into their manufacturing processes. However, the dynamic complexity of balancing sustainability efforts, stakeholders’ interests, and uncertainty in material pricing require a conceptual reference model to help managers and decision-makers cope with the transition process. This work therefore proposes a model-based strategy using system dynamics to assist managers and stakeholders in SMIs to clarify their possible pathways and to offer a framework to understand, guide, and generate future strategies. In multiactor, multistakeholder conditions, the proposed methodology can provide insights into how stakeholders can effectively intervene to improve sustainability through open innovation dynamics models. The case study presented here on a personal care cosmetics company demonstrates several leverage points and obstacles, thereby allowing each stakeholder to understand their strategic role in realizing sustainable cosmetics SMIs.
1. Introduction
The cosmetics industry is a leading industry and is estimated to have significant future growth. Despite the 2% decrease in global cosmetics sales in 2020 caused by the Coronavirus (COVID-19) pandemic, international surveys predict growth in the global beauty and personal cosmetics market in 2021 if companies can meet shifting customer expectations and demand for personal care cosmetics, rather than beauty cosmetics [1]. These products focus on maintaining or restoring health and wellness, which has become essential to many during the pandemic.
Changes in customer expectations have accompanied the improvement in the sales outlook [2]. Consumers have increasingly demanded safe, qualified, and environmentally friendly products [3] and placed more importance on environmental and long-term health during product selection, in addition to a product’s value for money [4]. Governmental regulatory bodies have also increasingly required transparent manufacturing processes in compliance with international standards for good manufacturing practices (GMPs) [5]. The GMPs are in line with the development of sustainable cosmetics industries, which aim to meet the needs of today’s society without compromising the ability of resources to meet the needs of future generations. The characteristics of sustainable development include the use of environmentally friendly technology, using work procedures that support environmental sustainability, and collaboration between stakeholders to jointly develop and determine business alternative strategies that ensure ecosystem sustainability in the future. Currently, ordinary cosmetics small and medium industries (SMIs) only focus on generating short-term profits without considering their production processes’ environmental and social impacts. They do not manage waste and the emissions produced, which will damage the environment and public health in the long run. The damage will affect the product’s image and society as cosmetics customers will not buy their product in the future. The government could even close their cosmetics business down. Cosmetics SMIs should aim to meet the customers’ environmental-friendly product preferences and government sustainable development requirements by moving toward sustainability, balancing financial strategies to pursue profits, preserving the environment, and protecting public health [6]. To achieve this sustainability aim, SMIs must have a robust strategy model. The model should help SMIs’ managers and stakeholders understand the problem more comprehensively and determine alternative strategies, thus triggering sustainability goal achievements.
Cosmetics SMIs face challenges when transitioning toward sustainability owing to their smaller scale as managers are still struggling to increase production-side productivity by consistently producing efficient and high-quality products [7]. Furthermore, due to limited workforce skills and old equipment, SMIs face difficulties producing goods without waste [8]. This focus on the production side causes decision-makers to disregard the environmental pollution caused by their manufacturing process and conduct environmental impact evaluations rarely to avoid sacrificing profits [9].
With SMIs considered the driving force of the economy in various countries, attention and support from stakeholders should be mapped and directed to strategize the transition and push SMIs toward sustainability. These issues require conceptual models detailing their complexity; these models would then serve as the basis for understanding, guiding, and developing the necessary global strategies and individual strategies for each stakeholder.
By definition, a model-based strategy uses a strategic planning model that helps managers and other stakeholders understand the problem structure from a broad perspective and decide what strategy changes will be beneficial [10,11]. A model-based strategy aims not to get the best results but to develop a tool to facilitate dialog between stakeholders [12]. In transitioning SMIs to sustainability, a model can shed light on issues, unknowns, and differences in stakeholder perspectives and understand them together, especially for managers and other decision-makers in SMIs. In addition, model-based strategies can anticipate the results of an intervention to prevent errors in decision-making [13].
Researchers have explored establishing sustainability in SMIs via multifactorial analysis showing the complexity of SMIs’ problems [7,14,15]. Unfortunately, the relationship between the multifactor is considered linear and did not show a dynamically interrelated connection as experienced by SMIs nowadays. This dynamic complexity relationship will undoubtedly trigger the different alternative strategies. However, efforts to explore and model the dynamic complexities of the current issues facing SMIs combined with alternative strategies toward sustainability are limited. Therefore, this research aims to develop a strategy recommendation for sustainable cosmetics SMIs based on the system dynamics (SD) modelling method. The SD modelling methodology offers a deeper understanding of the system’s problems because its steps require the development of a conceptual model in the earlier stage and the ability to predict the results through the final computer model, which would help improve the quality of the strategy recommended. Through this approach, this model-based strategy will provide deeper insights and findings due to a better understanding of the system’s problems. This model is beneficial as a reference for SMIs managers and stakeholders in determining policy factors that influence selecting alternative strategies to support SMIs’ sustainability output criteria. Those criteria include manufacturing excellence, financial growth, environmental protection, and social responsibilities. The SD modelling methodology consists of some essential steps. First, the conceptual model of sustainable cosmetics SMIs that explores the objective parameters, stakeholder interests, input factors, and process variables, and their interactions and influence on manufacturing output performances is defined. A visual and descriptive conceptual model also provides easier transferability into a simulation. The SD model is formulated and validated; the developed model is used as a reference while experimenting with alternative strategies and changing conditions. Based on the insights and findings during the development and use stages, promising alternative strategies to achieve sustainable cosmetics SMIs are then discussed.
The rest of this work is structured as follows. The concept of sustainable cosmetics SMIs and how SD could navigate a model-based strategy to achieve sustainable SMIs is discussed in Section 2. The developed conceptual model is then detailed in Section 3; the formulated model and a case study are presented in Section 4. The simulation results are discussed in Section 5, and conclusions are drawn in Section 6.
2. Literature Review
2.1. Sustainable Performance Criteria and Factors for Cosmetics Small and Medium Industries
The manufacturing industries, including SMIs, must improve their sustainability to demonstrate their care and responsibility for future generations [16]. Sustainable manufacturing can be accessed via the three sustainability measurements: economic stability, environmental sustainability, and social welfare [17]. The economic pillar comprises several interrelated performance criteria regarding manufacturing and financial factors [18], including productivity and quality [19]; manufacturing costs and profitability are the main quantitative measures [20,21]. Resource consumption and emissions are the environmental pillar’s main parameters [22,23], whereas performance criteria of the social pillar comprise human resource availability, welfare, and public health [24,25]. Overall, several factors affect the sustainability of cosmetics SMIs [26]; these factors, summarized in Figure 1, have an inter and causal relationship that supports sustainable performance. Meeting demands with high-quality products and minimal waste increases the productivity index and supports profitability ratio targets. Met profitability ratio targets smooth the company’s manufacturing process in the next period and employee welfare with additional income, motivating employees to increase productivity. High productivity minimizes environmental impact and creates a good product image, strengthening customer and social trust. By improving the manufacturing process, improving social benefits, and minimizing environmental impact, cosmetics SMIs increase demand and their financial performance. Further, the government can benefit from this improvement through increased tax revenue. However, these interactions between factors in sustainable SMIs require comprehensive strategic planning; models can thus help support effective strategic decision-making.
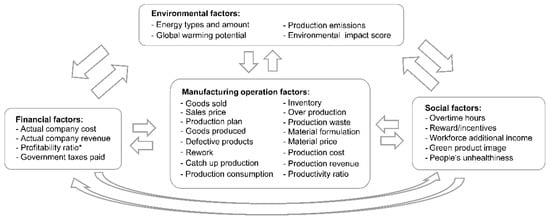
Figure 1.
Sustainable factors, criteria, and inter-connections within cosmetics small and medium industries (SMIs) [26].
2.2. Integrating Company Sustainability Development into Company Strategies
It is essential to integrate company sustainability development in the process of determining business strategies. Company sustainability development includes efforts to meet the company’s needs without compromising aspects of natural and human resource preservation. Elaboration of company sustainability development in its strategy requires decision-makers to explore sustainability issues and their impact on the organization, define internal and external drivers, and align with support and hinder factors [27]. This integration provides more explicit guidance on building sustainable development, from determining sustainability goals to implementing them effectively [28]. Identifying stakeholder interests, translating objectives into sustainability outcome criteria, determining the factors involved, and how the relationship between factors to achieve sustainability goals becomes a sustainability development scheme that must be modelled. The model becomes input, constraint, and feedback to the process of determining strategies. It triggers decision-makers to explore innovative strategic alternatives [29].
The process of developing an effective strategy opens the dynamics of innovation by involving stakeholders in its implementation. The open innovation dynamic strategies benefit companies because they collaborate between internal and external knowledge resources [30]. Optimal knowledge collaboration performance depends on selecting suitable and competent collaboration partners, considering the criteria for the similarity of knowledge domains between the company and partners, the level of communication, historical cooperation, and the benefits (revenues) obtained by both parties [31]. With the limitations of SMIs in skills, knowledge, technology, and capital, SMIs can combine open innovation communities in an open innovation dynamics strategy. Open innovation communities bridge knowledge transfer collaboration between companies and external parties by encouraging community members to create innovations based on their knowledge and information [32]. Open innovation communities allow their members to communicate with various platforms directly or virtually. With open innovation communities, SMIs can involve stakeholders in defining their interests and preferences for sustainable products and processes [33]. SMIs’ decision-makers translate these stakeholder interests and preferences into sustainability performance indicators. The indicators are then derived into what policy factors can improve their performance. By referring to these policy factors, cosmetics SMIs’ decision-makers can clearly understand and make improvements. The mechanism of open innovation communities facilitates stakeholders with similar interests and preferences to engage in improvement activities [34]. Customers can become community members and participate in interactive discussions regarding the development of sustainable products and processes. Suppliers can also utilize the information in these discussion forums to prepare the availability of raw materials on time. Research and academic institutions can assist SMIs technically regarding the implementation of continuous improvements. Meanwhile, distributors can provide market development ideas and promotional media in the forum. Government involvement in the community is also essential as a source of policy as well as supporting capital. Finally, cosmetics associations can act as neutral organizations that facilitate conducive and productive discussion forums in generating innovative ideas and ensuring that every community member is committed to implementing them and achieving sustainable SMIs.
The process of establishing sustainable SMIs that elaborates on stakeholder interests and preferences, the complexity of sustainability factors and dynamics of their relationship, the performance of output criteria, and the utilization of open innovation communities in determining alternative strategies requires a comprehensive model development.
2.3. A Model-Based Decision Strategy Using System Dynamics
A model-based strategy uses accurate replicas of the system, or models, as a tool for decision-makers to understand their problems thoroughly, determine effective strategies to meet goals, and make better use of all available resources [35,36]. Decision-makers can use models to understand more clearly how particular conditions impact the system and intervene based on selective strategies [10]. These simulation techniques are considered effective and efficient, particularly for systems influenced by complex factors that make analytical solutions difficult to develop [37]. A model-based approach allows decision-makers to study the dynamic relationship between the system’s factors and decide the most effective strategy based on the multicriteria performance [11] and requires computer-based knowledge to support model development and simulation [38]. Model-based approaches are appropriate for SMI managers because of their capability to adapt to environmental changes that are fast, dynamic, and competitive.
There are differences between SMIs that apply contemporary strategy models, such as the Balanced Scorecard (BSC) and those referring to SD modelling. The contemporary strategy model has the advantage of a broad, coherent, and measurable perspective. However, the contemporary model has a weakness related to causality, which is only based on linear correlation [39]. These weaknesses can be covered by an SD model-based strategy, where decision-makers can model interconnection relationships and predict future performance based on model simulations. In addition, it is difficult for decision-makers to find improvement mechanisms in contemporary models [40], whereas with the SD model-based strategy, SMIs can determine the policy factors that trigger alternative improvement strategies.
Developing a model-based strategy requires a comprehensive understanding of problem characteristics, interactions between the factors in the system, and objective criteria considering the stakeholders’ interests [41]. SMIs have multifactor, complex, and dynamic problems [42]. SD is a broad-spectrum modeling approach that addresses such dynamic complexity by showing behavioral factors over time in a closed system in the form of a feedback loop [43,44]. The model’s behavior helps managers or other decision-makers predict future relationships and system performance responses [45] and see the impact of implementing alternative approaches, thereby helping them choose the most effective strategies [46]. SD modeling comprises four generic steps: model conceptualization, development, validation, and simulation [47].
The conceptual model uses causal loop diagrams (CLDs) to show cause–effect relationships and highlights the endogenous focus of SD [48]. CLDs describe positive and negative relationships between the connected factors by arrows labeled with a positive (+) or negative (−) sign [49]; (+) indicates a unidirectional pattern of increasing or decreasing between the cause and the effect, whereas (−) indicates the opposite. A reinforcing loop (R) is formed when the accumulated relationships between the factors show a positive feedback pattern, and a balancing loop (B) represents the accumulation of negative cause–effect relationships. The relationship between inventory level and production in cosmetics SMIs is visualized as a reinforcing loop in Figure 2. The production amount is influenced by the final inventory amount, demand, and productivity level; the inventory amount is determined by the initial inventory amount, production amount, and the number of goods sold.
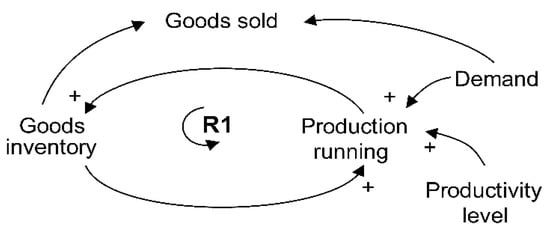
Figure 2.
Causal loop diagram (CLD) with reinforcing loop (R1) in production operation.
A quantitative model that is theoretically and logically acceptable and refers to the conceptual model is then developed using a stock and flow diagram (SFD) based on a mathematical equation that can be simulated based on a specified period [47]. SFDs describe the relationship between inflows and outflows that can increase or decrease stocks, which generate delays by accumulating the difference between the inflow and outflow [46]. The SFD development in relation to the CLD in Figure 2 is shown in Figure 3.
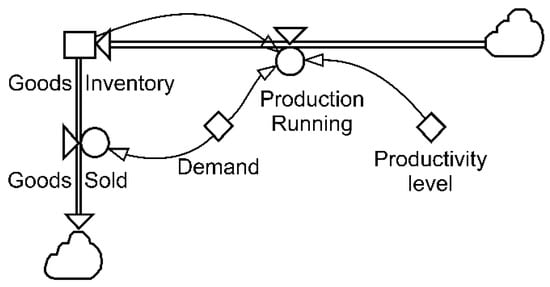
Figure 3.
Stock and flow diagram (SFD) of goods inventory in production operation.
Validation in SD can be carried out through structural-behavioral and statistical evaluation [50]. Some structural-behavior verification tools include expert validation to verify the CLD structure and dimensional consistency and behavior prediction tests to test the SFD [51]. Dimensional consistency tests are used to ensure a balance of dimensions in each equation in interrelated factors. The software used here has a built-in dimensional consistency check that, if not passed, prevents the model from running. Behavior prediction tests qualitatively verify the suitability of a model’s future behavior pattern with the current pattern logic. Statistical validation then uses the absolute mean error (AME) to compare the simulated data with the historical data of relatively uncontrolled factors [52]. The model can be considered valid when the AME, calculated via Equation (1) below, is >30% [53].
where S and A represent the value of the simulated and actual data, respectively.
Model simulation allows users to experiment with several alternative strategies while testing the model [54]. The SD model’s simulation results are presented in output criteria achievement figures and graphed future behavior patterns [55]. The alternative with the highest performance results and best outcome criteria is the most plausible and practical choice; however, this is only one benefit of using SD simulations. Additionally, SD simulations clarify the behavioral trends caused by modifying each parameter, thereby providing a discussion medium for all relevant stakeholders.
3. Materials and Methods
3.1. Developmental Methods
The three interconnected steps of model development using the SD approach are detailed in Figure 4. For each stage, the results of the previous stage act as inputs; the results are cross-checked for compliance with the prior stage and the conceptual model. The approach begins with step 1, model conceptualization, where the problem situation was mapped, stakeholders’ interests were analyzed, each factor and their inter-relationships were determined, and a conceptual model was developed to visualize each of these aspects [47]. CLDs were used in the system diagram to highlight the cause and effect relationships between factors. The system diagram was then verified using an expert validation technique, a focus group discussion (FGD). Theoretically, FGD facilitates dialog between invited experts to enhance understanding of the model’s objectives and verify the model’s structure in greater depth [56]. Here we invited the experts from open innovation communities of cosmetics SMIs. In practice, FGDs require 5–12 people [57]. Accordingly, seven experienced (≥20 years of experience) cosmetics manufacturers, distributors, and academics participated. The list of triggered questions for discussion with the experts in the FGD is attached to Appendix A.
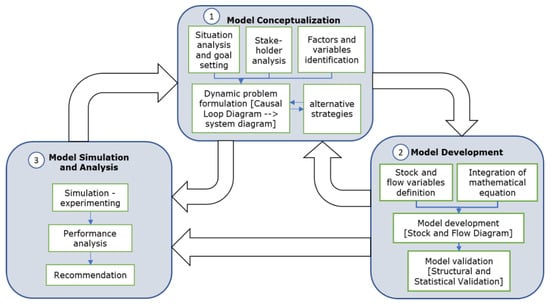
Figure 4.
Development of a model-based strategy based on the methodology developed by Sterman [47].
From the system diagram, the SFD was formulated in step 2. The SFD development consists of translating the relationship between factors in the CLD into mathematical equation and evaluating the resulting system behavior. Finally, the SFD structure was validated by dimensional consistency and output behavior checking [58], and the resulting behavior was checked against the conceptual logic behavior.
The SFD was used to simulate several alternative strategies in step 3 [59]. The alternative strategies demonstrate the combinations of open innovation communities’ involvement scope. An FGD was again used to review the conformity of the alternative strategies planned initially in the conceptual model. As updates to the alternative strategies can change the designed CLD, system diagram, and SFD, any modification at each stage was continuously cross-checked with the prior stage. Finally, the results from the simulations were used to analyze the conditions and factors that influence performance and must be considered by the stakeholders. Obtained recommendations and analysis results served as feedback to the conceptual model on whether the strategy can effectively contribute to achieving the goals or create new problems [60].
3.2. Conceptual Model of Sustainable Cosmetics Small and Medium Industries
According to the sustainable cosmetics SMIs conceptual model developed by Amrina et al. [26], the customers, government, and cosmetics manufacturers are the dominant actors having interests and goals aligned with a business’ sustainable development. These actors have the same concerns regarding developing a productive and sustainable manufacturing process that results in qualified, safe, and profitable cosmetics for society. Four other actors (research and academic institutions, cosmetics suppliers, distributors, and associations) have the same goals but have not played a significant role in promoting sustainable manufacturing. The SMI managers, as problem owners, could not achieve these goals alone. Thus, a transparent conceptual model regarding the intervention needed by each stakeholder is required to support the sustainable cosmetics SMIs, considering the situation analysis, goal setting, multiactor analysis, and inter-relationship factors. These factors are visualized in Figure 5, where the factors in the input box become the references for selecting alternative strategies that influence the CLD output criteria.
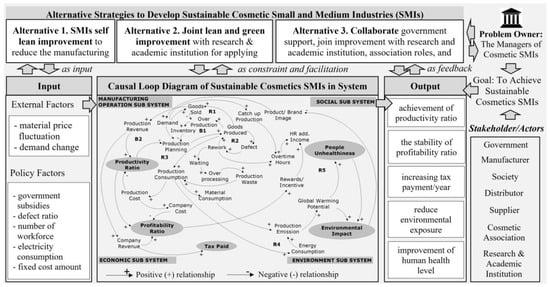
Figure 5.
Conceptual model of sustainable cosmetics small and medium industries [26].
The CLD in the center of Figure 5 contains five individual reinforcing (R) and two balancing (B) loops, which combine to configure four main combination loops: the just-in-time (JIT) production loop (R1–B1–R2), the waste elimination loop (R2–B1–R3), the productivity loop (R1–B1–R2–R3–B2), and the sustainable manufacturing loop (R1–B1–R2–R3–B2–R4–R5). The JIT production loop shows that SMIs can consistently meet customer demand by proper inventory planning and reducing defective products. The waste elimination loop indicates that production costs will decrease if the company can streamline the JIT loop by increasing quality (i.e., reducing defective products). This loop determines the saving amount in production resource consumption, such as raw material, person hours, electricity, and water. The productivity loop connects the JIT, waste elimination, and balancing loops under a stable price. This loop clarifies that minimizing waste in the production process can increase profits without increasing the product’s selling price. If SMIs fail to streamline their production process, their productivity will decline and slowly erode profits. Finally, the sustainable manufacturing loop integrates the productivity loop with the socio-environment factors in the R4 and R5 loop, thereby integrating all existing loops with output criteria, including productivity ratio, profitability ratio, taxes, environmental impact, and human health. Furthermore, this conceptual model can be used to explore the model-based strategy considering the interaction between parameters to improve output criteria.
3.3. Model-Based Strategy Development
Several alternative strategies were then developed based on the loops found in CLD and their effect on achieving the output criteria (see Figure 5). Overall, the output criteria of the model are positively impacted when positive loops produce a more substantial effect than negative loops, as explained in the Theory section regarding CLD. During the performed FGDs with seven experts, policy factors influencing the alternative strategies were discussed, and model scenarios were selected considering the open innovation communities intervention scopes. In particular, experts selected five factors in the loops that allowed stakeholders to intervene to improve output performance: the defect ratio, workforce, electricity consumption, fixed cost amount, and government subsidies. The open innovation dynamic relationship between each strategy and the loop impacted is detailed in Table 1.

Table 1.
Mapping strategy alternatives and policy factors.
Three strategies were thus selected to improve the five priority policy factors. During self-lean improvement, individual SMIs make lean manufacturing improvements focused on waste minimization (i.e., lean) in their internal process [7]; the main factors affecting this strategy are the defect ratio and production workforce efficiency. During limited cooperation, SMIs perform lean and sustainability (i.e., green) improvements in collaboration with suppliers and research and academic institutions. Combining lean improvement and green practices accelerates sustainability goal achievement [8] but is estimated to require some investment. During comprehensive collaboration, government subsidies provide financing for lean and green improvements, relevant associations help SMIs obtain green certifications, and distributors assist with promoting the sustainability achievement to the customer. Green certification is essential to demonstrate to customers that manufacturers adhere to environmental standards in their production processes [2]. Subsequently, the experts considered the uncertainty of the raw material prices as an external factor that affects the criteria performances of each chosen strategy. Finally, this methodology was applied to a case study; the formulated conceptual model, SFD, and simulation setup considering alternative strategies is detailed in the following section.
4. Results
4.1. System Dynamics Model Development
Based on the four subsystems detailed in the CLD in Figure 5, the SFD was then developed, which included determining the parameters, stock and flow variables, intermediate variables, and feedback flow in Powersim Studio 10 academic version software. The defect ratio, number of equipment, power per equipment, number of human resources, and the input price are examples of constant parameters in SFD. Meanwhile, goods inventory, additional demand, and last year productivity were translated into stock variables in SFD. Other factors were treated as flow and intermediate variables. The structure of SFD is shown in Figure 6, and the complete set of mathematical equations is detailed in Appendix B. The dimensional and structural consistency was then confirmed automatically using Powersim software.

Figure 6.
Stock flow diagram of sustainable cosmetics small and medium industries.
The SFD was then applied to a personal care manufacturer in Indonesia that had been operating for 25 years to demonstrate the practical implementation. The manufacturer has received GMP certification from the Indonesian government and has become a GMP pilot for Indonesian cosmetics SMIs. GMP certification has strengthened the company’s readiness for sustainable SMIs. The Indonesian government has established the cosmetics industry as the second backbone industry for 2015–2035; as such, the case study was performed over this period.
The manufacturer’s historical data relating to the demand, price, resource consumption, defect ratio, and environmental impact value were collected from 2013–2020. The calculated AME between the simulated and actual data for 2013–2020 was 1%, well below the 30% threshold, as detailed in Appendix C. Thus, the model was considered valid. The system behavior validation test comparing the model output with a simple behavior logic model was then performed by validating that the productivity ratio increased when the defect ratio was reduced.
4.2. Simulation Result
The behavior of each strategy in five selected performance criteria is visualized in Figure 7, where the dotted line represents the business-as-usual condition for reference.
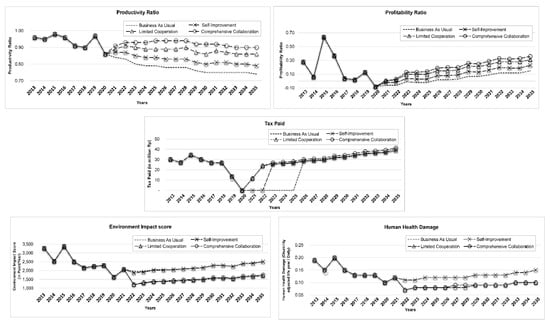
Figure 7.
Case study: one cosmetic manufacturer’s behavior in five performance criteria under each studied strategy.
The productivity ratio demonstrated a downward trend in the base case and under the self-lean improvement strategy (represented by the cross (x) sign in Figure 7) but a slow increase under the other two strategies. The self-lean improvement strategy showed a negative profitability ratio in three periods (2020–2022), including the 2020 demand slump caused by the COVID-19 pandemic, causing an absence of tax payments. Further, this strategy demonstrated increasing environmental and human health damage with no significant improvement over the base case. Using the limited lean and green cooperation strategy (represented by triangle signs in Figure 7) improved all aspects over the base case and self-lean strategy; the productivity ratio fluctuated mildly, the profitability ratio increased, there was only a one-time tax payment absence in 2020, and the environmental and human health impact was lower. Using the comprehensive lean and green collaboration strategy (represented by circles in Figure 7) expanded joint activities to further improve the stability of the productivity ratio and tax payment and increase the profitability. However, this strategy shows that the environmental impact and human health damage were slightly worse than the limited cooperation strategy. The simulation results of the alternative strategies show that using different open innovation communities’ involvement schemes can result in the different performance of output criteria. A strategy with more comprehensive stakeholder involvement will generate more effective performance. More detailed analysis and discussion of these alternative strategies will be discussed in the discussion section.
5. Discussion
5.1. Cosmetics, SMIs, and System Dynamics
When developing the conceptual model and analyzing the SD model simulation, experts agreed on two areas that must be addressed when comparing the effectiveness of strategies considering open innovation communities’ involvement. The first relates to the additional investment and cost-saving comparison between each strategy. No investment is required in a self-lean improvement strategy because SMIs only focus on improvements they can execute without additional cost. This option narrows the opportunity for improvement to the defect ratio and production workforces. Consequently, no changes were present in green output criteria trends, although some lean criteria performed better than the base case. Still, this strategy is insufficient to stabilize profitability and tax payments and cannot reduce environmental and human health impacts. Thus, the self-lean strategy was omitted from the criteria performance comparison analysis.
Investments are required when involving stakeholders in open innovation communities, both in the limited cooperation and comprehensive collaboration strategies. The resulting increase in depreciation and general expenses, cost-saving, and additional revenue, as well as the productivity increase, profitability increase, and reduction in environmental and human health impacts generated by each of these strategies over the base case (i.e., business-as-usual), are detailed in Table 2. The lean and green comprehensive collaboration recorded 3% higher revenue than the limited cooperation strategy, despite showing a 2% worse environmental and human health impact. These results demonstrate that investments can drive productivity and sustainability loops and improve the sustainability output criteria performances.
Table 2.
Criteria performance comparison between limited cooperation and comprehensive collaboration strategies.
The second discussion is related to the impact of high raw material purchase prices on alternative strategies’ performance. Fluctuations in the material purchase price affected the profitability ratio and the tax revenue, as predicted in the CLD and SFD and as detailed in Figure 8, where the purchase price refers to 9% price increases incurred during 2013–2020 on average (including an increase in abnormality during the COVID-19 pandemic).

Figure 8.
Strategies’ performances in the high material purchase price.
Despite the price increases, the profit ratio and tax revenue maintained an increasing trend, although the slope was flatter than in Figure 7. Moreover, the comprehensive collaboration strategy still provided the best results. This strategic behavior demonstrates that the full support of stakeholders in open innovation communities greatly determines the effectiveness of achieving the sustainability goals of cosmetics SMIs. The stakeholders’ support includes technical assistance from research and academic institutions, involvement of suppliers and distributors in lean and green improvement, assistance from cosmetic associations, and funding support from the government. Without such supports, it is difficult for SMIs to grow and achieve sustainability. Using a self-improvement strategy, the modeled SMI suffered losses over several periods, resulting in their inability to pay taxes. This situation is detrimental to the government, which relies on SMIs as the backbone of their economic development. To avoid this situation, the government and other stakeholders should help SMIs accelerate lean and green improvements to achieve sustainability, referring to policy factors that can leverage the model’s output performance.
Lean improvements drive the JIT and waste minimization loops, thereby improving cost-efficiency. These improvements leverage the productivity ratio, profitability ratio, and tax revenue as operation and economic output criteria and are triggered by defect ratio reduction and efficient HR policies. Meanwhile, green practices reduce the environmental and human health impact as environmental and social output criteria and are driven by the material, equipment, and facility power consumption efficiency.
Stakeholders in cosmetic open innovation communities can support cosmetics SMIs in implementing lean and green improvements in a few ways. Research and academic institutions can help conduct technical improvements and accelerate correct implementation by performing research and development, building a knowledge library to access the technical information required by SMIs, and providing classroom training, practical field assistance, and student internship programs. Suppliers can also be involved in joint improvement activities, such as those related to material improvement readiness. Suppliers and SMIs can jointly create an integrated demand and order information database to avoid inventory surpluses or shortages. In addition, cosmetic associations can assist SMIs in getting green certification through a partnership with government organizations, state-owned companies, or banks. This partnership can upgrade SMIs’ sustainable capabilities and provide financing for green certification, which can help differentiate a company from its competitors to leverage marketing benefits and increase customer demand. Further, SMIs can ask associations and distributors to help communicate their sustainable product excellence to customers and the public.
However, these collaborative activities require additional investment and expenses that negatively affect the productivity loop; therefore, SMIs need continuous government support to finance these costs. The model-based strategy presented here can provide leaders with the open innovation dynamic tools to demonstrate the benefits of such monetary support, including increased tax revenue. The government can also facilitate diplomacy in cosmetic export market expansion and reduce taxes on green-certified cosmetics SMIs.
5.2. System Dynamics and Open Innovation
This study resulted in the integration of the system dynamics method and the open innovation approach, which can produce a model-based strategy that can be relied upon to achieve sustainability goals. The system dynamics-based model is proven to explore the complexity of SMIs’ problems involving factors, actors, and dynamic relationships that affect the performance of the output. Meanwhile, the open innovation approach, which is elaborated in the model, can provide effective strategic options in improving output performance, both from manufacturing operations, economy, environment, and social indicators. Open innovation triggers cross-organizational collaboration, which facilitates knowledge transfer and affects business model performance [61]. Combining a system dynamics-based model and an open innovation-based strategy produces an open innovation dynamics model that companies can rely on to achieve a sustainable business [62].
Model-based strategy based on open innovation dynamics combines internal and external sources to achieve its primary goal [63]. This form of collaboration is divergent and involves various entrepreneurial interactions between companies, markets, the government, and various stakeholder communities [64]. This collaboration is one of the fastest strategies suitable for facing complex and dynamic sustainability challenges. The company acquires the support of resources from external parties to develop an open innovation strategy and access markets that are difficult to achieve if the company innovates itself [65]. The effectiveness of the collaboration strategy based on open innovation dynamics in this study has been demonstrated by the significant growth in the sustainable performance of SMIs, from manufacturing, economic, environmental, and social aspects.
6. Conclusions
This work develops a practical and scientific open innovation dynamic model-based strategy to help decision-makers improve sustainability within cosmetics SMIs. The proposed model-based strategy can qualitatively and quantitatively predict future system behavior under various alternative strategies from an early stage. SD modeling methodology was used to provide a qualitative and conceptual CLD and a quantitative SFD. Using an Indonesian personal care manufacturer as a case study, the sustainability output criteria of five factors were analyzed, including the productivity ratio as an operational criterion, the profitability ratio and tax revenue as economic indicators, the environmental impact as an environmental indicator, and the human health impact as a social criterion.
The developed SD model was used to evaluate three alternative strategies agreed upon by experts in FGDs. Without government subsidies or outside intervention, the self-lean improvement strategy demonstrated the weakest performance in all criteria; improvements implemented by SMIs alone do not significantly influence sustainable goal achievement. The limited cooperation strategy, in which assistance is provided by suppliers and research and academic institutions and a small investment is required, presented improved environmental and human health output criteria but only moderate improvements to the operation and economic criteria. The comprehensive collaboration strategy demonstrated excellence on all sustainability criteria; however, this strategy requires significant investments. Without stakeholders’ commitment and firm support, a comprehensive collaboration strategy cannot be realized. Various activities were proposed for each stakeholder to assist SMIs in their quest toward sustainability, from suppliers to the government.
Overall, this study provides a foundation to develop a model-based, multistakeholder strategy to assist SMIs’ transition toward sustainability by clarifying their role and visually tracing the impact of their contributions in a structured, systematic, and less costly manner.
This research is limited to processes in the manufacturing area; further research is needed to explore sustainable collaboration upstream and downstream of the supply chain overall process, especially to examine the effect of changing material formulations and transportation and logistics mechanisms on the sustainability of cosmetics SMIs. In addition, other researchers can also enrich the open innovation dynamic SMIs’ model with government policy scenario perspectives that might change the choice of alternative strategies set out in this study. The development of these topics has the potential to improve the model-based strategy to achieve sustainable SMIs.
Author Contributions
Conceptualization, U.A. and A.H.; data curation, U.A.; formal analysis, U.A. and A.H.; funding acquisition, T.Y.M.Z.; investigation, U.A.; methodology, U.A., A.H., and T.Y.M.Z.; project administration, U.A.; software, U.A. and A.H.; supervision, A.H. and T.Y.M.Z.; validation, U.A.; visualization, U.A. and A.H.; writing—original draft, U.A.; writing—review and editing, U.A. and A.H. All authors have read and agreed to the published version of the manuscript.
Funding
This research was funded by the PUTI Doctoral Program of the University of Indonesia, grant number NKB-655/UN2.RST/HKP.05.00/2020.
Institutional Review Board Statement
Not applicable.
Informed Consent Statement
Not applicable.
Data Availability Statement
The data will be made available on request from the corresponding author.
Acknowledgments
The author appreciates the experts’ contribution during the FGD and the CV Budi Andhika (a small-medium scale cosmetic company) for sharing case study data.
Conflicts of Interest
The authors declare no conflict of interest.
Appendix A
Table A1.
The triggered questions for discussion with experts in the Focus Group Discussion (FGD).
Table A1.
The triggered questions for discussion with experts in the Focus Group Discussion (FGD).
| Discussion Topic | Question |
|---|---|
| 1. The sustainability goals and how stakeholders involved | a. Should cosmetics SMI managers and decision-makers consider the demands of customers, society, and government for a sustainable industry? Please explain your point of view. |
| b. Do managers have the understanding and ability to achieve a sustainable SMI? | |
| c. What are the current roles and interests of stakeholders to create sustainable SMIs? | |
| 2. The sustainability factors and inter-relationship between factors | a. The following are the factors and their relationships based on literature studies and previous research that affect the achievement of sustainable SMIs. Are there factors or relationships that have not been defined here? Are there any opinions or suggestions? |
| b. Are the factors and relationships listed in the conceptual model enough to be a general model for cosmetics SMIs? | |
| 3. The sustainability performance criteria | These are the output criteria that we define according to the literature and previous research. Are they enough? Are there any other output criteria that might be used as a reference for sustainable Cosmetics SMIs performance indicators? |
| 4. The alternative strategies | a. Which input factors can be used as policy factors that managers and stakeholders can intervene in them? |
| b. What are the possible strategies for cosmetics SMIs to achieve sustainability goals and consider the relationship loops in the conceptual model? |
Appendix B
Table A2.
List of Equations in Powersim.
Table A2.
List of Equations in Powersim.
| Factor | Unit | Powersim Equation |
|---|---|---|
| AC Opr Hours | h/year | GRAPHSTEP(TIME;1;1;{1936;1960;1952;1960;1928;1928;1984//Min:1920;Max:1990//}<<h/year>>) |
| AC power | kWh/year | ROUND(“No of AC” × “Power per AC” × “AC Opr Hr”) |
| Actual environment impact | Pt/year | ROUND(“EI Single Score” × “Goods Produced”) |
| Additional demand | kg/year | 0 |
| Additive ratio | 1 − “Water Ratio” | |
| Capacity standard | kg/year | 48000 |
| Catch_up production | kg/year | ROUND(“Production Plan” − “Capacity Standard” + Rework) |
| Change in environmental impact | Pt/year | “Reference Environmental Impact” − “Actual Environmental Impact” |
| Change in productivity index | “Productivity Index” − “Last Year Productivity Index” | |
| Comp_Opr_Hours | h/year | GRAPHSTEP(TIME;1;1;{1936;1960;1952;1960;1928;1928;1984//Min:1920;Max:1990//}<<h/year>>) |
| Company cost | Rp/year | ROUND(“Production Cost” × (1 + “Material Price Fluctuation Factors”) + “Marketing Expense”) |
| Company revenue | Rp/year | ROUND(“Production Revenue” × “Selling price Fluctuation Factors”*(1 − “Discount Ratio”)) |
| Computer power | kWh/year | ROUND(“No of Computer” × “Power per Computer” × “Comp Opr Hr”) |
| Defect | kg/year | “Defect Ratio” × Production |
| Defect ratio | % | 3 |
| Demand changing factors | kg/Pt | 1 |
| Discount ratio | 0.1209 | |
| EI single score | Pt/kg | 0.0449 |
| EI target | Pt/kg | 0.0449 |
| Energy consumption | kWh/year | ROUND(“Energy Waste” + “Normal Energy Consumption”) |
| Energy cost | Rp/year | “Energy Consumption” × “Energy Price” |
| Energy price | Rp/kWh | 1500 |
| Energy waste | kWh/year | “Waste of Computer” + “Waste of AC Power” + “Waste of Machine Power” |
| Fixed material price | Rp/kg | GRAPH(TIME;1;1;{17000;17000;21000;17000;17000;18000;18000;21000;23000;23000;25000;25000;25000;27000;27000;27000;29000;29000;29000;31000;31000;31000;33000;33000;33000//Min:17000;Max:30000//}<<Rp/kg>>) |
| Flow of additional demand | kg/year | “Potential Demand Change” − “Additional demand” |
| Goods produced | kg/year | Production − Defect + Rework |
| Goods sold | kg/year | “Simulated Demand” |
| Government subsidies | Rp | 0 |
| HR add income | Rp/year | “Overtime Fee” + “Reward − Incentives” |
| HR cost | Rp/year | (“No of HR” × “HR Rate”) + “HR add Income” |
| HR rate | Rp/(person × year) | GRAPH(TIME;1;1;{37300000;38400000;38700000;43300000;44800000;46400000;50500000;50500000;50500000;52000000;53500000;55000000;56500000;58000000;59500000;61000000;62500000;64000000;65500000;67000000;68500000;70000000;71500000;73000000;74500000//Min:35000000;Max:80000000//}<<Rp/(person × year)>>) |
| Human health damage | DALY/year | “Human Health Factor” × “Goods Produced” |
| Human Health Factor | DALY/kg | 2.63333333333333 × 10⁻⁶ |
| Inventory | kg/year | 3141 |
| Lamp operation hours | h/year | GRAPHSTEP(TIME;1;1;{1936;1960;1952;1960;1928;1928;1984//Min:1920;Max:1990//}<<h/year>>) |
| Last year productivity index | 0,95 | |
| Lighting power | kWh/year | ROUND(“Power per Lamp” × “Number of Lamp” × “Lamp Opr Hr”) |
| Mach opr. hour | h/year | GRAPHSTEP(TIME;1;1;{1936;1960;1952;1960;1928;1928;1984//Min:1920;Max:1990//}<<h/year>>) |
| Mach opr. ratio | GRAPH(TIME;1;1;{62,5;62,5;62,5;62,5;62,5;62,5;62,5;62,5;31,3; //Min:30;Max:63//}<<%>>) | |
| Machine power | kWh/year | “No of machine” × “Power per Mach” × “Mach Opr Hr” × Mach_Op_Ratio |
| Maintenance cost | Rp/year | GRAPH(TIME;1;1;{6235000;6235000;6235000;5579000;7433000;7945000;9744000//Min:5000000;Max:10000000//}<<Rp/year>>) |
| Marketing expenses | Rp/year | GRAPH(TIME;1;1;{352578000;273100000;352578000;337036000;284033000;291114000;280521000;293396000//Min:200000000;Max:400000000//}<<Rp/year>>) |
| Material consumption | kg/year | “Normal Material Consumption” + “Material Waste” |
| Material cost | Rp/year | ROUND(“Material Consumption” × “Fixed Material Price”) |
| Material price fluctuation | % | GRAPH(TIME;1;1;{7;40;−13;13;41;31;20;40;28;28;23;23;23;20;20;20;17;17;17;15;15;15;14;14;14//Min:−15;Max:50//}<<%>>) |
| Material waste | kg/year | ROUND(Rework × “Additive Ratio”) |
| No of AC | pieces | GRAPHSTEP(TIME;1;1;{8;8;8;6;6;6;6;5//Min:1;Max:8//}<<pieces>>) |
| No of Admin HR | people | GRAPH(TIME;1;1;{8;8;8;8;8;8;7;7;6;6;6;6;6;6;6;6;6;6;6;6;6;6;6;6;6//Min:5;Max:9//}<<person>>) |
| No of Computer | pieces | 6 |
| No of HR | people | “No of Prod_Log HR” + “No of Admin HR” |
| No of machine | machines | 9 |
| No of Prod_Log HR | people | GRAPH(TIME;1;1;{10;10;10;10;10;10;9;7;7;7//Min:5;Max:10//}<<person>>) |
| No of waste machine | machines | GRAPHLINAS(TIME;1;1;{3;4;3;1;1;1;1//Min:0;Max:5//}<<mach>>) |
| No of water pump | pieces | 2 |
| Normal energy consumption | kWh/year | “AC Power” + “Computer Power” + “Lighting Power” + “Machine Power” + “Water Pump” |
| Normal material consumption | kg/year | ROUND(“Additive Ratio” × (“Goods Produced” + Inventory)) |
| Number of lamps | Pieces | 10 |
| Ord_demand | kg/year | GRAPHCURVE(TIME;1;1;{72167;57792;73751;58655;46813;47750;50344;40275;41081;41902;42741;43595;44467;45357;46264;47189;48133;49095;50077;51079;52100;53142;55268//Min:40000;Max:75000//}<<kg/year>>) |
| Order lead time | h/kg | 0.08 |
| OT fraction | h/kg | 0.03 |
| OT hours | h/year | ROUND(“OT Fraction” × “Catch_Up Production”) |
| OT rate | Rp/hour | 17000 |
| Other fixed costs | Rp/year | GRAPH(TIME;1;1;{395615000;301421000;319640000;241928000;302614000;366015000;330992000//Min:200000000;Max:400000000//}<<Rp/year>>) |
| Overprocessing | h/year | “Waiting hours” + “Reprocess hours” |
| Overtime fee | Rp/year | “OT Hours” × “OT Rate” |
| Plan productivity index | IF(“Last Year Productivity Index”>1;0,97;”Last Year Productivity Index”) | |
| Potential demand change | kg/year | “Change in Environmental Impact”*”Demand Changing Factors” |
| Power per AC | kW/pieces | 0.75 |
| Power per computer | kW/pieces | 0.1 |
| Power per lamp | kW/pieces | 0.02 |
| Power per machine | kWh/mach | 0.424 |
| Power per water pump | kW/pieces | 0.25 |
| Production | kg/year | “Production Plan” |
| Production cost | Rp/year | “Material Cost” + “HR Cost” + “Maintenance Cost” + “Energy Cost” + “Other Fixed Cost” − “Government Subsidies” |
| Production plan | kg/year | (“Simulated Demand”/“Plan Prod Index”) − Inventory |
| Production revenue | Rp/year | “Goods Sold” × “Selling Price” |
| Productivity ratio | “Production Revenue”/“Production Cost” | |
| Profitability ratio | “Company Revenue”/“Company Cost” − 1 | |
| Reference environmental impact | Pt/year | ROUND(“Goods Produced” × “EI target”) |
| Reprocess hours | h/year | Rework × “Rework Time” |
| Reward budget | Rp/year/person | 1000000 |
| Reward-incentives | Rp/year | “No of HR” × “Reward Budget” |
| Rework | kg/year | Defect |
| Rework time | h/kg | 0.02 |
| Selling price | Rp/kg | GRAPH(TIME;1;1;{25000;27000;27000;27000;32000;34000;34000;34000;35000;35000;35000;35000;35000;36000;36000;36000;36000;36000;37000;37000//Min:20000;Max:50000//}<<Rp/kg>>) |
| Selling price fluctuation factors | GRAPHSTEP(TIME;1;1;{191;199;198;218;206;189;181;190;185;185;194;194;194;198;198;198;208;208;208;214;214;214;221;221;221//Min:175;Max:230//}<<%>>) | |
| Simulated demand | kg/year | Ord_Demand + “Additional demand” |
| Tax paid | Rp/year | IF(“Profitability Ratio”>0;”Tax Ratio” × “Company Revenue”) |
| Tax ratio | % | GRAPHSTEP(TIME;1;1;{1;1;1;1;1;1;0,5;0,5;0,5;1;1;1;1;1;1;1;1;1;1;1;1;1;1;1;1//Min:0;Max:1.5//}<<%>>) |
| Waiting hours | h/year | Rework × “Order Lead Time” |
| Waste AC | Pieces | 4 |
| Waste computer | Pieces | 3 |
| Waste of AC power | kWh/year | ROUND(“Waste AC” × “Power per AC” × Overprocessing) |
| Waste of computer power | kWh/year | ROUND(“Waste Comp” × “Power per Computer” × Overprocessing) |
| Waste of machine power | kWh/year | ROUND(“No of Waste Machine” × “Power per Mach” × Overprocessing) |
| Water pump power | kWh/year | “No of Water_Pump” × “Power per Water Pump” × “Water Pump_Opr_Hours” |
| Water pump opr hr | h/year | GRAPHSTEP(TIME;1;1;{1936;1960;1952;1960;1928;1928;1984//Min:1920;Max:1990//}<<h/year>>) |
| Water ratio | 0.44 |
Appendix C
Table A3.
Statistical Validation Using Absolute Mean Errors.
Table A3.
Statistical Validation Using Absolute Mean Errors.
| No | Year | Actual Data (A) | Simulation Result (S) | Absolute Mean Error (AME) |
|---|---|---|---|---|
| 1 | 2013 | Rp. 3031.7 million | Rp. 3029.4 million | 0% |
| 2 | 2014 | Rp. 2765.8 million | Rp. 2729.4 million | 1% |
| 3 | 2015 | Rp. 3498.2 million | Rp. 3466.0 million | 1% |
| 4 | 2016 | Rp. 3150.7 million | Rp. 3035.0 million | 4% |
| 5 | 2017 | Rp. 2766.2 million | Rp. 2712.8 million | 2% |
| 6 | 2018 | Rp. 2719.6 million | Rp. 2697.4 million | 1% |
| 7 | 2019 | Rp. 2778.7 million | Rp. 2723.6 million | 2% |
| 8 | 2020 | Rp. 2222.5 million | Rp. 2287.2 million | 3% |
| Absolute mean error (AME) | 1% | |||
References
- Villena, K. World Market for Beauty and Personal Care. Available online: https://www.euromonitor.com/article/world-market-for-beauty-and-personal-care-2 (accessed on 1 August 2021).
- Ramli, N.S. Green Marketing: A New Prospect in the Cosmetics Industry. In Sustainable Entrepreneurship and Investments in the Green Economy; Vasile, A.J., Nicolò, D., Eds.; IGI Global: Hershey, PA, USA, 2017; pp. 200–230. [Google Scholar] [CrossRef]
- Bilal, M.; Mehmood, S.; Iqbal, H.M.N. The beast of beauty: Environmental and health concerns of toxic components in cosmetics. Cosmetics 2020, 7, 13. [Google Scholar] [CrossRef]
- UkoNaku, J.; Inah, B.; Mowang, D.; Ugosor, T. Health impact of toxic metals in facial cosmetics used in Calabar, Nigeria. Int. J. Pharmacol. Toxicol. 2020, 8, 29–35. [Google Scholar] [CrossRef]
- Sugibayashi, K.; Yusuf, E.; Todo, H.; Dahlizar, S.; Sakdiset, P.; Arce, F., Jr.; See, G.L. Halal cosmetics: A review on ingredients, production, and testing methods. Cosmetics 2019, 6, 37. [Google Scholar] [CrossRef]
- Sahota, A. Sustainability: How the Cosmetics Industry Is Greening Up; Wiley Online Library: Hoboken, NJ, USA, 2014. [Google Scholar]
- Belhadi, A.; Sha′ri, Y.B.M.; Touriki, F.E.; El Fezazi, S. Lean production in SMEs: Literature review and reflection on future challenges. J. Ind. Prod. Eng. 2018, 35, 368–382. [Google Scholar] [CrossRef]
- Muñoz-Pascual, L.; Curado, C.; Galende, J. The triple bottom line on sustainable product innovation performance in SMEs: A mixed methods approach. Sustainability 2019, 11, 1689. [Google Scholar] [CrossRef]
- Yacob, P.; Wong, L.S.; Khor, S.C. An empirical investigation of green initiatives and environmental sustainability for manufacturing SMEs. J. Manuf. Technol. Manag. 2019, 30, 2–25. [Google Scholar] [CrossRef]
- Godfrey-Smith, P. The strategy of model-based science. Biol. Philos. 2007, 21, 725–740. [Google Scholar] [CrossRef]
- Hidayatno, A.; Rahman, I.; Muliadi, R. Understanding dynamics of green house gases impacts on Jakarta’s urban development using model-based policy simulator to support policy making. In Proceedings of the International Conference on Industrial Engineering and Operations Management, Bali, Indonesia, 7–9 January 2014; pp. 1209–1214. [Google Scholar]
- Moisander, J.; Stenfors, S. Exploring the Edges of Theory-Practice Gap: Developers and Users of Strategy Tools. 2005. Available online: http://epub.lib.aalto.fi/pdf/diss/a297.pdf (accessed on 28 March 2007).
- Pilemalm, S.; Hallberg, N.; Sparf, M.; Niclason, T. Practical experiences of model-based development: Case studies from the Swedish Armed Forces. Syst. Eng. 2012, 15, 407–421. [Google Scholar] [CrossRef]
- Dey, P.K.; Yang, G.l.; Malesios, C.; De, D.; Evangelinos, K. Performance management of supply chain sustainability in small and medium-sized enterprises using a combined structural equation modelling and data envelopment analysis. Comp. Econ. 2019, 58, 573–613. [Google Scholar] [CrossRef]
- Thanki, S.; Govindan, K.; Thakkar, J. An investigation on lean-green implementation practices in Indian SMEs using analytical hierarchy process (AHP) approach. J. Clean. Prod. 2016, 135, 284–298. [Google Scholar] [CrossRef]
- Moldavska, A.; Welo, T. A Holistic approach to corporate sustainability assessment: Incorporating sustainable development goals into sustainable manufacturing performance evaluation. J. Manuf. Syst. 2019, 50, 53–68. [Google Scholar] [CrossRef]
- Jhud, M.A.; Alejandro, G.S.; Laurence, S.; Azapagic, A. An integrated sustainability assessment of synergistic supply of energy and water in remote communities. Sustain. Prod. Consum. 2020, 22, 1–21. [Google Scholar] [CrossRef]
- Amrina, U.; Zagloel, T.Y.M. The harmonious strategy of lean and green production: Future opportunities to achieve sustainable productivity and quality. In Proceedings of the 2019 6th International Conference on Industrial Engineering and Applications (ICIEA), Tokoyo, Japan, 26–29 April 2019; IEEE Publications: Tokoyo, Japan, 2019; pp. 187–192. [Google Scholar]
- Munasinghe, M.; Deraniyagala, Y.; Dassanayake, N.; Karunarathna, H. Economic, social, and environmental impacts and overall sustainability of the tea sector in Sri Lanka. Sustain. Prod. Consum. 2017, 12, 155–169. [Google Scholar] [CrossRef]
- Singh, S.; Olugu, E.U.; Musa, S.N. Development of sustainable manufacturing performance evaluation expert system for small and medium enterprises. Procedia CIRP 2016, 40, 608–613. [Google Scholar] [CrossRef]
- Thanki, S.; Thakkar, J.J. An investigation on lean–green performance of Indian manufacturing SMEs. Int. J. Prod. Perform. Manag. 2019, 69, 489–517. [Google Scholar] [CrossRef]
- Nallusamy, S.; Dinagaraj, G.B.; Balakannan, K.; Satheesh, S. Sustainable green lean manufacturing practices in small scale industries—A case study. Int. J. Appl. Eng. Res. 2015, 10, 143–146. [Google Scholar]
- Belhadi, A.; Touriki, F.E.; El Fezazi, S. Benefits of adopting lean production on green performance of SMEs: A case study. Prod. Plan. Control 2018, 29, 873–894. [Google Scholar] [CrossRef]
- Gandhi, N.S.; Thanki, S.J.; Thakkar, J.J. Ranking of drivers for integrated lean-green manufacturing for Indian Manufacturing SMEs. J. Clean. Prod. 2018, 171, 675–689. [Google Scholar] [CrossRef]
- Amrina, U.; Oktora, A. Analysis of lean and green drivers for sustainable cosmetics SMIs using interpretive structural modelling (ISM). Int. J. Eng. Res. Adv. Technol. 2020, 6, 8–16. [Google Scholar] [CrossRef]
- Amrina, U.; Hidayatno, A.; Zagloel, T.Y.M. Mapping challenges in developing sustainable small and medium industries: Integrating Lean and green principles. J. Ind. Eng. Manag. 2021, 14, 311–328. [Google Scholar] [CrossRef]
- Engert, S.; Rauter, R.; Baumgartner, R.J. Exploring the integration of corporate sustainability into strategic management: A literature review. J. Clean. Prod. 2016, 112, 2833–2850. [Google Scholar] [CrossRef]
- Baumgartner, R.J.; Rauter, R. Strategic perspectives of corporate sustainability management to develop a sustainable organization. J. Clean. Prod. 2017, 140, 81–92. [Google Scholar] [CrossRef]
- Falle, S.; Rauter, R.; Engert, S.; Baumgartner, R.J. Sustainability management with the sustainability balanced scorecard in SMEs: Findings from an Austrian case study. Sustainability 2016, 8, 545. [Google Scholar] [CrossRef]
- Su, J.; Yang, Y.; Zhang, X. Knowledge transfer efficiency measurement with application for open innovation networks. Int. J. Technol. Manag. 2019, 81, 118–142. [Google Scholar]
- Jian, J.; Wang, M.; Li, L.; Su, J.; Huang, T. A partner selection model for collaborative product innovation from the viewpoint of knowledge collaboration. Kybernetes 2019, 49, 1623–1644. [Google Scholar] [CrossRef]
- Rui, Z.; Guijie, Q. A system dynamics model for open innovation community. Int. J. Enterp. Inf. Syst. 2018, 14, 78–88. [Google Scholar] [CrossRef]
- Yang, J.; Su, J.; Song, L. Selection of manufacturing enterprise innovation design project based on consumer’s green preferences. Sustainability 2019, 11, 1375. [Google Scholar] [CrossRef]
- Wu, B.; Gong, C. Impact of open innovation communities on enterprise innovation performance: A system dynamics perspective. Sustainability 2019, 11, 4794. [Google Scholar] [CrossRef]
- Johnson, G.; Whittington, R.; Scholes, K.; Angwin, D.; Regnér, P. Exploring Strategy, 9th ed.; Pearson Education: Harlow, UK, 2011. [Google Scholar]
- Geraili, A.; Salas, S.; Romagnoli, J.A. A decision support tool for optimal design of integrated biorefineries under strategic and operational level uncertainties. Ind. Eng. Chem. Res. 2016, 55, 1667–1676. [Google Scholar] [CrossRef]
- Schwaninger, M.; Grösser, S. System dynamics as model-based theory building. Syst. Res. Behav. Sci. 2008, 25, 447–465. [Google Scholar] [CrossRef]
- Mazzoletti, M.A.; Bossio, G.R.; De Angelo, C.H.; Espinoza-Trejo, D.R. A model-based strategy for interturn short-circuit fault diagnosis in PMSM. IEEE Trans. Ind. Electron. 2017, 64, 7218–7228. [Google Scholar] [CrossRef]
- Gunarsih, T.; Saleh, C.; Syukron, D.N.; Deros, B.M. A hybrid balanced scorecard and system dynamics for measuring public sector performance. J. Eng. Sci. Technol. 2016, 11, 65–86. [Google Scholar]
- Banaś, D.; Michnik, J.; Targiel, K.S. System modeling and control of organization business processes by use of balanced scorecard and system dynamics. Control Cybern. 2016, 45, 185–205. [Google Scholar]
- Arnold, R.D.; Wade, J.P. A definition of systems thinking: A systems approach. Procedia Comput. Sci. 2015, 44, 669–678. [Google Scholar] [CrossRef]
- Kibira, D.; Jain, S.; McLean, C. A system dynamics modeling framework for sustainable manufacturing. In Proceedings of the 27th Annual System Dynamics Society Conference, Albuquerque, NM, USA, 26–30 July 2009; Volume 301, pp. 1–22. [Google Scholar]
- Sterman, J.D. System Dynamics: Systems Thinking and Modeling for A Complex World; Massachusetts Institute of Technology, Engineering System Division: Cambridge, MA, USA, 2003. [Google Scholar]
- Zhan, Z.; Yan, H.; Qi, J. What Do Chinese Entrepreneurs Think about Entrepreneurship: A Case Study of Popular Essays on Zhisland. J. Open Innov. Technol. Mark. Complex. 2020, 6, 86. [Google Scholar] [CrossRef]
- Sterman, J.D. Modeling managerial behavior: Misperceptions of feedback in A dynamic decision making experiment. Manag. Sci. 1989, 35, 321–339. [Google Scholar] [CrossRef]
- Setiawan, A.D.; Sutrisno, A.; Singh, R. Responsible innovation in practice with system dynamics modelling: The case of energy technology adoption. Int. J. Innov. Sustain. Dev. 2018, 12, 387–420. [Google Scholar] [CrossRef]
- Sterman, J. Business Dynamics: System Thinking and Modelling for a Complex Word; Irwin/McGraw-Hill: New York, NY, USA, 2000. [Google Scholar]
- Hidayatno, A.; Rahman, I.; Muliadi, R. A system dynamics sustainability model to visualize the interaction Between economic, social, and environmental aspects of Jakarta’s urban development. In Proceedings of the International Seminar on Science and Technology Innovation, Jakarta, Indonesia, 2–4 October 2012; pp. 179–183. [Google Scholar]
- Kim, D.H.; Anderson, V. Systems Archetype Basics; Pegasus Communication Inc.: Waltham, MA, USA, 1998. [Google Scholar]
- Barlas, Y. Formal aspects of model validity and validation in system dynamics. Syst. Dyn. Rev. 1996, 12, 183–210. [Google Scholar] [CrossRef]
- Martis, M.S. Validation of simulation based models: A theoretical outlook. Electron. J. Bus. Res. Methods 2006, 4, 39–46. [Google Scholar]
- Berawi, M.A.; Miraj, P.; Islamiah, E.R. Revenue analysis of port-city conceptual design. J. Phys. Conf. Ser. 2020, 1500, 012066. [Google Scholar] [CrossRef]
- Rusiawan, W.; Tjiptoherijanto, P.; Suganda, E.; Darmajanti, L. System dynamics modeling for urban economic growth and CO2 emission: A case study of Jakarta, Indonesia. Procedia Environ. Sci. 2015, 28, 330–340. [Google Scholar] [CrossRef]
- Jain, V.K.; Jain, P.K.; Sidola, A.; Kumar, P.; Kumar, D. System dynamics investigation of information technology in small and medium enterprise supply chain. J. Adv. Manag. Res. 2012, 9, 199–207. [Google Scholar] [CrossRef]
- Hidayatno, A.; Destyanto, A.R.; Moeis, A.O.; Rizky, M.; Iman, N. Scenario planning using system dynamics for reducing uncertainty on managing employee turnover. In Proceedings of the 2nd Asia-Pacific Region System Dynamics Conference, Singapore, 19–22 February 2017. [Google Scholar]
- Hossain, M.S.; Ramirez, J.; Szabo, S.; Eigenbrod, F.; Johnson, F.A.; Speranza, C.I.; Dearing, J.A. Participatory modelling for conceptualizing social-ecological system dynamics in the Bangladesh delta. Reg. Environ. Chang. 2020, 20, 28. [Google Scholar] [CrossRef]
- Johnson, B.R.; D’Lauro, C.J. After brainstorming, groups select an early generated idea as their best idea. Small Group Res. 2018, 49, 177–194. [Google Scholar] [CrossRef]
- Vera, P.; Nikulin, C.; Lopez-Campos, M.; Gonzalez Ramirez, R.G.G. Prospective study using archetypes and system dynamics. Acad. Rev. Latinoam. Admin. 2019, 32, 181–202. [Google Scholar] [CrossRef]
- Hidayatno, A.; Rahman, I.; Muliadi, R. Policy analysis of the Jakarta carbon mitigation plan using system dynamics to support decision making in urban development–options for policymakers. Int. J. Technol. 2015, 6, 886–893. [Google Scholar] [CrossRef][Green Version]
- Gupta, V.; Narayanamurthy, G.; Acharya, P. Can lean lead to green? Assessment of radial tyre manufacturing processes using system dynamics modelling. Comput. Oper. Res. 2018, 89, 284–306. [Google Scholar] [CrossRef]
- Peñarroya-Farell, M.; Miralles, F. Business model dynamics from interaction with open innovation. J. Open Innov. Technol. Mark. Complex. 2021, 7, 81. [Google Scholar] [CrossRef]
- Skordoulis, M.; Ntanos, S.; Kyriakopoulos, G.L.; Arabatzis, G.; Galatsidas, S.; Chalikias, M. Environmental innovation, open innovation dynamics and competitive advantage of medium and large-sized firms. J. Open Innov. Technol. Mark. Complex. 2020, 6, 195. [Google Scholar] [CrossRef]
- Yun, J.J.; Zhao, X.; Jung, K.H.; Yigitcanlar, T. The culture for open innovation dynamics. Sustainability 2020, 12, 5076. [Google Scholar] [CrossRef]
- Yun, J.J.; Park, K.B.; Hahm, S.D.; Kim, D. Basic income with high open innovation dynamics: The way to the entrepreneurial state. J. Open Innov. Technol. Mark. Complex. 2019, 5, 41. [Google Scholar] [CrossRef]
- Pichlak, M.; Szromek, A.R. Eco-Innovation, sustainability and business model innovation by open innovation dynamics. J. Open Innov. Technol. Mark. Complex. 2021, 7, 149. [Google Scholar] [CrossRef]
Publisher’s Note: MDPI stays neutral with regard to jurisdictional claims in published maps and institutional affiliations. |
© 2021 by the authors. Licensee MDPI, Basel, Switzerland. This article is an open access article distributed under the terms and conditions of the Creative Commons Attribution (CC BY) license (https://creativecommons.org/licenses/by/4.0/).