Article

Combining Parcel Lockers with Staffed Collection and Delivery Points: An Optimization Case Study Using Real Parcel Delivery Data (London, UK)

The Wolfson School of Mechanical, Electrical and Manufacturing Engineering, Loughborough University, Loughborough LE11 3TU, UK
*
Author to whom correspondence should be addressed.
J. Open Innov. Technol. Mark. Complex. 2021, 7(3), 183; https://doi.org/10.3390/joitmc7030183
Submission received: 1 June 2021 / Revised: 24 July 2021 / Accepted: 25 July 2021 / Published: 4 August 2021

Abstract

:
Delivering parcels to collection and delivery points (CDPs) is often seen as a better option compared with home delivery. However, if the demand is inhomogeneous, either the parcel locker utilization or the service level (i.e., the number of parcels that can be delivered) is low. Either situation would reduce the financial viability. This paper compares two options to increase the utilization, namely: (i) modular lockers (i.e., numbers of lockers adjusted periodically depending on demand) and (ii) combining parcel lockers with staffed CDPs. The latter has the advantage of a low investment cost of staffed CDPs and a low cost per parcel of parcel lockers. Secondly, the paper calculates the optimal number of lockers at a staffed CDP, assuming that all parcels are placed in the staffed CDP if the parcel locker is full. This method was applied to data collected by a parcel delivery company in London. The advantage of using real world data over one year is that it includes seasonal and daily changes in the parcel demand. The decision support method accounts for parcels not being picked up by customers on the delivery day, returned deliveries, and the net present value (NPV) of the investment. This paper shows that having enough lockers for 100% of all parcels compared with 80% doubles the number of required parcel lockers because of the inhomogeneity of the demand. In addition, combining fixed lockers with staffed CDPs offers greater financial benefits compared with modular lockers in this case study.

1. Introduction

Last mile delivery is seen as the costliest part of the supply chain, and can account for 28% of transportation costs [1]. The growth of internet shopping and the resulting change from delivery to retail shops to delivery to customers’ homes has increased the number of delivery vehicles in residential areas [2]. This has caused a rise in external effects (e.g., increased congestion and emissions) in residential areas [2,3,4]. Hence, researchers around the world have investigated alternative delivery methods to reduce the costs and external effects of last mile delivery [2].
Collection and delivery points (CDPs) are often seen as the solution to the last mile delivery problem [2,5,6,7,8,9,10]. The most cited advantages of parcel lockers are the reduced risk of a delivery failure [11,12,13,14] and increased consolidation of deliveries [5,6,7,8,11,13], therefore decreasing the number of drop-off points [6] and vehicle distance travelled [2,15,16]. This reduces the external effects [17,18] and delivery cost [11,14,19,20,21]. CDPs also ease the delivery process by, e.g., eliminating the problem of finding the correct home address of the customer [16] or the requirement to predict and deliver a parcel when the customer is at home [22]. Hence, CDP networks are growing around the world [23,24].
Parcel lockers are unmanned collection points where the customer can pick up a parcel at a convenient time using a code and/or a form of identification (i.e., code sent through email or text, credit card, or governmental ID [22]). However, the high investment costs [13,16] and driver training cost [16] are often a barrier to the set-up of parcel locker systems [16]. Additionally, the inhomogeneous demand reduces the locker utilization (cf. [13]), which reduces the system’s financial viability. Even if the parcel locker network was cost-efficient, it is challenging to find places to set up parcel lockers [15], especially when lockers are placed in public spaces [7,8,16]. While staffed CDPs are an option to reduce the initial investment cost, they require a fee to be paid by delivery companies to staffed CDP per parcel, which varies, e.g., between €0.15 to €1.50 per parcel (Seine-et-Marne region near Paris, France) [18].
To overcome this problem, the authors propose combining staffed CDPs with parcel lockers. To do so, a parcel locker is located in front of a staffed CDP (e.g., shop or post office). It might seem unnatural to have a staffed CDP and a parcel locker at the same place given that spreading them out through the city increases the network density and will reduce, e.g., the distance travelled by customers to the CDP. However, combining both at the same place allows for advantage to be taken of the low investment cost of staffed CDPs and low cost per parcel for lockers. In detail, the number of parcel lockers is chosen so that they are efficiently utilized. When the lockers are full at peak demand times, all of the remaining parcels are delivered to the staffed CDP. Combining lockers with staffed CDPs also eases operation management—for example, it reduces the need for delivery companies to predict whether a parcel locker of the correct size will be available on the delivery day and to transfer this information in real time to the online shops. If only lockers were available, the customer would need to know at the time of purchase whether a locker is available on the delivery day. If both are combined, parcels can simply be placed in the staffed CDP if the parcel locker is full. By doing so, the delivery company does not need to decide between reducing the service level (i.e., parcels cannot be delivered when lockers are full) or sacrificing the utilization (i.e., most parcel lockers are empty most times of the year).
In short, the contribution of the study is a decision support method to determine the optimal number of lockers at a staffed CDP. The paper has the following four contributions:
(1)
The paper differentiates from previous research publications as it uses real parcel delivery data collected for every day over one year as opposed to probabilistic scenarios.
(2)
The paper evaluates the variability and inhomogeneity of parcel deliveries over one year. This is especially relevant for researchers who are doing stochastic optimization.
(3)
The paper also differs from previous studies as it compares modular lockers (i.e., lockers adjusted once per month depending on the demand) with combining fixed lockers and staffed CDPs. Modular lockers have been proposed as a solution to the inhomogeneous demand [25,26]. Combining fixed lockers with staffed CDPs enables advantage to be taken of the low cost per parcel for lockers and low investment costs of staffed CDPs. It is assumed that parcels are placed in fixed lockers and undeliverable parcels due to insufficient locker space are placed in staffed CDPs. Both are at the same place.
(4)
The paper applies the decision support method to determine the optimal number of parcels being delivered to a parcel locker, while the remaining parcels are delivered to a staffed CDP if the number of lockers is insufficient. Given that parcel lockers and staffed CDPs require financial investments at different time points (e.g., high initial investment for parcel lockers and low investment for staffed CDPs), the decision support method considers the net present value (NPV) of the investment. The decision support method can be applied to any delivery trip data set, like the one used in this study.
The sole goal of the paper is to find the optimal number of parcel lockers at a staffed CDP based on real parcel delivery data. The locations of these CDPs are assumed to be as given and are therefore not optimized. The decision support method is also not to be used to decide whether a location should either be a staffed CDP or a parcel locker. Each location needs to be a combination of both. The main aim of the decision support method is to allow companies and policymakers to obtain an understanding of the relationship between the investment and operating cost for parcel lockers and staffed CDPs, as well as the utilization, the number of parcels sent to staffed CDPs, variations in the number of CDPs, and changes in the demand for parcel lockers. It should not be used for the exact sizing or cost estimation of a CDP network, given that important factors such as customer choice have been disregarded. The method is instead to be used at the beginning of the planning phase, when neither the detailed costs to set up a parcel locker nor the costs to deliver one parcel to a staffed CDP is known by city policymakers or delivery companies. It can also be used to improve the negotiation position of delivery companies when determining fees paid to staffed CDP per parcels or rental fees for the land for the parcel lockers.
The paper’s focus is the opposite of the focus of Lin et al. [27]. While both papers optimize parcel locker networks, Lin et al. [27] maximized the service level, while this paper minimizes cost. In addition, this paper disregards the location but considers the capacity, while Lin et al. [27] did not consider the capacity but included the location. Lin et al. [27] considered a homogeneous demand proportional to the number of residents, while this study uses real parcel delivery data over one year, including seasonal and daily changes. Janjevic et al. [28] considered real delivery data, but only for one example day and for changing demand levels, but not for each day of the year as in this study. In short, this paper considers the inhomogeneity of parcel demand over the week/year, while Lin et al. [27] and Janjevic et al. [28] disregarded this.
In this study, the staffed CDPs are shops such as florists, bars, and press kiosks [11] or post offices, where customers can pick up their parcels. A parcel locker is a single locker where one parcel can be stored per day. In this study only, a CDP is referred to a staffed CDP, which also has multiple parcel lockers.
The paper is structured as follows: After a review of the literature, the simulation and the optimization problem are illustrated. Then, the results are described including an overview of the data set, the optimization problem, an example calculation, and a comparison of the fixed and modular parcel lockers.

2. Literature

While a significant amount of research has been published comparing CDPs with, e.g., home delivery, the research on designing parcel locker networks is rather limited [25]. The research can be split into two groups: (i) spatial location of lockers and (ii) number of lockers and configuration.
A few papers have focused on analyzing the factors that affect the spatial location of CDPs. For example, Kedia et al. [10] determined the factors that could influence CDP acceptability based on a survey in Christchurch, New Zealand. They concluded that CDP density, parking availability, spatial location, close proximity to home or office, safety, and hours of operation affect the acceptability of CDPs most significantly. Lachapelle at al. [15] analyzed the location of parcel lockers in Australia, which was a relatively new system. They concluded that parcel lockers tend to be in high-density areas and are generally close to post offices in Australia [15]. This is likely due to the operator of these parcel lockers being the national post system. Morganti et al. [29] combined a survey with a spatial analysis of the location of staffed CDPs in France. They interviewed delivery companies providing home and alternative delivery options, and also sent questionnaires to staffed CDPs. They concluded that the CDP density decreased quicker than the population density, but the access was still acceptable in rural areas. Interviewed respondents said that it is sometimes difficult to recruit shops in high density areas because of the high real-estate costs, which increases the cost of the parcel storage space.
Extensive research has been done on optimizing the location of CDPs and the number of parcel lockers. This research is outside of the scope of the study, given that the location of CDPs is given in this study. Some notable examples of these studies are as follows.
Lin et al. [27] and Janjevic et al. [28] optimized the location of parcel lockers. Lin et al. [27] used a multinomial logit (MNL) to model the customer choice to use a parcel locker and a multi-ratio linear-fractional 0-1 program (MLFP) to optimize a parcel locker network by adding or removing lockers. They applied their model to a case study using the estimated demand proportional to the population density in Singapore. They concluded that the large-scale problems could only be solved using a Quadratic Transform with Linear Alternating (QT-LA), while smaller problems could be solved with mixed-integer linear programming (MILP) with added McCormick inequalities. Janjevic et al. [28] optimized the number of CDPs served from a given number of satellite facilities (i.e., city/local depots) for a case study in São Paulo based on real delivery data using a two-echelon capacitated location-routing problem. Their model highlighted the possible cost savings by using CDPs. Their model concluded that because of the high cost of satellite facilities, only the minimum number of satellite facilities should be used as well as 85 CDPs.
One of the disadvantages of parcel lockers is the dependency on homogeneous demand and the inability to adapt to seasonal changes. Therefore, some studies focused on modular lockers, which are adaptable to the changing demand. Dell’Amico et al. [26] proposed a compartmentalized BentoBox (i.e., the driver plugs compartments with multiple lockers into a frame) and a monolithic BentoBox (i.e., a module with multiple lockers that is attached to a fixed docking station). They compared both methods but did not develop an algorithm to determine the optimal design and number of lockers. Faugère et al. [25] built upon the previously mentioned study by developing an optimization model for fixed-configuration parcel lockers and one for modular tower parcel lockers, both with varying locker sizes. The modular tower parcel lockers allow for lockers to be added and removed depending on the demand in the medium-term. They compared the performance over probabilistic scenarios at four different locker sites. While the objective function for the modular tower-based design was slightly lower, no difference in the service level could be seen. Overall, modular lockers are regarded as an option to decrease the number of failed deliveries, which therefore reduces the distance and time traveled by the delivery vehicle [30].
More recently, mobile lockers have been proposed as a solution for failed deliveries. These lockers change location throughout the day to reduce the travel distance of customers to the lockers [31]. Schwerdfeger et al. [31] developed a dynamic location problem. They minimized the fleet size while serving a specific set of customers. They concluded that 400% more lockers are required for fixed lockers compared with mobile lockers. Li et al. [32] proposed a mixed integer programming model to solve the AML-Courier 2-Echelon Location Routing Problem. They considered humans, robots, multiple depots, multiple mobile lockers, and multiple couriers. They concluded that mobile lockers can reduce costs by 30–40% compared with fixed lockers.

3. Materials and Methods

3.1. Dataset

The number of deliveries per day was calculated based on delivery data from the delivery company Gnewt in Central London, UK [33]. The data set includes details (i.e., number of successfully delivered parcels, failed deliveries, successful pick-ups, attempted pickups, shift start, shift duration, delivery duration, and travel distance) of 13,358 delivery tours using electric vehicles from July 2015 to June 2016 inclusive. During this time, around 2 million parcels were delivered. The number of parcel lockers required per day is the sum of the number of deliveries on a specific day and the number of parcels picked up on the following day and the number of parcels not picked up by customers on the previous day.
n p C D P d = n d C D P d + n r C D P d + 1 + n f C D P d 1
where
  • n p C D P d : Number of parcels delivered to or already in a specific CDP on day d
  • n d C D P d : Number of successful parcel deliveries on day d
  • n r C D P d + 1 : Number of pickups by a delivery driver on the following day (i.e., parcels returned by customer)
  • n f C D P d 1 : Number of parcels not picked up by customers on the previous day.
The number of attempted but unsuccessful deliveries was not used to estimate the number of lockers required as the company would attempt to deliver these on the following day and therefore the parcel would be counted twice. It was assumed that parcels placed in a parcel locker by customers to return to the sender would be placed in the locker within the 24 h before the pick up by the delivery driver. Given that the exact delivery location for each parcel was unknown to the authors of this paper, all parcels were randomly allocated to one of the CDPs. Twelve scenarios were simulated with 1, 2, 4, 8, 16, 32, 64, 128, 256, 512, 1024, and 2048 CDPs. The study accounted for customers being unable to pick up their parcel on the delivery day. Based on data reported from a German parcel locker network operator, 70% of all parcels are picked within 24 h [11]. Therefore, 30% of the parcels in a parcel locker on the previous day are selected randomly and added to the number of parcels delivered to the respective CPD on the current day. Given that the statistic mentioned in [11] did not specify how many parcels are left in the lockers for 48h or more, it is assumed that 30% of the parcels that were left in the locker on the previous day (i.e., 9%) would be left in the locker on the following day as well. A 2.7% probability that a parcel will be left in the locker for three days was adopted.

3.2. NPV/Investment

Given that neither the delivery tour distance nor the cost to travel to a CDP would change because of an increased or reduced number of parcel lockers at these staffed CDPs, these costs were ignored. Therefore, only the cost to set up and operate parcel lockers at a staffed CDP and the fee paid to staffed CDP owner per parcel were compared. In addition, the cost of the web service of parcel locker service and staffed CDPs would not increase because of adding parcel lockers to staffed CDPs and were therefore not included.
When determining the optimal number of parcels to send to lockers and to staffed CDPs, it is important to consider the NPV value of the investment because of the different time points of payments. Sending a parcel to a staffed CDP requires little initial investment, but a fee per parcel is paid to the owner of the staffed CDP in regular instalments. Parcel lockers require a higher initial investment and yearly operating costs (e.g., land rent and driver training), but a limited cost per parcel. The discount rate was assumed to be the rate of return of the FTSE 100 [34] minus the CPI inflation [35]. The yearly compound interest rate of the FTSE 100 was calculated over the past 5, 10, and 15 years, and is around 3%. The CPI inflation is around 2% according to a report of the Bank of England in August 2019 [35]. Formula (2) adds the investment cost for the parcel locker network in today’s value and the operating costs are transferred into today’s value.
c L N P V = c L i + c C i n c + t = 1 T c L o ( 1 + i ) t
where
  • c L N P V : Cost per locker in today’s value
  • c L i : Initial investment to set up one parcel locker
  • C C i : Initial investment to set up one computer at a CDP
  • n c : Number of lockers per computer
  • c L o : Yearly operating cost (e.g., land rent, maintenance, and driver training) per locker
  • T : Number of years
  • i : Discount rate (1% [34,35])
  • t : Year.
The fee paid to owners of staffed CDPs should consider the time required to place a parcel in storage, to find it again, and to hand it over to a customer, as well as the cost of rent for the storage space. The price should also reflect that the staff in the CDP have to be paid, even if no customer is picking up a parcel. The fee charged by CDP owners should reflect that parcels might be stored longer in a staffed CDP because of the reduced opening times compared with parcel lockers. It is also beneficial to consider not just the fee paid to CDP owners, but also the cost of an unsatisfied customer given that the parcel had to be picked up from a staffed CDP, which might have reduced opening times. The fee paid by delivery companies to staffed CDP in the Seine-et-Marne region near Paris (France) ranges from €0.15 to €1.50 (average: €0.50) per parcel according to Moroz et al. [18]. Some staffed CDP networks in London (UK) charge customers around £1.95 per parcel if the online shop/delivery company has no agreement with them, in other cases, it is included (sometimes for a small fee) in the shipping cost [36]. The following formula can be used to transfer the fee paid to staffed CDP in the future into today’s value. Formula (3) is based on the net present value (NPV) formula.
c S N P V = t = 1 T c S ( 1 + i r ) t
where
  • c S N P V : Cost to send one parcel to a staffed CDP in today’s monetary value
  • c S : Cost to send one parcel to a staffed CDP
  • T : Number of years considered in the study
  • i : Discount rate (1% [34,35])
  • r : Increase in the fees paid to staffed CDP (0%)
  • t : Year.
The discount rate can be complemented with a rate by which the fees paid to staffed CDP owners will increase. If the fees paid to staffed CDP owners stay constant, a fee of £0.50 in 15 years’ time has a value of £0.43 today. The average fee over the 15 years would therefore be £0.47.

3.3. Optimized Number of Lockers at Each Staffed CDP

The optimum choice between adding more lockers to a staffed CDP or letting staff handle the parcel was estimated based on the following minimization problem. The following linear program (LP) added the cost for all of the parcel lockers installed in the network to the fees paid to staffed CDPs, which depends on the number of parcels that cannot be delivered to lockers when they are full.
Minimize:
Z = c L N P V × C D P = 1 n C D P n L C D P + c S N P V × d = 1 D C D P = 1 n C D P m a x { n p C D P d n L C D P , 0 }
Subject to:
c L N P V < 365 × c S N P V
c L N P V > c S N P V
where
  • c L N P V : Cost per locker in today’s value
  • c S N P V : Cost to send one parcel to a staffed CDP in today’s monetary value
  • n s : Number of parcels sent to a staffed CDP per year
  • D : Number of days in a year
  • n C D P : Number of CDPs
  • n p C D P d : Number of parcels delivered to or are already in a specific CDP on day d
  • n L C D P : Number of lockers at a specific CDP
The cost of a locker needs to be smaller than the cost to send 365 parcels to a staffed CDP, as it would otherwise not make sense to deliver any parcels to the lockers. The cost of a locker needs to be higher than the cost to send one parcel to a staffed CDP, as it would otherwise not make sense to send any parcel to a staffed CDP.
Given that the number of parcels sent to each CDP is not the same, requiring the same number of parcel lockers at each CDP would increase the number of required parcel lockers. Thus, the following optimization was used to allocate the number of available lockers in the entire network optimally to each CDP. The following LP finds the minimum number of parcels sent to staffed CDPs for a set number of parcel lockers. By doing so, the optimal distribution of parcel locker spaces across the CDPs is determined.
Minimize:
Z = n S = d = 1 D C D P = 1 n C D P m a x { n p C D P d n L C D P , 0 }
Subject to:
n L = C D P = 1 n C D P n L C D P
where
  • c L N P V : Cost per locker in today’s value
  • c S N P V : Cost to send one parcel to a staffed CDP in today’s monetary value
  • n s : Number of parcels sent to a staffed CDP per year
  • D : Number of days in a year
  • n C D P : Number of CDPs
  • n p C D P d : Number of parcels delivered to or are already in a specific CDP on day d
  • n L C D P : Number of lockers at a specific CDP.
Neither the cost to set up a parcel locker network nor how the cost to deliver one parcel to a staffed CDP will change in the future, which are available a priori. Therefore, the authors refrained from making assumptions about the exact costs and instead used the cost factor c L N P V / c S N P V to illustrate the results in this paper. Using this factor instead of the actual cost has the advantage that the optimization problem has to be solved only once for a selection of cost factors, even if the actual costs are changing. This also allows delivery companies to get an understanding of the range of the cost they can expect, and how this changes depending on the number of CDPs or future changes in the parcel demand. Both of which might not be known a priori when planning a parcel locker network.

4. Results

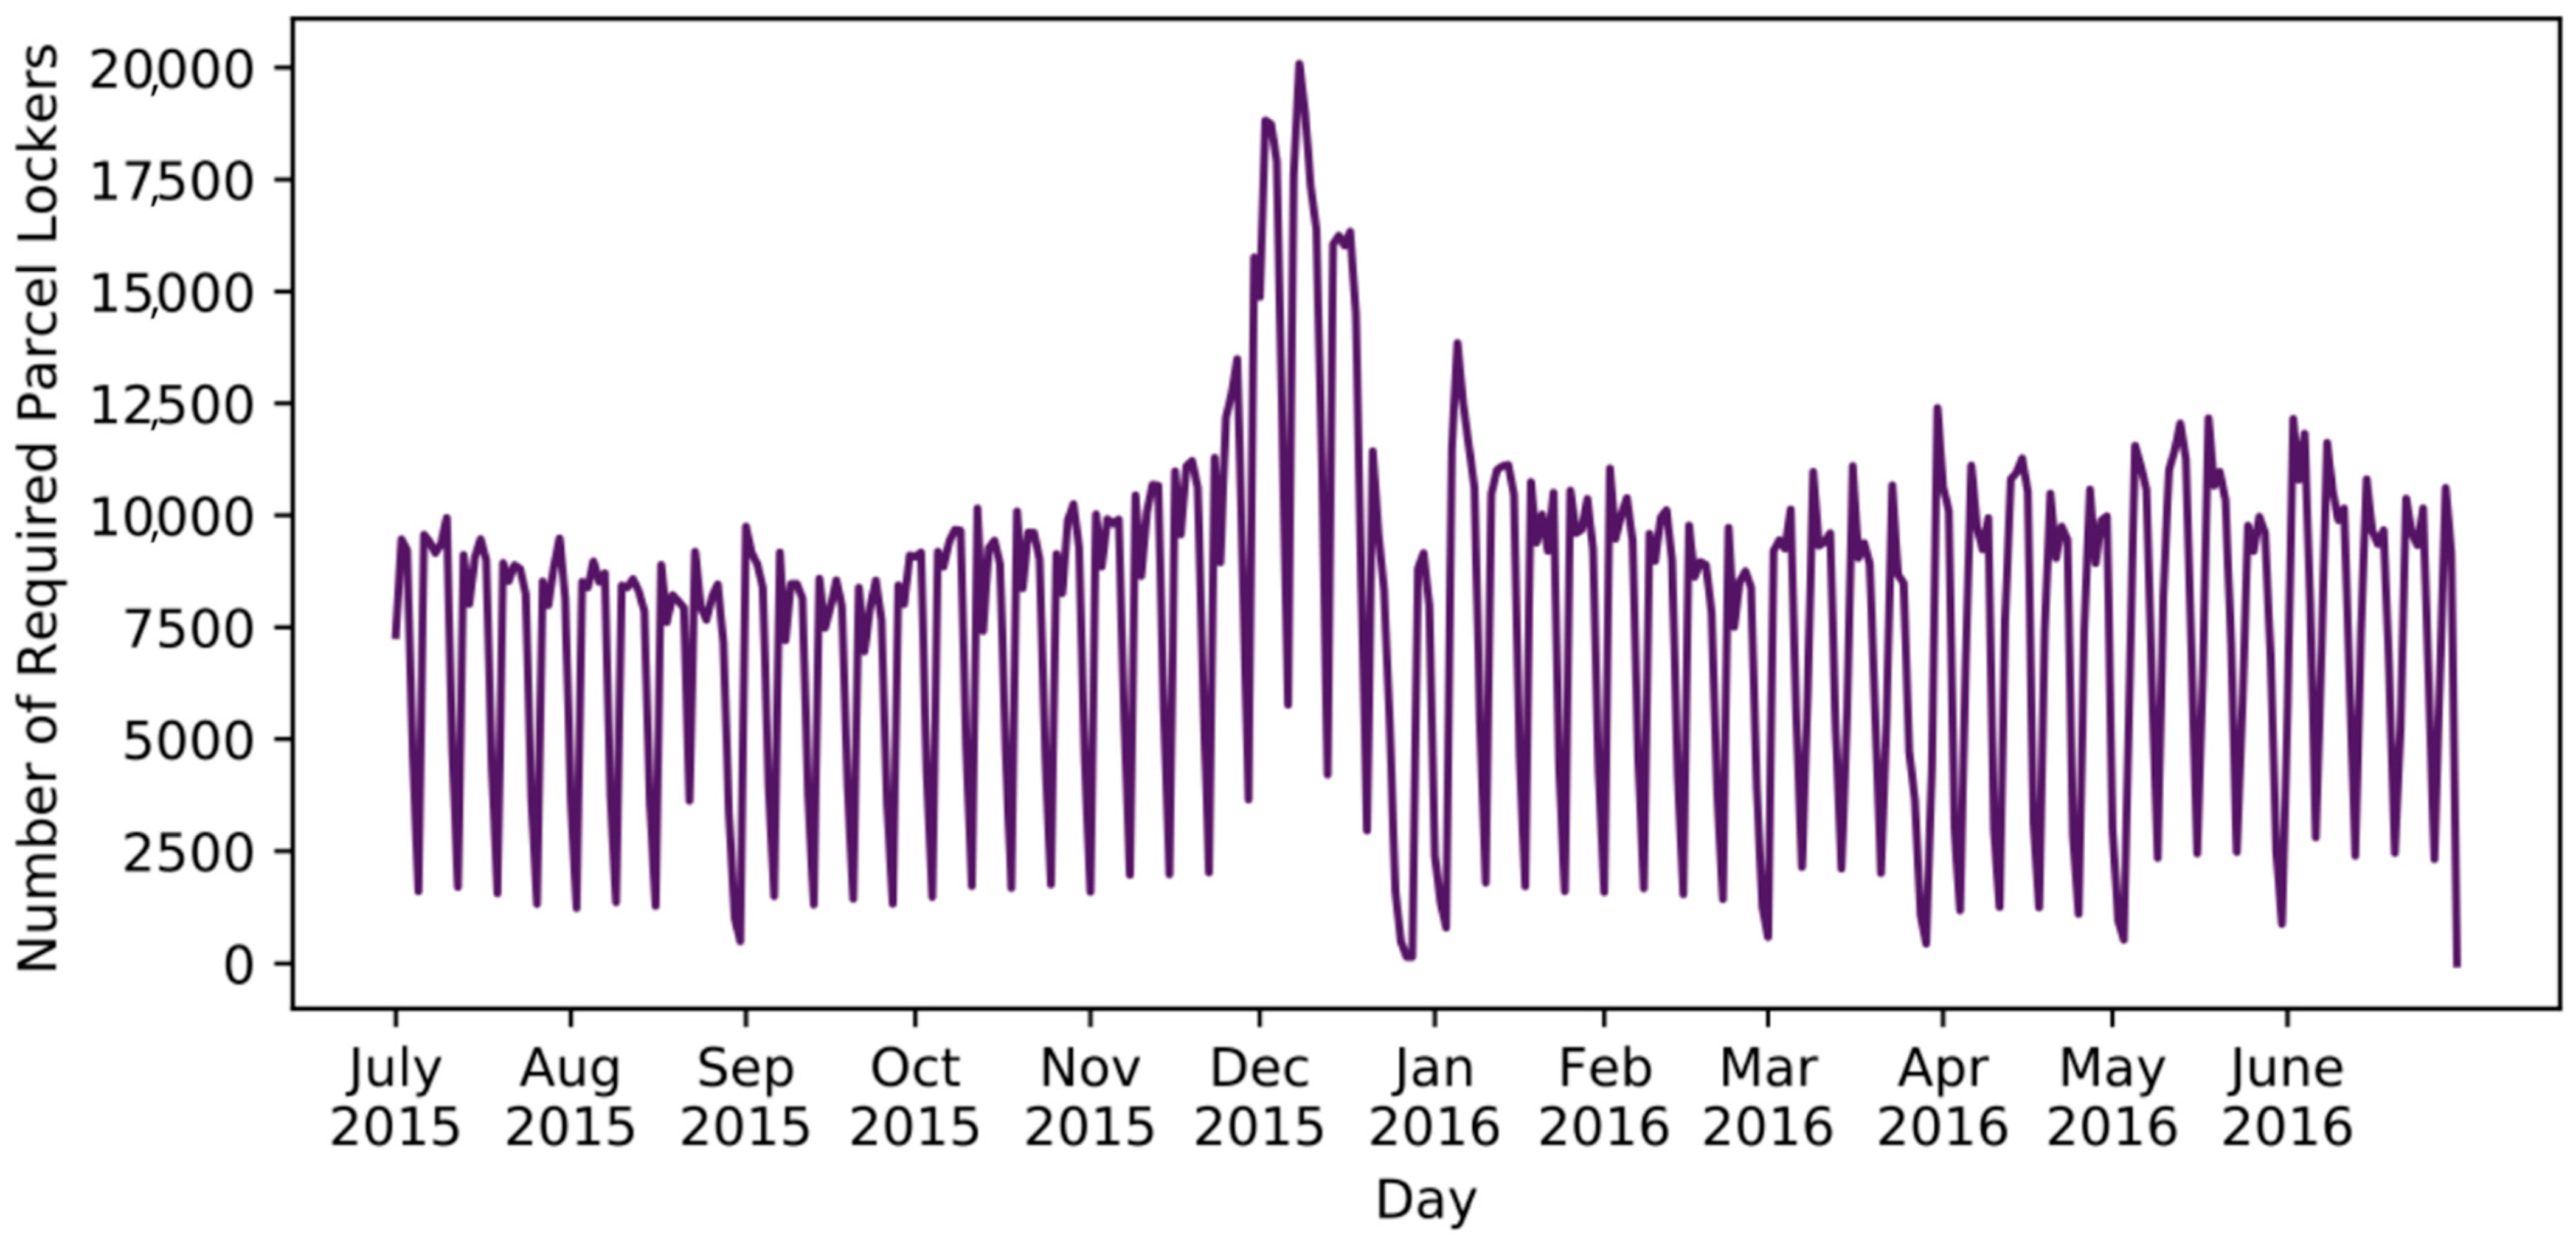
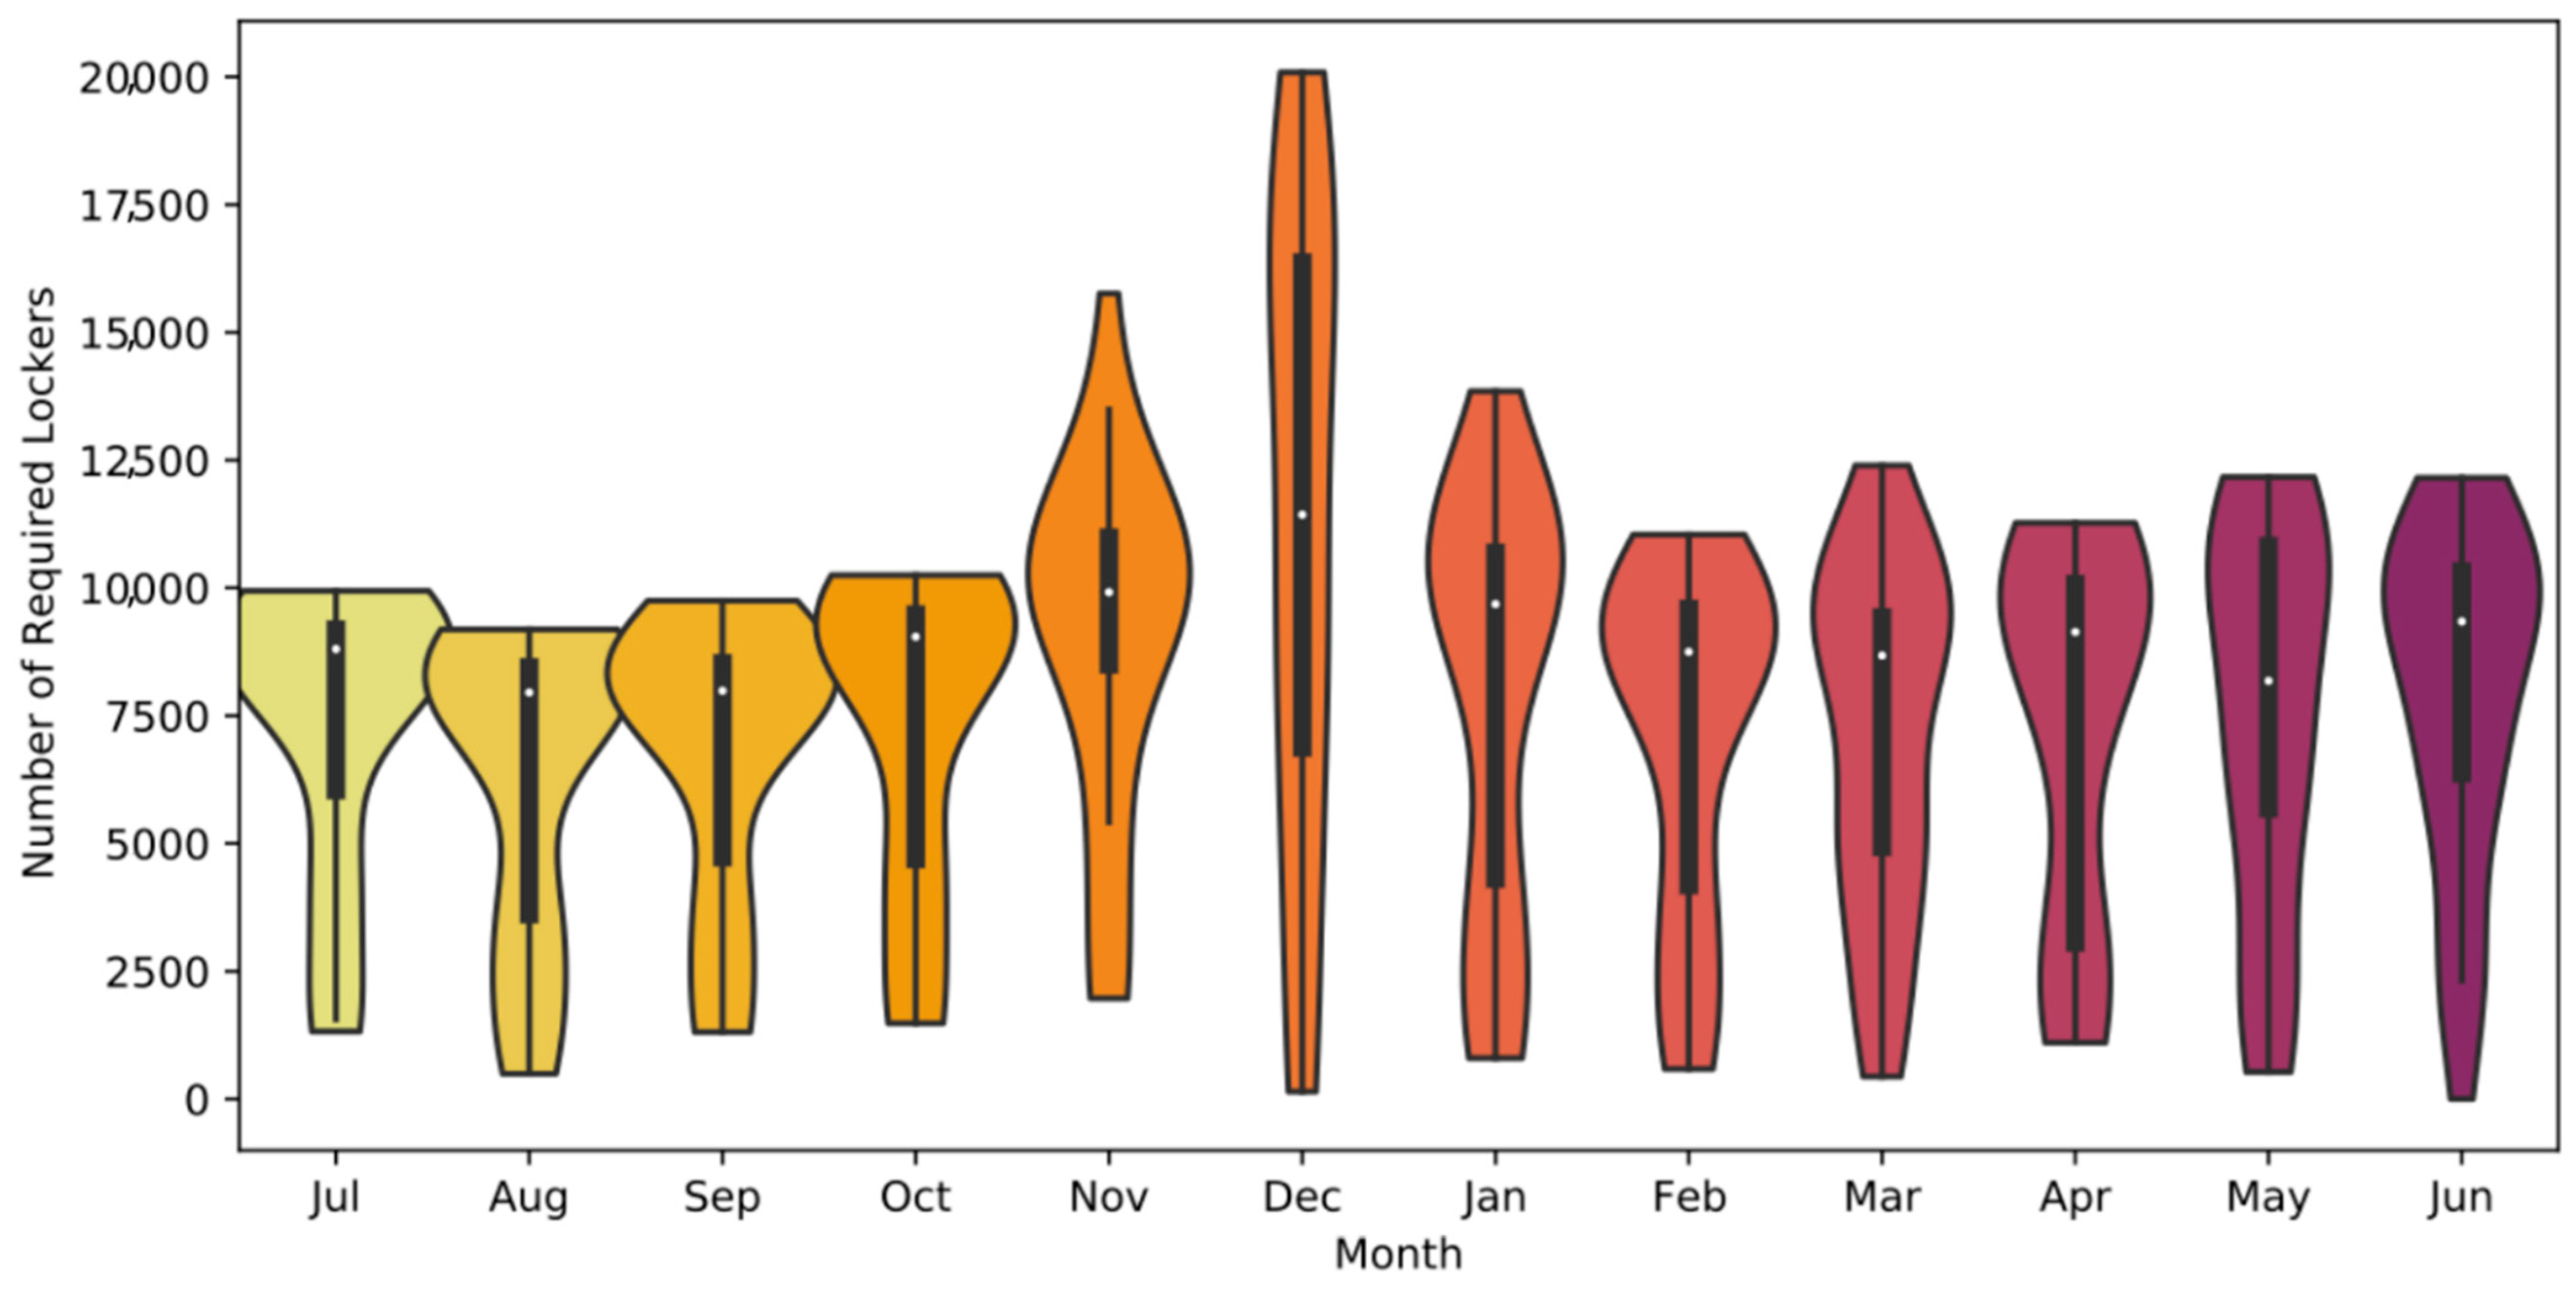
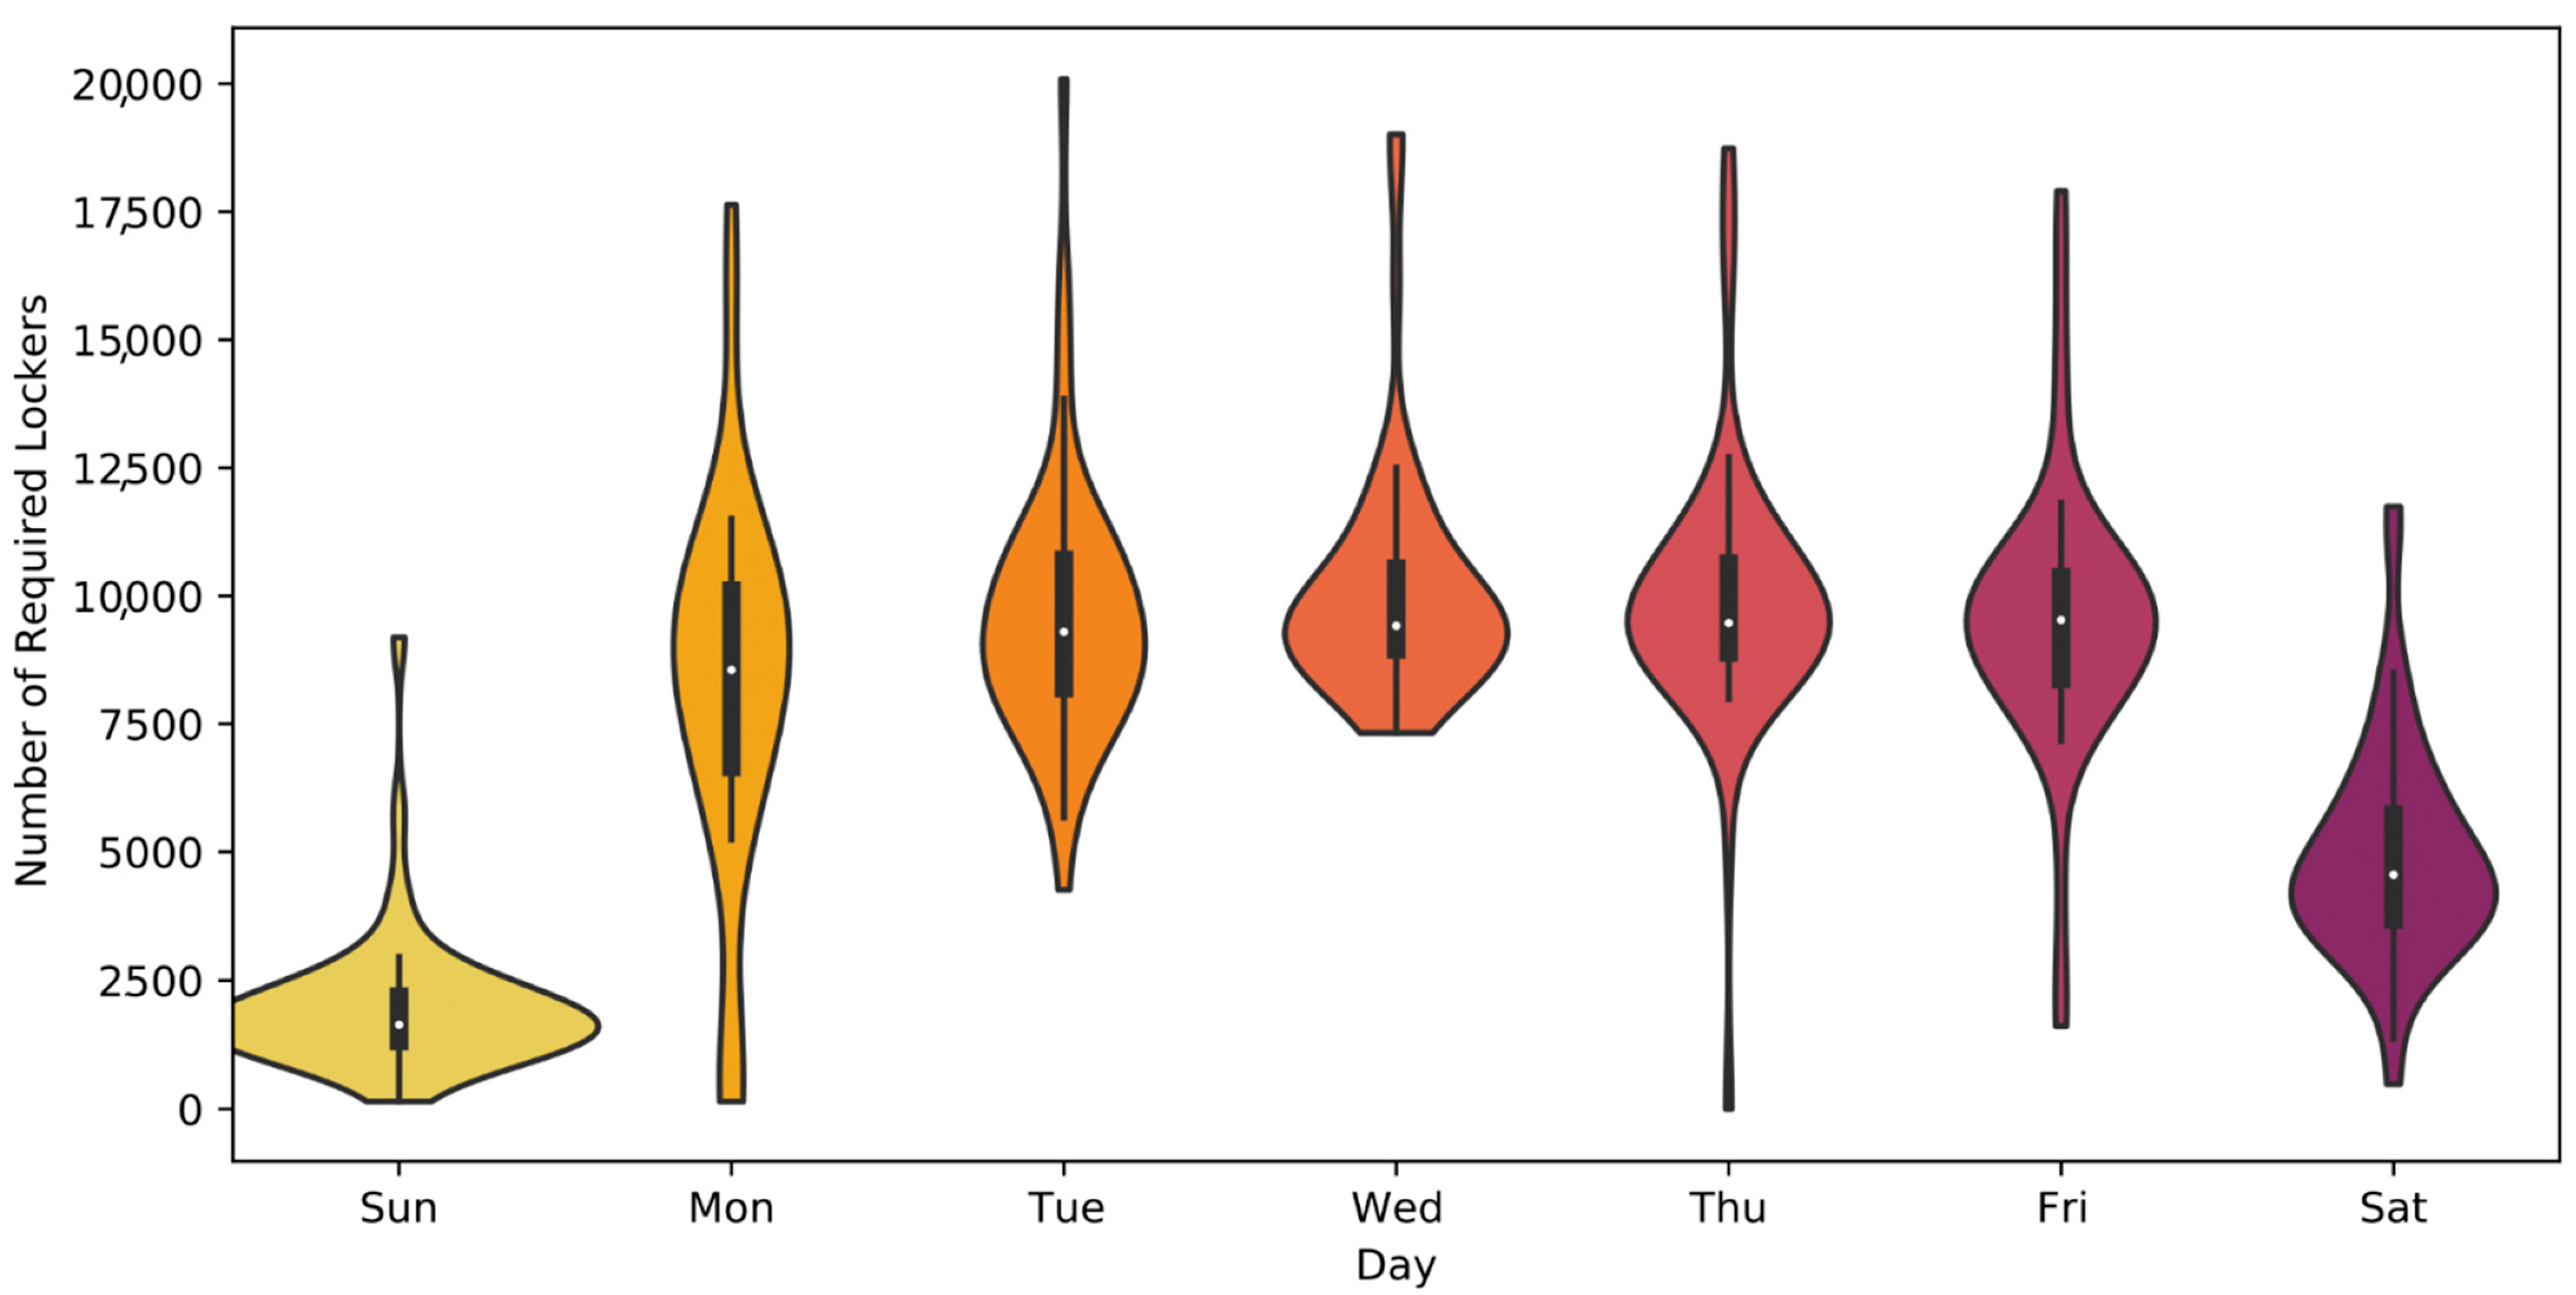
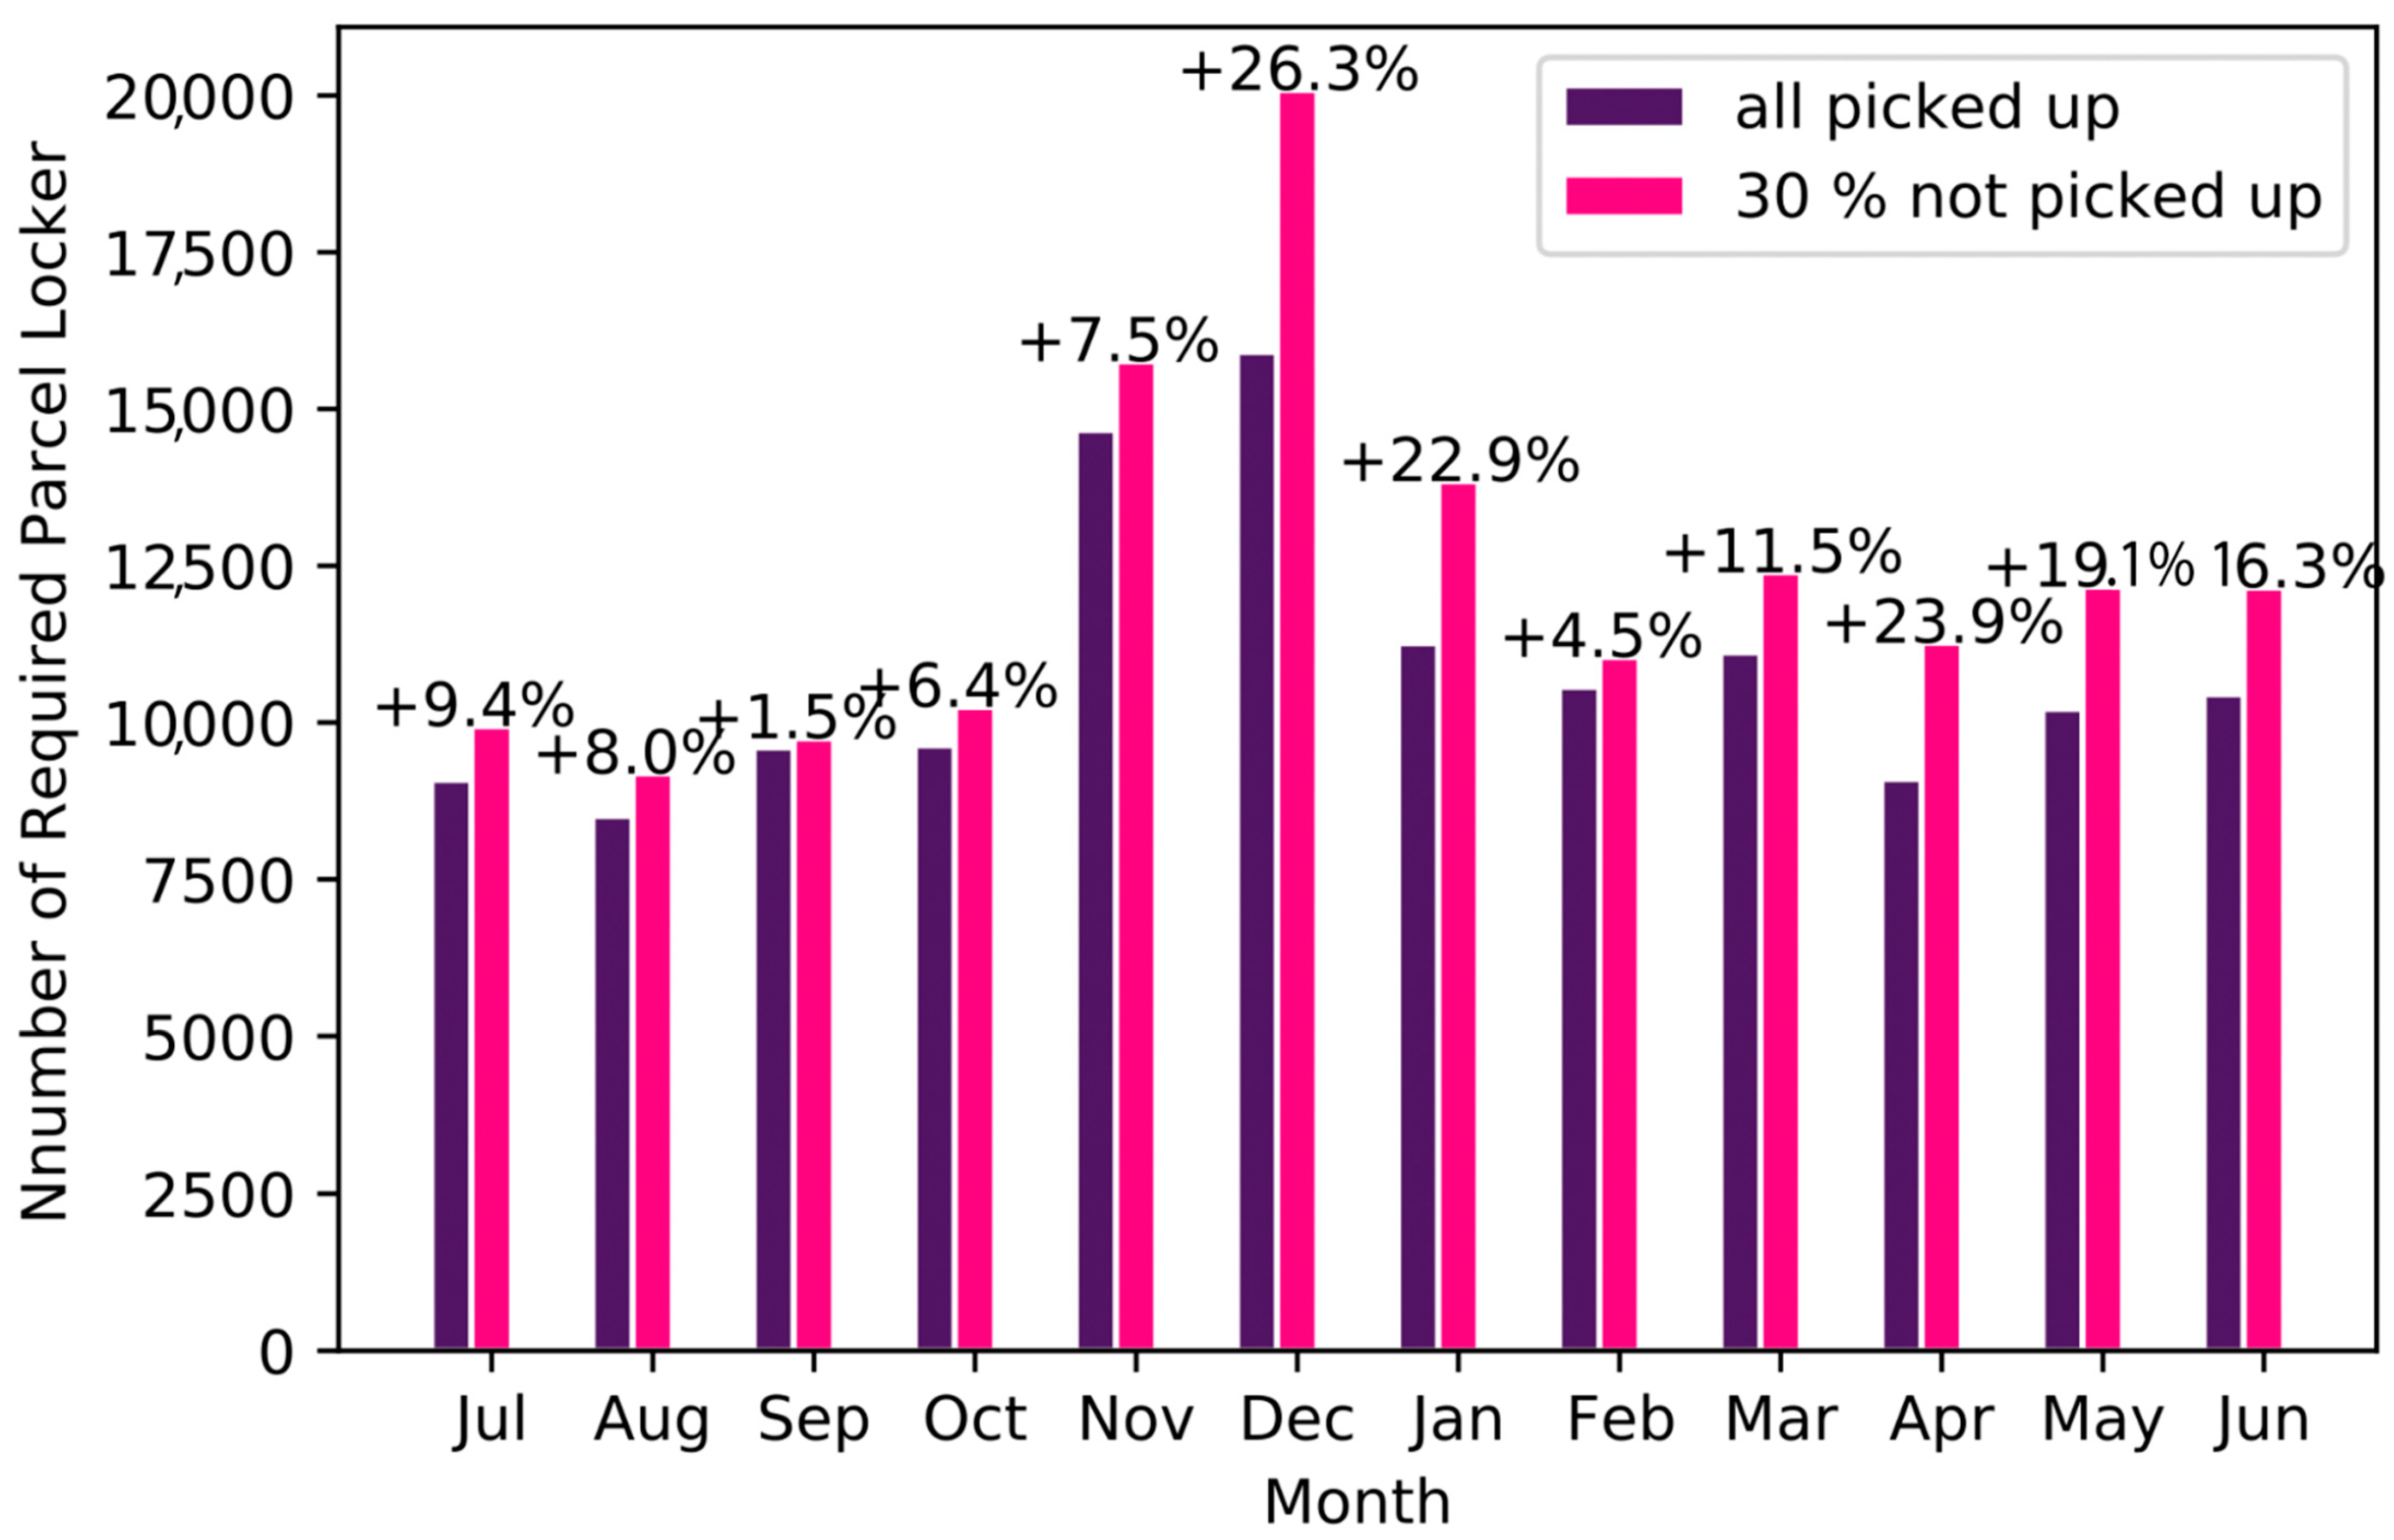
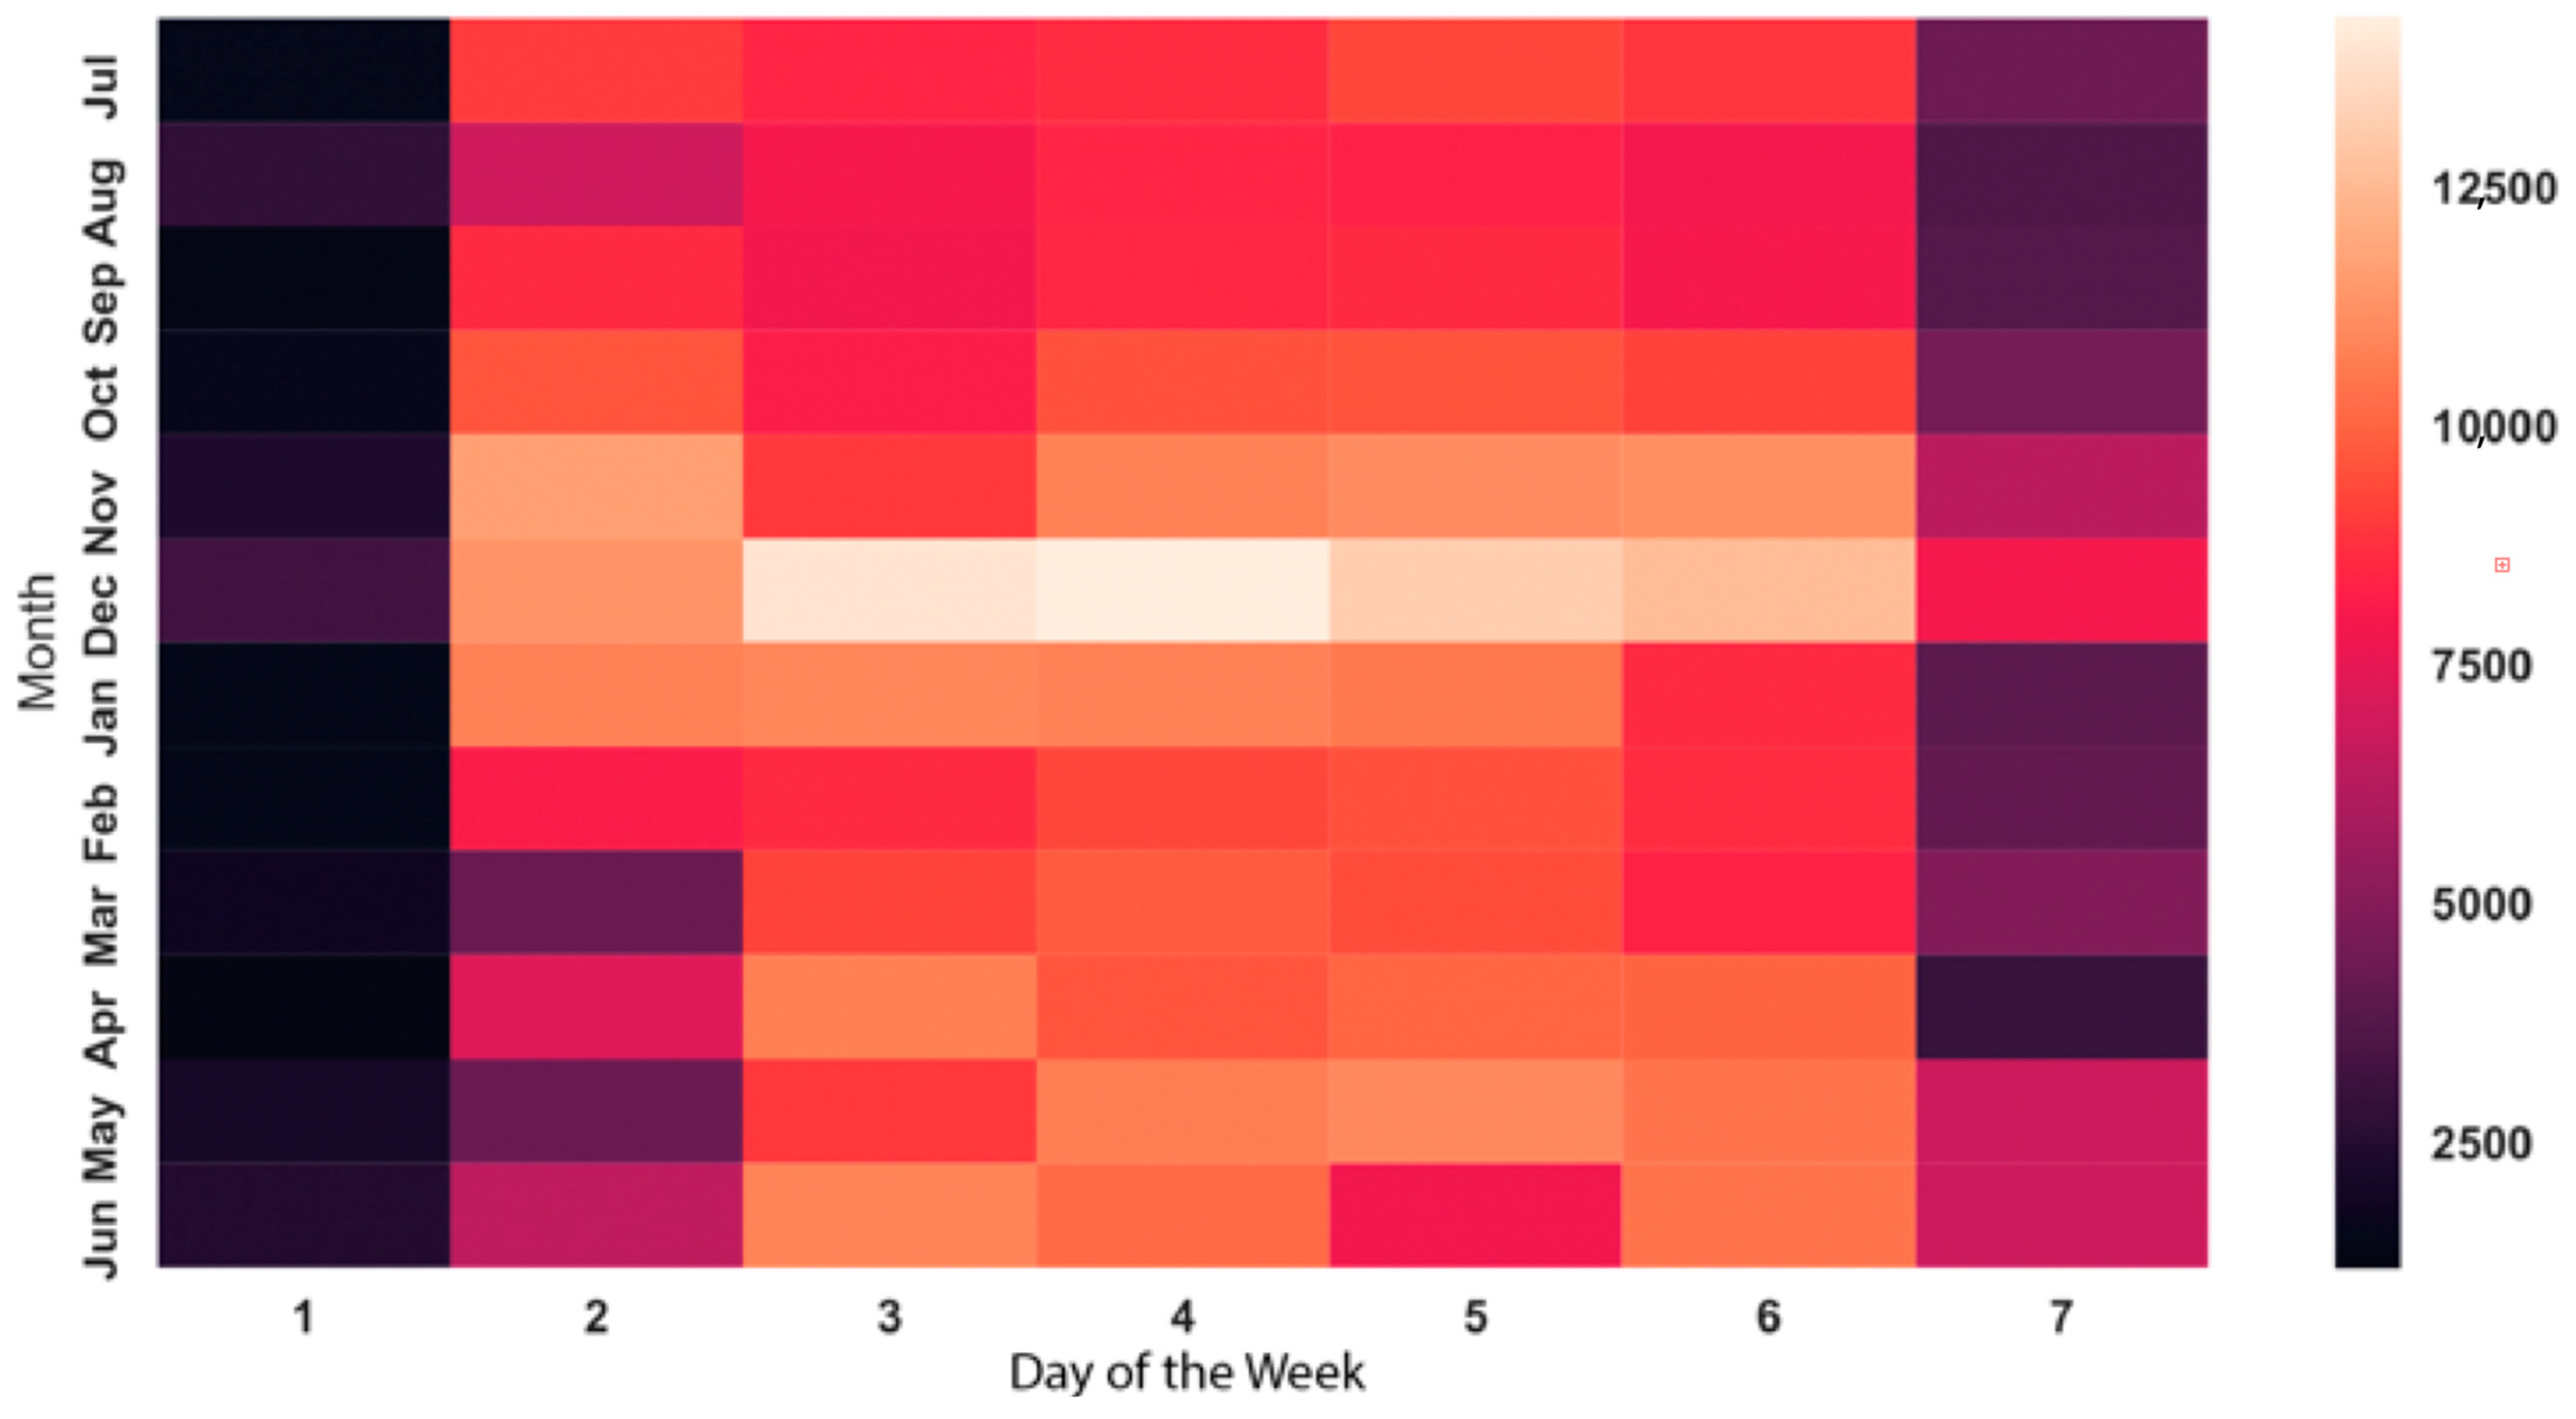
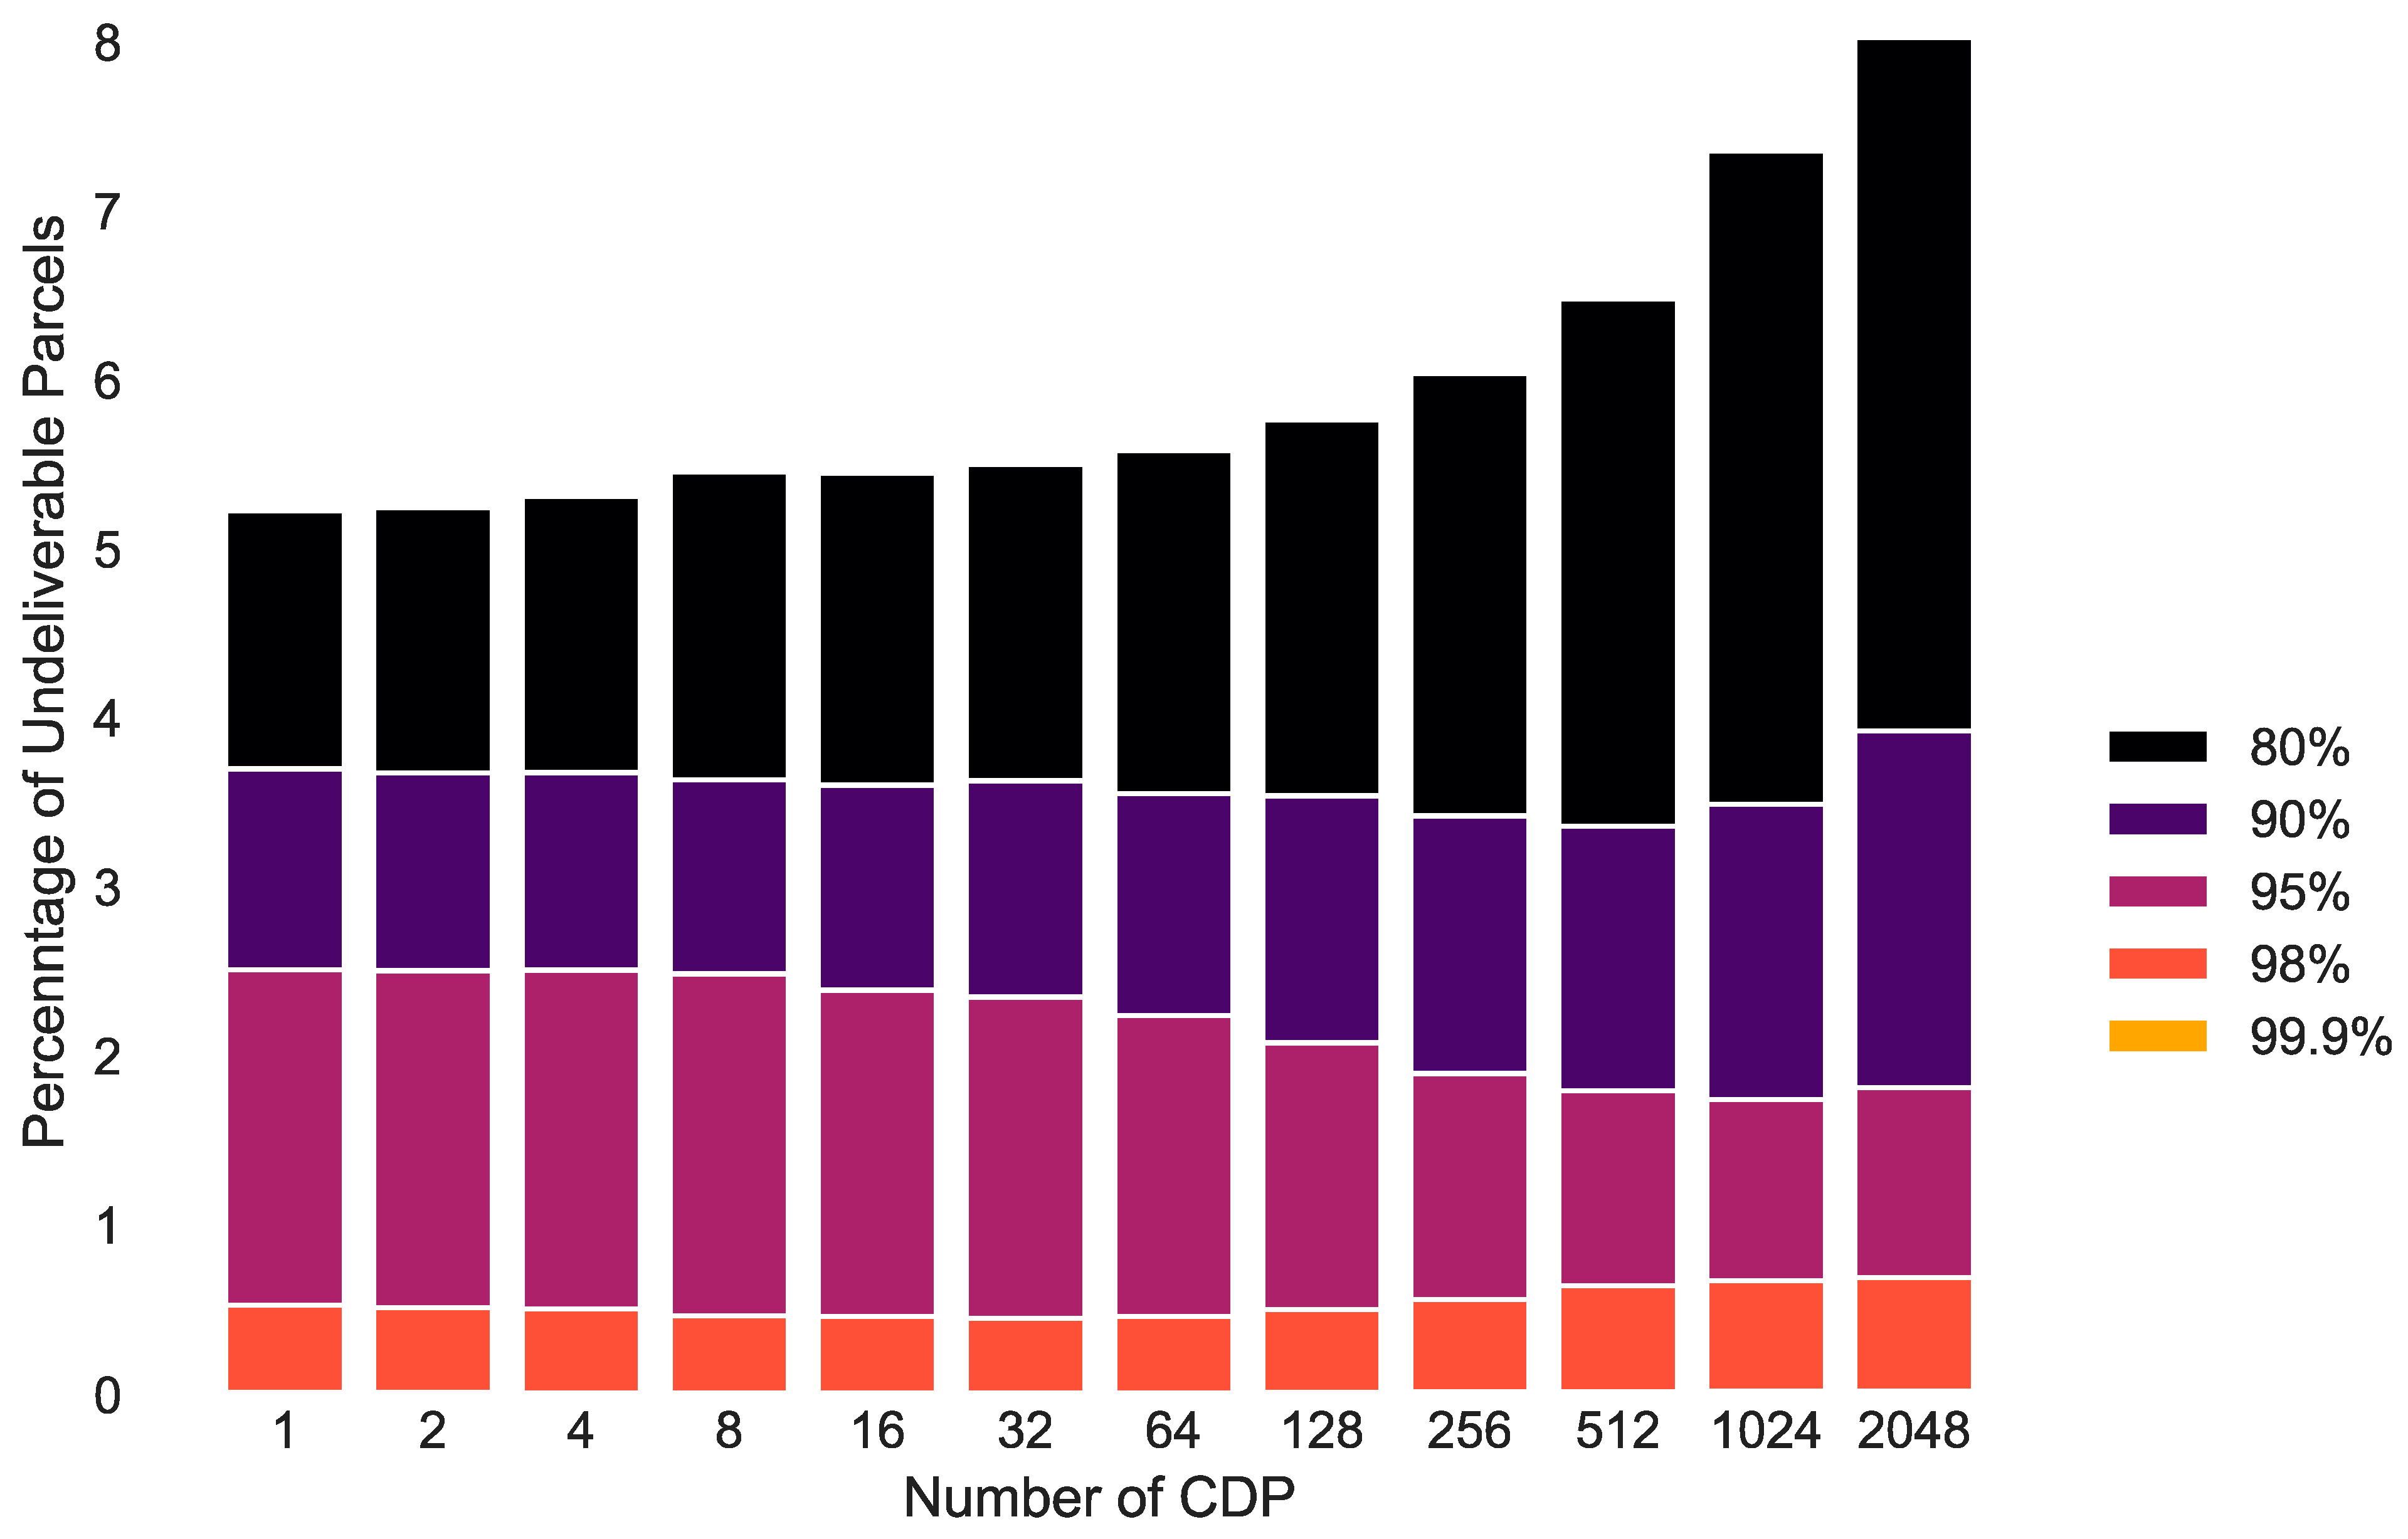
4.1. Number of Locker Spaces Required per Day

Figure 1 shows the number of lockers required each day over one year if all parcels would be delivered to lockers. The number of lockers peaks before Christmas and has minima on weekends.
Figure 2 and Figure 3 show the number of locker spaces required if all parcels would be delivered to the lockers per month and per day, respectively. The wider the violin plot, the more times this specific number of parcel lockers is needed. The outer line of each violin plot [37] was estimated based on a kernel density estimation of the raw data. The number of lockers required each day ranges every month from 0 to more than 9000. The low numbers are due to the reduced number of parcels being delivered on Sundays, as seen in Figure 3. For example, in April, no parcels were delivered on weekends. This means that only a few lockers were required on Sundays for the parcels, which were picked up on the following Monday by employees, and contained parcels forgotten to be picked up by customers. In November and December, the number of lockers required each day peaked, while April, July, and August (the Easter and summer holiday seasons) represented the times of lowest demand. The number of lockers required per day in December varied more compared with other months because of the high demand before Christmas and the low demand during the holidays. The majority of parcel lockers were required on Wednesdays and Thursdays (Figure 3), while Sunday was the day with the lowest number of parcel lockers required. The average number of parcel lockers required was higher on Mondays than Tuesdays, which could be due to people ordering on the weekend and using 24 h or 48 h delivery. Figure 2 and Figure 3 show that it is difficult to achieve a high utilization of parcel lockers because of the varying demand for parcel lockers.
Figure 4 and Figure 5 shows the increase in the number of lockers required due to customers forgetting to pick up parcels. The maximum number (Figure 4) of parcel lockers required each month increases between 1.5% and 26.3% depending on the month, even though 30% of all parcels were not picked up each day. This can be explained by the fact that when a day with a high demand for parcel lockers is followed by a day with a low demand for parcel lockers, a lot of parcels would still be in the lockers from the previous high demand day, meaning that the number of lockers required on the low demand day could be larger than the number of parcels actually delivered that day. If the following day is again a high demand day, only a low number of parcels will be left in the locker from the previous low demand day, and therefore the maximum number of lockers required increases only slightly on the high demand day. In short, the maximum number of lockers required gets slightly evened up.
The mean number (Figure 5) of lockers required increased by around 40%, given that 30% of parcels were left in the locker for 2 days, 9% were left for 3 days, 2.7% were left for 4 days. (Figure 5). For example, if 100 parcels are in a parcel locker, 70 parcels were delivered on that day and 30 are left over from the previous day. On the following day, 70 parcels are delivered and 30 parcels (= 100 ∗ 0.3) are leftovers from the previous day. Thus, the increase from 70 delivered parcels to 100 parcels in the locker is 42.9%.
As can be seen in Figure 3 and Figure 6, the mean number of lockers required on Sundays and Saturdays is low for all months. On Wednesdays, five times as many lockers were required compared with Sundays, on average. Saturdays required half as many parcel lockers than Wednesdays, on average. The number of required lockers during the rest of the week was 1–18% smaller than for Wednesday. The required number of parcel lockers was the highest in December for any day of the week.

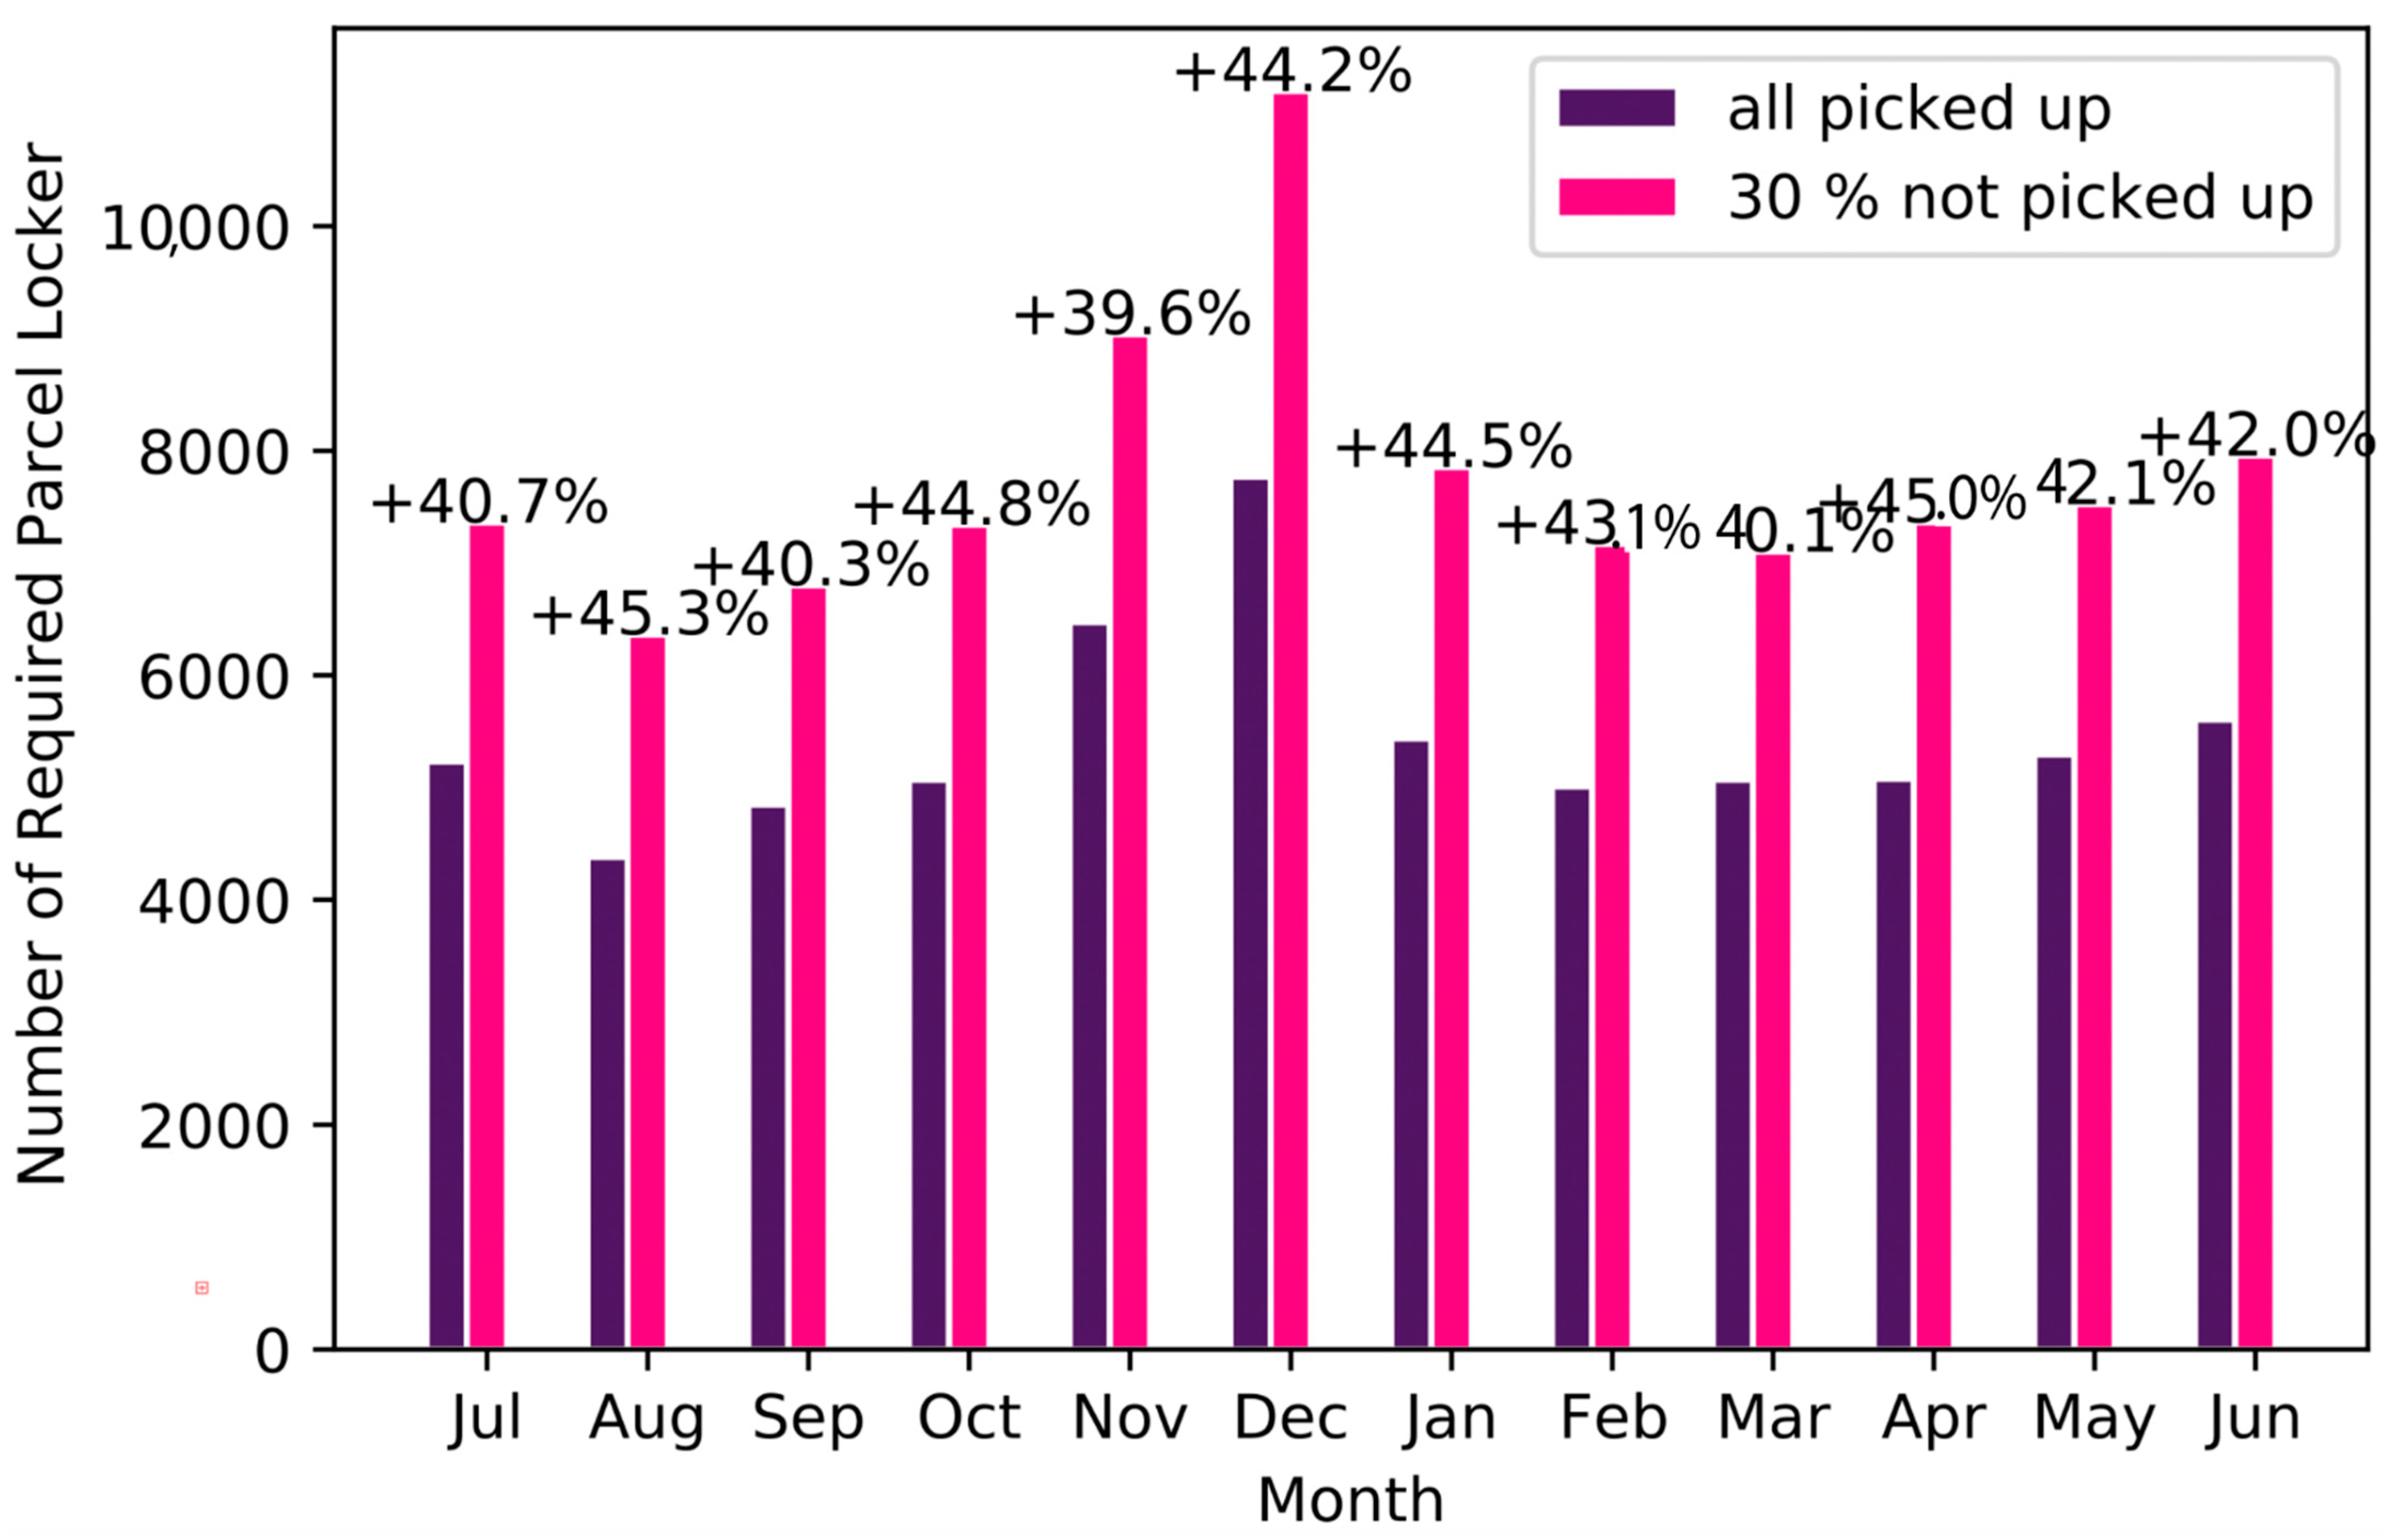
4.2. Total Number of Locker Spaces

Figure 7 shows the number of locker spaces required to satisfy the demand at varying numbers of percentiles from 80%–99.9%. It can be seen that around twice as many lockers were needed if the number of lockers had to be enough for all days compared with being enough for 80% of the days. As expected, the number of lockers required increased with the number of CDPs because of the randomness of the allocation of parcels to CDPs.
If the number of available locker spaces was smaller than the maximum number of required locker spaces on any day of the year, some parcels could not be delivered. If only the 99.9-percentile of the required number of parcel lockers was satisfied, less than 0.02% of the parcels cannot be delivered. For the 80-percentile, around 5–8% of all parcels could not be delivered (Figure 8).

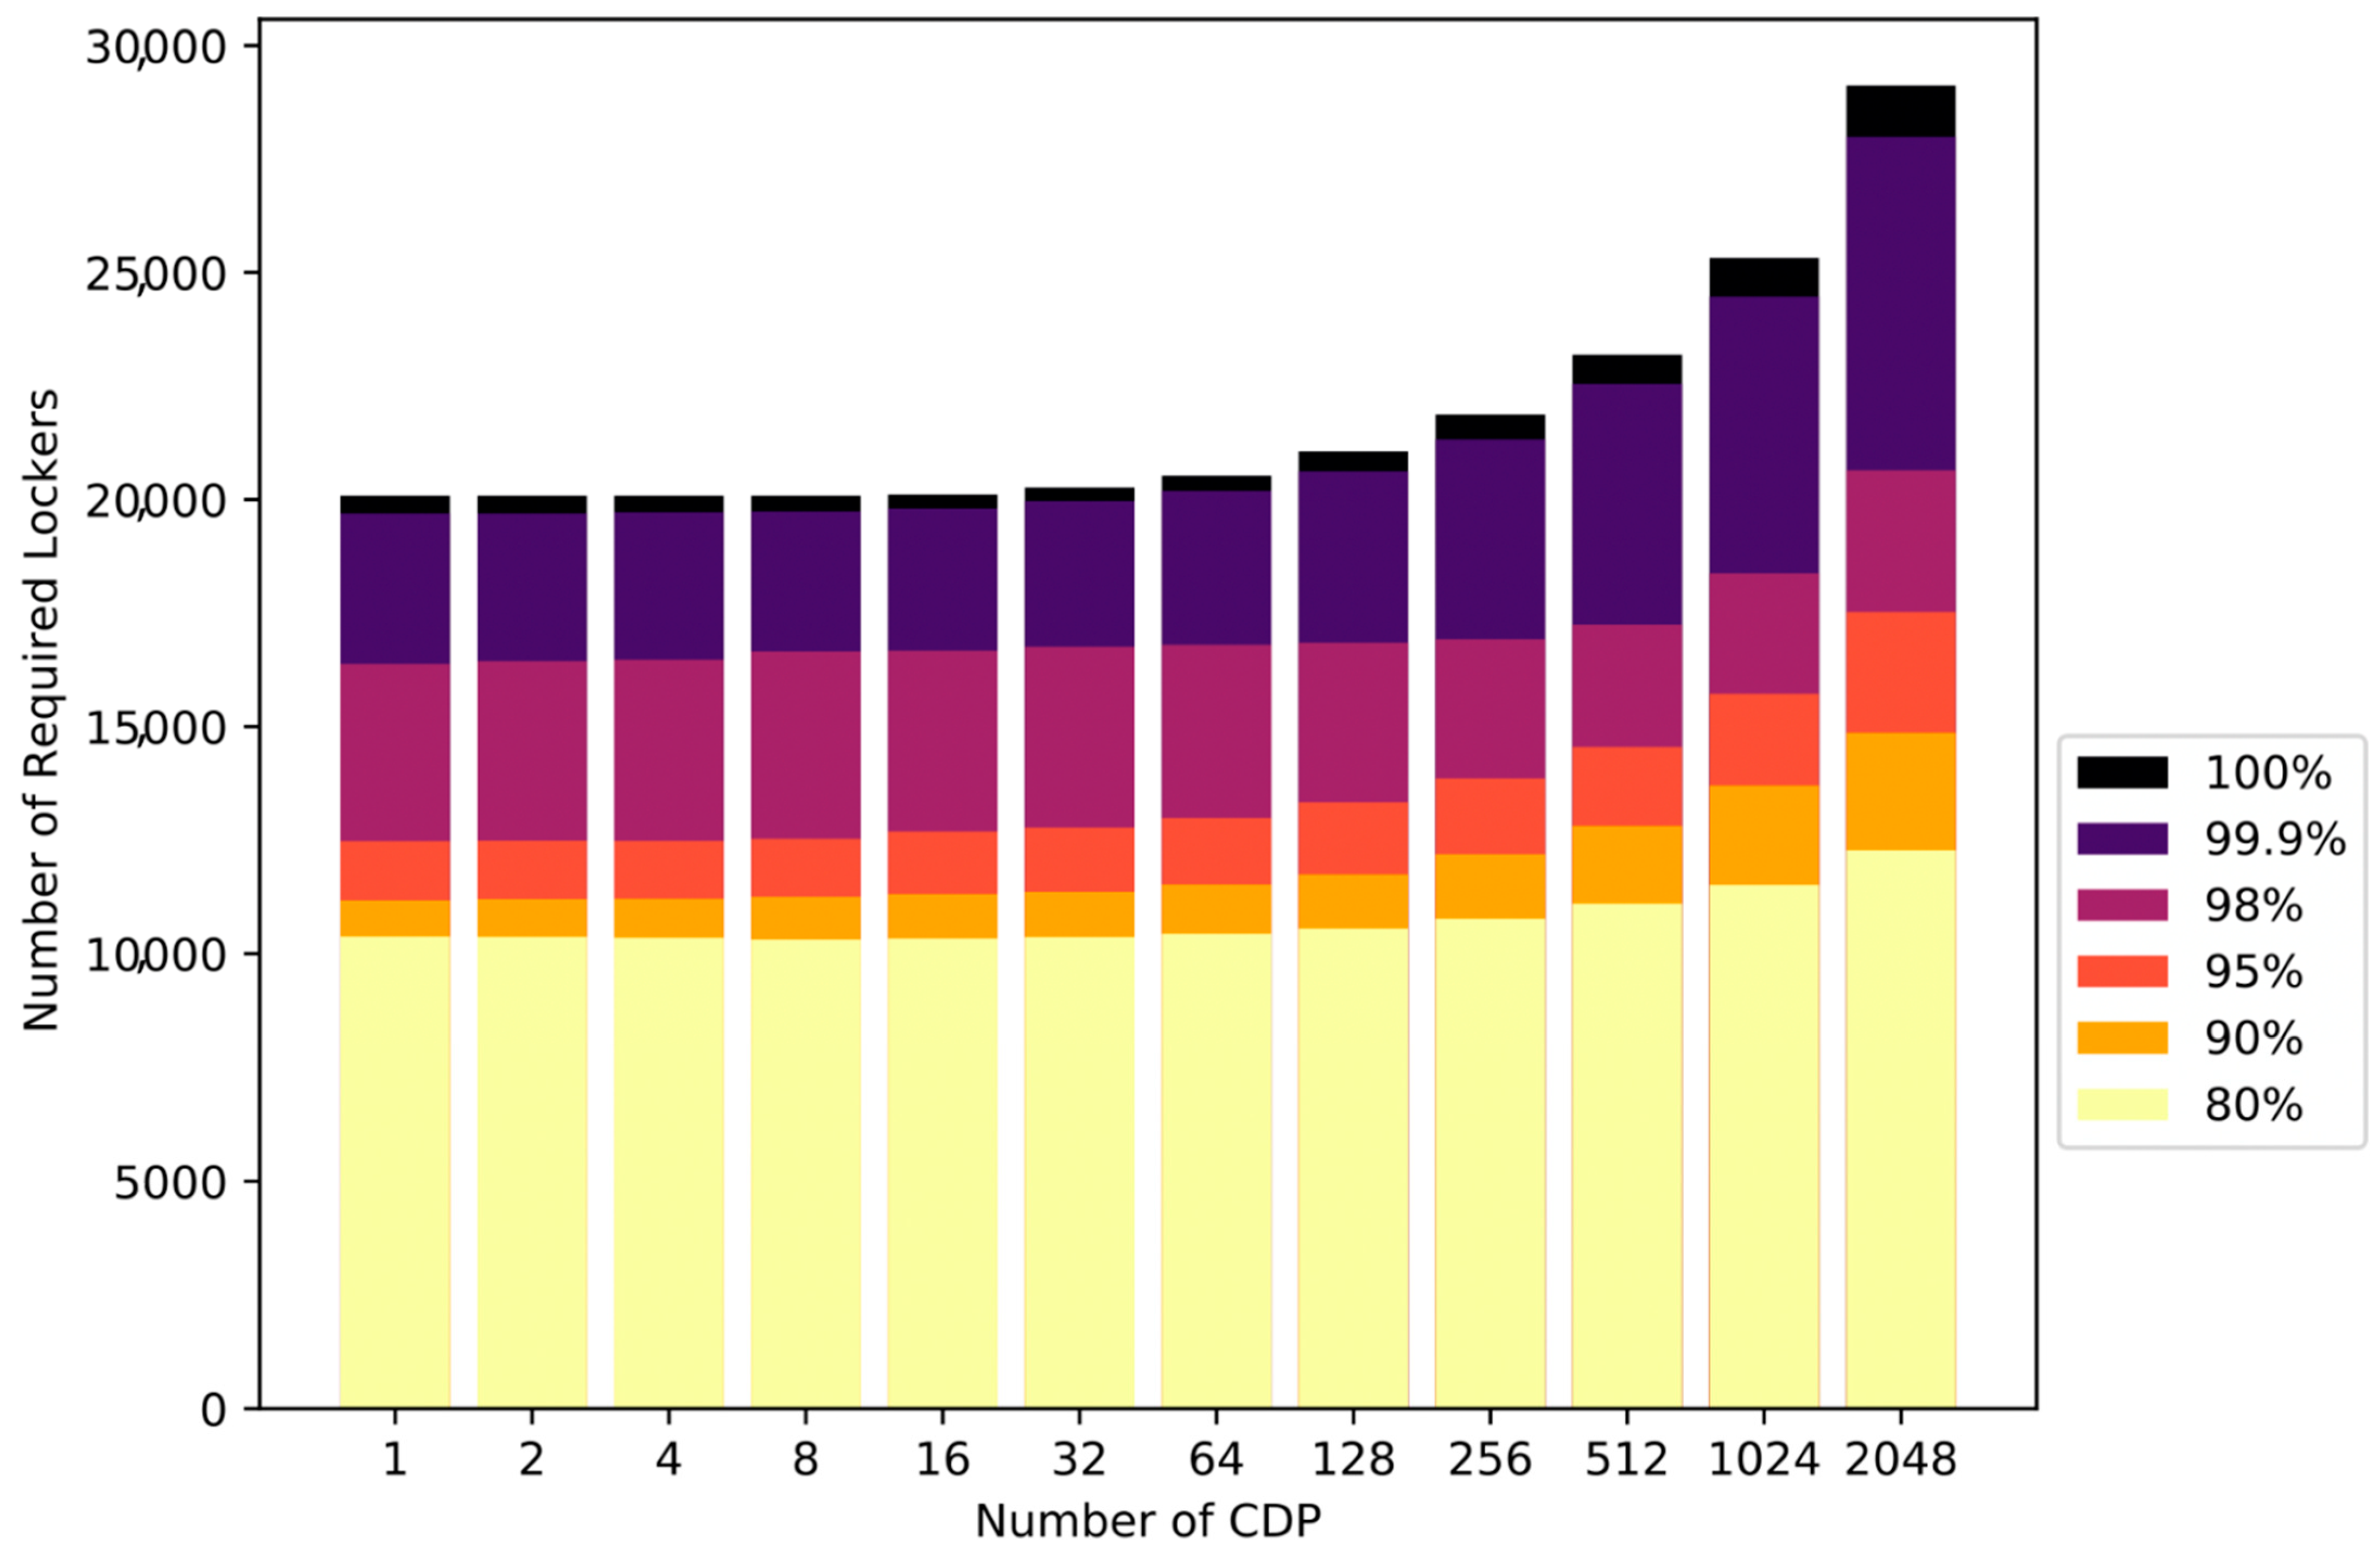
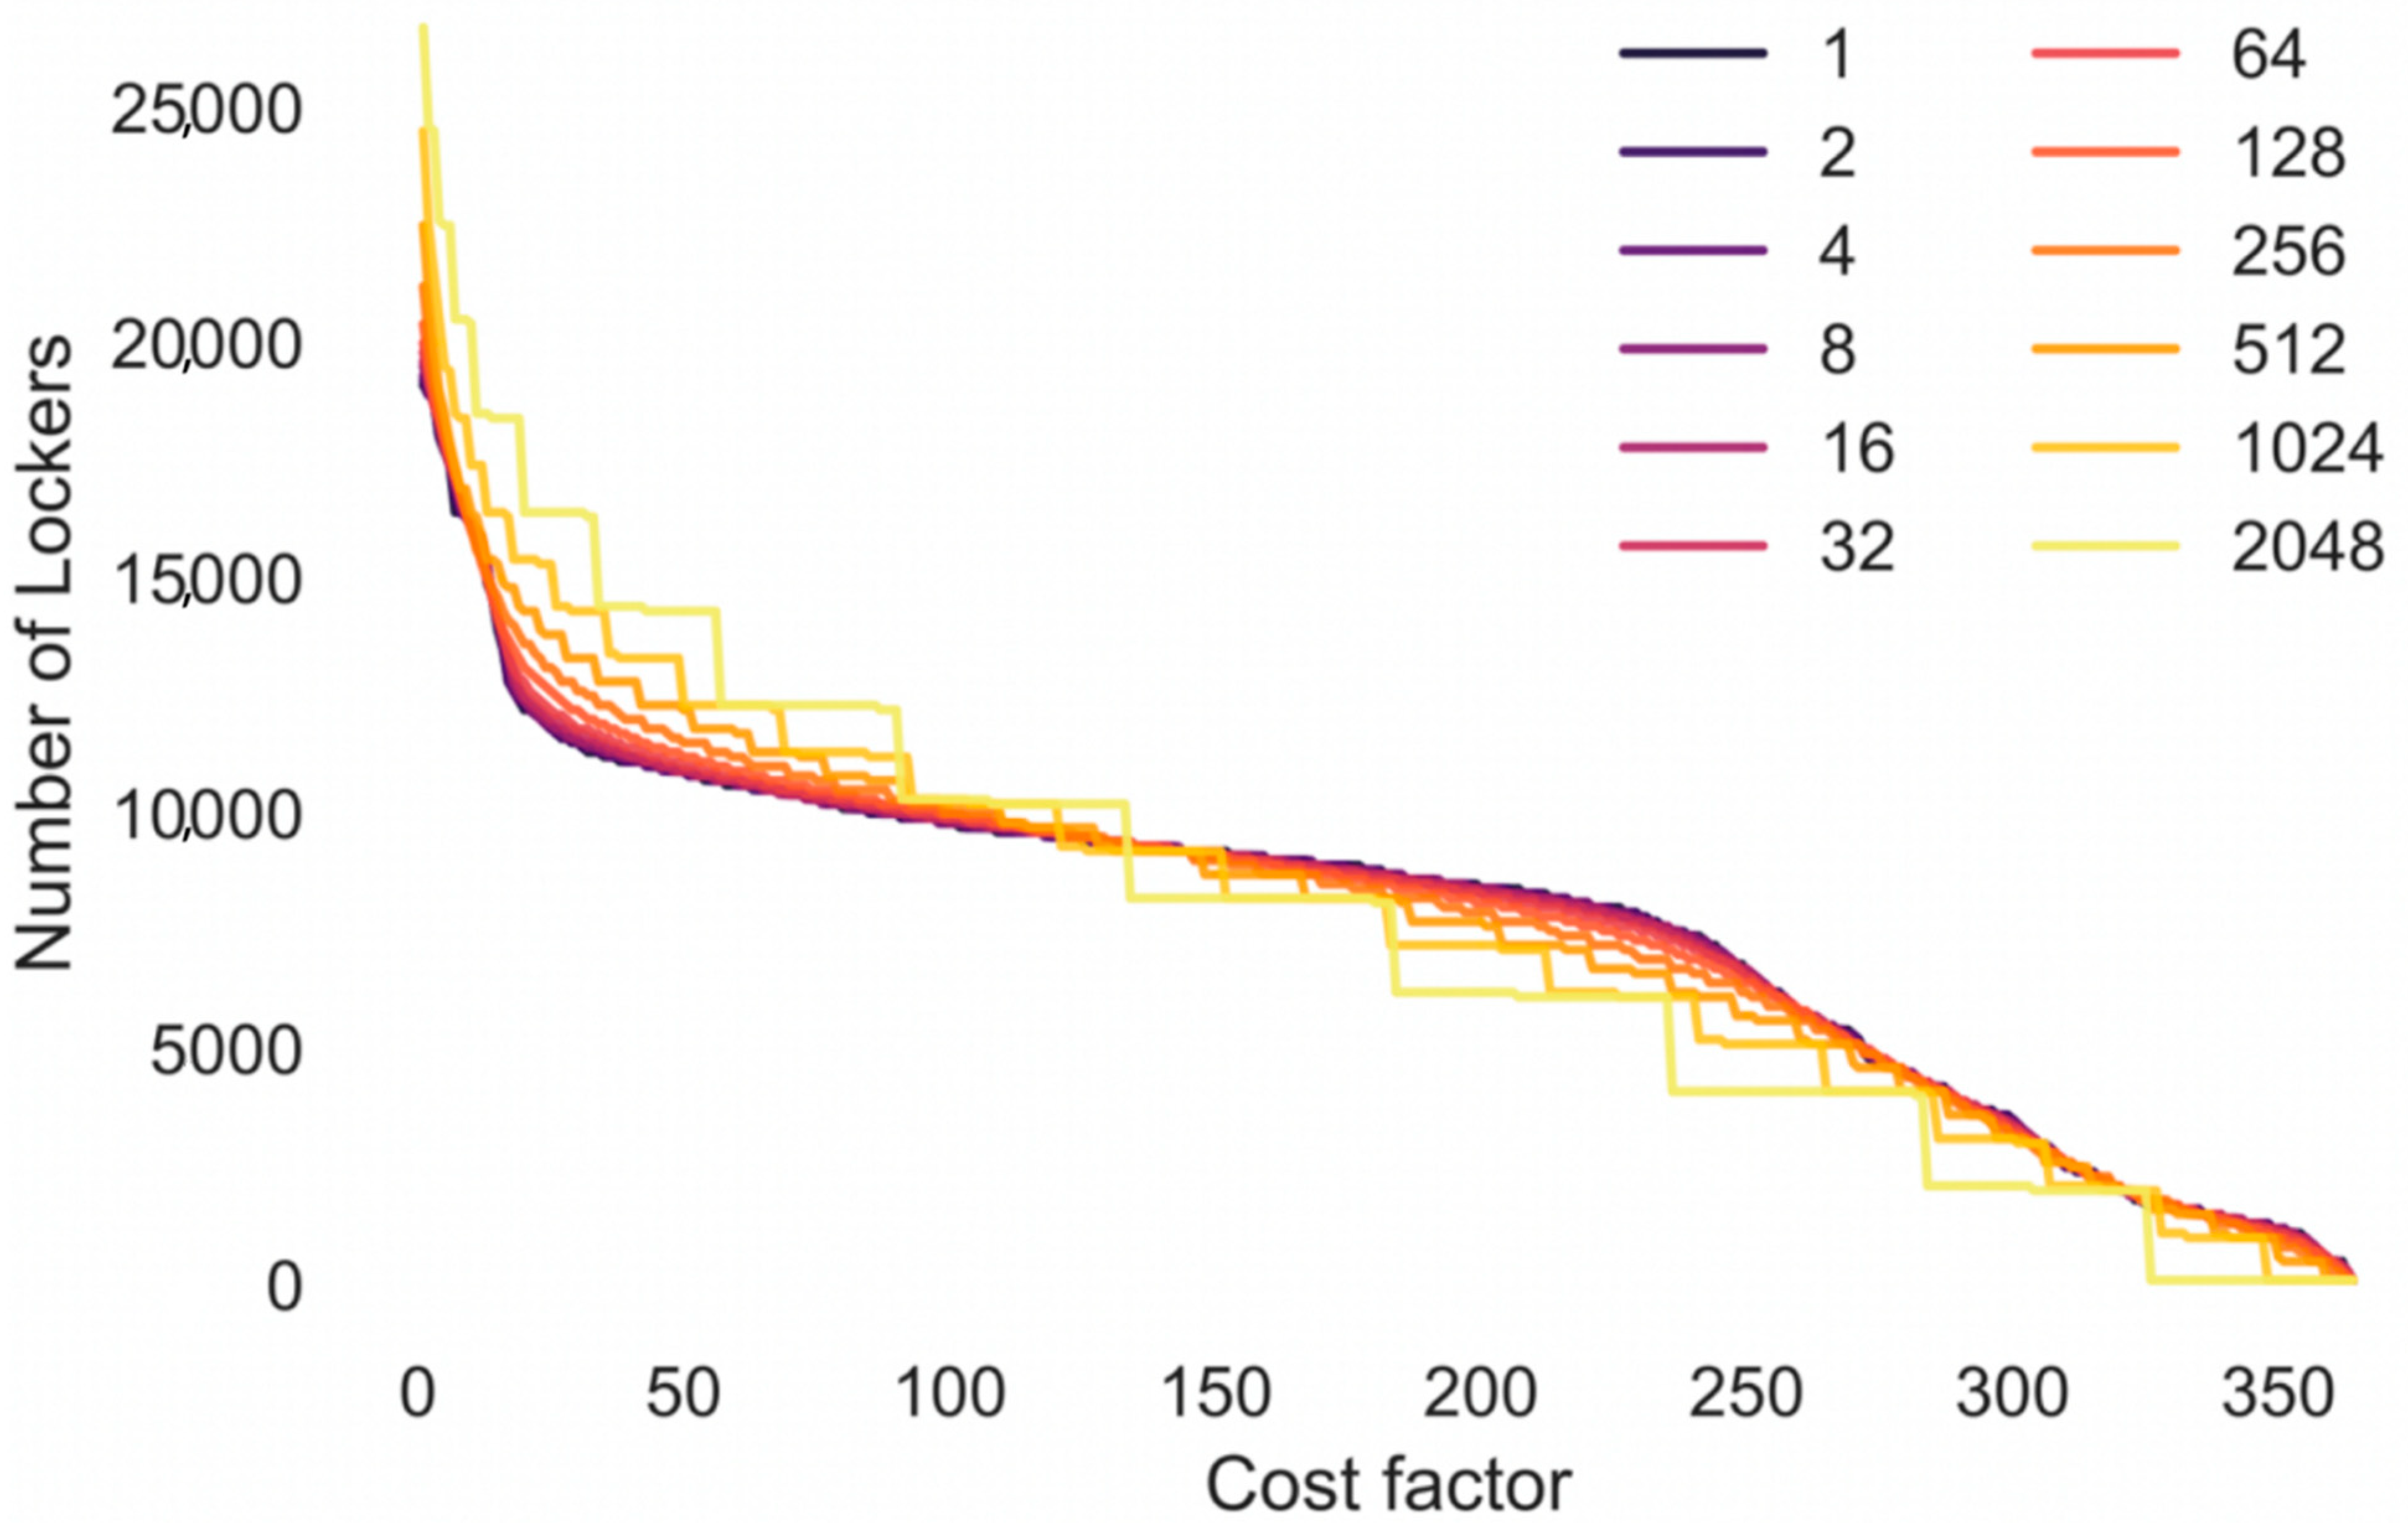
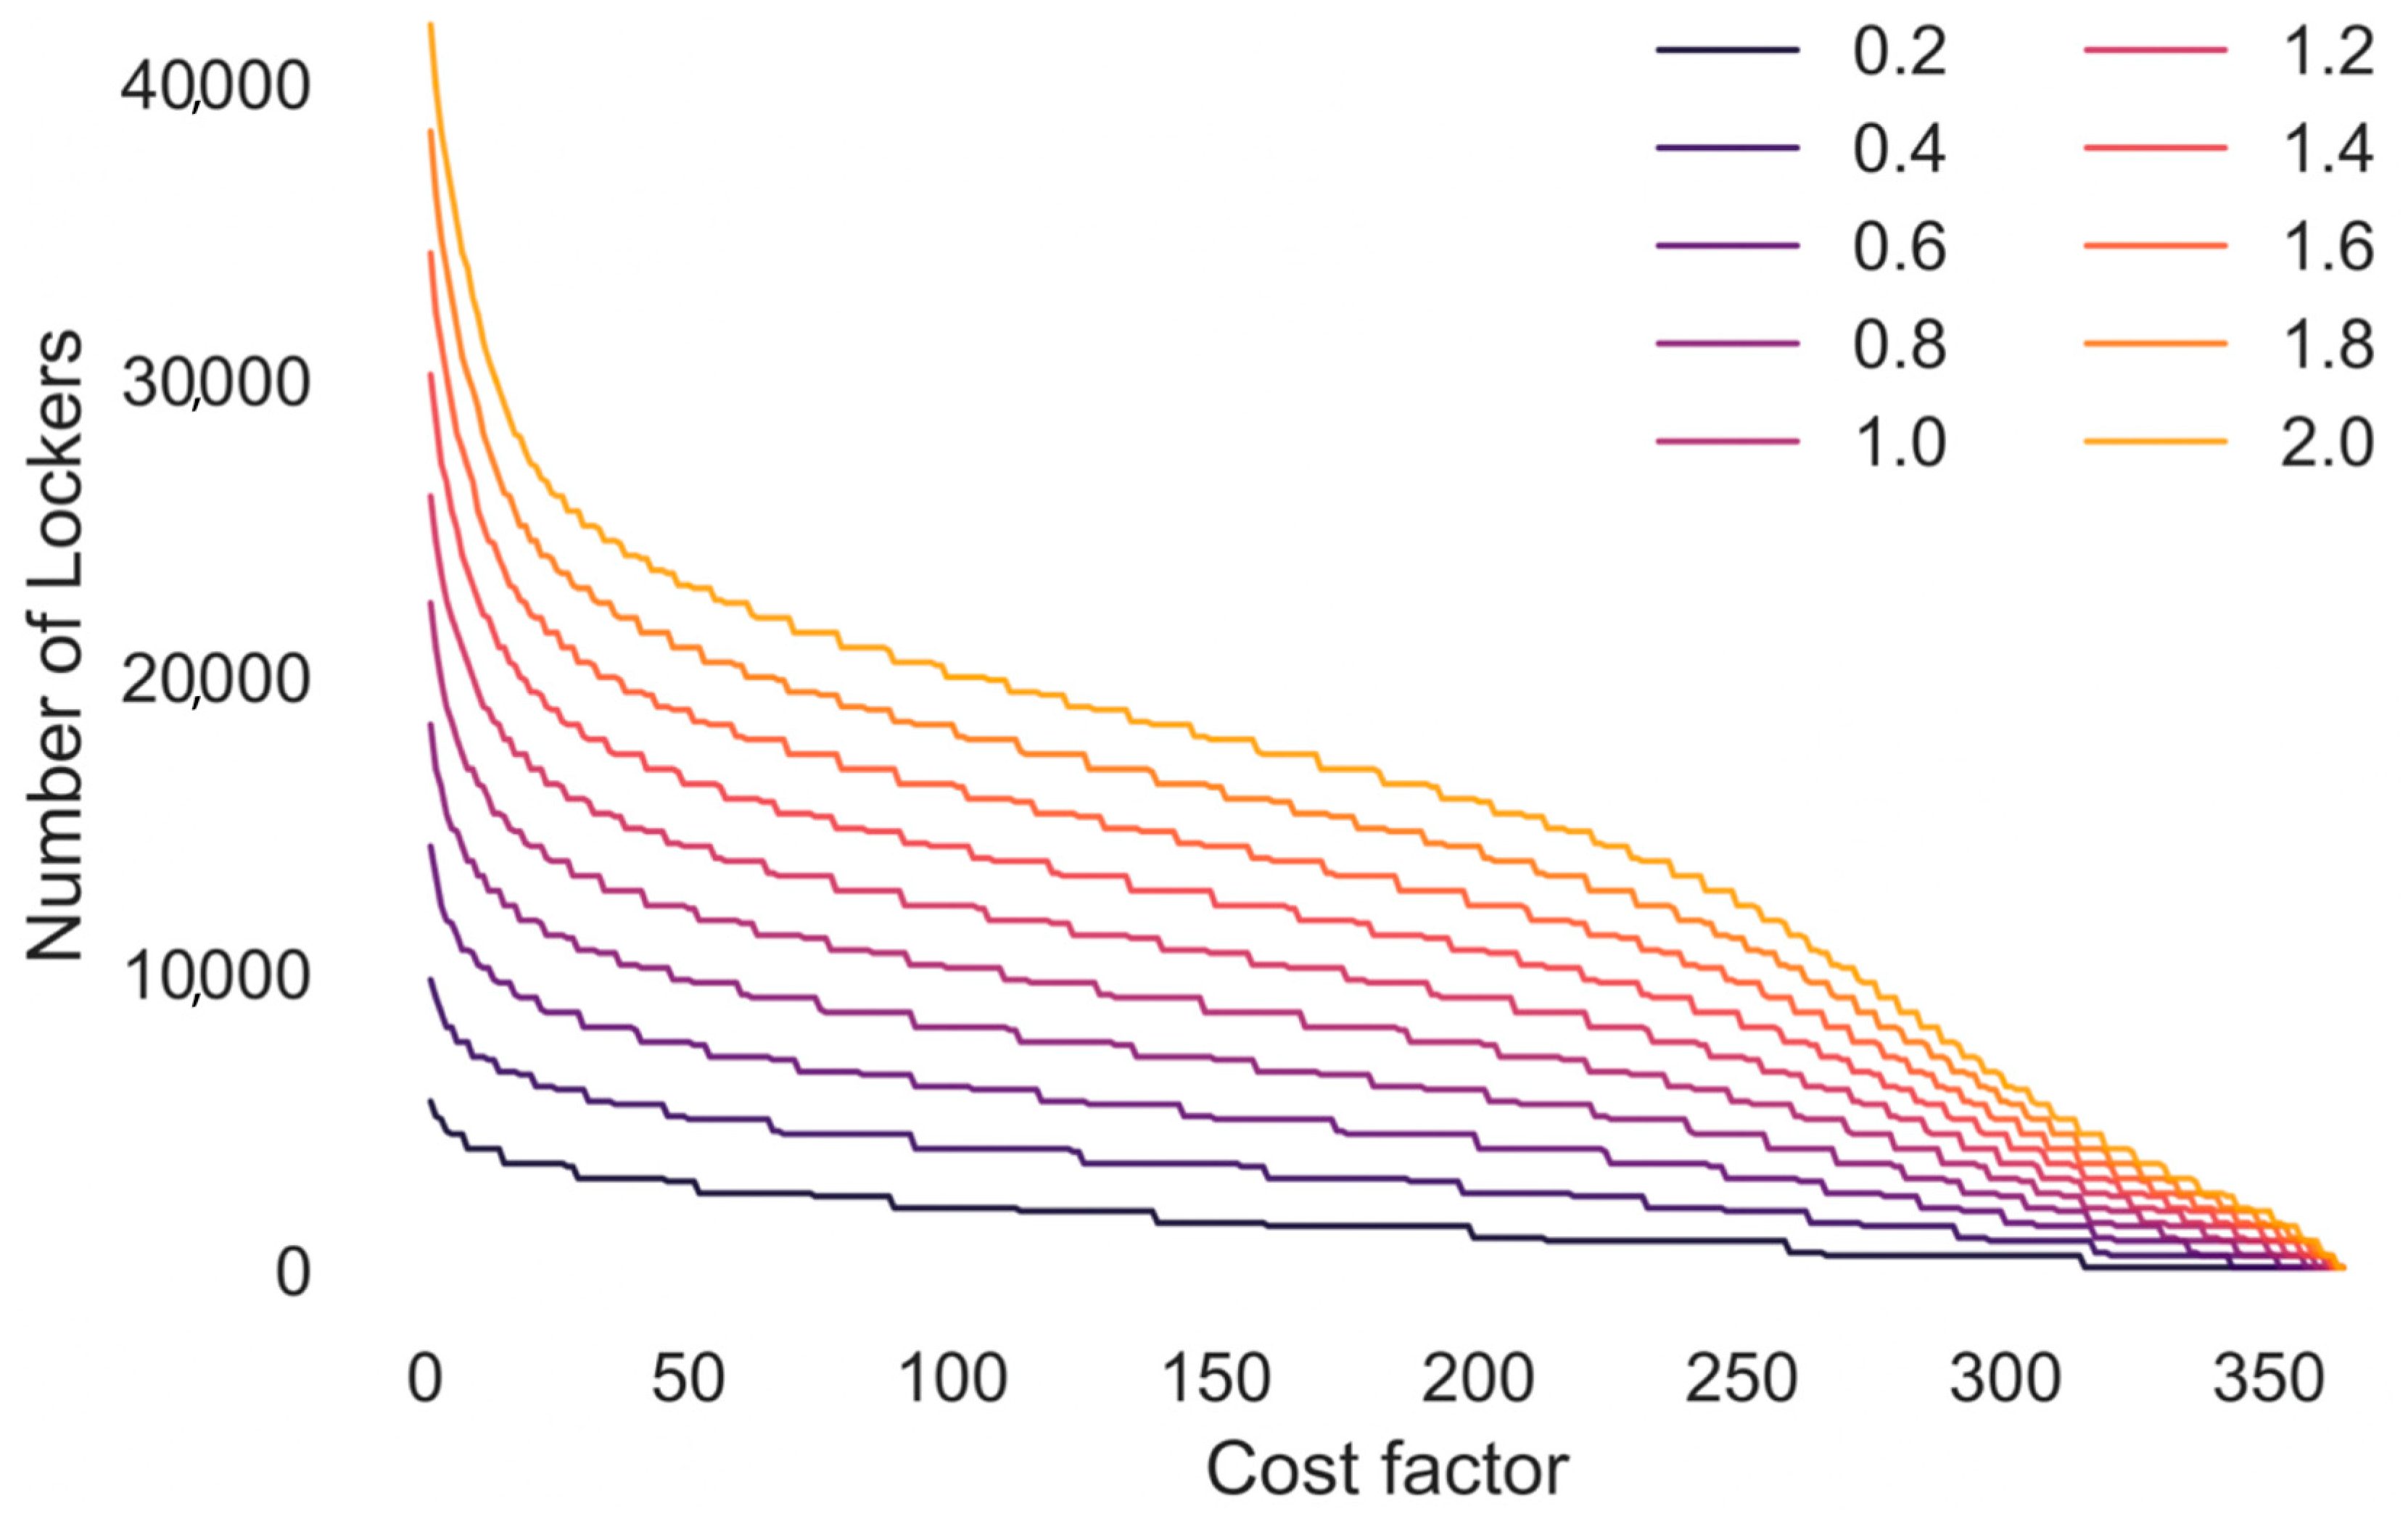
4.3. Optimal Number of Lockers

Locker utilization could be lower than 30% if a locker is available for every parcel, which reduced the financial viability of the business model. The following section is concerned with finding the optimal number of lockers and parcels being diverted to staffed CDP if no parcel locker is available. As illustrated in the Methods in Section 3, the cost factor c L N P V / c S N P V was used in the optimisation model instead of the exact cost.
The optimum number of parcel lockers changed slightly with the number of CDPs (Figure 9). When the cost factor was low, having fewer CDPs reduced the number of required lockers. The opposite applied when the cost factor was high.
To increase the sensitivity of the results, the optimal number of parcel lockers was estimated based on varying the number of parcels being delivered. The density represents a factor by which the number of parcels was multiplied to create multiple scenarios, where 1.0 represents 100% of the actual number of parcels delivered. A higher number represents more parcels being delivered and a lower number means less parcels being delivered. As expected, the graphs in Figure 10 show a similar trend to the graph in Figure 9.

4.4. Example Calculation

The example calculation illustrates how the decision support method developed in this simulation could be used. Based on private communication with a Russian parcel locker seller, it was concluded that the cost of adding a single locker to a CDP is around £85 per locker if 10–20 lockers together are added to a CDP. The computer used to operate the locker adds another £50 to the total cost. The operating cost was estimated to be £1 per locker per year, in line with the suggestions in [38]. In total, the cost per locker would be £99 in today’s monetary value, including the operating costs over 15 years and a discount rate of 1% (rate of return of the FTSE 100: 3% [34] minus CPI inflation: 2% [35]). If the fees paid to staffed CDP owners per parcel stayed constant at £0.50 [18], the average fee per parcel over the 15 years would be £0.47 in today’s monetary value. The resulting cost factor would be 212. The optimal number of lockers would be 7160 lockers based on the delivery data of the company used in this study and assuming 512 CDPs. If the operating cost per locker increased from £1 to £5.70 per locker per year, while all other costs stayed constant, all parcels should be sent to a staffed CDP. If the discount rate decreased to 0.75%, which is the interest rate set by the Bank of England in August 2019 [35], while all other variables stayed constant, the cost factor would decrease to 200, which increased the optimal number of lockers to 7562.

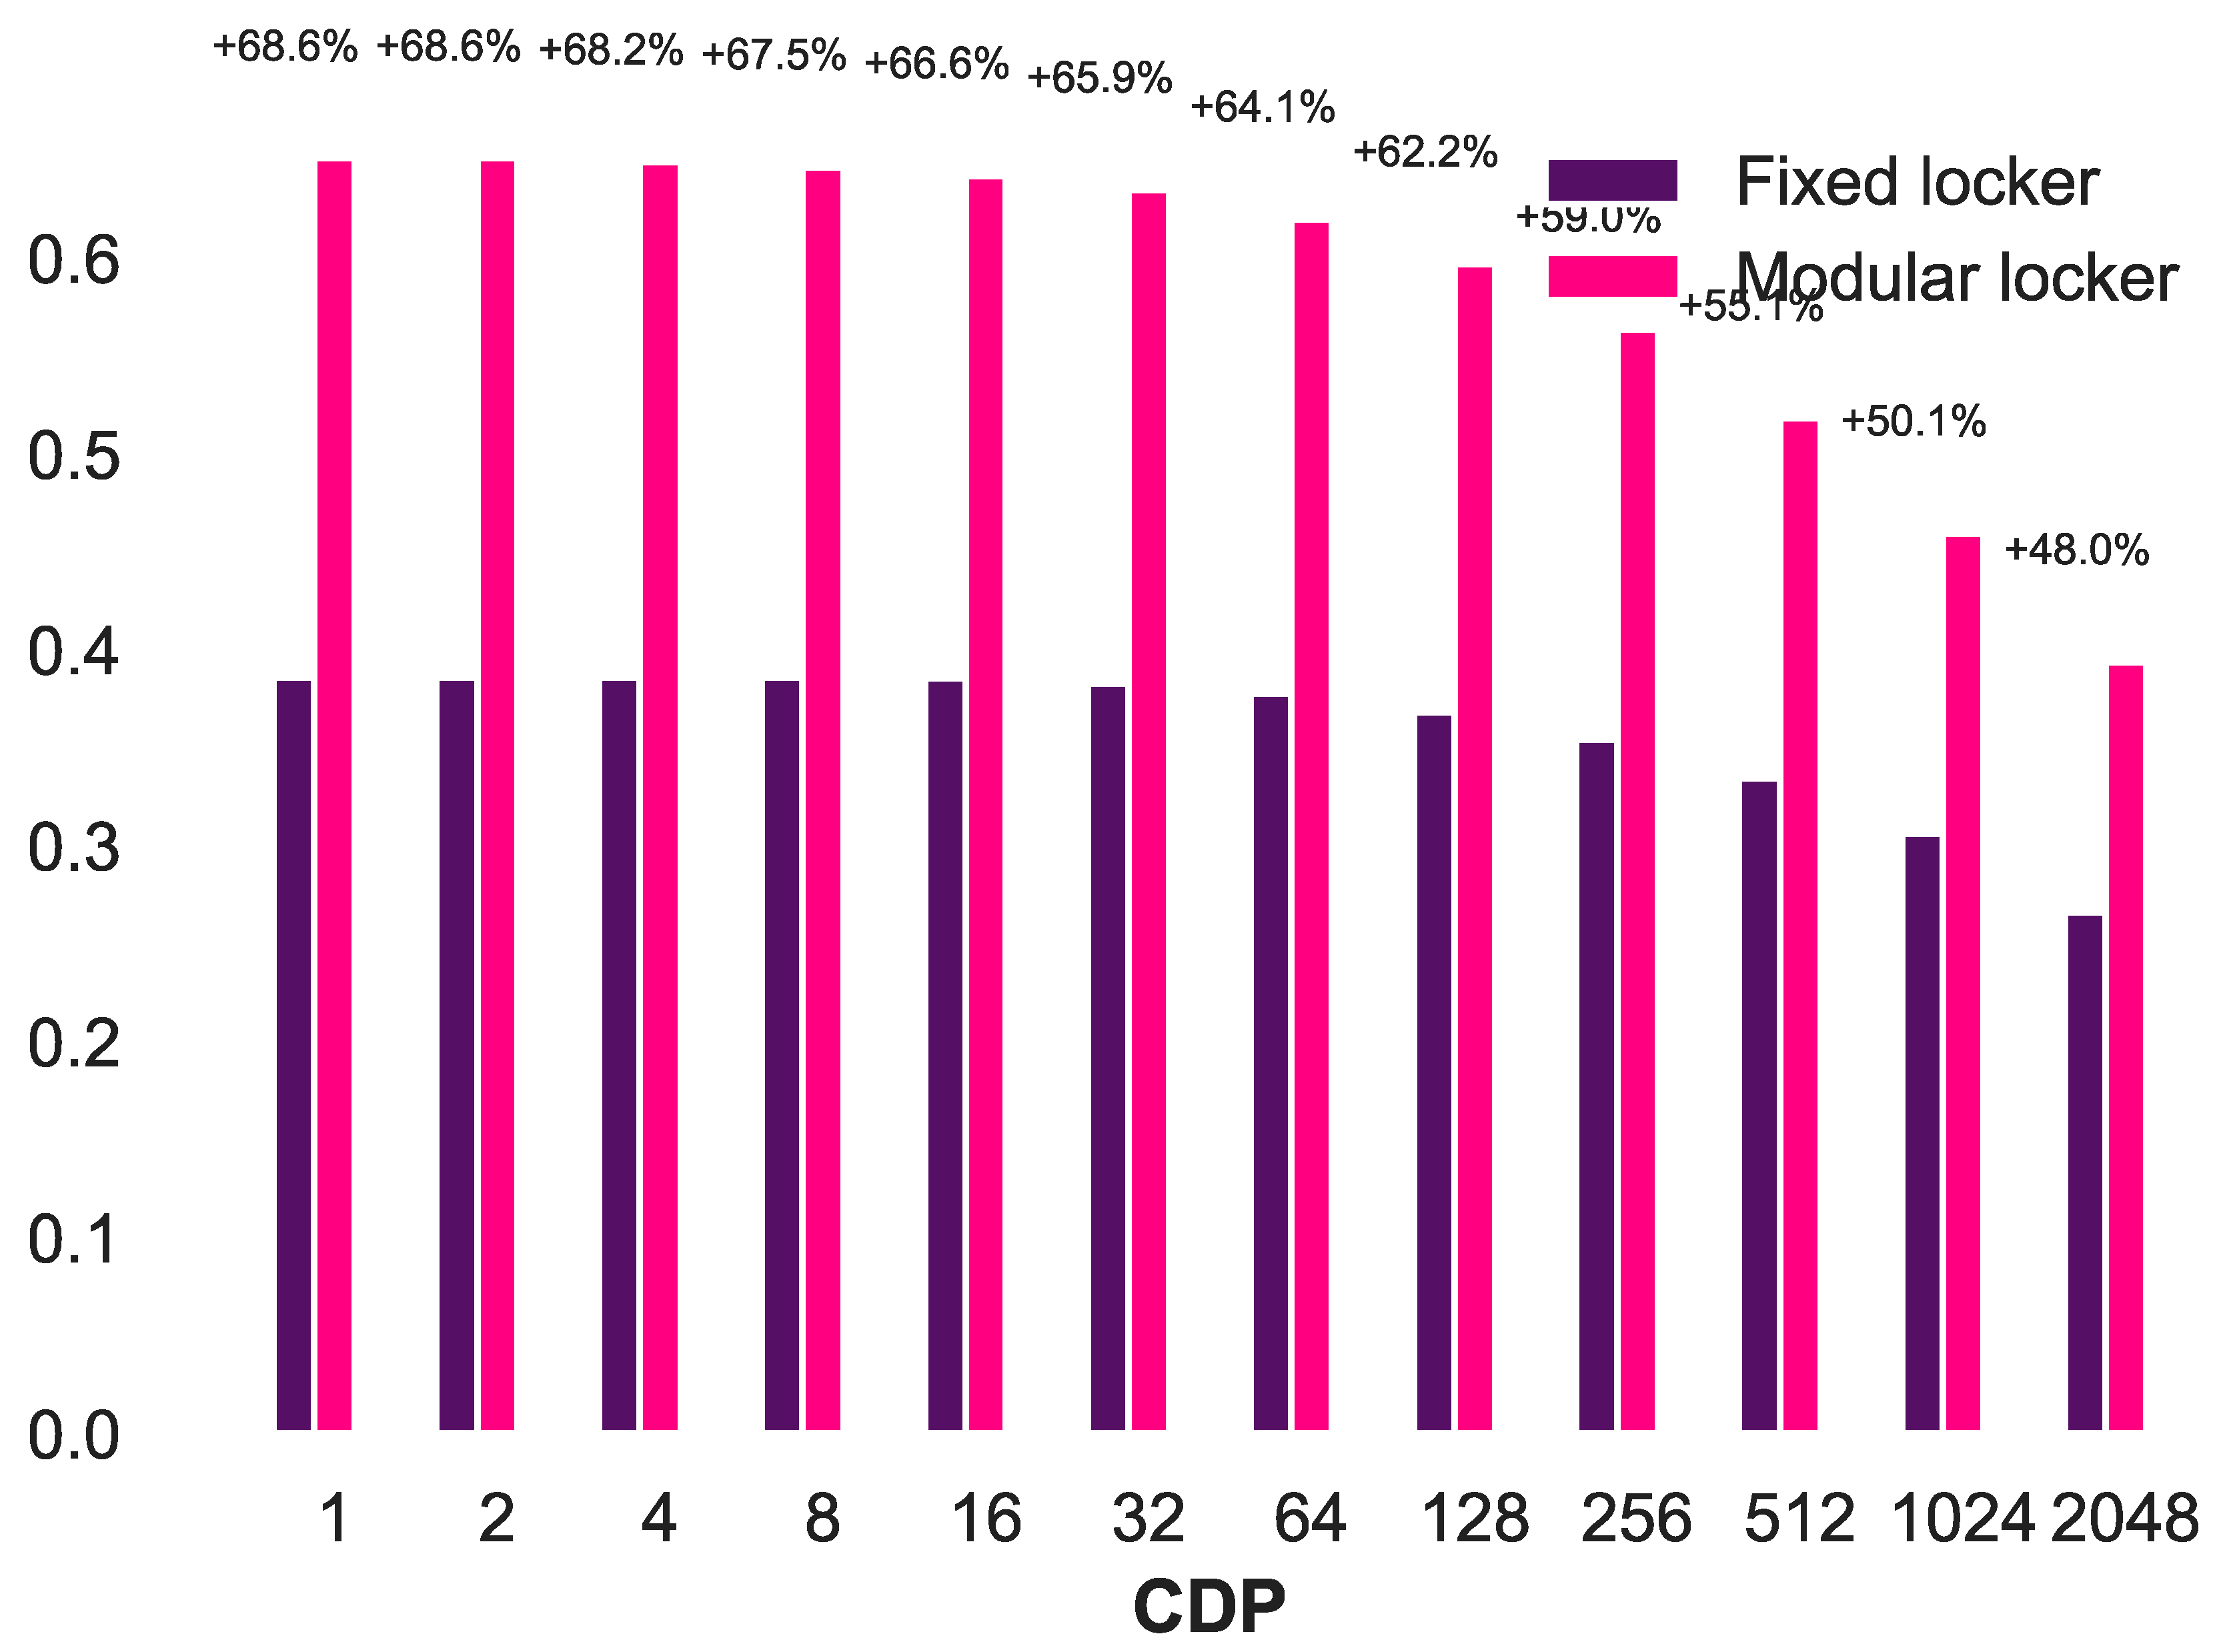
4.5. Modular Lockers vs. Fixed Lockers

Using modular lockers has been suggested in the literature as an option to improve the utilization of parcel lockers [25,26]. Modular lockers work like fixed lockers but the number of locker spaces are adjusted periodically depending on the demand. Hence, in the low demand season, only a few modular lockers spaces are available at each CDP, whereas in the high demand season, the number of modular locker spaces at a CDP is increased. While a comparison of modular and fixed lockers is not the goal of the study, both have been compared to highlight the limitation of modular lockers. Depending on the number of CDPs, the utilization of fixed parcel lockers ranged between 25% to 35% if all parcels were to be sent to fixed lockers.
If the number of lockers were to be adjusted on the first of every month (i.e., modular lockers; Figure 11), the utilization would range from 65.3% for networks with 1 CDP to 39.4% for networks with 2048 CDPs. Even though it may be possible to increase the utilization by changing the frequency and time point when modular lockers are adjusted, the utilization is always limited by the fact that the parcel demand varies considerably depending on the day of the week, and adjusting modular lockers daily would defeat its purpose.
If only 3% of all parcels were handled by staff at CDPs while all other parcels would be placed in fixed lockers at these staffed CDPs, the average utilization would range from 62.2% for networks with 1 CDP to 44.2% for networks with 2048 CDPs. In short, combining staffed CDPs with lockers at the same location has a larger potential to increase the utilization.
When comparing the cost of modular lockers and the combination of fixed lockers and staffed CDPs, it is questionable whether modular lockers offer a financial benefit (Table 1). A delivery company has to buy enough modular lockers for the high demand season, whereas a company combining fixed lockers with staffed CDPs only needs to buy enough lockers for the medium demand season, as undeliverable parcels are diverted to staffed CDPs. Modular lockers might also be more expensive because of the docking mechanism. In addition, the land rent at CDPs might not be reduced for modular lockers compared with fixed lockers. During the high demand season, the cost of land rent at a CDP would be higher for modular lockers than for fixed lockers and staffed CDPs because of more modular lockers being installed. During the low demand season, the land rent at CDPs could be lower for modular lockers. However, the rent might not be reduced (i) if there is no alternative usage for the land during the low demand season or (ii) the number of required modular lockers is never less than the number of fixed lockers. Modular lockers require storage space and transport cost, while fixed lockers and staffed CDPs require a fee paid to staffed CDPs.
Based on the parcel delivery data used in this study, it is unlikely that it will be cheaper for a delivery company to invest in modular lockers compared with fixed lockers and staffed CDPs. The following example compares modular lockers with fixed lockers deployed at a level to satisfy 95% of all days (i.e., 3% of the parcels sent to staffed CDPs). A delivery company could either buy 20,088 (1 CDP)–29,125 (2048 CDPs) modular lockers, or 12,475 (1 CDP)–17,525 (2048 CDPs) fixed parcel lockers and pay around £0.50 per parcel [18] to staffed CDPs. As stated earlier, the cost of adding a single locker to a CDP is around £85 per locker if 10–20 lockers are added to the same CDP. If modular lockers cost the same as fixed lockers, a company using modular lockers would require around a £656,114 (1 CDP)–£992,016 (2048 CDPs) higher investment than the company using fixed lockers. In this case study, the decrease in land rent during the low demand season for modular lockers is outweighed by the increase in land rent during the high demand season for modular lockers. Over one-year, networks with 1 CDP require around 3% less rent if using modular lockers, while networks with 2048 CDPs require 12% more rent when using modular lockers compared with combining fixed lockers and staffed CDPs. This means that modular lockers require overall a similar or a higher land rent than fixed lockers and staffed CDPs in this case study.
When only considering the cost to buy the lockers and the fee paid to staffed CDPs, it is less expensive to use fixed lockers and staffed CDPs if the lockers last for up to 20 years in a network with 1 CDP and 48 years in a network with 2048 CDPs, considering a discount rate of 1% (rate of return of the FTSE 100: 3% [34] minus CPI inflation: 2% [35]). When the discount rate is decreased to 0.75%, which is the interest rate set by the Bank of England in August 2019 [35], a system with modular lockers and 1 CDP would only be less expensive if the lockers last for more than 19 years. A system with modular lockers at 2048 CDPs will need to last more than 45 years to be less expensive than sending parcels to staffed CDPs. Even without considering the costs, modular locker operators have to pay extra (i.e., storage space for unused lockers, transport of lockers, and increased land rent), and the modular lockers do not offer any financial advantage in this case study compared with combining fixed lockers and staffed CDPs.

5. Suggestions for Future Work and Limitations

The study only considered the impact of adjusting the numbers of modular lockers at the beginning of each month. It would be beneficial to compare the daily, quarterly, or half year adjustments or on-demand adjustment strategies. In addition, the study should be repeated with delivery data from other companies to determine in which cases modular lockers offer a financial advantage over fixed lockers and staffed CDPs for different company profiles. It would also be interesting to evaluate how a consideration of the size of parcels changes the results. A follow up study could also include the customer preferences for a specific delivery type. Staffed CDPs are usually not open 24/7. Hence, some customers might prefer parcel lockers. Others might prefer to pick up a parcel from a human and are uncomfortable interacting with an automated parcel locker. Plenty of studies focusing on the optimization of the location of CDP have been published [27,28]. It would be interesting to combine these with the optimization problem proposed in this paper. Note: In this paper, the location of parcel lockers is fixed.

6. Conclusions

Open innovation is increasingly popular with large companies around the world [39]. By applying a real data-driven approach [40] to reduce the cost of parcel delivery, this paper highlights the advantages of open innovation. Open innovation refers to the share and use of external knowledge, for instance, information, abilities, and methodologies [41], to accelerate the innovation process [42]. In this sense, the paper uses open source data (e.g., delivery trip data and other statistics) and open source software (e.g., Python and QGIS) to develop a decision support method focused on reducing the cost of last mile delivery without reducing the service level. This highlights the benefits of open innovation—if the delivery company had not published the delivery trip data, the authors could not have developed or applied the decision support method. The same applies to the software used in this project.
The paper contributes to the research by developing a decision support method that determines the optimal number of lockers at a staffed CDP. All of the parcels are preferably delivered to parcel lockers, and undeliverable parcels due to the lockers being full are placed in staffed CDPs. Determining a fixed optimal number of lockers is difficult because of the variable demand for parcel lockers caused by seasonal fluctuations and variation between weekdays and weekends. Modular parcel lockers have been proposed as a solution for this problem. However, based on the case study, which uses real parcel delivery trip data in London over one year, it is unlikely that modular lockers offer a financial benefit compared with combining parcel lockers with staffed CDPs. Therefore, the study concludes that a combination of parcel lockers and CDPs might be the better option from a financial viewpoint. In this case study, a parcel locker network with fixed lockers and 3% of the parcels being sent to staffed CDPs results in a similar utilization to a modular locker that is adjusted at the beginning of each month. In addition, a modular locker network would require 1.6 times as many lockers as the combined fixed locker and staffed CDPs network alternative. Combining parcel lockers with staffed CDPs allows delivery companies to take advantage of the low investment cost of staffed CDPs and the low cost per parcel of parcel lockers.
The paper proposes a decision support method to estimate the optimal number of parcel lockers based on the cost of parcel lockers versus sending a parcel to a CDP, the number of CDPs, future variations of parcel demand, and changes in discount rate. The decision support method has been applied to the parcel delivery data of a company in London.

Author Contributions

Conceptualization, M.S.; data curation, M.S.; formal analysis, M.S.; funding acquisition, A.W.; investigation, M.S.; methodology, M.S.; resources, A.W.; software, M.S.; supervision, C.H. and A.W.; validation, M.S., C.H. and A.W.; visualization, M.S.; writing—original draft, M.S.; writing—review and editing, M.S., C.H. and A.W. All authors have read and agreed to the published version of the manuscript.

Funding

The authors gratefully acknowledge the financial support of the Engineering and Physical Sciences Research Council (EPSRC) Centre for Doctoral Training in Embedded Intelligence under grant reference EP/L014998/1, and the Ford Motor Company for their support and input into this research.

Institutional Review Board Statement

Not applicable.

Informed Consent Statement

Not applicable.

Data Availability Statement

Map data copyrighted OpenStreetMap contributors and available from https://www.openstreetmap.org (accessed on 3 August 2021). Parcel delivery data provided under the Open Government Licence v3.0 maintained by Greater London Authority online available on: https://data.london.gov.uk/dataset/key-performance-indicators-of-demonstrator-freight-delivery-performance-with-electric-vans-in-central-london (accessed on 3 February 2020).

Acknowledgments

Map data copyrighted OpenStreetMap contributors and available from https://www.openstreetmap.org (accessed on 5 February 2020).

Conflicts of Interest

The authors declare no conflict of interest.

References

  1. Saad, S.M.; Bahadori, R. Sustainability evaluation of last mile food delivery: Pickup point using lockers versus home delivery. In Proceedings of the International Food Operations and Processing Simulation Workshop (FoodOPS 2018), Budapest, Hungary, 17–19 September 2018; pp. 37–42. [Google Scholar]
  2. Carotenuto, P.; Gastaldi, M.; Giordani, S.; Rossi, R.; Rabachin, A.; Salvatore, A. Comparison of various urban distribution systems supporting e-commerce. Point-to-point vs collection-point-based deliveries. Transp. Res. Procedia 2018, 30, 188–196. [Google Scholar] [CrossRef]
  3. Liu, C.; Wang, Q.; Susilo, Y.O. Assessing the impacts of collection-delivery points to individual’s activity-travel patterns: A greener last mile alternative? Transp. Res. Part E Logist. Transp. Rev. 2019, 121, 84–99. [Google Scholar] [CrossRef]
  4. Weiss, C.; Onnen-Weber, U. The challenge of sustainable last mile distribution of CEP services in small towns. Transp. Res. Procedia 2019, 39, 597–604. [Google Scholar] [CrossRef]
  5. Ulmer, M.W.; Streng, S. Same-Day delivery with pickup stations and autonomous vehicles. Comput. Oper. Res. 2019, 108, 1–19. [Google Scholar] [CrossRef]
  6. Yuen, K.F.; Wang, X.; Ng, L.T.W.; Wong, Y.D. An investigation of customers’ intention to use self-collection services for last-mile delivery. Transp. Policy 2018, 66, 1–8. [Google Scholar] [CrossRef]
  7. Iwan, S.; Kijewska, K.; Lemke, J. Analysis of Parcel Lockers’ Efficiency as the Last Mile Delivery Solution—The Results of the Research in Poland. Transp. Res. Procedia 2016, 12, 644–655. [Google Scholar] [CrossRef] [Green Version]
  8. Lemke, J.; Iwan, S.; Korczak, J. Usability of the Parcel Lockers from the Customer Perspective—The Research in Polish Cities. Transp. Res. Procedia 2016, 16, 272–287. [Google Scholar] [CrossRef] [Green Version]
  9. de Oliveira, L.K.; Morganti, E.; Dablanc, L.; de Oliveira, R.L.M. Analysis of the potential demand of automated delivery stations for e-commerce deliveries in Belo Horizonte, Brazil. Res. Transp. Econ. 2017, 65, 34–43. [Google Scholar] [CrossRef] [Green Version]
  10. Kedia, A.; Kusumastuti, D.; Nicholson, A. Acceptability of collection and delivery points from consumers’ perspective: A qualitative case study of Christchurch city. Case Stud. Transp. Policy 2017, 5, 587–595. [Google Scholar] [CrossRef]
  11. Morganti, E.; Seidel, S.; Blanquart, C.; Dablanc, L.; Lenz, B. The Impact of E-commerce on Final Deliveries: Alternative Parcel Delivery Services in France and Germany. Transp. Res. Procedia 2014, 4, 178–190. [Google Scholar] [CrossRef] [Green Version]
  12. Wu, H.; Shao, D.; Ng, W.S. Locating self-collection points for last-mile logistics using public transport data. In Advances in Knowledge Discovery and Data Mining. PAKDD 2015; Cao, T., Lim, E.P., Zhou, Z.H., Ho, T.B., Cheung, D., Motoda, H., Eds.; Lecture Notes in Computer Science; Springer: Cham, Switzerland, 2015; Volume 9077, pp. 498–510. [Google Scholar] [CrossRef]
  13. Faugère, L.; Montreuil, B. Hyperconnected Pickup & Delivery Locker Networks. In Proceedings of the 4th International Physical Internet Conference, Graz, Austria, 4–6 July 2017; Volume 6, pp. 1–14. [Google Scholar]
  14. Yuen, K.F.; Wang, X.; Ma, F.; Wong, Y.D. The determinants of customers’ intention to use smart lockers for last-mile deliveries. J. Retail. Consum. Serv. 2019, 49, 316–326. [Google Scholar] [CrossRef]
  15. Lachapelle, U.; Burke, M.; Brotherton, A.; Leung, A. Parcel locker systems in a car dominant city: Location, characterisation and potential impacts on city planning and consumer travel access. J. Transp. Geogr. 2018, 71, 1–14. [Google Scholar] [CrossRef]
  16. Zenezini, G.; Lagorio, A.; Pinto, R.; de Marco, A.; Golini, R. The Collection-And-Delivery Points Implementation Process from the Courier, Express and Parcel Operator’s Perspective. IFAC-PapersOnLine 2018, 51, 594–599. [Google Scholar] [CrossRef]
  17. Edwards, J.; McKinnon, A.; Cherrett, T.; McLeod, F.; Song, L. The impact of failed home deliveries on carbon emissions: Are collection/delivery points environmentally-friendly alternatives? In Proceedings of the 14th Annual Logistics Research Network Conference, Cardiff, UK, 9–11 November 2009; p. M117. [Google Scholar]
  18. Moroz, M.; Polkowski, Z. The Last Mile Issue and Urban Logistics: Choosing Parcel Machines in the Context of the Ecological Attitudes of the Y Generation Consumers Purchasing Online. Transp. Res. Procedia 2016, 16, 378–393. [Google Scholar] [CrossRef] [Green Version]
  19. Punakivi, M.; Tanskanen, K. Increasing the cost efficiency of e-fulfilment using shared reception boxes. Int. J. Retail Distrib. Manag. 2002, 30, 498–507. [Google Scholar] [CrossRef] [Green Version]
  20. Song, L.; Cherrett, T.; McLeod, F.; Guan, W. Addressing the last mile problem: Transport impacts of collection and delivery points. Transp. Res. Rec. 2009, 2097, 9–18. [Google Scholar] [CrossRef] [Green Version]
  21. Jiang, L.; Chang, H.; Zhao, S.; Dong, J.; Lu, W. A Travelling Salesman Problem with Carbon Emission Reduction in the Last Mile Delivery. IEEE Access 2019, 7, 61620–61627. [Google Scholar] [CrossRef]
  22. Faugere, L.; Montreuil, B. Hyperconnected City Logistics: Smart Lockers Terminals & Last Mile Delivery Networks. In Proceedings of the 3rd International Physical Internet Conference, Atlanta, GA, USA, 29 June–1 July 2016; Volume 29. [Google Scholar]
  23. Vakulenko, Y.; Hellström, D.; Hjort, K. What’s in the parcel locker? Exploring customer value in e-commerce last mile delivery. J. Bus. Res. 2018, 88, 421–427. [Google Scholar] [CrossRef]
  24. Orenstein, I.; Raviv, T.; Sadan, E. Flexible parcel delivery to automated parcel lockers: Models, solution methods and analysis. EURO J. Transp. Logist. 2019, 8, 683–711. [Google Scholar] [CrossRef]
  25. Faugère, L.; Montreuil, B. Smart locker bank design optimization for urban omnichannel logistics: Assessing monolithic vs. modular configurations. Comput. Ind. Eng. 2020, 139, 105544. [Google Scholar] [CrossRef]
  26. Dell’Amico, M.; Deloof, W.; Hadjidimitriou, S.; Vernet, G.; Schoenewolf, W. CityLog—Sustainability and efficiency of city logistics: The M-BBX (Modular BentoBox System). In Proceedings of the 2011 IEEE Forum on Integrated and Sustainable Transportation Systems, Vienna, Austria, 29 June–1 July 2011; pp. 132–135. [Google Scholar]
  27. Lin, Y.H.; Wang, Y.; He, D.; Lee, L.H. Last-mile delivery: Optimal locker location under multinomial logit choice model. Transp. Res. Part E Logist. Transp. Rev. 2020, 142, 102059. [Google Scholar] [CrossRef]
  28. Janjevic, M.; Winkenbach, M.; Merchán, D. Integrating collection-and-delivery points in the strategic design of urban last-mile e-commerce distribution networks. Transp. Res. Part E Logist. Transp. Rev. 2019, 131, 37–67. [Google Scholar] [CrossRef]
  29. Morganti, E.; Dablanc, L.; Fortin, F. Final deliveries for online shopping: The deployment of pickup point networks in urban and suburban areas. Res. Transp. Bus. Manag. 2014, 11, 23–31. [Google Scholar] [CrossRef] [Green Version]
  30. Nocera, S.; Pungillo, G.; Bruzzone, F. How to evaluate and plan the freight-passengers first-last mile. Transp. Policy 2020. [Google Scholar] [CrossRef]
  31. Schwerdfeger, S.; Boysen, N. Optimizing the changing locations of mobile parcel lockers in last-mile distribution. Eur. J. Oper. Res. 2020, 285, 1077–1094. [Google Scholar] [CrossRef]
  32. Li, J.; Ensafian, H.; Bell, M.G.H.; Geers, D.G. Deploying autonomous mobile lockers in a two-echelon parcel operation. Transp. Res. Part C Emerg. Technol. 2021, 128, 103155. [Google Scholar] [CrossRef]
  33. Greater London Authority (GLA). Key Performance Indicators of Freight Delivery Performance with Electric vans in Central London—London Datastore. 2017. Available online: https://data.london.gov.uk/dataset/key-performance-indicators-of-demonstrator-freight-delivery-performance-with-electric-vans-in-central-london (accessed on 18 February 2019).
  34. London Stock Exchange Plc. FTSE Index Records and Daily Closing Values. 2020. Available online: https://www.londonstockexchange.com/statistics/ftse/ftse.htm (accessed on 23 February 2020).
  35. Haldane, A.; Haskel, J.; Saunders, M.; Tenreyro, S.; Vlieghe, G. BoE Inflation Report August 2019; Bank of England: London, UK, 2019. [Google Scholar]
  36. Cross River Partnership. Click. Collect. Clean Air. Available online: https://clickcollect.london/ (accessed on 2 February 2020).
  37. Waskom, M.; Botvinnik, O.; Hobson, P.; Cole, J.B.; Halchenko, Y.; Hoyer, S.; Miles, A.; Augspurger, T.; Yarkoni, T.; Megies, T.; et al. Seaborn: V0.5.0 (November 2014). Zenodo 2014. [Google Scholar] [CrossRef]
  38. Gatta, V.; Marcucci, E.; Nigro, M.; Patella, S.M.; Serafini, S. Public transport-based crowdshipping for sustainable city logistics: Assessing economic and environmental impacts. Sustainability 2018, 11, 145. [Google Scholar] [CrossRef] [Green Version]
  39. Didenko, N.; Skripnuk, D.; Kikkas, K.; Kalinina, O.; Kosinski, E. The impact of digital transformation on the micrologistic system, and the open innovation in logistics. J. Open Innov. Technol. Mark. Complex. 2021, 7, 115. [Google Scholar] [CrossRef]
  40. Barykin, S.Y.; Kapustina, I.V.; Sergeev, S.M.; Yadykin, V.K. Algorithmic foundations of economic and mathematical modeling of network logistics processes. J. Open Innov. Technol. Mark. Complex. 2020, 6, 189. [Google Scholar] [CrossRef]
  41. Bıyık, C.; Abareshi, A.; Paz, A.; Ruiz, R.A.; Battarra, R.; Rogers, C.D.; Lizarraga, C. Smart mobility adoption: A review of the literature. J. Open Innov. Technol. Mark. Complex. 2021, 7, 146. [Google Scholar] [CrossRef]
  42. Solarte-Montufar, J.G.; Zartha-Sossa, J.W.; Osorio-Mora, O. Open Innovation in the Agri-Food Sector: Perspectives from a Systematic Literature Review and a Structured Survey in MSMEs. J. Open Innov. Technol. Mark. Complex. 2021, 7, 161. [Google Scholar] [CrossRef]
Figure 1. Number of parcel lockers required per day (Density 1.0).
Joitmc 07 00183 g001
Figure 2. Number of lockers required per day depending on the month (Density 1.0).
Joitmc 07 00183 g002
Figure 3. Number of lockers required per day depending on the day of the week (Density 1.0).
Joitmc 07 00183 g003
Figure 4. Comparison of the maximum number of locker spaces per month between all parcels picked up and 30% of parcels not picked up (Density 1.0).
Joitmc 07 00183 g004
Figure 5. Comparison of the mean number of locker spaces per month between all parcels picked up and 30% of parcels not picked up (Density 1.0).
Joitmc 07 00183 g005
Figure 6. Number of lockers required per day depending on the weekday and month (Density 1.0).
Joitmc 07 00183 g006
Figure 7. Number of lockers required (Density 1.0).
Joitmc 07 00183 g007
Figure 8. Percentage of parcels that could not be delivered per year due to a lack of locker availability if the number of parcel lockers is equal to the 80-percentile, 90-percentile, etc. (Density 1.0).
Joitmc 07 00183 g008
Figure 9. Optimal number of lockers depending on the costs and number of CDPs (Density 1.0).
Joitmc 07 00183 g009
Figure 10. Optimal number of lockers depending on the costs and variation in the demand for parcel lockers (512 CDPs).
Joitmc 07 00183 g010
Figure 11. Comparison of the average utilization of fixed lockers with modular lockers, which are adjusted in the beginning of each month.
Joitmc 07 00183 g011
Table 1. Modular locker vs. fixed locker and staffed CDPs.
Modular LockerFixed Locker & Staffed CDP
Number of lockersHigh demand seasonMedium demand season
Land rent at CDPMore or similar to medium demand depending on seasonMedium demand season
Locker storage spaceDuring low demand seasonN/A
Transport of lockersE.g., monthly adjustmentsN/A
Fee for staffed CDPN/ACa. £0.50 per parcel [18]
Publisher’s Note: MDPI stays neutral with regard to jurisdictional claims in published maps and institutional affiliations.

