Open Business Model of COVID-19 Transformation of an Urban Public Transport System: The Experience of a Large Russian City


Abstract
:1. Introduction
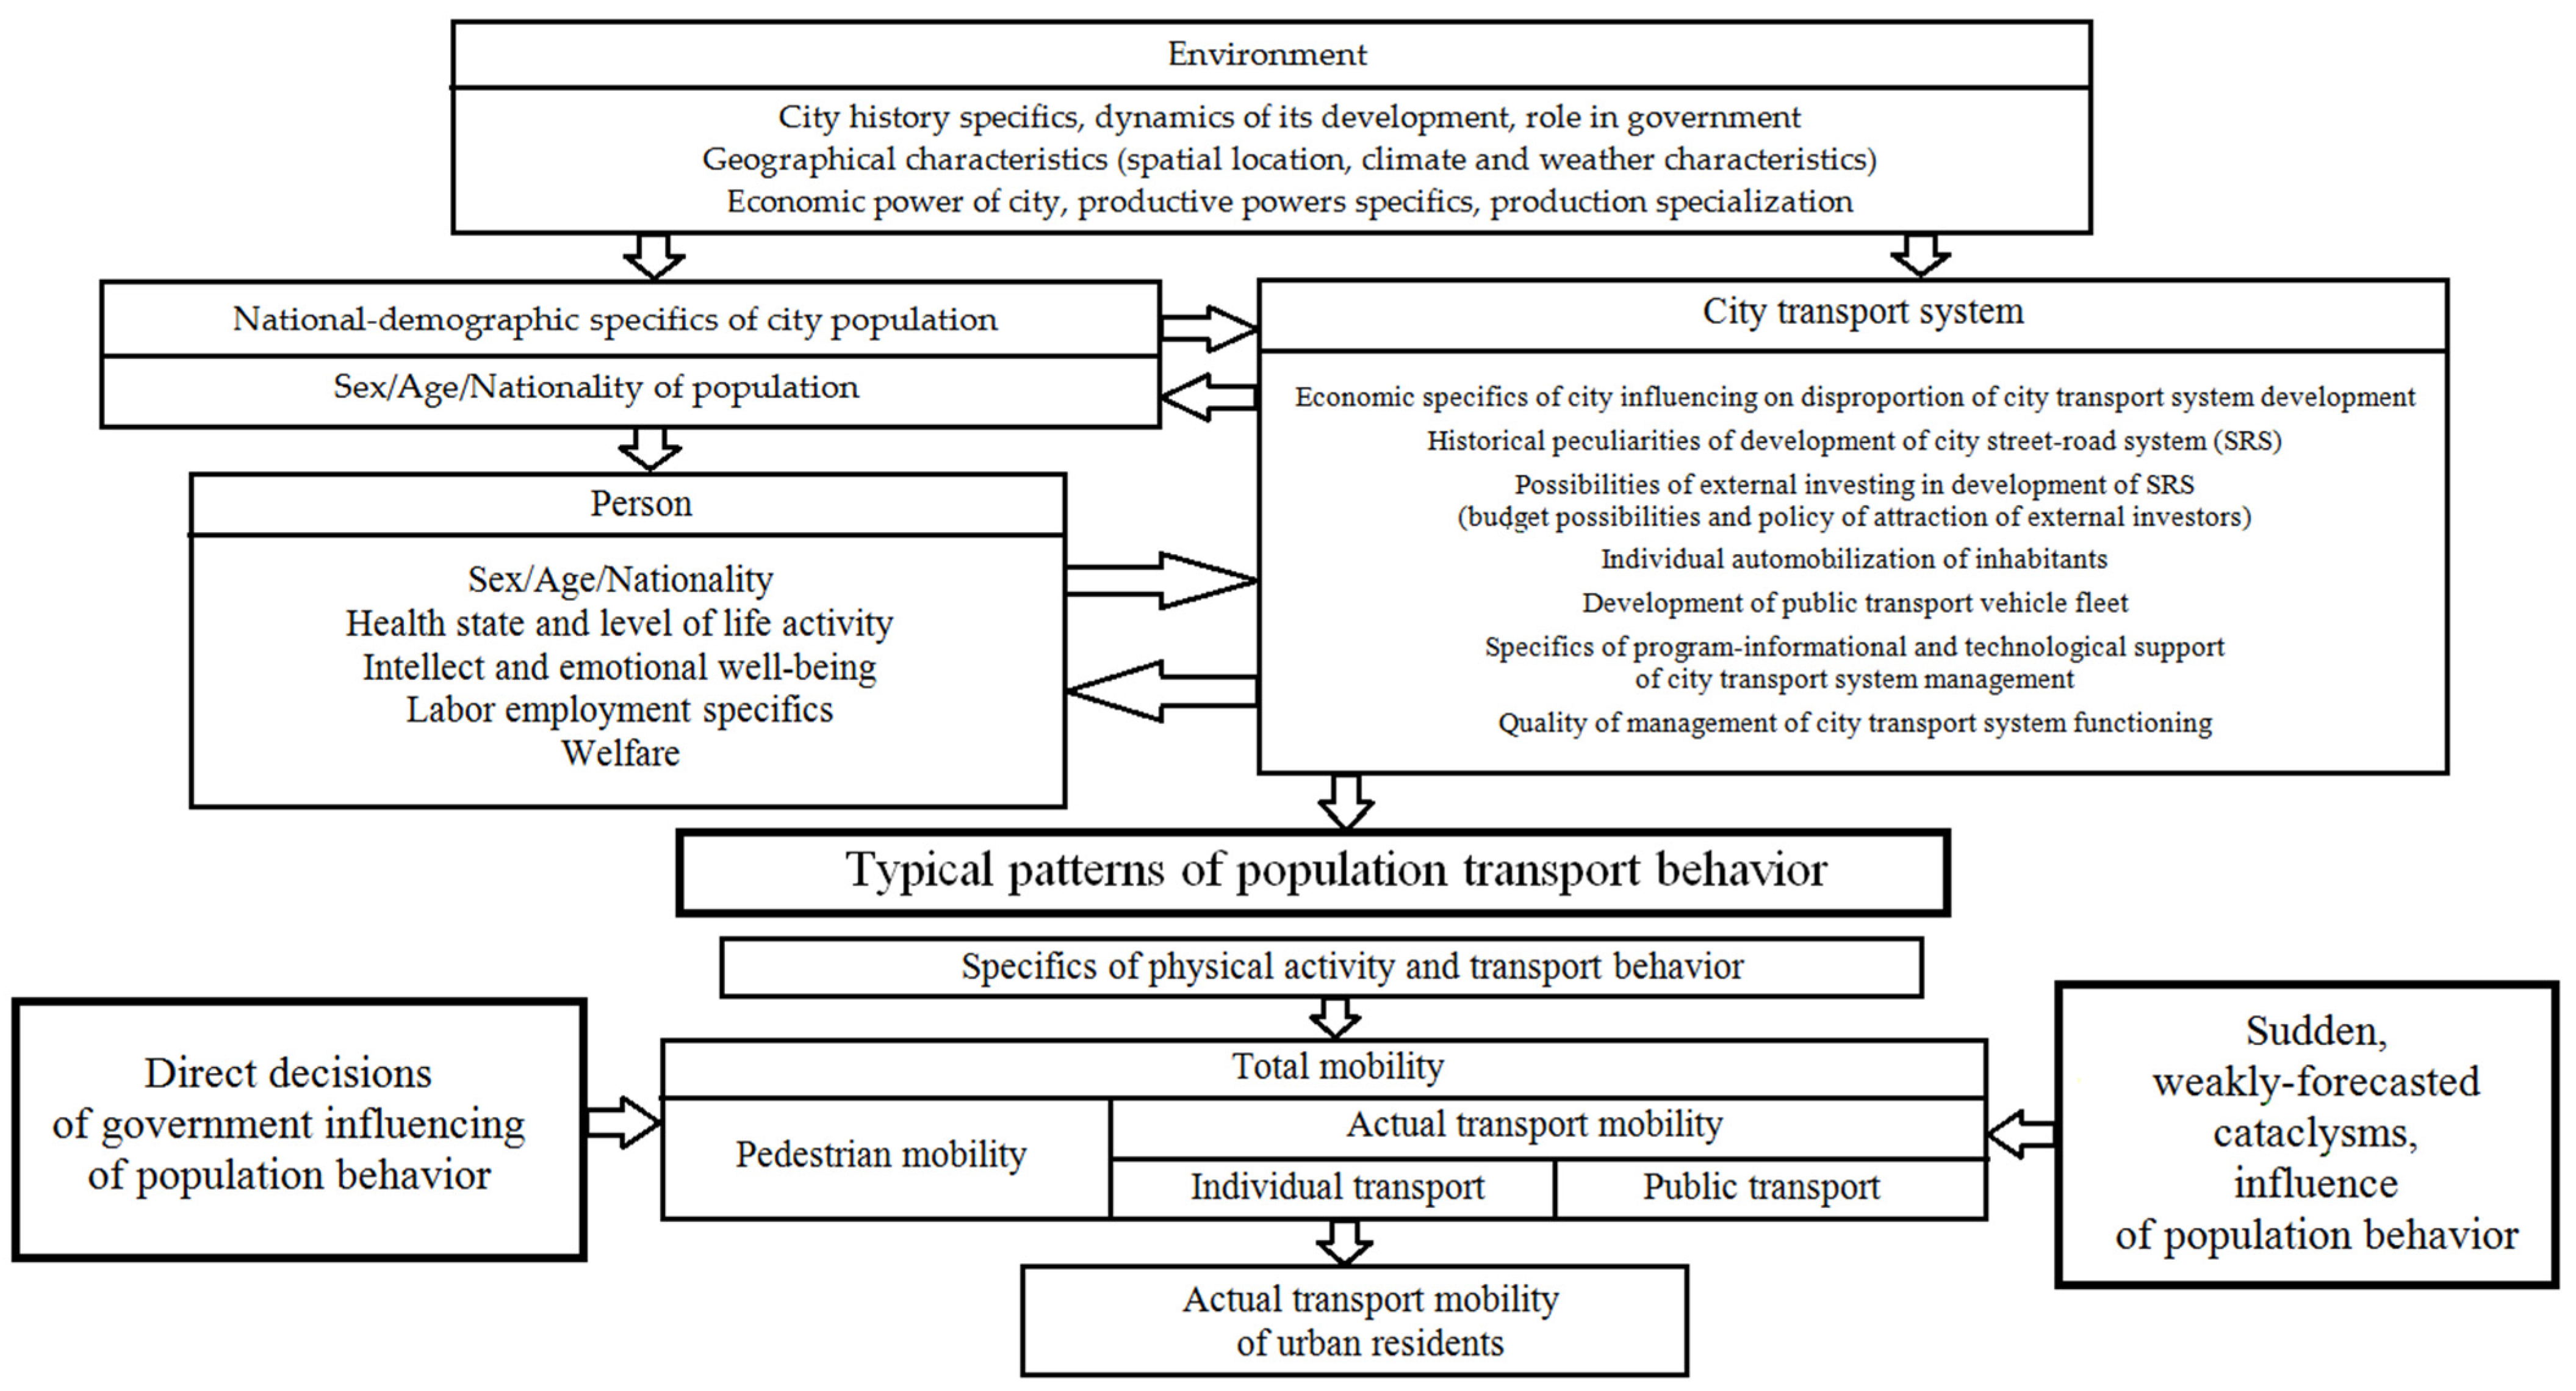
2. Problem, Purpose, and Research Tasks
- Analyzing the issue state; analyzing the results of previous papers on the research theme; justifying the research subject choice; study of its specifics;
- Researching stress-factors that had a significant impact on reformatting of the transport service market, considering the event dynamics and final results of stress-factor impacts on the city’s CPPT system;
- Developing a method of evaluating the impacts of stress-factors on structural sustainability of the city’s CPPT routing system;
- Collecting and analyzing the experimental data necessary for evaluating the change of structure of the CPPT routing system under COVID-19 conditions;
- Representing and analyzing research results;
- Discussing the practical usage of results; producing methodical recommendations to maintain a sustainable passenger transportation market, under COVID-19 conditions;
- Formulating conclusions on completed research.
3. Analysis of Issue State
3.1. Literature Review
3.1.1. General Information about the Business Models of the Transport Market
3.1.2. General Information about COVID-19 Transformation of Urban Public Transport System
3.2. Justification of Choice of Tyumen as a Source of Experimental Data
3.2.1. General Characteristics of Cities of the Russian Federation and Heterogeneity of Urbanization Processes
3.2.2. Dialectics of Development of Tyumen CPPT System (1940–2020)
- The city and its CPPT system have been intensively developed.
- Throughout an 80-year period, there were two types of CPPT buses (main—during the whole period) and trolleybuses (auxiliary—in 1970–2009).
- In the period of 2000–2010, pivotal reformatting processes in fulfilling transport demands occurred. Automobilization increased by 3.5 times (from A2000 = 60 vehicles/1000 people to A2010 = 210 vehicles/1000 people). It led to a significant decrease in demand for CPPT service and an increase in demand for transportation by individual transport.
- In 2010–2020, automobilization continued (A2020 = 470 vehicles/1000 people), but, at the same time, the quality of the city CPPT system developed via the improvement of the route network, transportation organization system, and vehicle quality. It boosted the growth of the demand for CPPT service and the growth of transport supply.
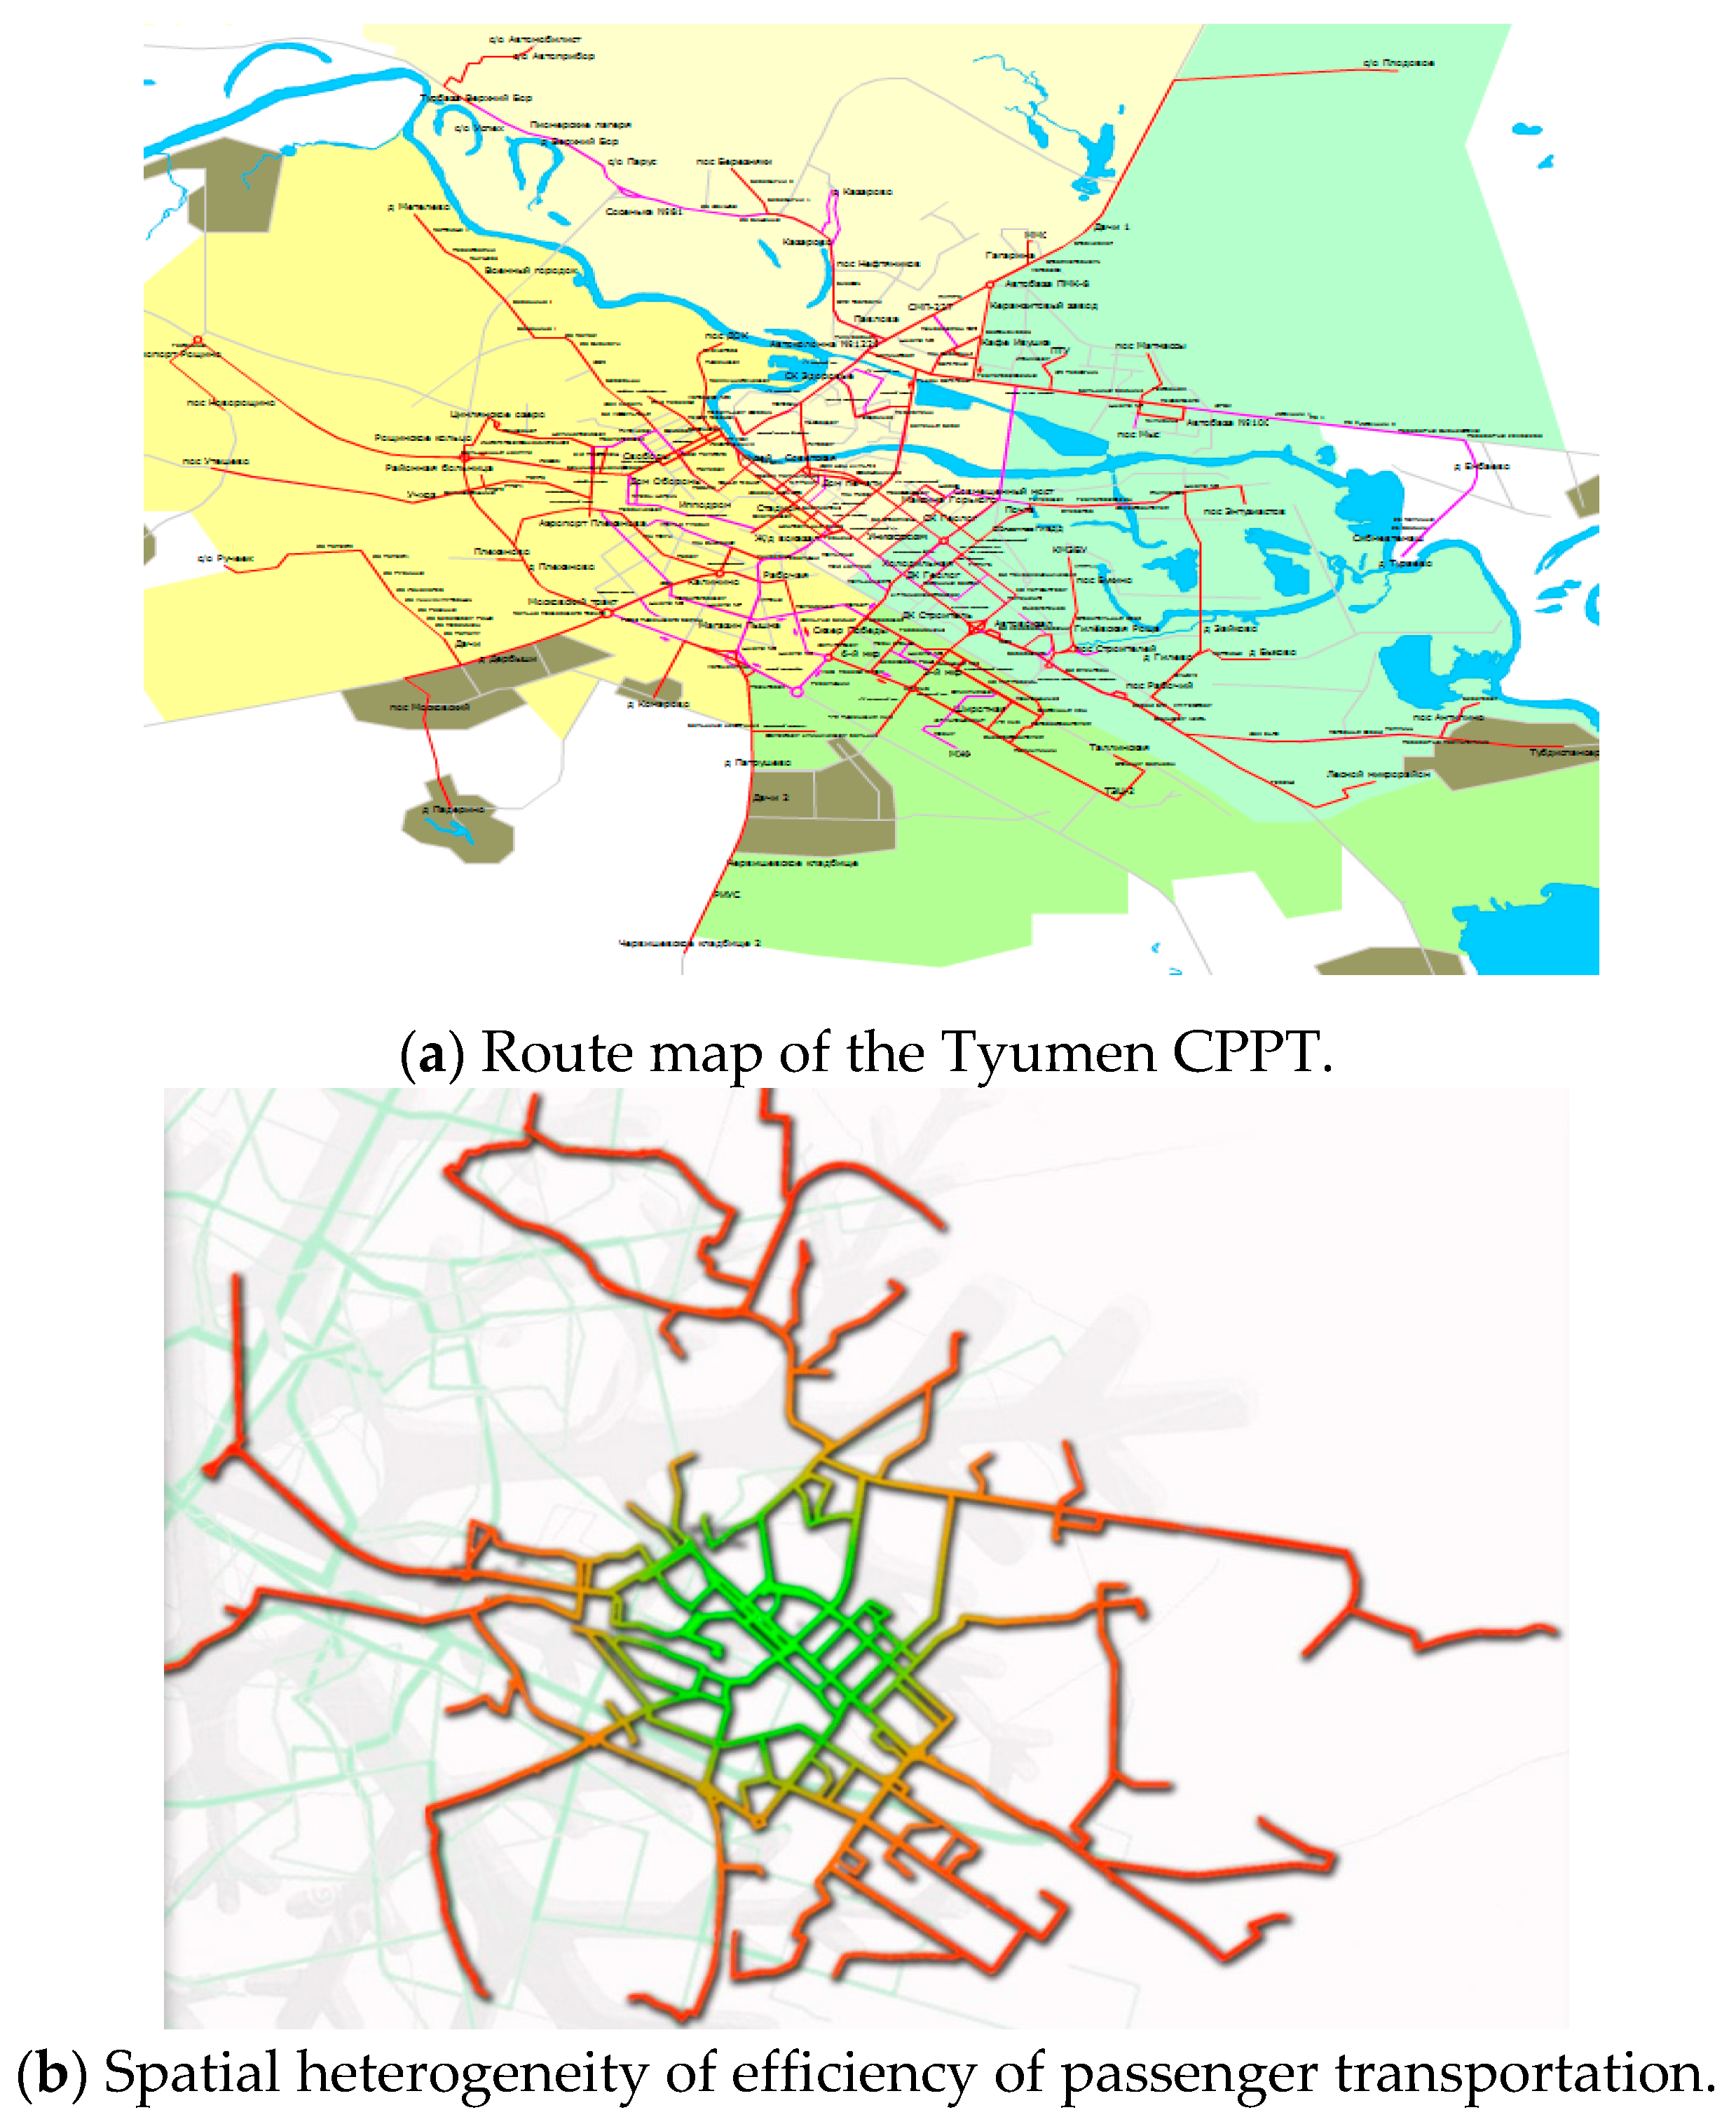
3.2.3. Justification of Choice of Tyumen as a Source of Experimental Data—Short Characterization of Tyumen CPPT System (2021)
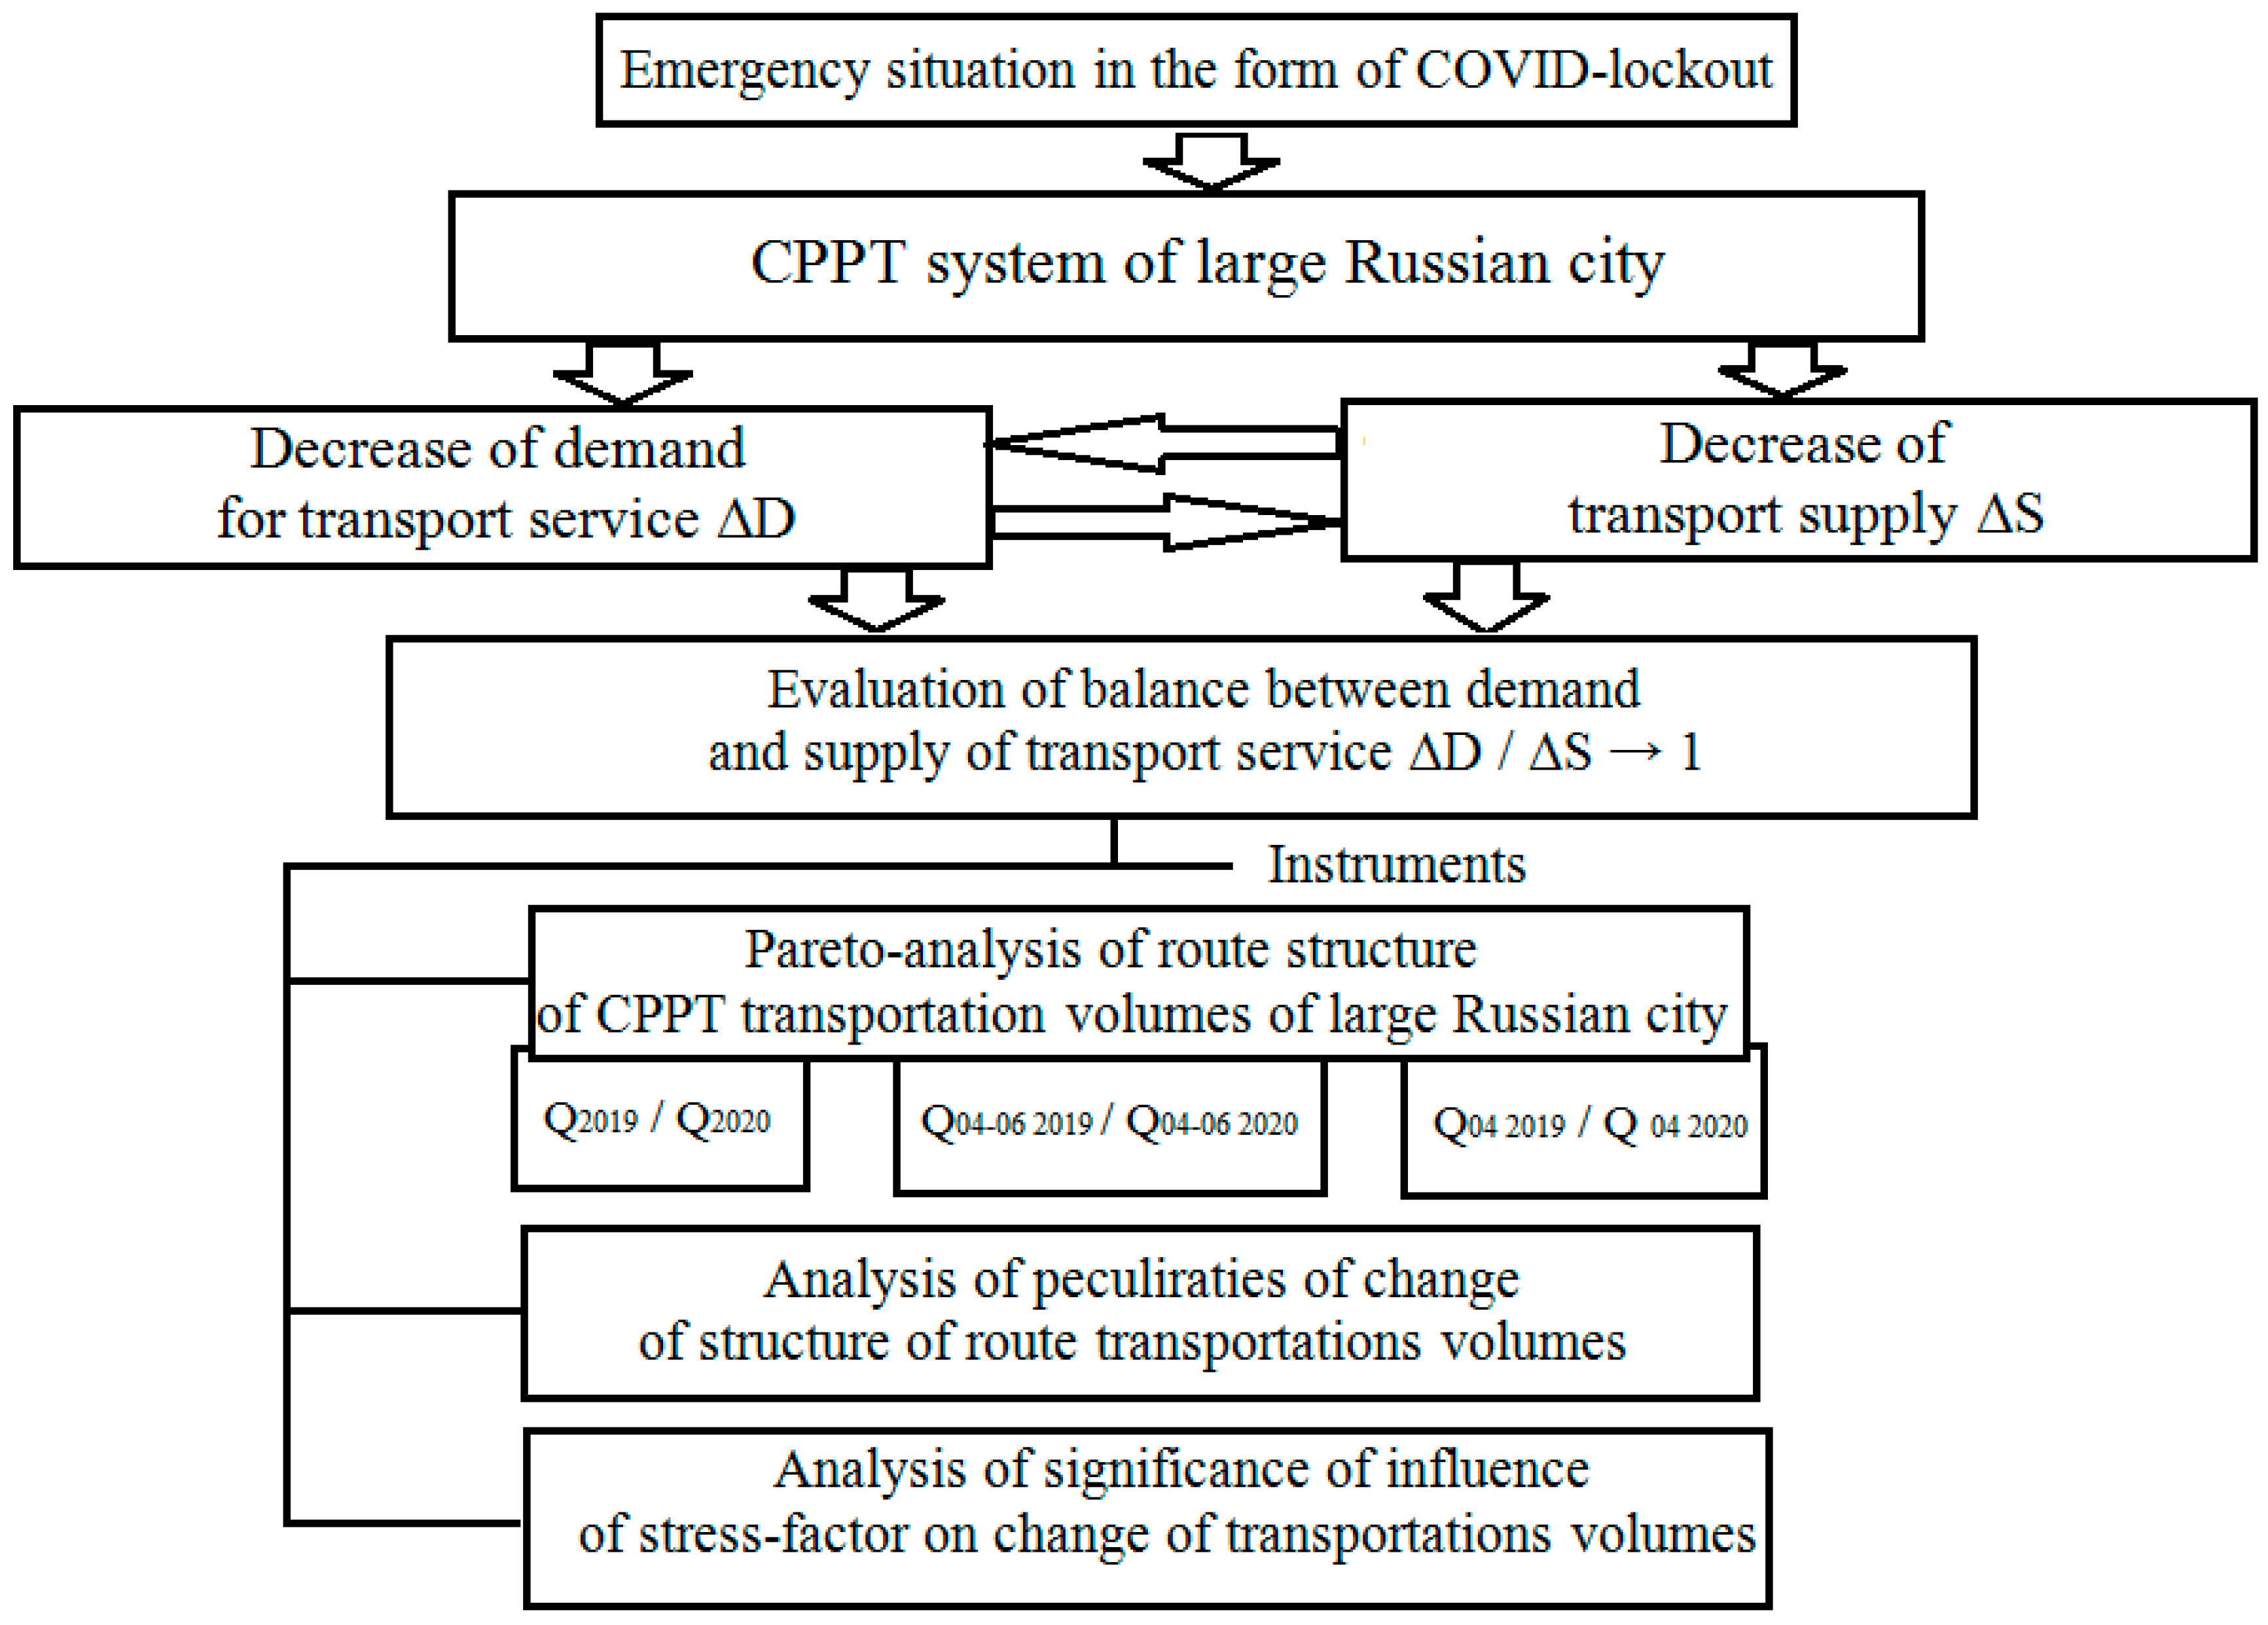
4. Justification of the Choice of the Largest Stress-Factor: Structural Sustainability of the Tyumen CPPT Routing System Evaluated under the Impact of Chosen Stress-Factor
4.1. COVID-19 as a Stress-Factor for CPPT System
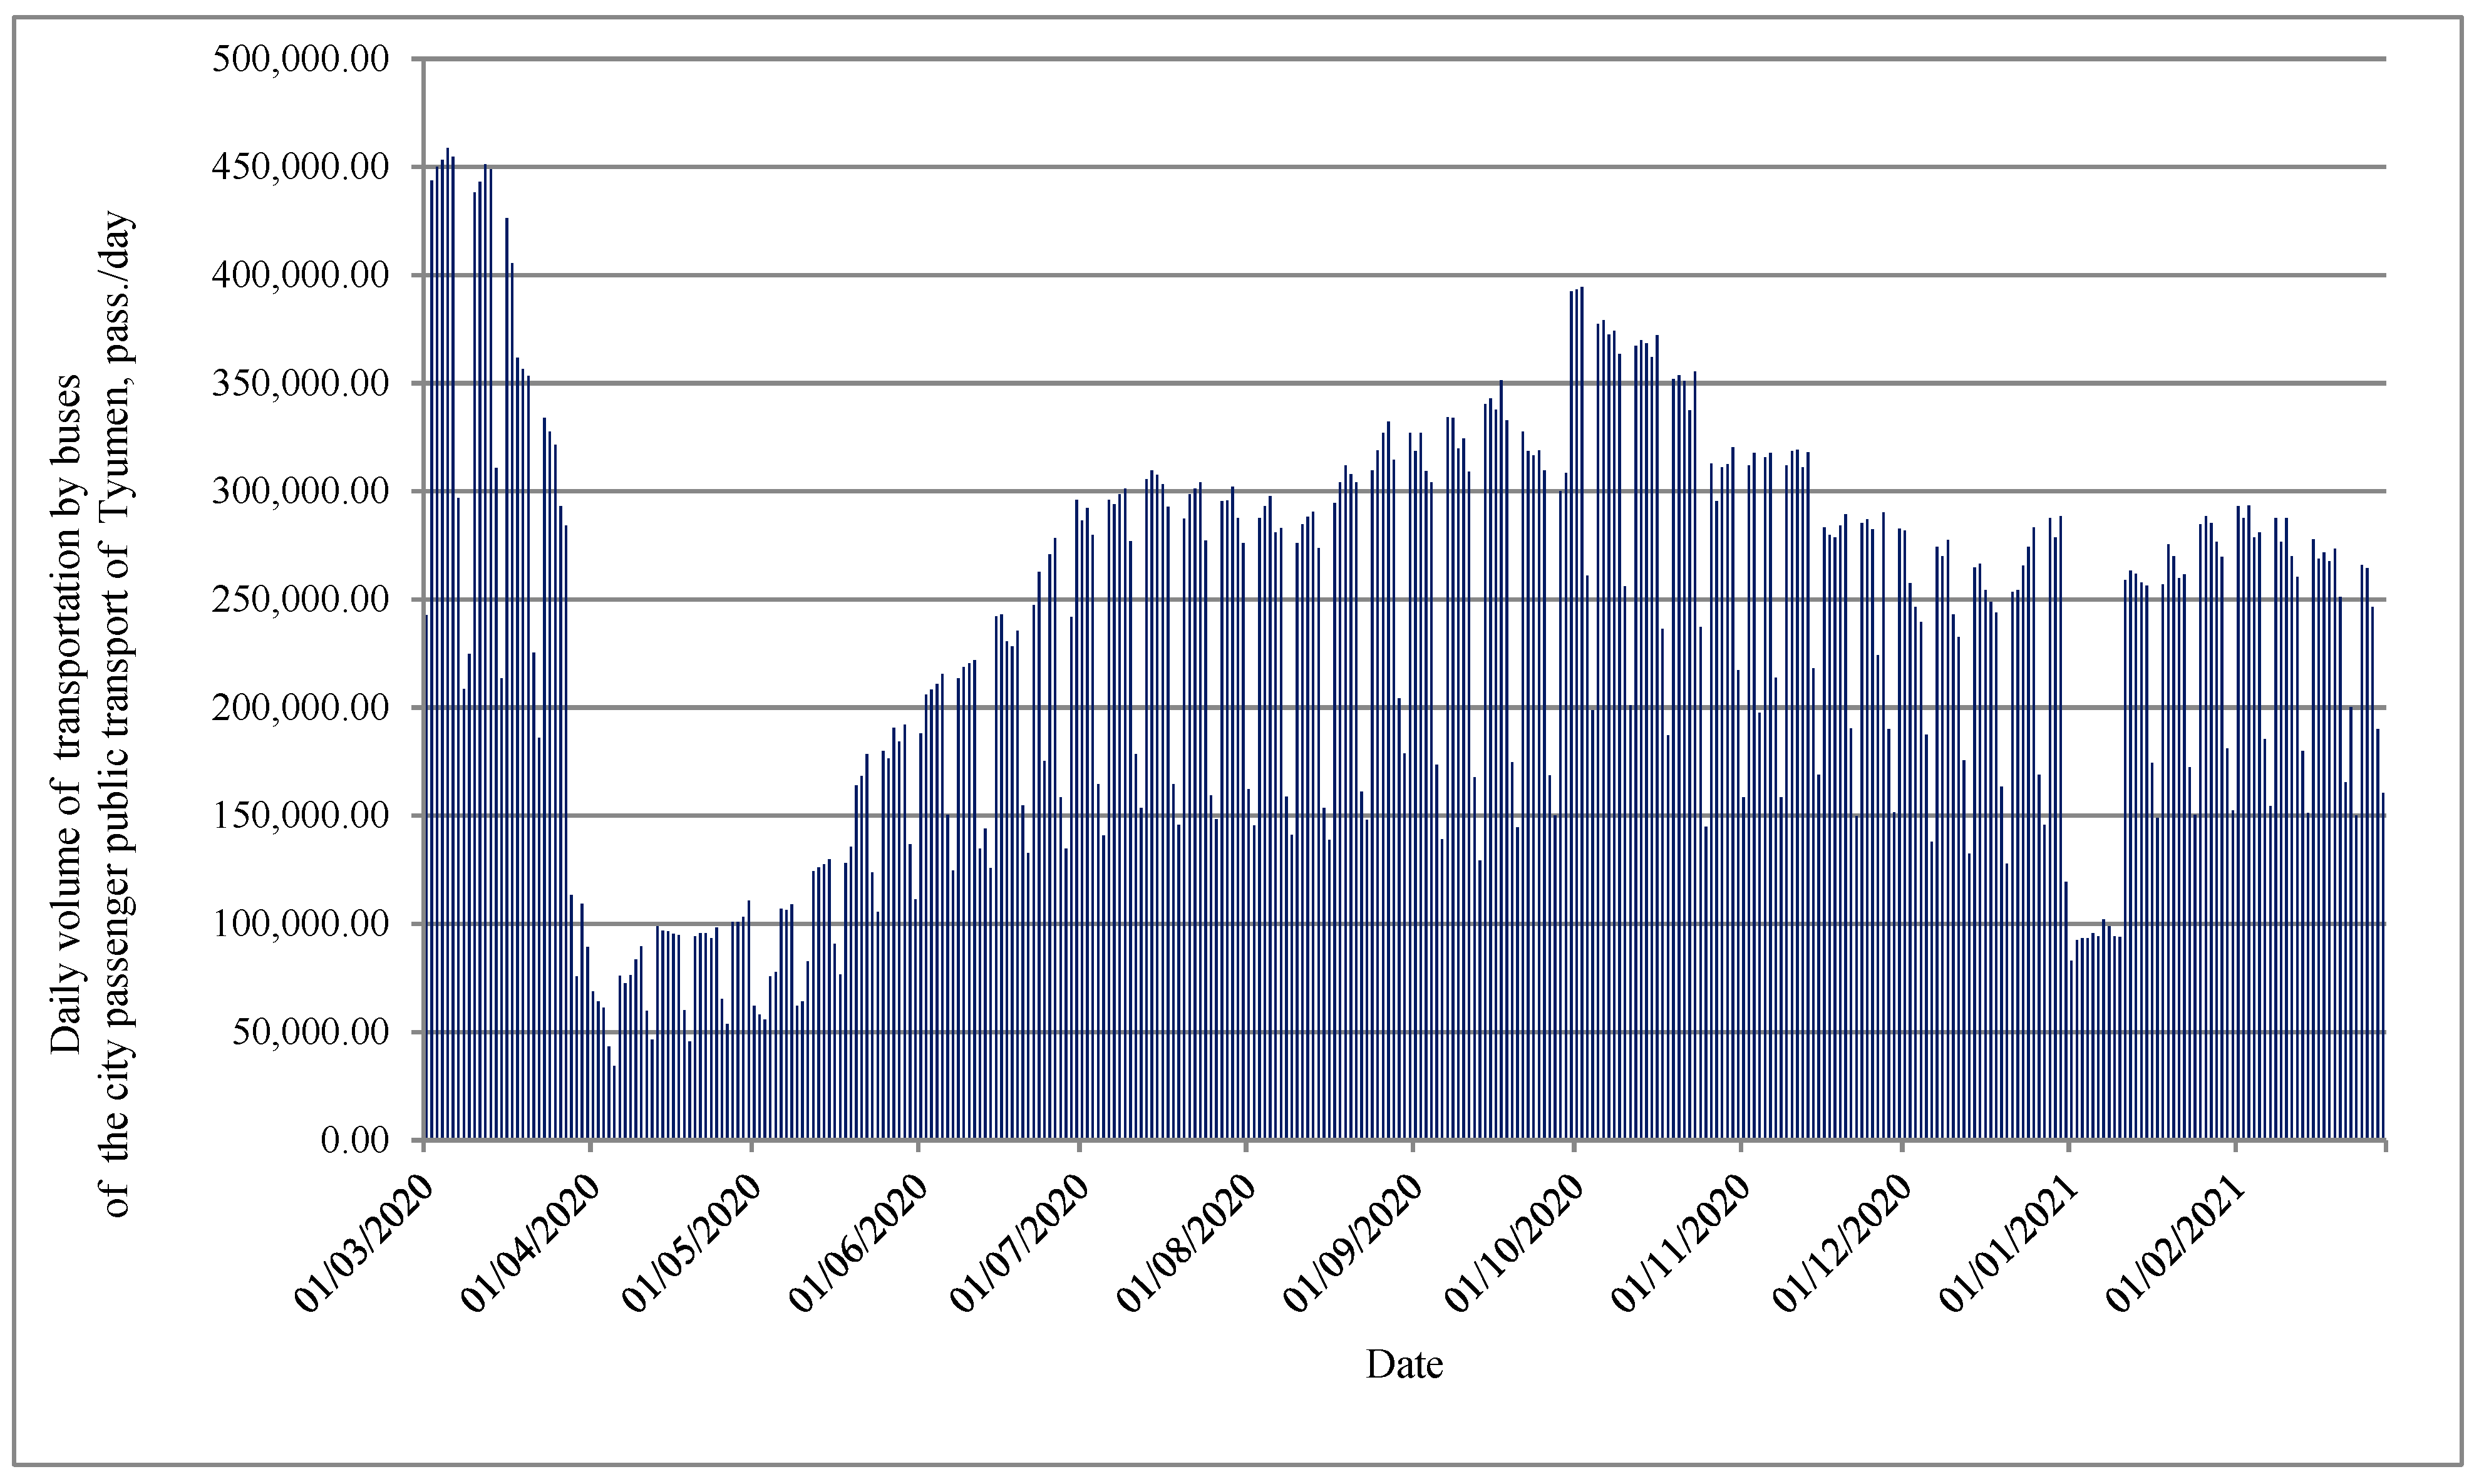
4.2. Consideration of Event Dynamics during Stress-Factor Impacts on the Tyumen CPPT System and Results of This Negative Impact
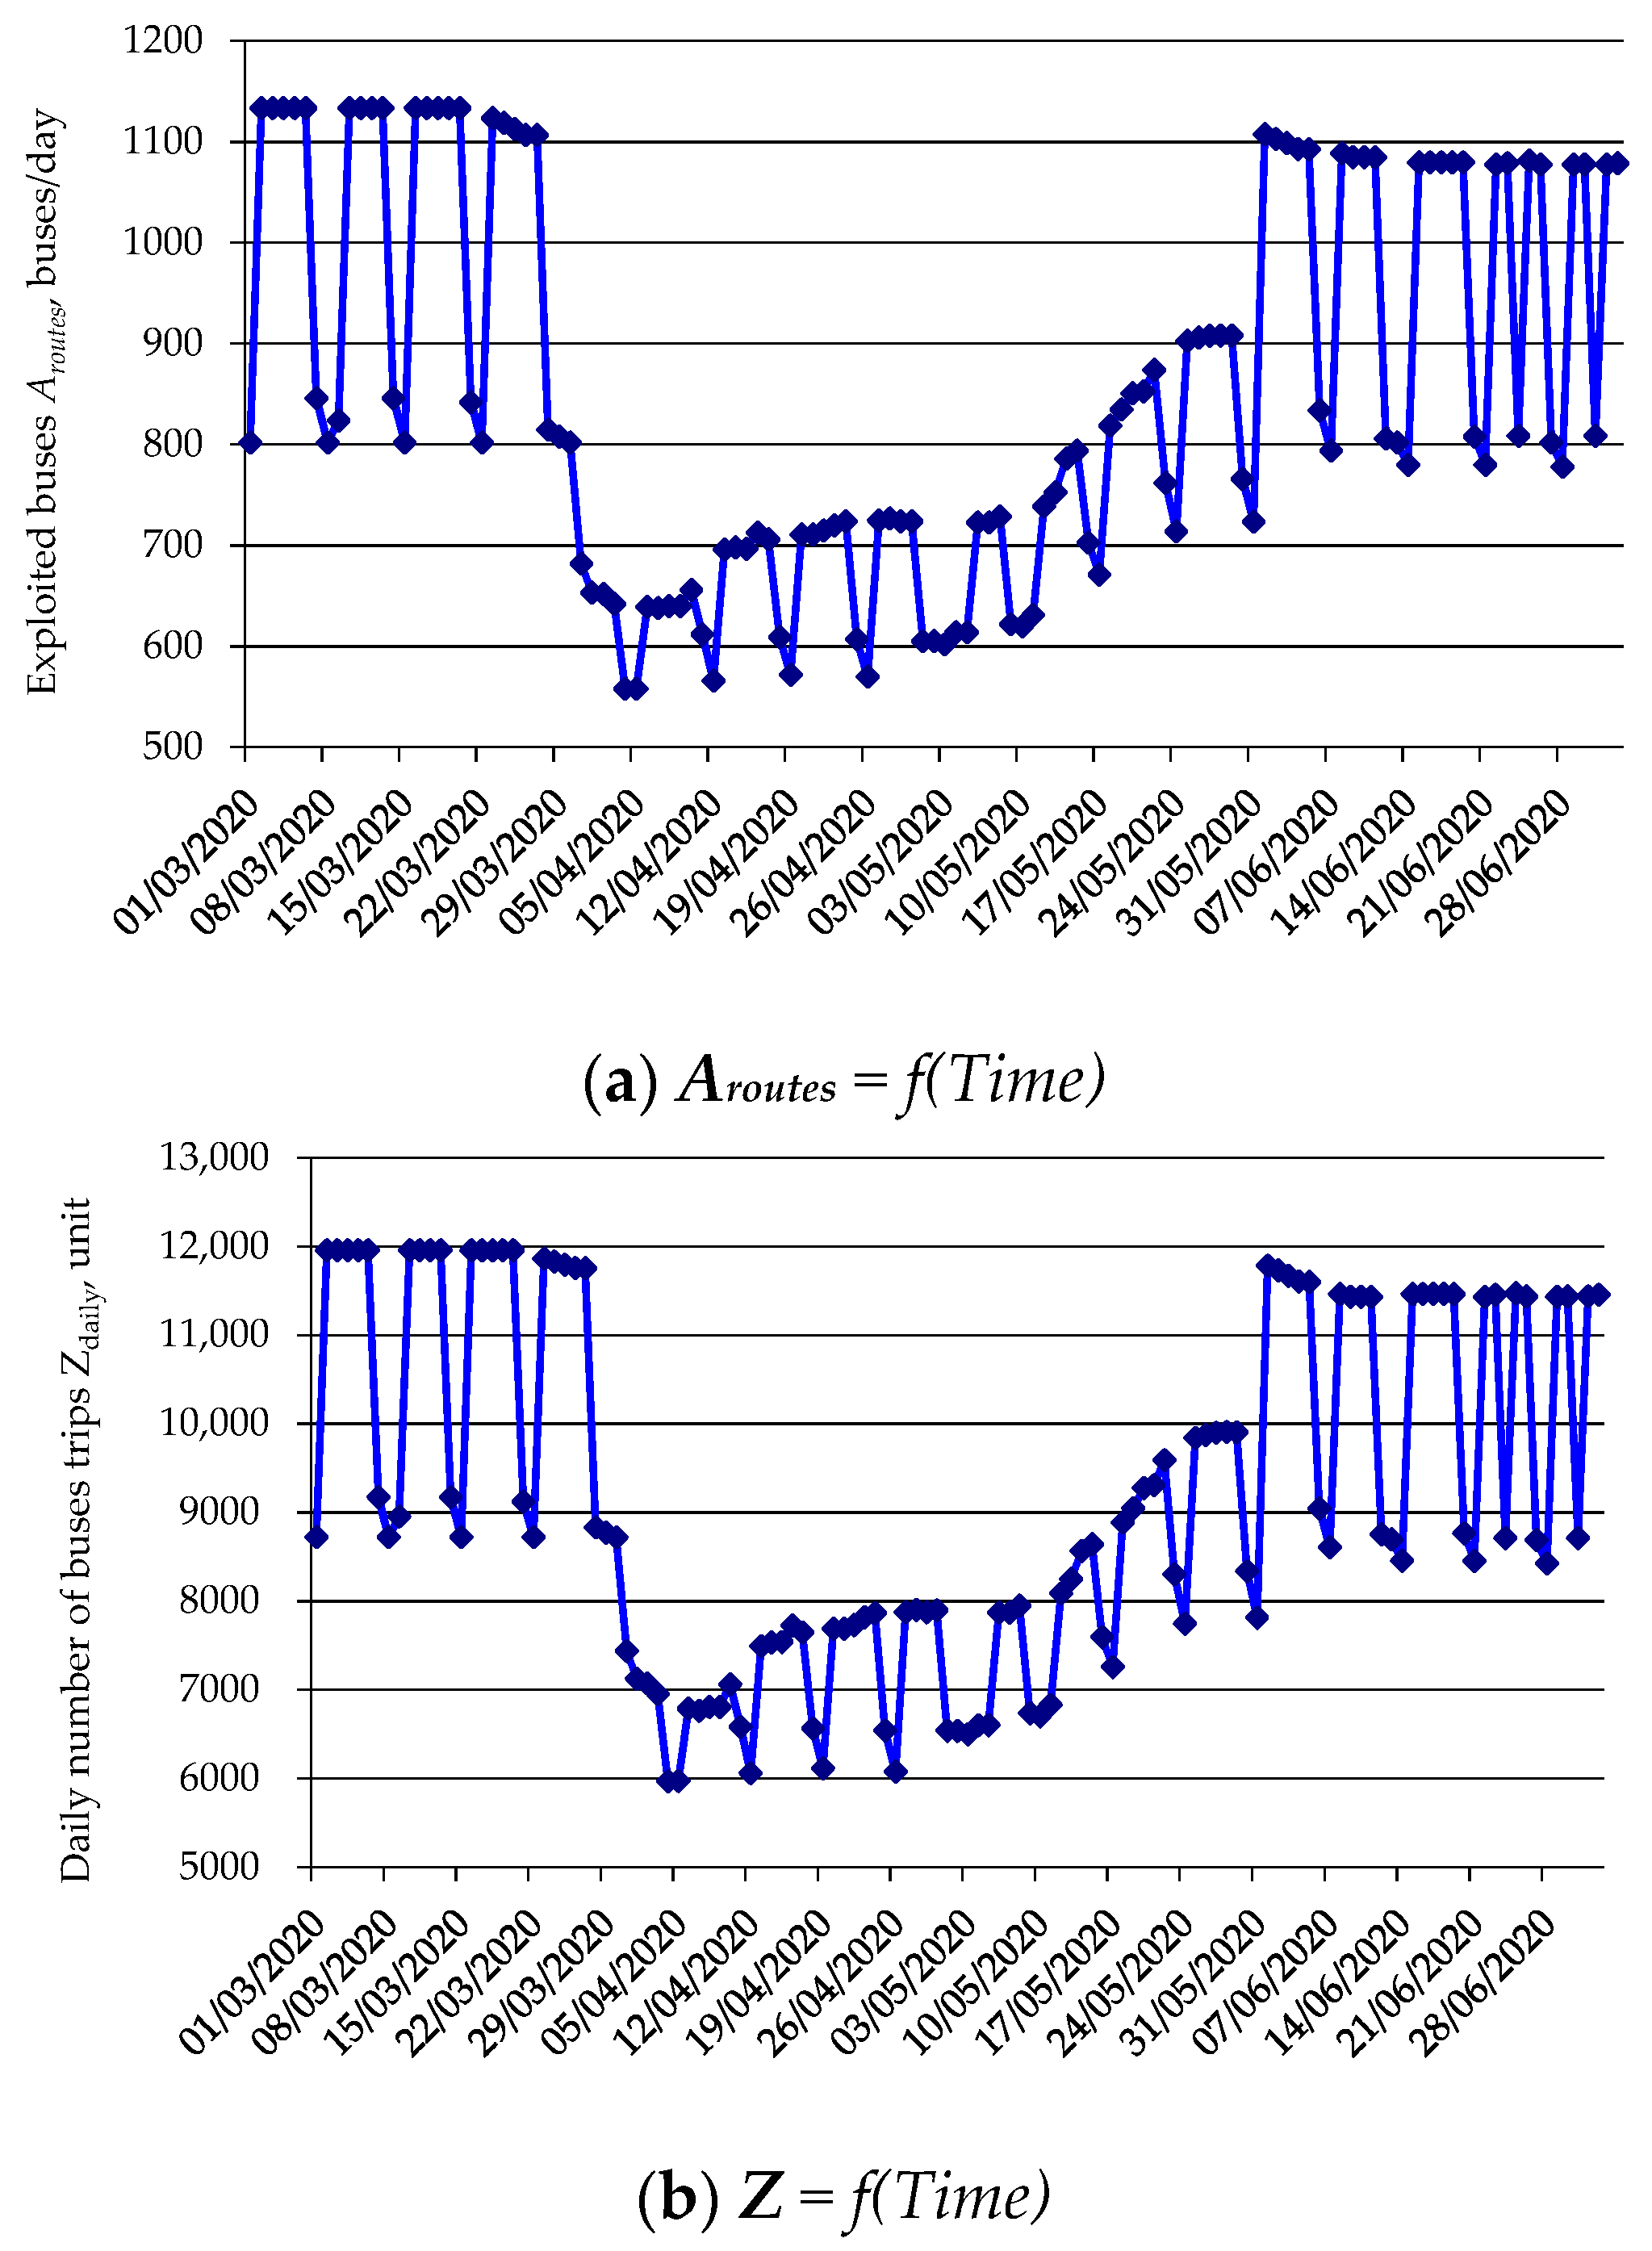
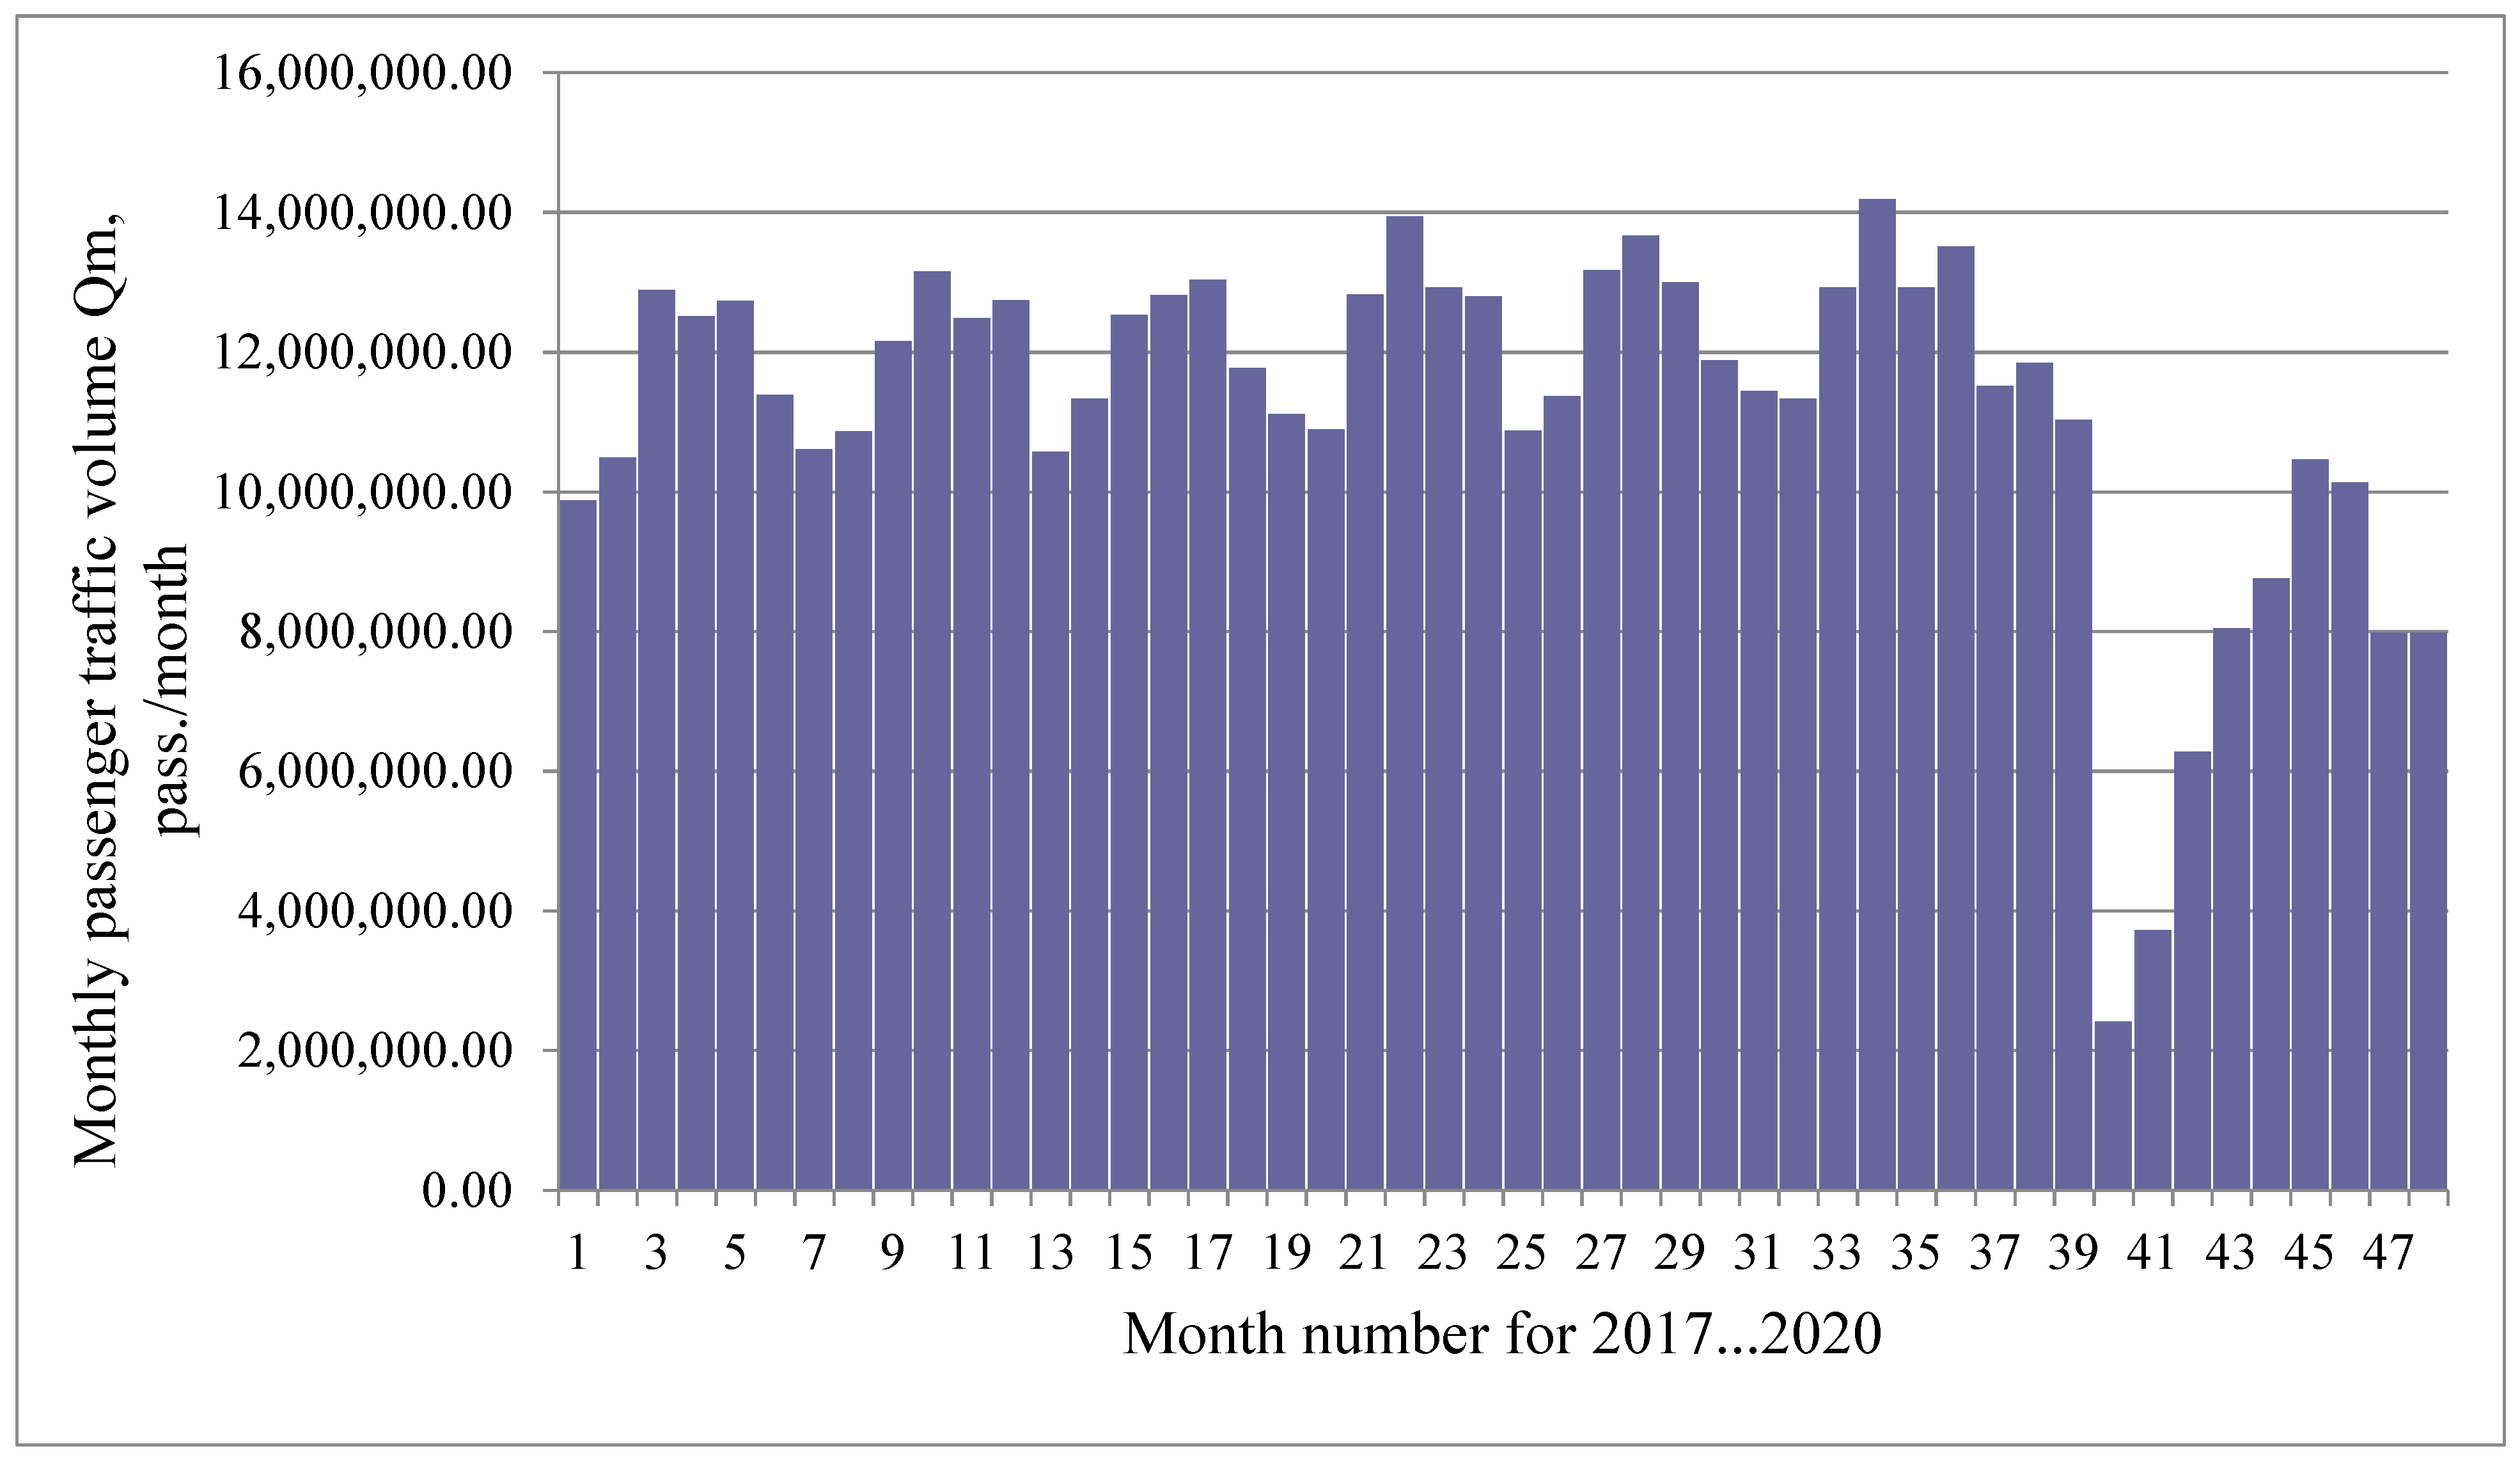
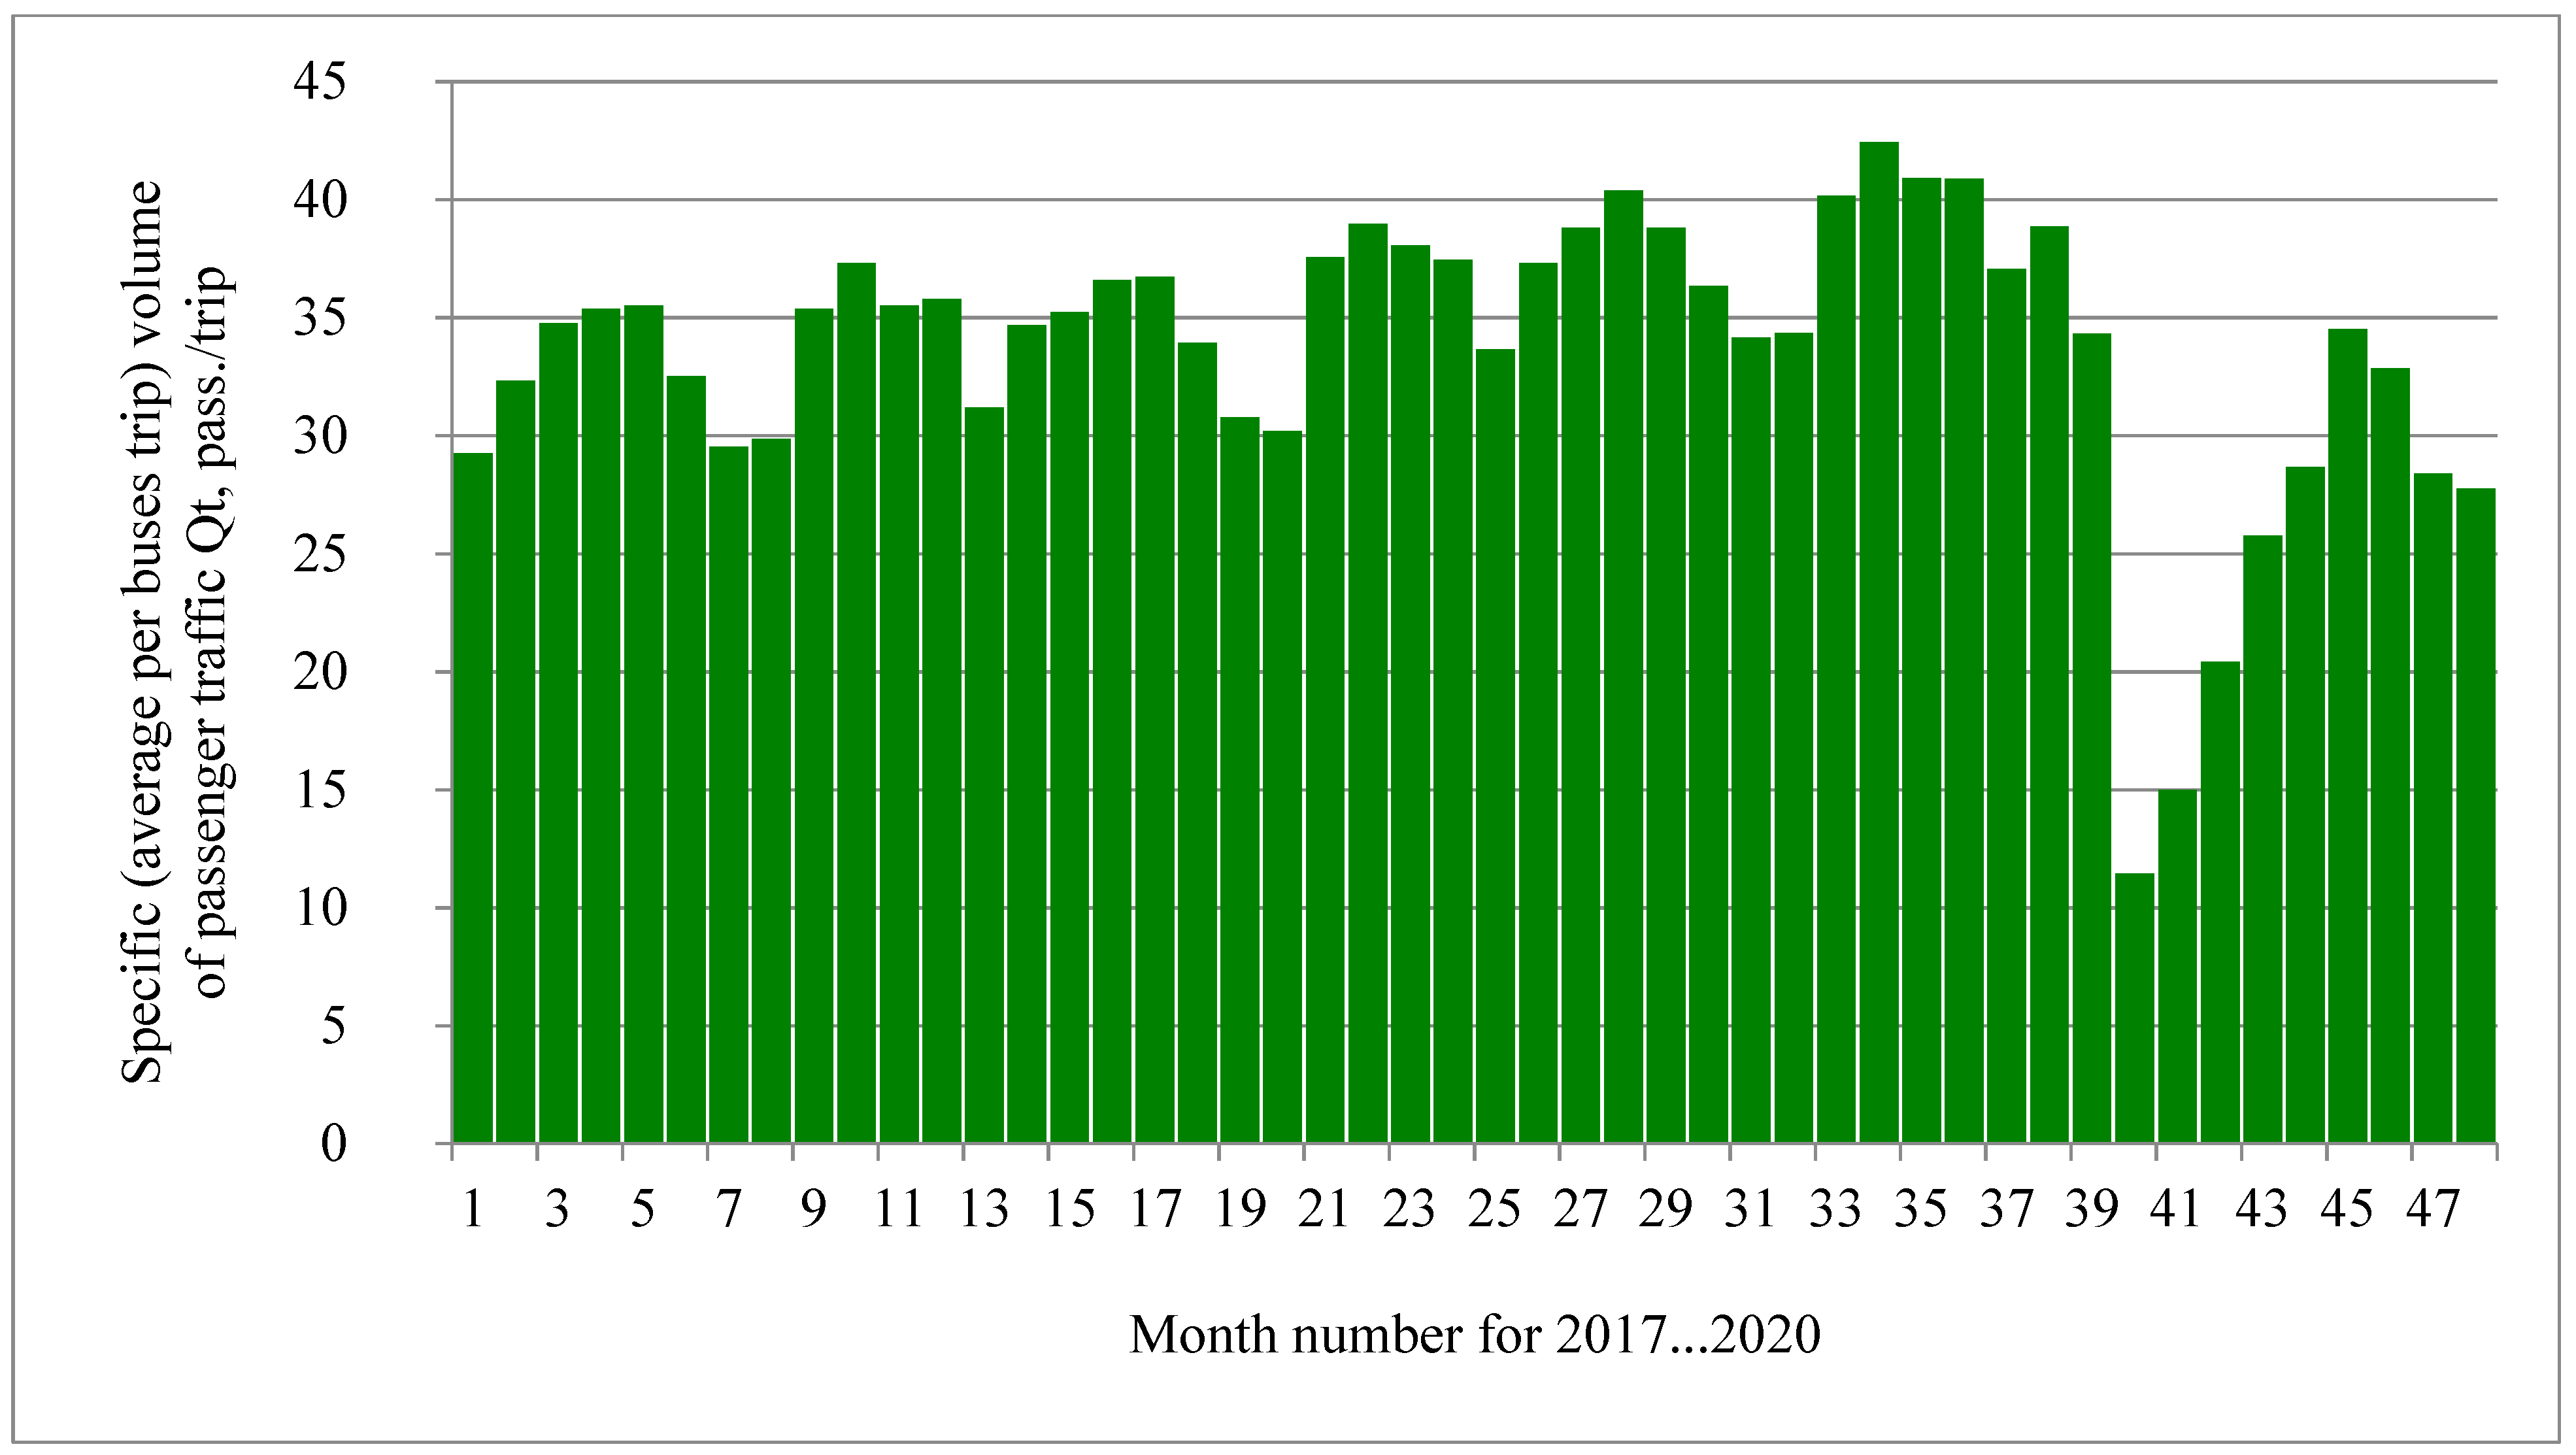
4.2.1. Change of General State of the Routing System and Parameters of Tyumen CPPT Transportation Process in COVID-19 Conditions
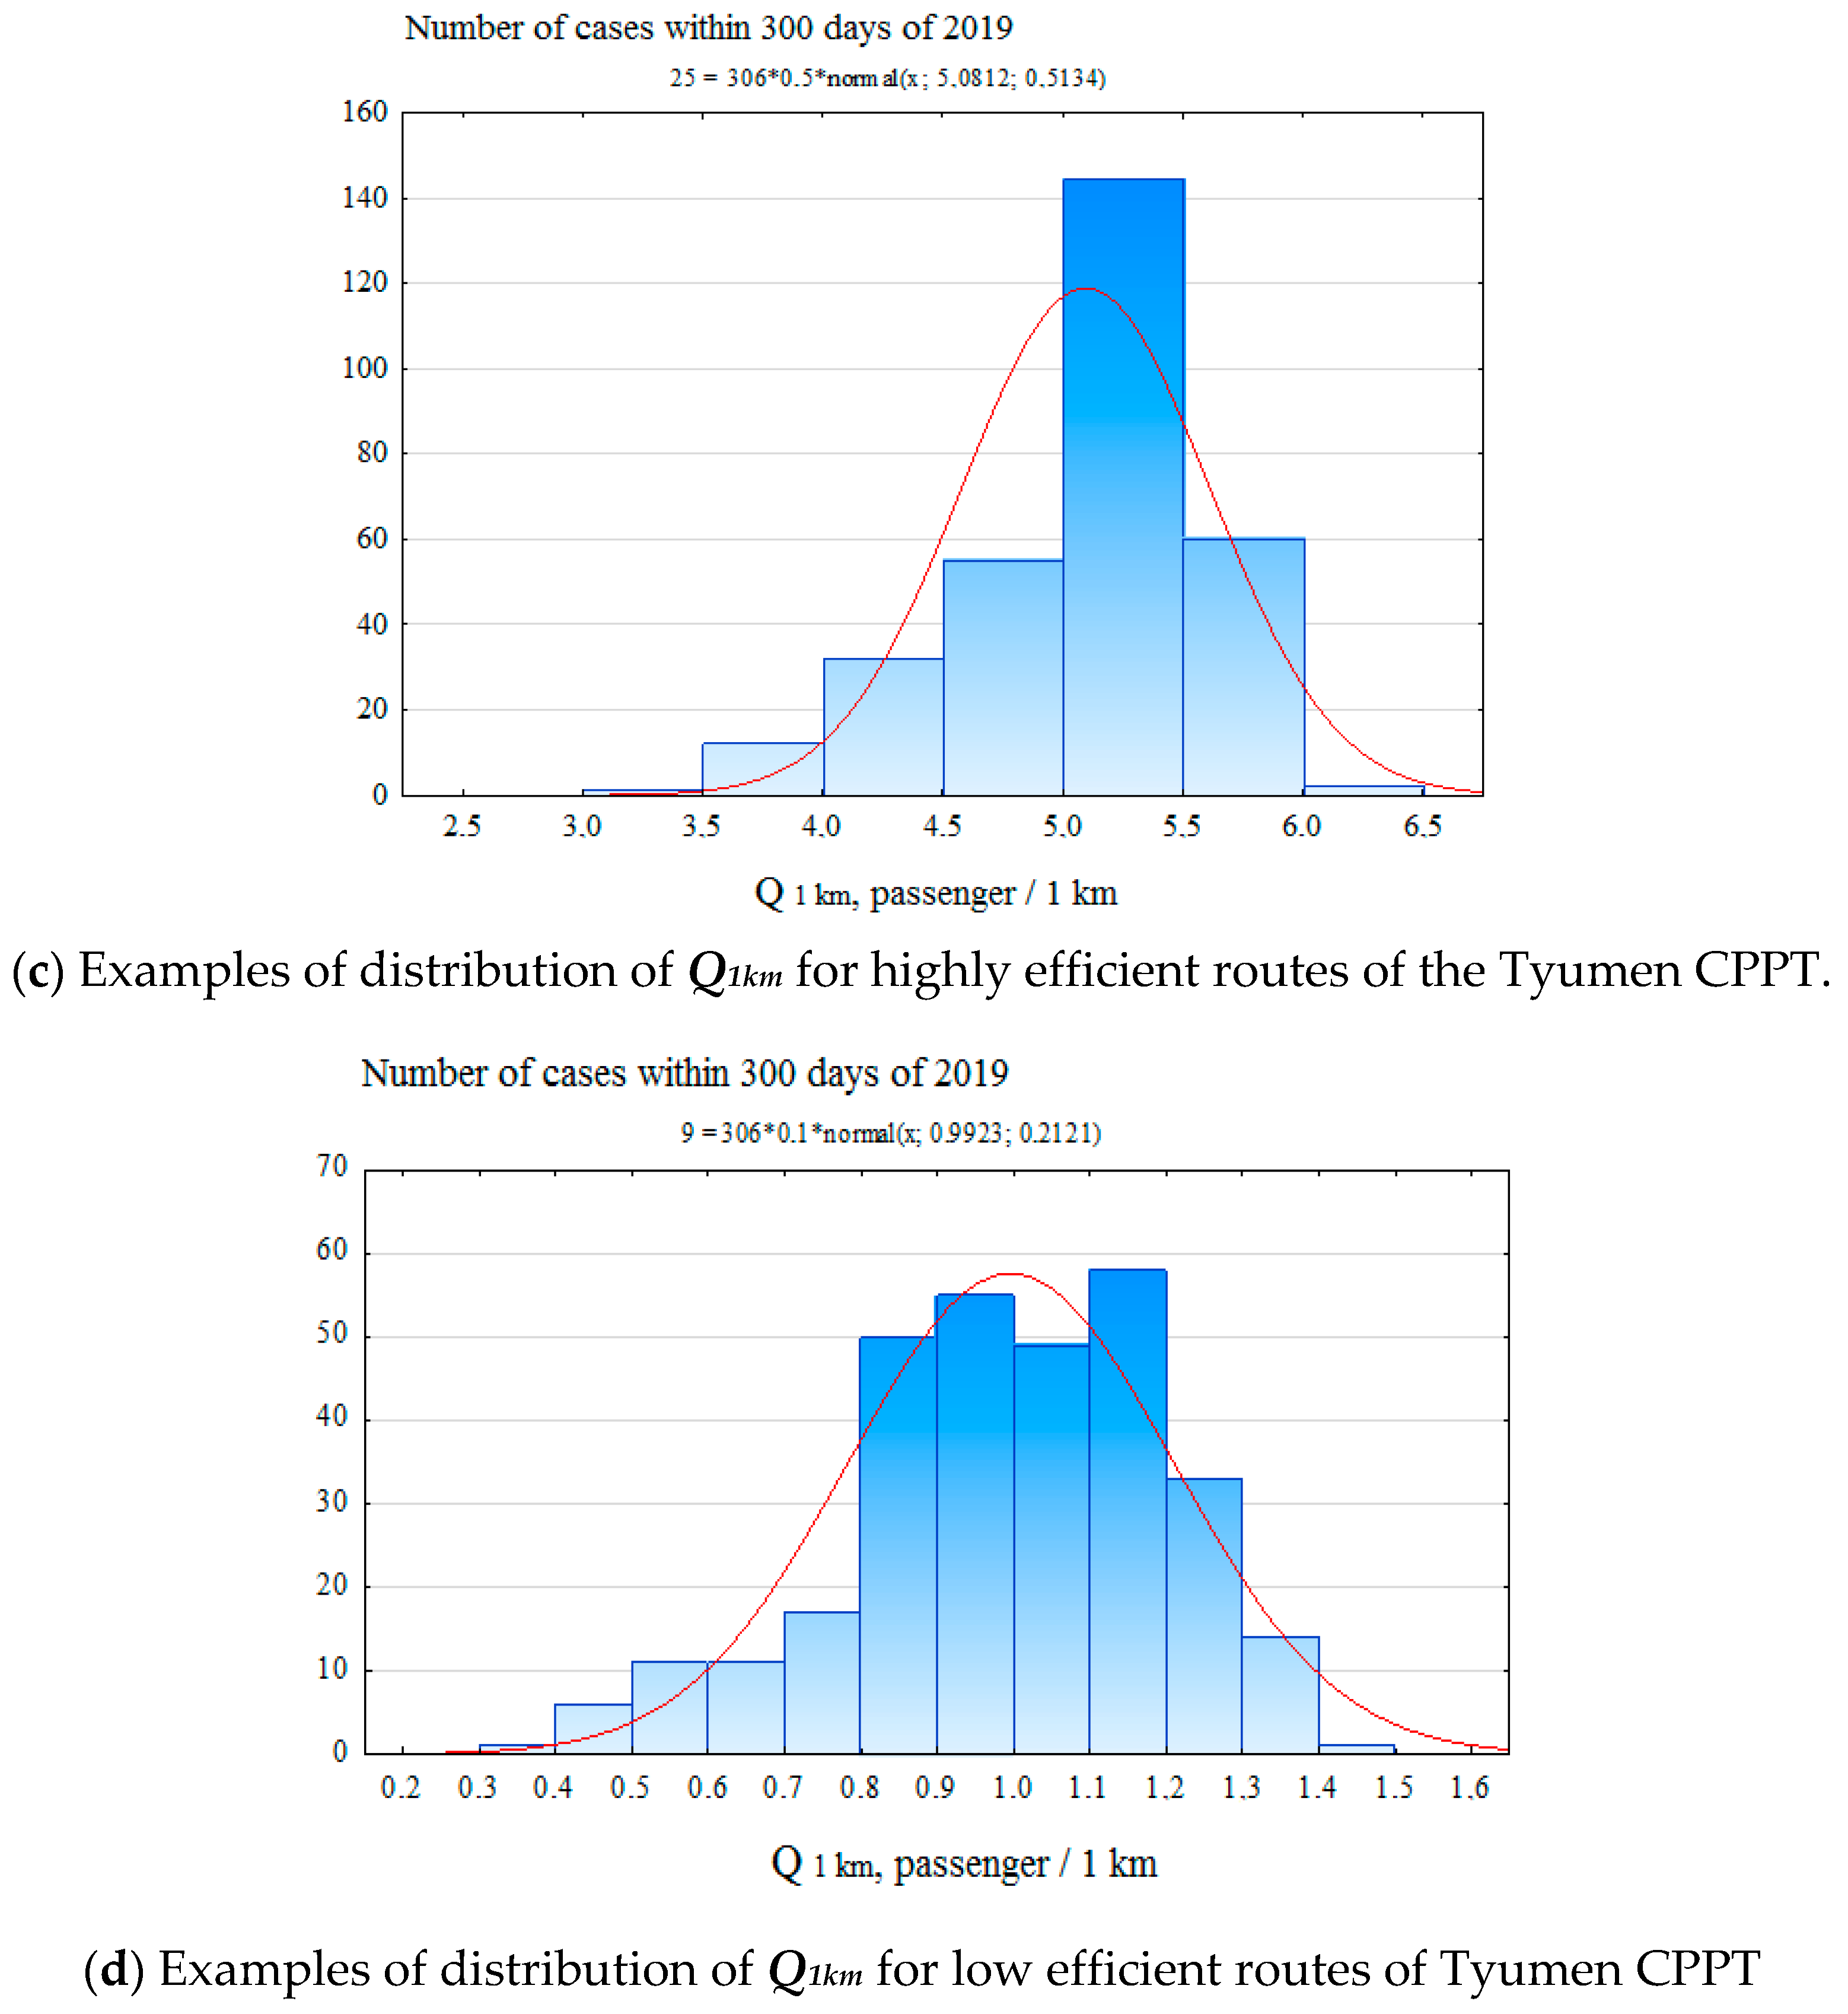
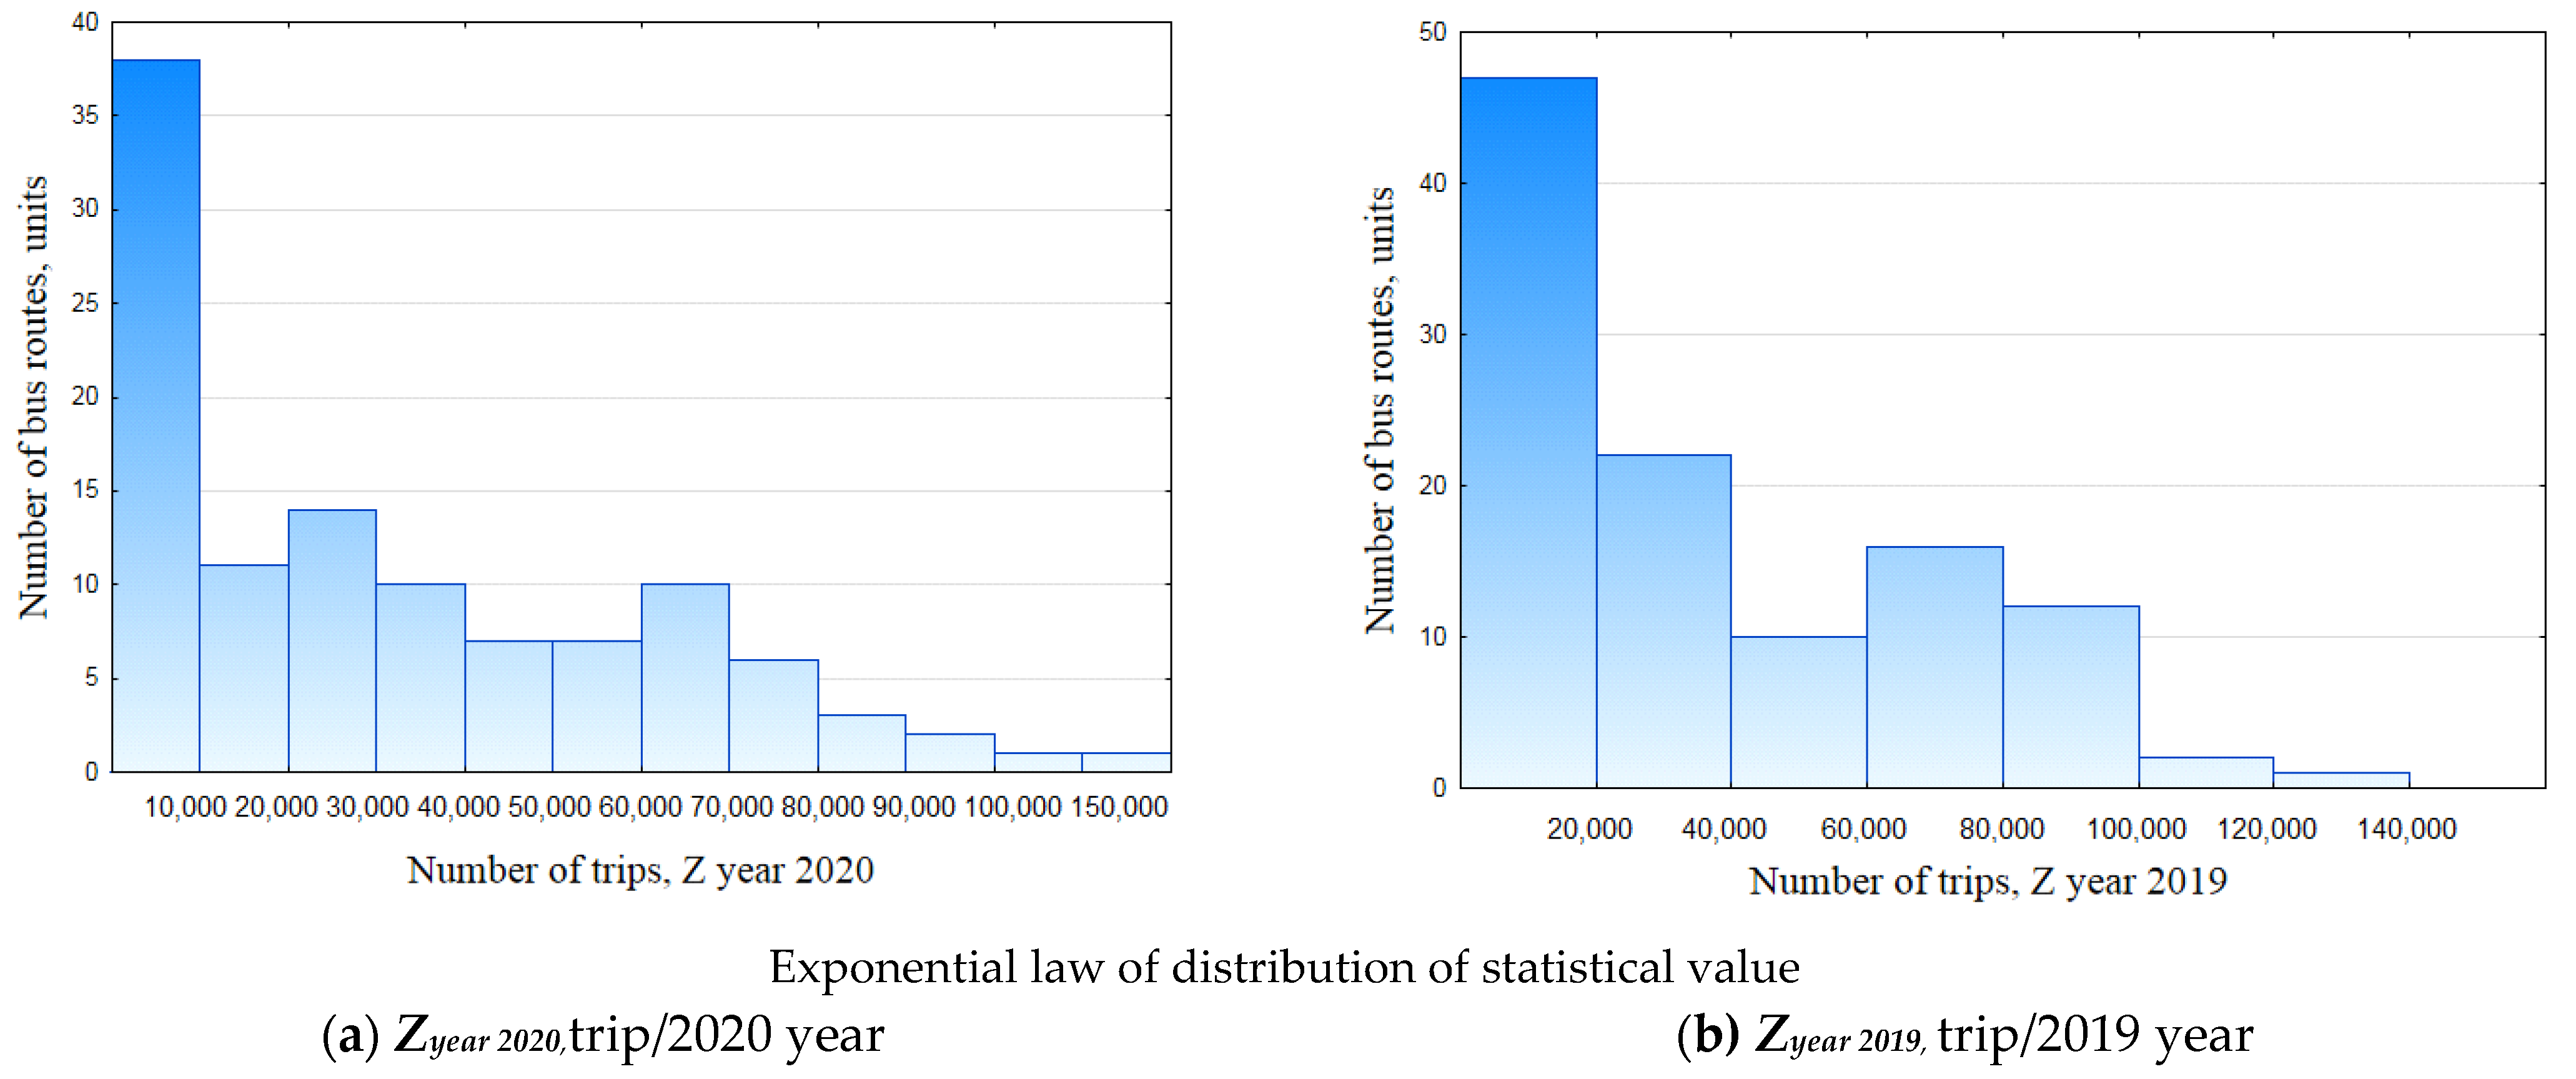
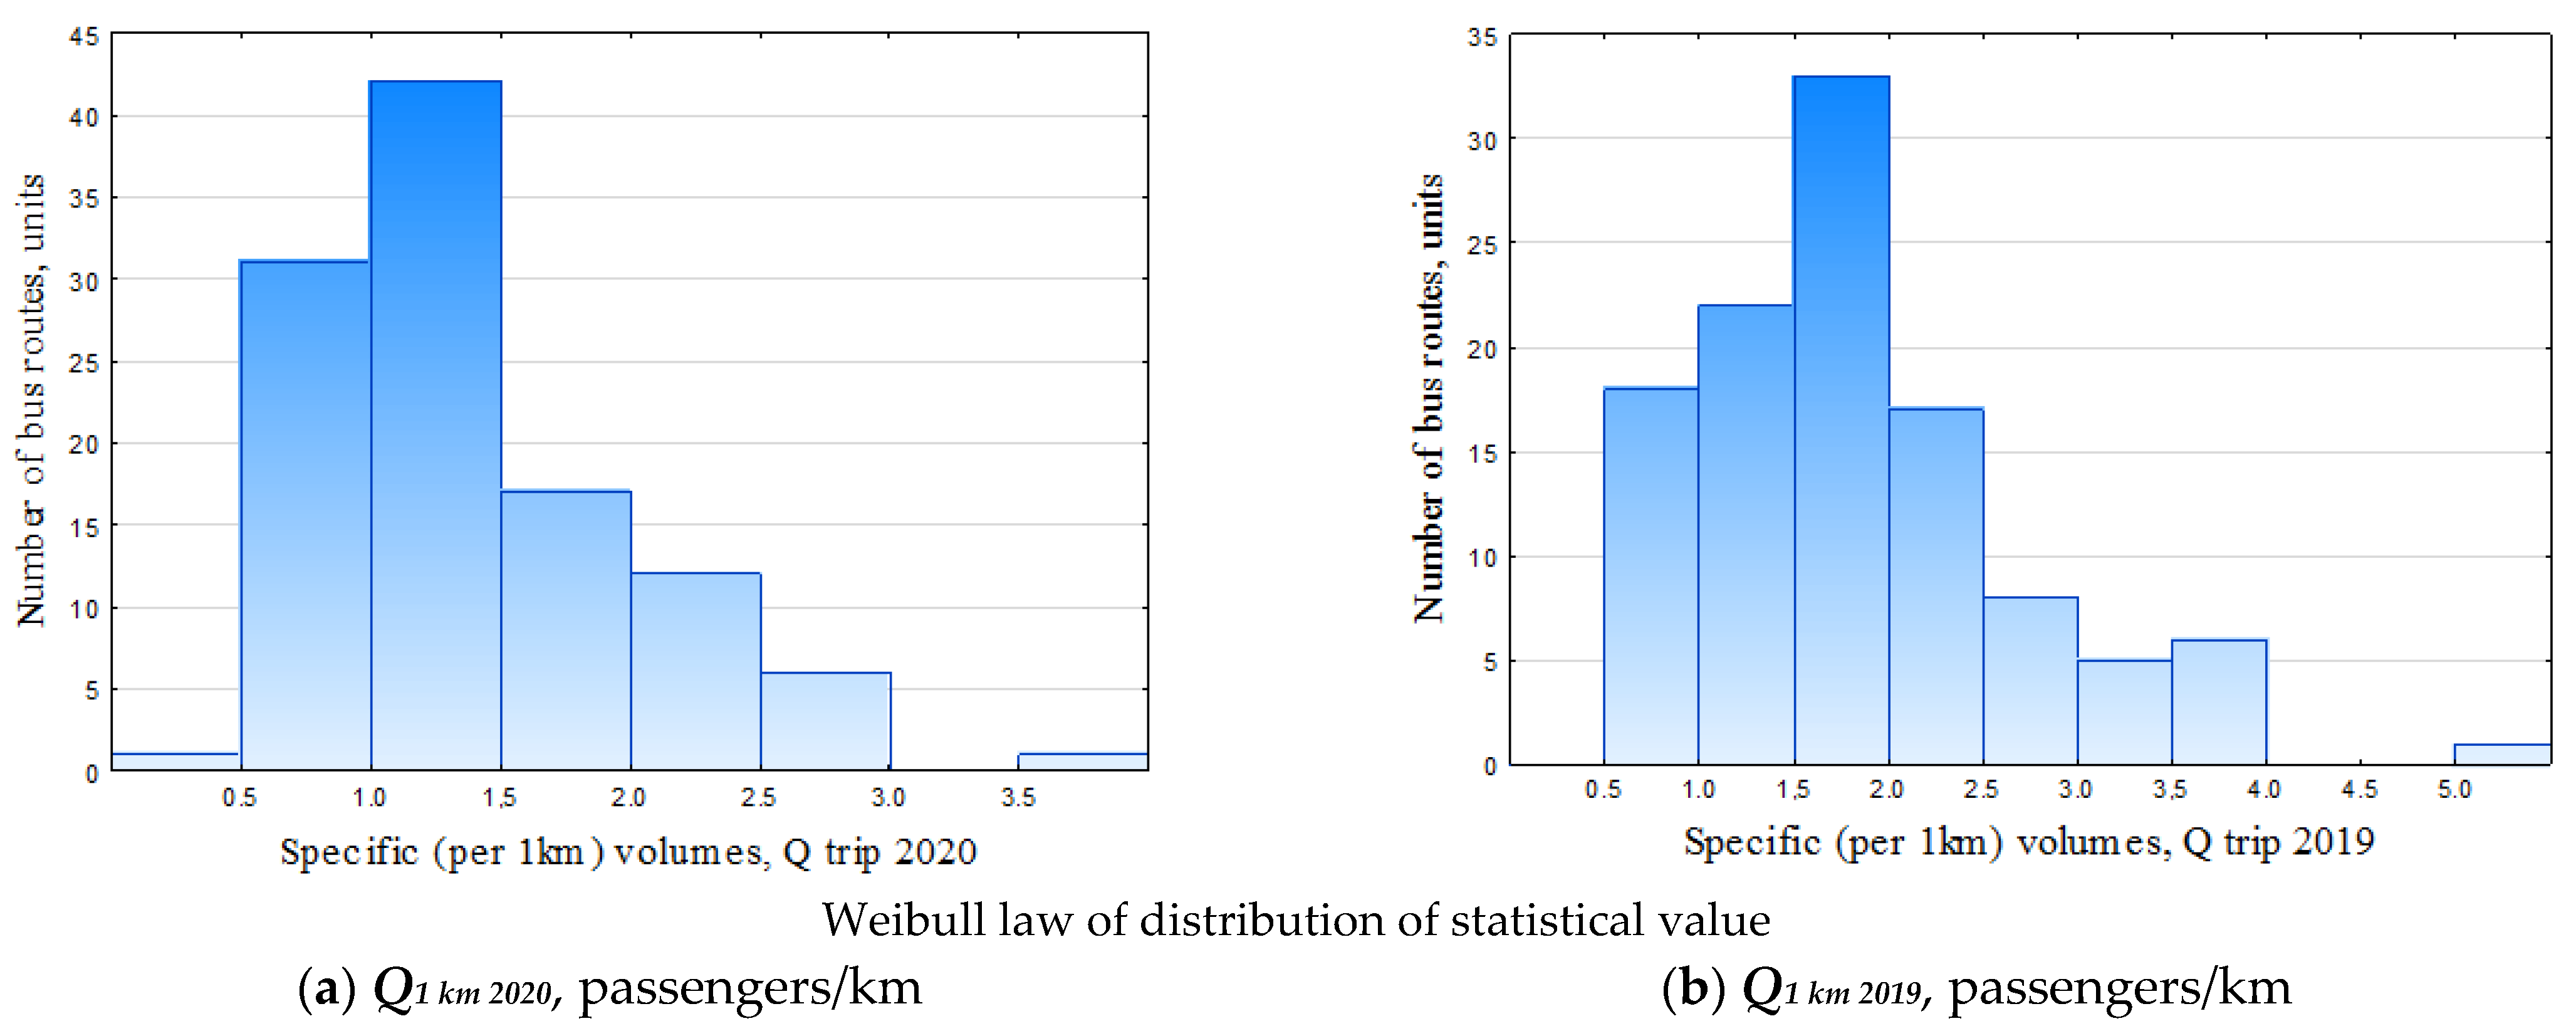
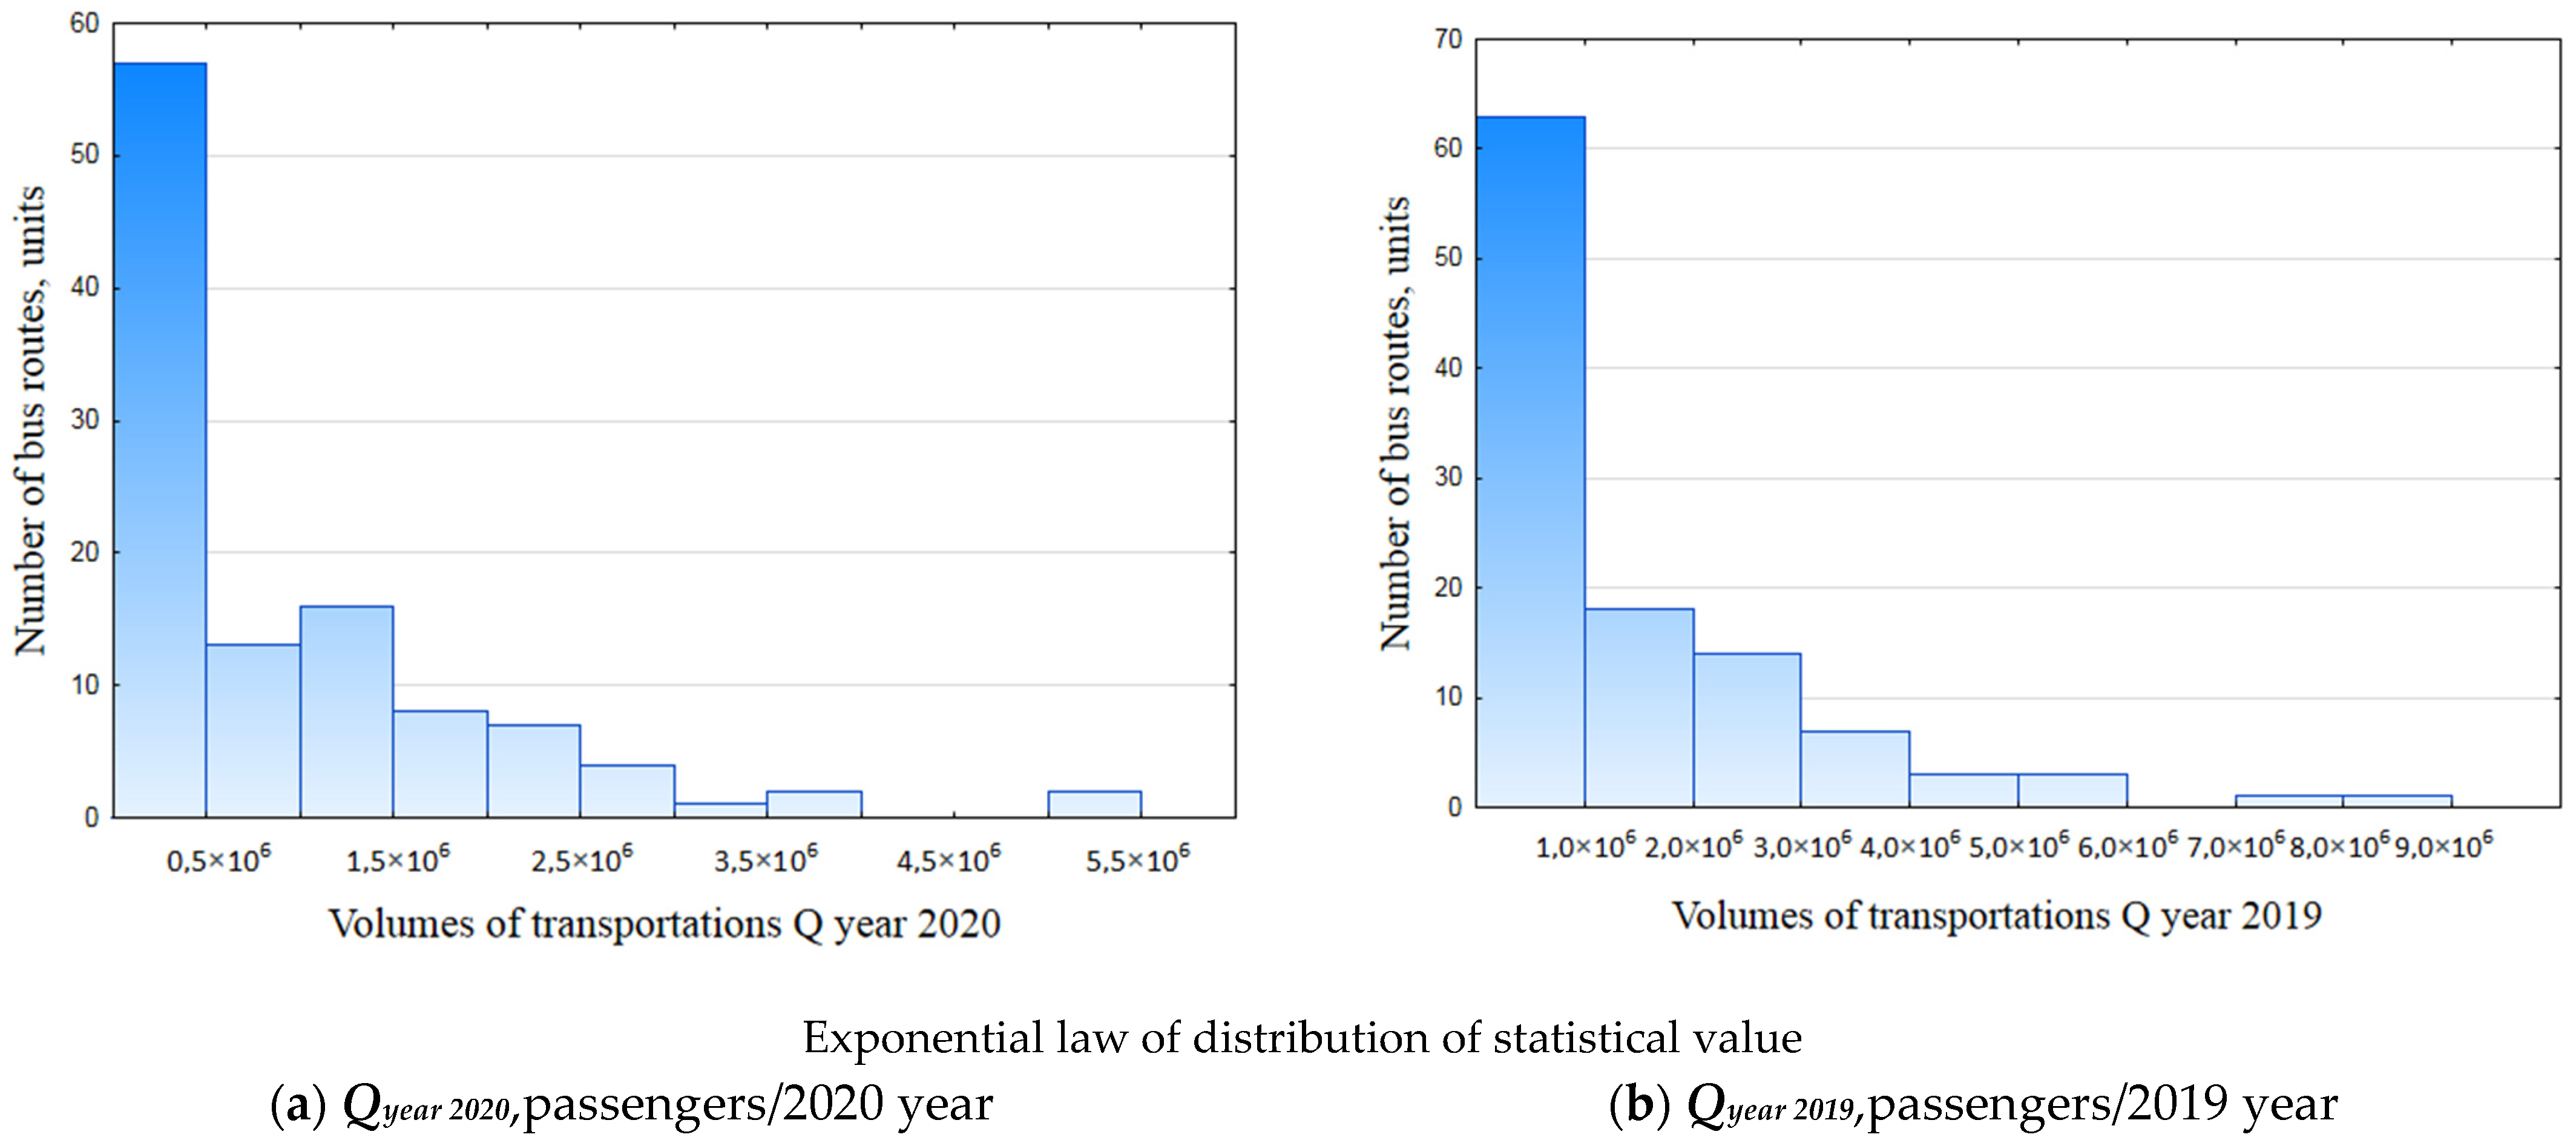
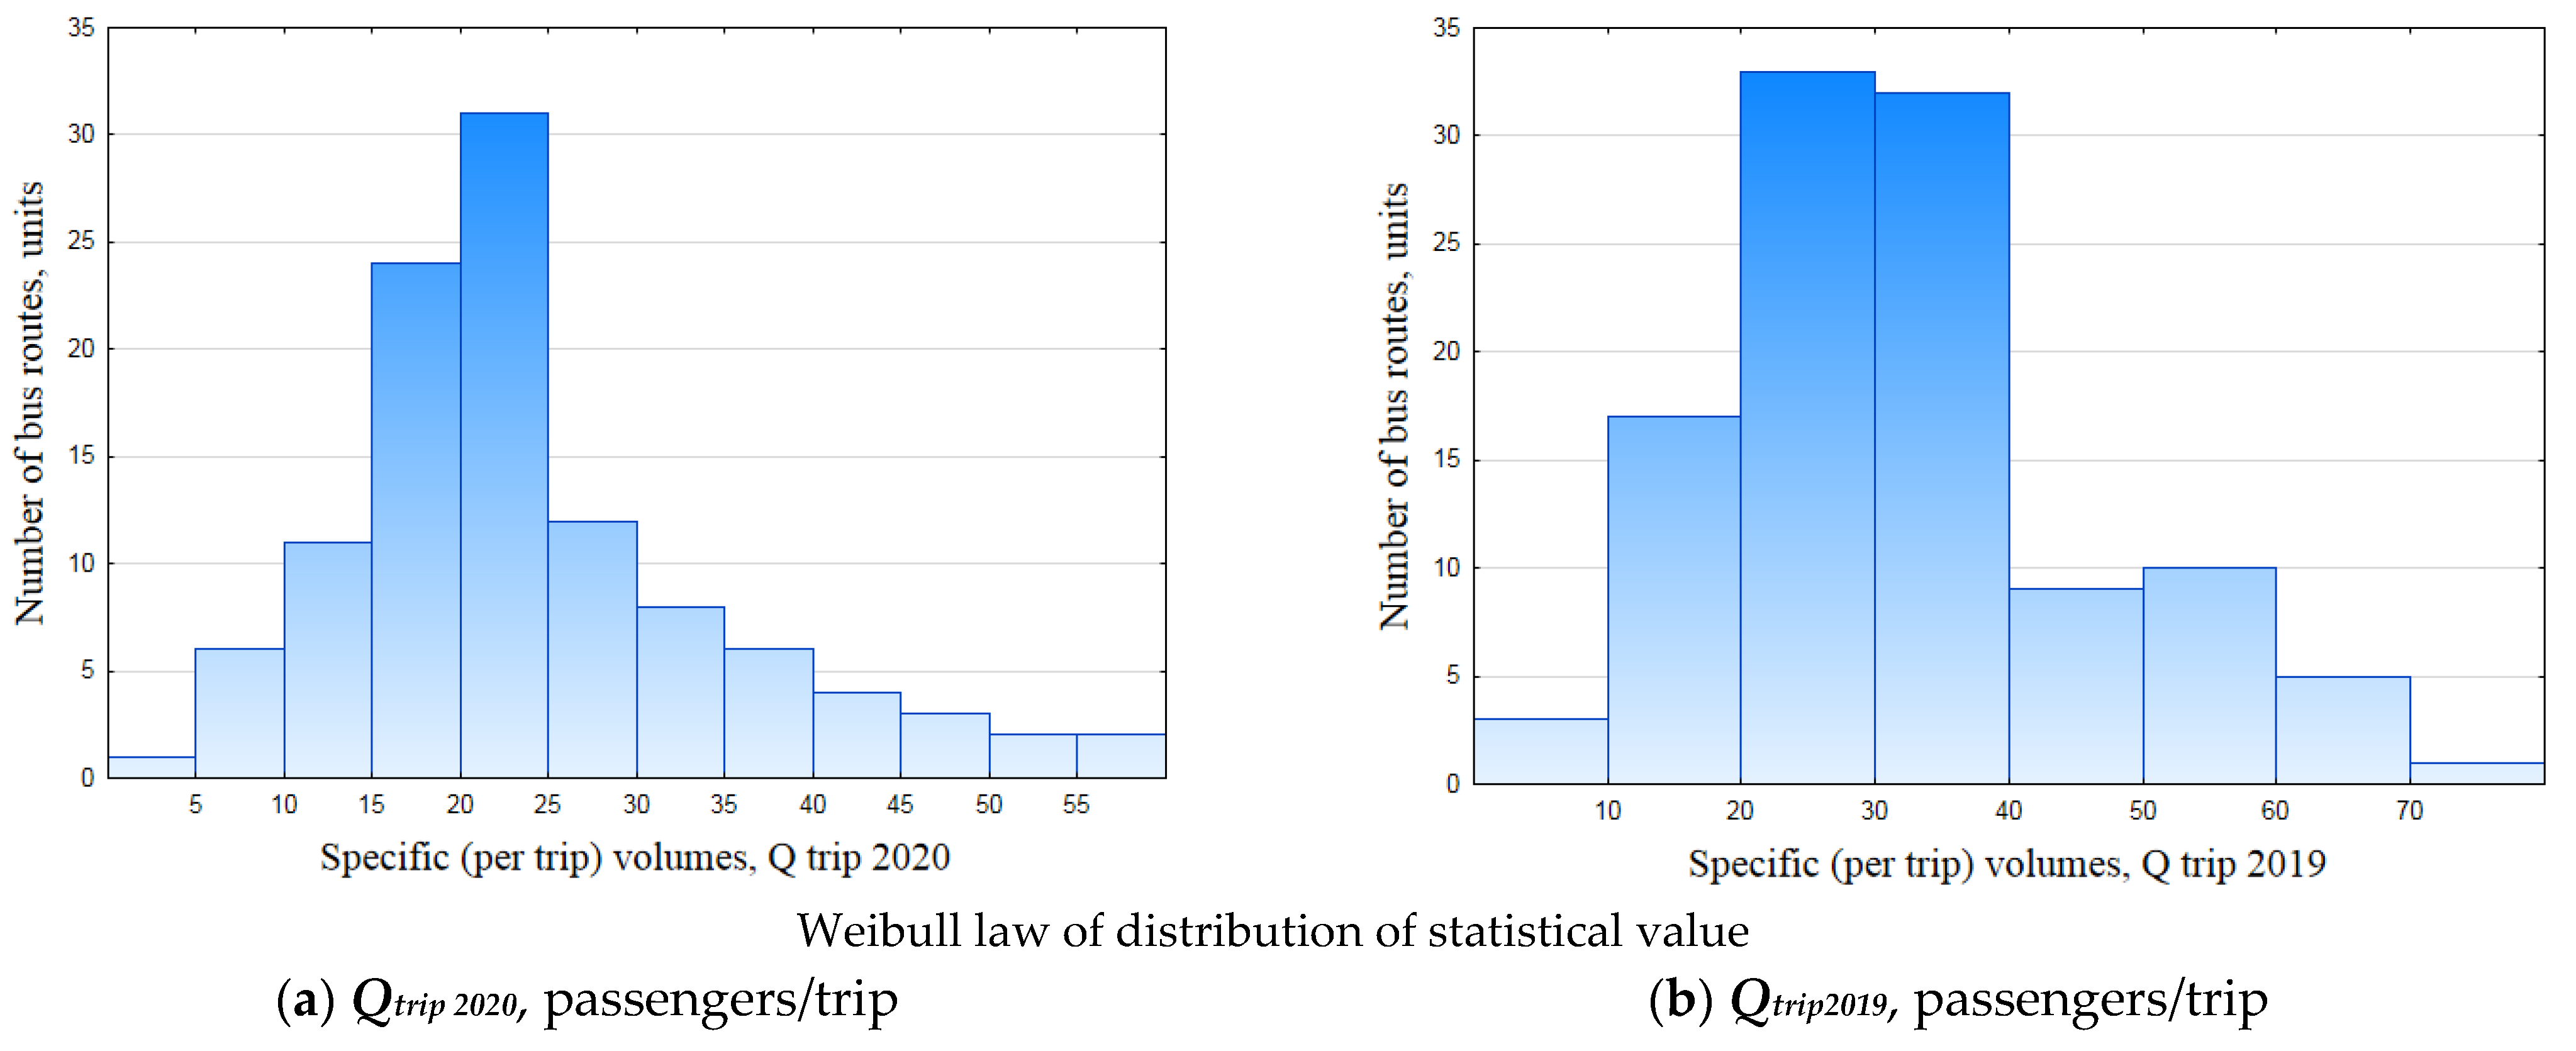
4.2.2. Statistical Distribution of Values of Parameters of Tyumen CPPT Transportation Process in Different Routes in 2020 and 2019
5. Methodology of the Evaluation of Stress-Factor Impacts on the Structural Sustainability of the City CPPT Routing System
- 1.1.
- Gathering and processing of information about Qi 2019 for i-th routes (totally 110 CCPT routes).
- 1.2.
- Preparation for building a Pareto diagram in regards to a contribution of i-th route, to the general final passenger transportation volume results of 2019 Qi 2019.
- 1.2.1.
- Ranking of the Tyumen CPPT routes (totally 110 routes) by characteristic «annual transportation volume of i-th route» Qi 2019.
- 1.2.2.
- Rationing of the Y-axis–calculation of share of i-th route contribution to the final passenger transportation volume result of 2019 (Qi 2019 = 150.3 million. passengers/year).
- 1.2.3.
- Validation of calculations by test .
- 1.2.4.
- Rationing of X-axis–calculation of share of 1 statistically average CPPR route out of 110.
- 1.3.
- Formation of Pareto-distribution–localization of experimental points for building of Pareto distribution curve by determination of values (Xi; Yi) for each Tyumen CPPT route (2019) on a coordinate system.
- 1.4.
- ABC-analysis–extraction on the Pareto-diagram of zones of Yi values, corresponding to the first 10, first 20, first 40, last 40 (61–100), last 20 (81–100), last 10 (91–100) percentiles of Xi values.
- 1.5.
- Analysis of results–formulation of the conclusion about contributions of different CPPT routes to general final results Q2019 = 150.3 million passengers/year.
- 1.6.
- Stages 1.1…1.4 repeat for another two time periods of 2019–for Q04–06 2019; Q04 2019.
- 1.7.
- Stages 1.1…1.5 repeat for data of 2020–for Q2020; Q04–06 2020; Q04 2020.
6. Gathering and Analysis of Experimental Data, Necessary for Evaluation of Change of the CPPT Routing System Structure in COVID-19 Conditions
7. Results of Research and Discussion
7.1. Evaluation of Structural Sustainability of Tyumen CPPT Routing System
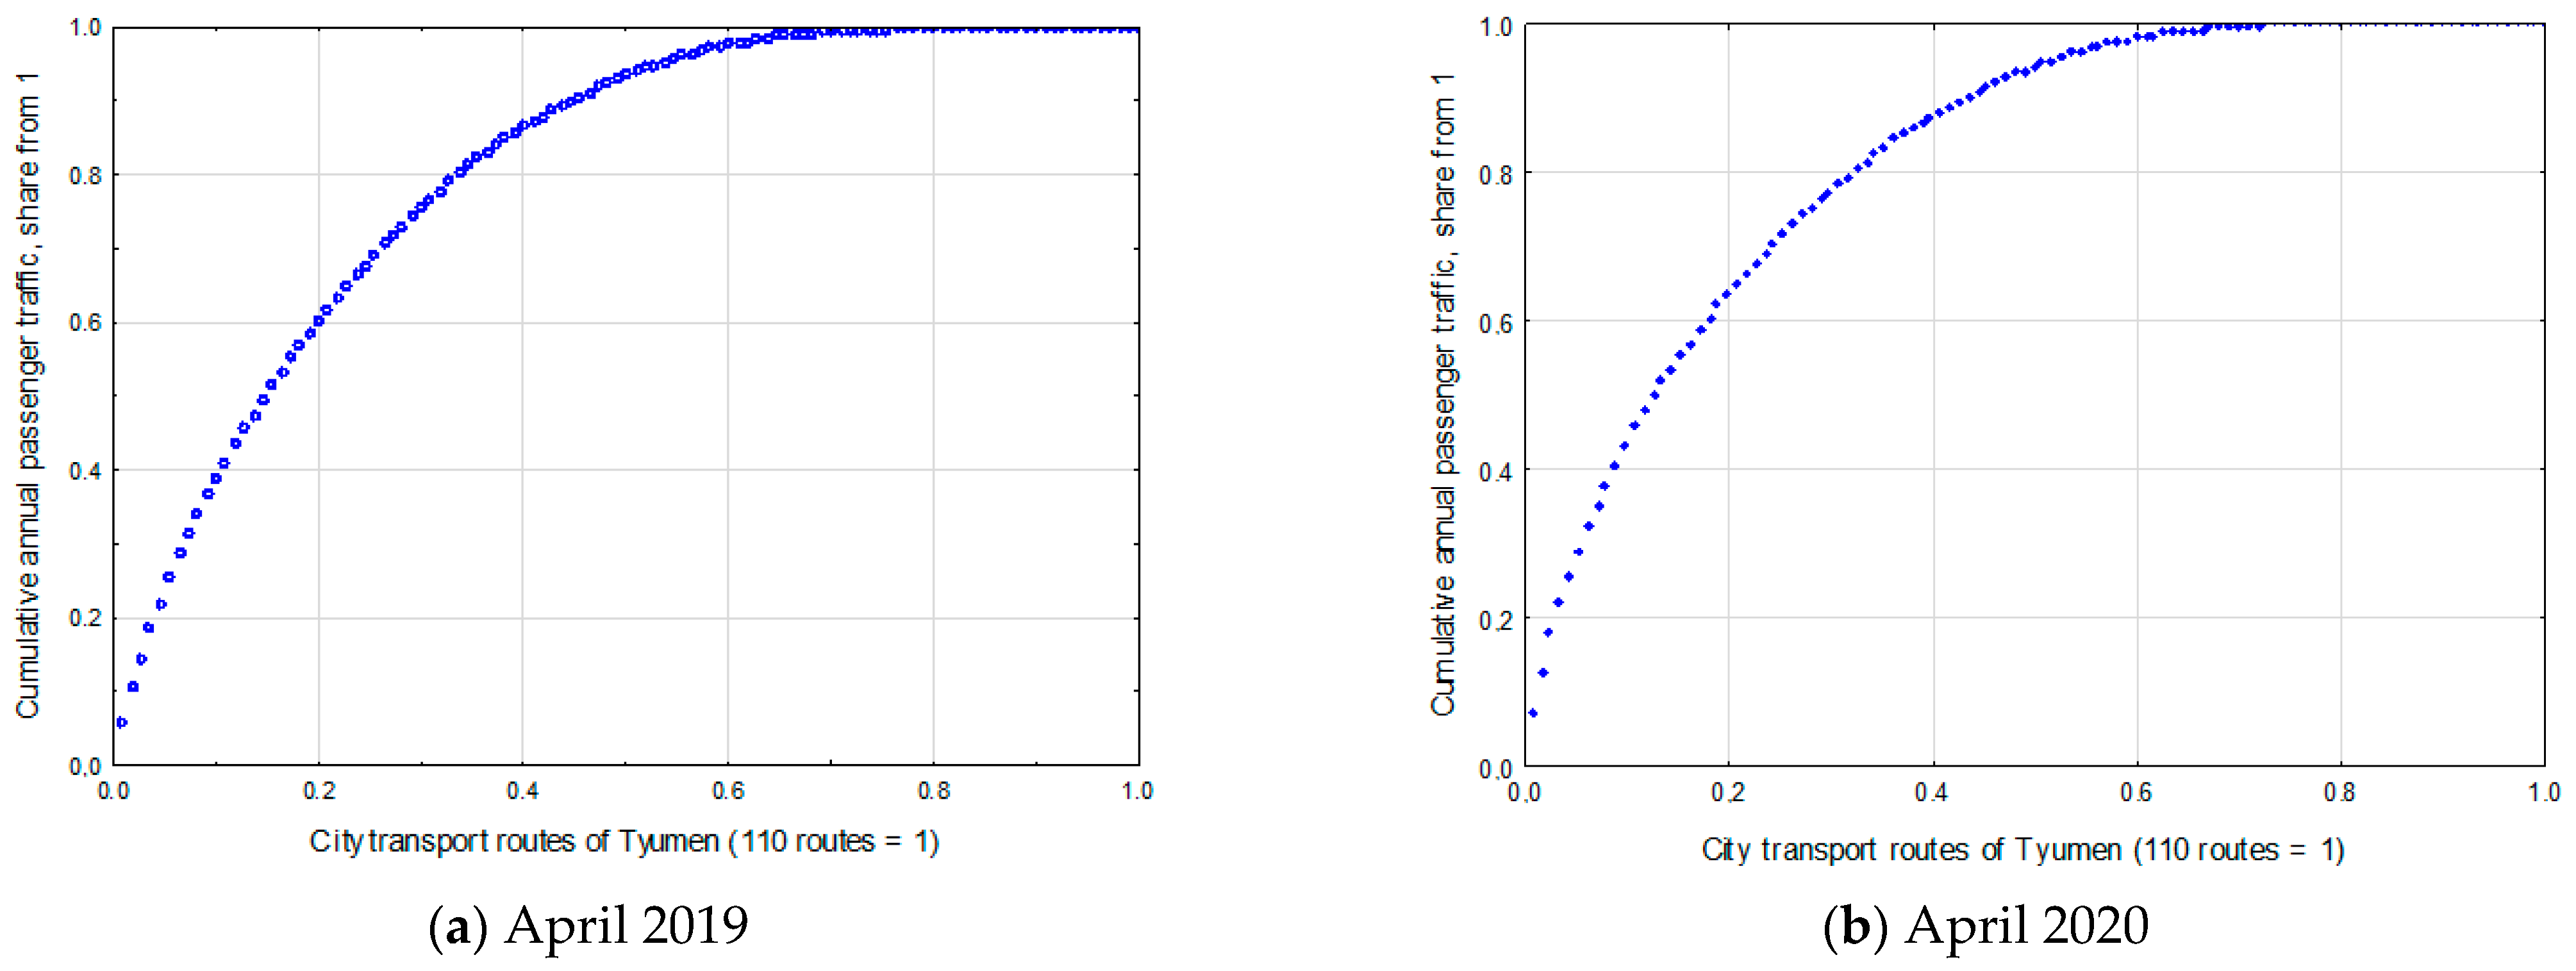
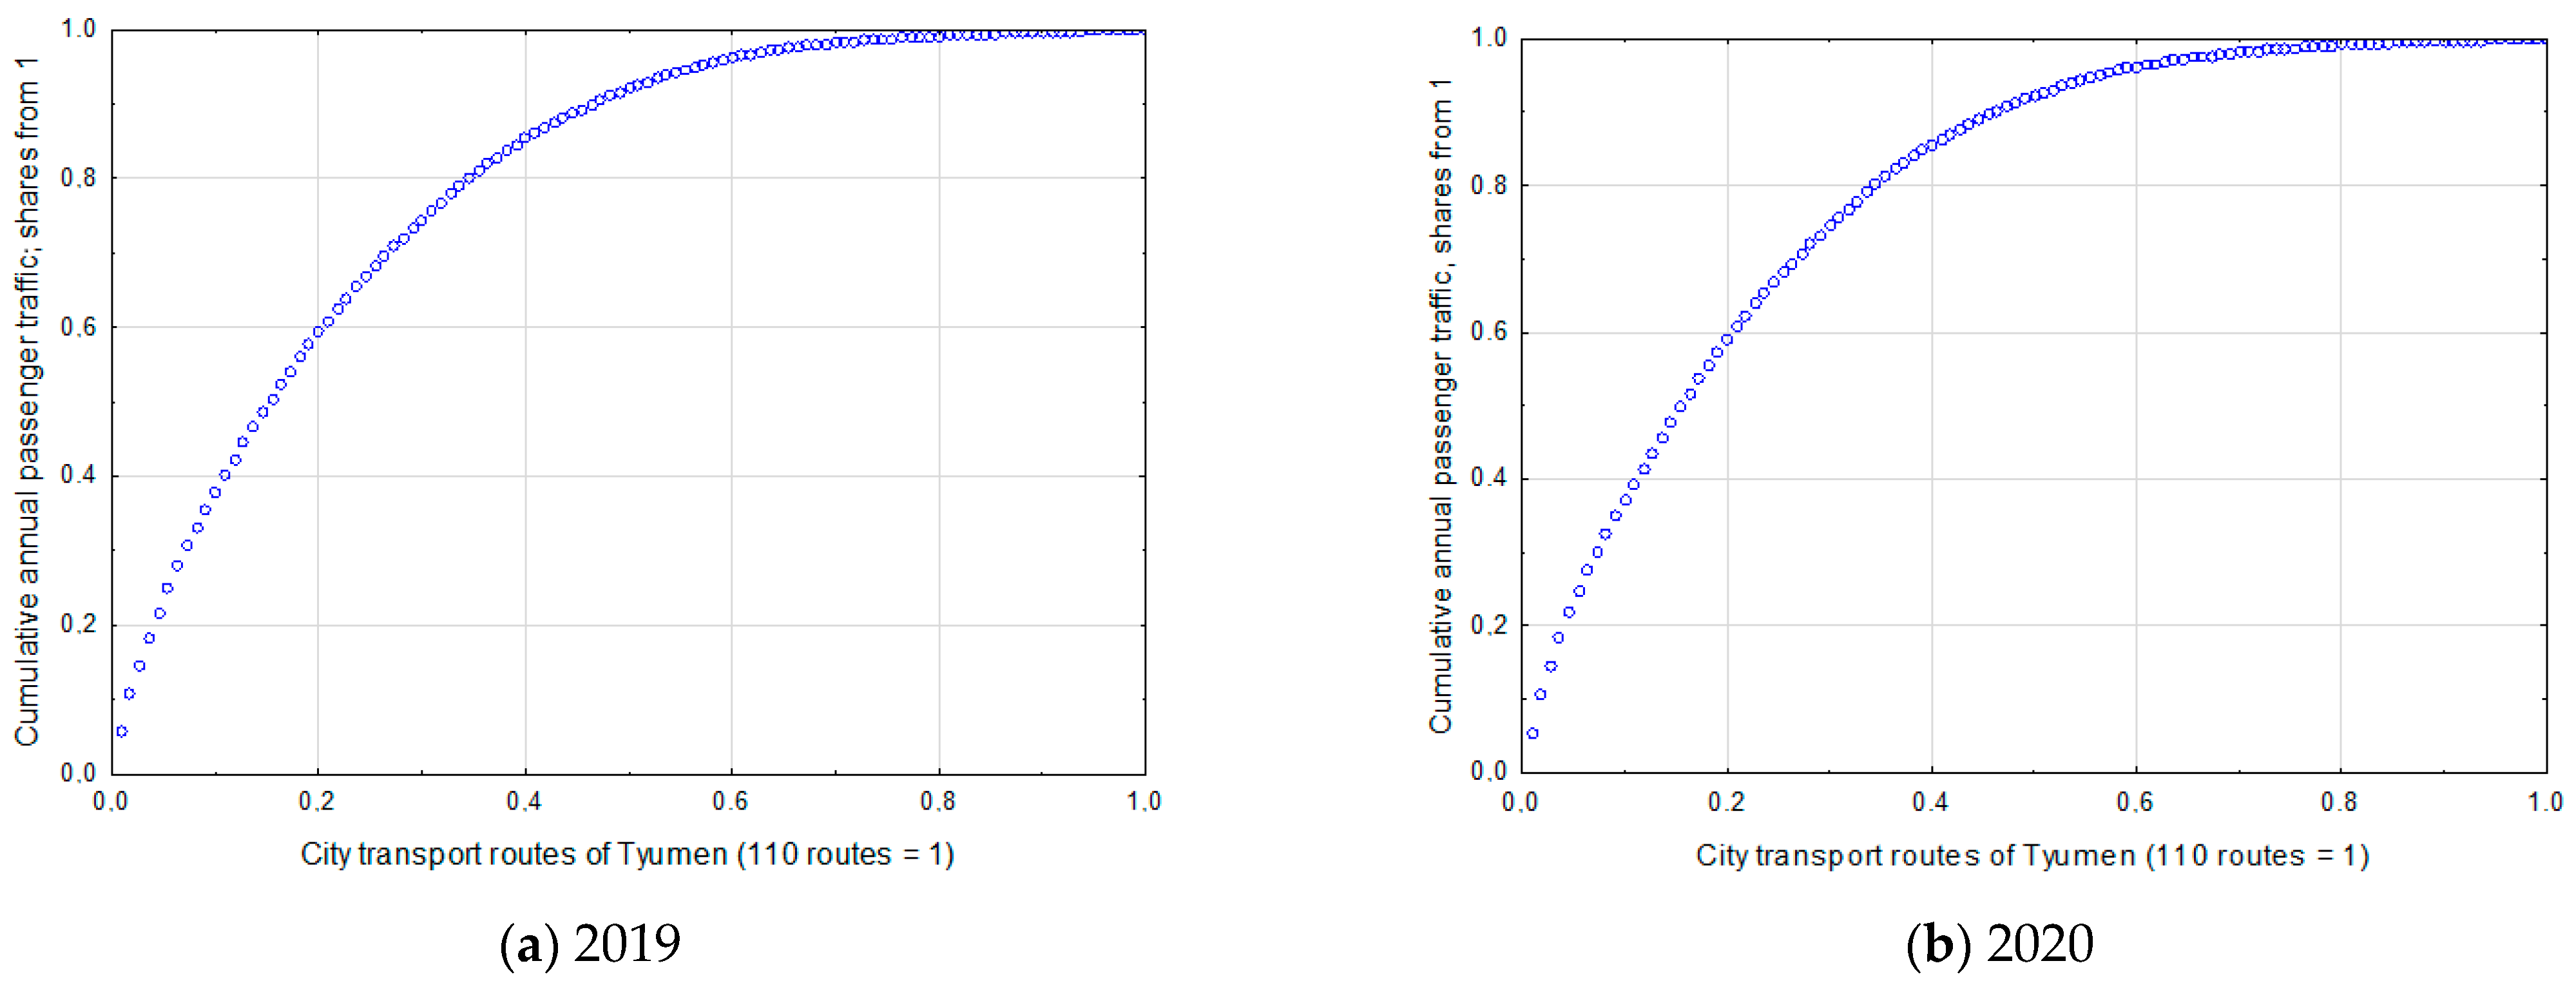
7.1.1. Pareto Analysis of Contribution of Different CPPT Routes into Annual (12 Months) General Results
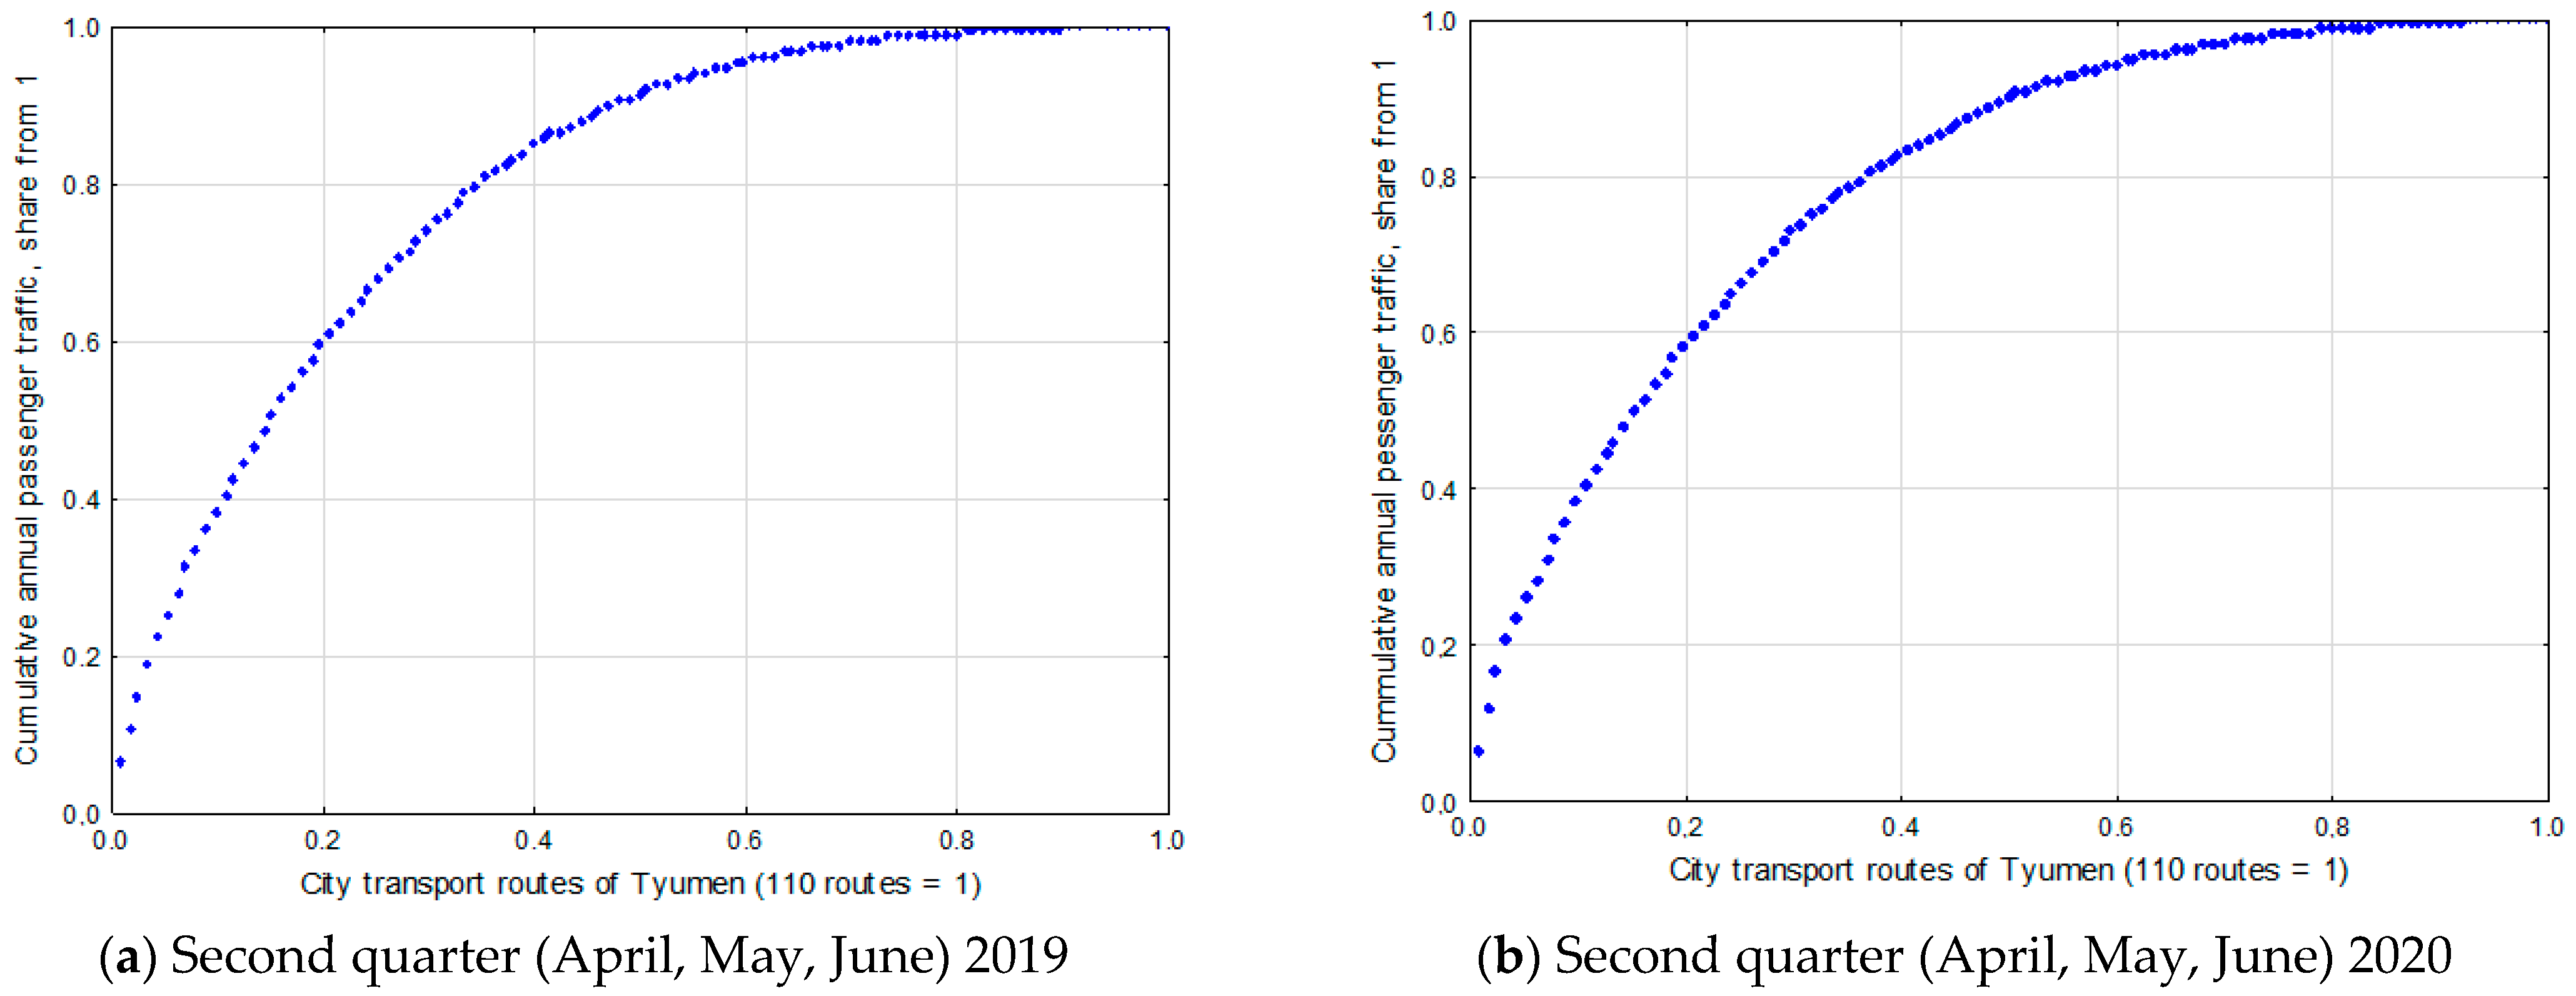
7.1.2. Pareto Analysis of the Contribution of Different CCPT Routes into the General Results of the Second Year Quarter (April, May, June)
7.1.3. Pareto Analysis of the Contribution of Different CPPT Routes in Monthly (April) General Results
7.1.4. Results from Evaluating the Structural Sustainability of Tyumen CPPT Routes System
- Despite the decrease of the general annual transportation volume, by 1.5-fold, the general structure of the distribution of the volume by routes remained the same. Two conditions indicate this. The first—features of the Pareto-diagrams (2019 and 2020) show unevenness of the contribution of different routes to the general annual results by transportation volume (Table 8 and Table 9). The second—practically unchanged composition of the best routes (ranks 1–5) and the worst routes (ranks 106–110) forming these total volumes.
- The sudden crisis of the Tyumen CPPT system, connected with a sharp decrease of the transport activity of citizens during the COVID-19 restrictions, had a serious impact on not only transportation volume, but also on the structure of the distribution by the routing system. The data in Table 12 and Table 13, and Figure 15, illustrate two observations. First, in April 2020, a quarter of the routes of Tyumen (25 out of 110) were not executed, and that was a direct consequence of catastrophic COVID-19 events in society. Second, there was a significant increase (in the conditions of the general decrease of volume Q04 2020 relative to Q04 2019 by four-fold) of the share of passenger transportation on routes, related to the first 20-th percentile.
- 3.
- Despite the crisis of the Tyumen CPPT system in April 2020, transportation organizers actively started to recover from the crisis in May–June 2020. As a result, by the end of the second quarter of 2020, the structure of the CPPT route system volume distribution approached to its initial numbers. At the same time, the return was provided by the municipality’s financial support for routes of the last 20th percentile (80.1–100 percentiles). If there had been no support, the distribution of transportation volume would likely not have returned to the initial structure.
- 4.
- Consequently, despite the COVID-crisis of 2020, the Tyumen CPPT system could be characterized as structurally sustainable. Structural sustainability is provided by municipal management. The reasons and motivations of management approaches can differ. One of the most important is a desire to avoid social unrest. The fact is that economic support provides sustainability of the Tyumen transport service system.
7.2. Discussion of Results
7.3. Results of Analysis of the Significance of the Impact of Stress-Factors on the Change of Total Transportation Volume Qi Using the Wilcoxon T-Test
8. Conclusions
Author Contributions
Funding
Institutional Review Board Statement
Informed Consent Statement
Data Availability Statement
Acknowledgments
Conflicts of Interest
References
- Osterwalder, A.; Pigneur, Y. Business Model Generation: A Handbook for Visionaries, Game Changers, and Challengers; John Wiley & Sons Inc.: Hoboken, NJ, USA, 2010; p. 281. [Google Scholar]
- Schwab, K.; Malleret, T. COVID-19. The Great Reset; World Economic Forum: Cologny, Geneva, 2020; p. 212. [Google Scholar]
- UNCTAD World Investment Report 2020. Available online: http://www.oecd.org/coronavirus/policy-responses/covid-19-and-global-capital-flows-2dc69002/ (accessed on 10 March 2021).
- Ortega, A. European Dialogue. Coronavirus: Trends and Landscapes for the Aftermath. 2020. Available online: http://www.eedialog.org/en/2020/05/17/coronavirus-trends-and-landscapes-for-the-aftermath/ (accessed on 12 June 2021).
- ICAO COVID-19 Air Traffic Dashboard. Available online: https://www.icao.int/sustainability/Pages/COVID-19-Air-Traffic-Dashboard.aspx (accessed on 12 March 2021).
- ICAO Economic Impact Analysis of COVID-19 on Civil Aviation. Available online: https://www.icao.int/sustainability/Pages/Economic-Im-pacts-of-COVID-19.aspx (accessed on 12 March 2021).
- Andara, R.; Ortego-Osa, J.; Gómez-Caicedo, M.I.; Ramírez-Pisco, R.; Navas-Gracia, L.M.; Vásquez, C.L.; Gaitán-Angulo, M. Behavior of Traffic Congestion and Public Transport in Eight Large Cities in Latin America during the COVID-19 Pandemic. Appl. Sci. 2021, 11, 4703. [Google Scholar] [CrossRef]
- Gudmundsson, H.; Hall, R.P.; Marsden, G.; Zietsman, J. Sustainable Transportation. Indicators, Frameworks, and Performance Management; Springer: Berlin/Heidelberg, Germany, 2016; p. 304. [Google Scholar] [CrossRef]
- Rossi, E.; Balsa-Barreiro, J. The future of work in the post-COVID-19 world. Econ. Political Wkly. 2020, 55, 23–26. [Google Scholar]
- Coombes, P.H.; Nicholson, J.D. Business models and their relationship with marketing: A systematic literature review. Ind. Mark. Manag. 2013, 42. [Google Scholar] [CrossRef]
- Zografos, K.G.; Androutsopoulos, K.N.; Sihvola, T. A methodological approach for developing and assessing business models fo flexible transport systems. Transportation 2008, 35, 777–795. [Google Scholar] [CrossRef]
- Wirtz, B.W.; Pistoia, A.; Ullrich, S.; Göttel, V. Business Models: Origin, Development and Future Research Perspectives. Long Range Plan. 2015, 49. [Google Scholar] [CrossRef]
- Emerson, D.; Mulley, C.; Bliemer, M.C.J. A theoretical analysis of business models for urban public transport systems, with comparative reference to a Community Franchise involving Individual Line Ownership. Res. Transp. Econ. 2016, 59. [Google Scholar] [CrossRef]
- Nguyen, D.D.; Rohács, J.; Rohács, D.; Boros, A. Intelligent Total Transportation Management System for Future Smart Cities. Appl. Sci. 2020, 10, 8933. [Google Scholar] [CrossRef]
- Burinskienė, A. Designing a Multi-Stage Transport System Serving e-Commerce Activity. Sustainability 2021, 13, 6154. [Google Scholar] [CrossRef]
- Villa, R.; Monzón, A. A Metro-Based System as Sustainable Alternative for Urban Logistics in the Era of E-Commerce. Sustainability 2021, 13, 4479. [Google Scholar] [CrossRef]
- De Andres Gonzalez, O.; Koivisto, H.; Mustonen, J.M.; Keinänen-Toivola, M.M. Digitalization in Just-In-Time Approach as a Sustainable Solution for Maritime Logistics in the Baltic Sea Region. Sustainability 2021, 13, 1173. [Google Scholar] [CrossRef]
- Randall, A. Resource Scarcity and Sustainability—The Shapes Have Shifted but the Stakes Keep Rising. Sustainability 2021, 13, 5751. [Google Scholar] [CrossRef]
- Verity, R.; Okell, L.C.; Dorigatti, I.; Winskill, P.; Whittaker, C.; Imai, N. Estimates of the Severity of Coronavirus Disease 2019: A Model-Based Analysis. Lancet Infect. Dis. 2020, 20, 669–677. [Google Scholar] [CrossRef]
- Grosche, G.; Bolivar, A. EPIDEM: A Mobile Application to Contain Coronavirus Disease 2019. E-Health Telecommun. Syst. Netw. 2020, 9, 49–59. [Google Scholar] [CrossRef]
- Xu, R.; Lei, L.; Qin, R.; Huang, Z.; Chou, K. The Topological Entropy Mechanism of Coronavirus Disease 2019 (COVID-19). Nat. Sci. 2020, 12, 737–742. [Google Scholar] [CrossRef]
- Battegay, M.; Kuehl, R.; Tschudin-Sutter, S.; Hirsch, H.H.; Widmer, A.F.; Neher, R.A. 2019-novel Coronavirus (2019-nCoV): Estimating the case fatality rate—A word of caution. Swiss Med Wkly. 2020, 150. [Google Scholar] [CrossRef] [PubMed]
- Arnold, V.I. Catastrophe theory. Dynamical systems–5. Itogi Nauki i Tekhniki. Ser. Sovrem. Probl. Mat. Fund. Napr. 1986, 5, 219–277. [Google Scholar]
- Arnold, V.I. Catastrophe Theory, 3rd ed.; Springer: Berlin, Germany, 1992. [Google Scholar]
- Ershkov, S.V.; Rachinskaya, A. A new approximation of mean—Time trends for the second wave of COVID-19 pandemic evolving in key six countries. Nonlinear Dyn. 2021. [Google Scholar] [CrossRef]
- Faranda, D.; Alberti, T.; Arutkin, V.; Lembo, V.; Lucarini, V. Interrupting vaccination policies can greatly spread SARS-CoV-2 and enhance mortality from COVID-19 disease: The Astra Zeneca case for France and Italy. Chaos An. Interdiscip. J. Nonlinear Sci. 2021, 31, 041105. [Google Scholar] [CrossRef]
- Dong, E.; Du, H.; Gardner, L. An interactive web-based dashboard to track COVID-19 in real time. Lancet Infect. Dis. 2020, 20, 533–534. [Google Scholar] [CrossRef]
- Piazzola, J.; Bruch, W.; Desnues, C.; Parent, P.; Yohia, C.; Canepa, E. Influence of Meteorological Conditions and Aerosol Properties on the COVID-19 Contamination of the Population in Coastal and Continental Areas in France: Study of Offshore and Onshore Winds. Atmosphere 2021, 12, 523. [Google Scholar] [CrossRef]
- Wang, L.; Wang, J.; Fang, C. Assessing the Impact of Lockdown on Atmospheric Ozone Pollution Amid the First Half of 2020 in Shenyang, China. Int. J. Environ. Res. Public Health 2020, 17, 9004. [Google Scholar] [CrossRef]
- Anil, I.; Alagha, O. Source Apportionment of Ambient Black Carbon during the COVID-19 Lockdown. Int. J. Environ. Res. Public Health 2020, 17, 9021. [Google Scholar] [CrossRef]
- Sakharov, A.S.; Zhukov, K. Study of an Air Curtain in the Context of Individual Protection from Exposure to Coronavirus (SARS-CoV-2) Contained in Cough-Generated Fluid Particles. Physics 2020, 2, 340–351. [Google Scholar] [CrossRef]
- Yu, X.; Wong, M.S.; Kwan, M.P.; Nichol, J.E.; Zhu, R.; Heo, J.; Chan, P.W.; Chin, D.C.W.; Kwok, C.Y.T.; Kan, Z. COVID-19 Infection and Mortality: Association with PM2.5 Concentration and Population Density—An Exploratory Study. ISPRS Int. J. Geo-Inf. 2021, 10, 123. [Google Scholar] [CrossRef]
- Yeprintsev, S.A.; Klepikov, O.V.; Shekoyan, S.V.; Zhigulina, E.V. Study of the Impact of Social and Environmental Factors on the Spread of Coronavirus Infection in Russian Regions. IOP Conf. Ser. Earth Environ. Sci. 2021, 688, 012007. [Google Scholar] [CrossRef]
- Cai, H. Sex difference and smoking predisposition in patients with COVID-19. Lancet Respir. Med. 2020, 8, e20. [Google Scholar] [CrossRef]
- Chaudhry, R.; Dranitsaris, G.; Mubashir, T.; Bartoszko, J.; Riazi, S. A country level analysis measuring the impact of government actions, country preparedness and socioeconomic factors on COVID-19 mortality and related health outcomes. EClinicalMedicine 2020, 25, 100464. [Google Scholar] [CrossRef]
- Chan, E.Y.Y.; Huang, Z.; Lo, E.S.K.; Hung, K.K.C.; Wong, E.L.Y.; Wong, S.Y.S. Sociodemographic Predictors of Health Risk Perception, Attitude and Behavior Practices Associated with Health-Emergency Disaster Risk Management for Biological Hazards: The Case of COVID-19 Pandemic in HongKong, SAR China. Int. J. Environ. Res. Public Health 2020, 17, 3869. [Google Scholar] [CrossRef] [PubMed]
- Zhao, P.; Zhang, N.; Li, Y.A. Comparison of Infection Venues of COVID-19 Case Clusters in Northeast China. Int. J. Environ. Res. Public Health 2020, 17, 3955. [Google Scholar] [CrossRef] [PubMed]
- Pérez-Escoda, A.; Jiménez-Narros, C.; Perlado-Lamo-de-Espinosa, M.; Pedrero-Esteban, L.M. Social Networks’ Engagement During the COVID-19 Pandemic in Spain: Health Mediavs. Healthcare Professionals. Int. J. Environ. Res. Public Health 2020, 17, 5261. [Google Scholar] [CrossRef]
- Nicola, M.; Alsafi, Z.; Sohrabi, C.; Kerwan, A.; Al-Jabir, A.; Iosifidis, C.; Agha, M.; Agha, R. The socio-economic implications of the coronavirus and COVID-19 pandemic: A review. Int. J. Surg. 2020, 78, 185–193. [Google Scholar] [CrossRef]
- Atalan, A. Is the lockdown important to prevent the COVID-19 pandemic? Effects on psychology, environment and economy–perspective. Ann. Med. Surg. 2020, 56, 38–42. [Google Scholar] [CrossRef] [PubMed]
- Chakraborty, I.; Maity, P. COVID-19 outbreak: Migration, effects on society, global environment and prevention. Sci. Total Environ. 2020, 728, 138882. [Google Scholar] [CrossRef] [PubMed]
- Kerimray, A.; Baimatova, N.; Ibragimova, O.; Bukenov, B.; Kenessov, B.; Plotitsyn, P.; Karaca, F. Assessing air quality changes in large cities during COVID-19 lockdowns: The impacts of traffic-free urban conditions in Almaty, Kazakhstan. Sci. Total Environ. 2020, 730, 139179. [Google Scholar] [CrossRef] [PubMed]
- Mahato, S.; Pal, S.; Ghosh, K.G. Effect of lockdown amid COVID-19 pandemic on air quality of the megacity Delhi, India. Sci. Total Environ. 2020, 730, 138984. [Google Scholar] [CrossRef] [PubMed]
- Dantas, G.; Siciliano, B.; França, B.B.; da Silva, C.M.; Arbilla, G. The impact of COVID-19 partial lockdown on the air quality of the city of Rio de Janeiro, Brazil. Sci. Total Environ. 2020, 729, 139085. [Google Scholar] [CrossRef]
- Brewer, N.T.; Chapman, G.B.; Gibbons, F.X.; Gerrard, M.; McCaul, K.D.; Weinstein, N.D. Meta-analysis of the relationship between risk perception and health behavior: The example of vaccination. Health Psychol. 2007, 26, 136–145. [Google Scholar] [CrossRef] [Green Version]
- Rafael, V.; Monzón, A. Mobility Restrictions and E-Commerce: Holistic Balance in Madrid Centre during COVID-19 Lockdown. Economies 2021, 9, 57. [Google Scholar] [CrossRef]
- Wrzus, C.; Hänel, M.; Wagner, J.; Neyer, F.J. Social network changes and life events across the life span: A meta-analysis. Psychol. Bull. 2013, 139, 53–80. [Google Scholar] [CrossRef]
- Liao, Q.; Wu, P.; Lam, W.W.T.; Cowling, B.J.; Fielding, R. Trajectories of public psycho-behavioural responses relating to influenza A(H7N9) over the winter of 2014–15 in Hong Kong. Psychol. Health 2019, 34, 162–180. [Google Scholar] [CrossRef]
- O’Neill, D.W.; Fanning, A.L.; Lamb, W.F.; Steinberger, J.K. A good life for all within planetary boundaries. Nat. Sustain. 2018, 1, 88–95. [Google Scholar] [CrossRef] [Green Version]
- Sidorchuk, R.; Lukina, A.; Markin, I.; Korobkov, S.; Ivashkova, N.; Mkhitaryan, S.; Skorobogatykh, I. Influence of Passenger Flow at the Station Entrances on Passenger Satisfaction Amid COVID-19. J. Open Innov. Technol. Mark. Complex. 2020, 6, 150. [Google Scholar] [CrossRef]
- Semenova, O.; Apalkova, J.; Butovskaya, M. Spatial and Social Behavior of Single and Coupled Individuals of Both Sexes during COVID-19 Lockdown Regime in Russia. Int. J. Environ. Res. Public Health 2021, 18, 4283. [Google Scholar] [CrossRef]
- Newman, P. COVID, CITIES and CLIMATE: Historical Precedents and Potential Transitions for the New Economy. Urban. Sci. 2020, 4, 32. [Google Scholar] [CrossRef]
- Fountas, G.; Sun, Y.-Y.; Akizu-Gardoki, O.; Pomponi, F. How Do People Move Around? National Data on Transport Modal Shares for 131 Countries. World 2020, 1, 34–43. [Google Scholar] [CrossRef]
- Noorbhai, H. A mathematical model to guide the re-opening of economies during the COVID-19 pandemic. Ann. Med. Surg. 2020, 57, 5–6. [Google Scholar] [CrossRef] [PubMed]
- Ibrahim, I.; Kamaludin, K.; Sundarasen, S. COVID-19, Government Response, and Market Volatility: Evidence from the Asia-Pacific Developed and Developing Markets. Economies 2020, 8, 105. [Google Scholar] [CrossRef]
- Barysienė, J.; Batarlienė, N.; Bazaras, D.; Čižiūnienė, K.; Griškevičienė, D.; Griškevičius, A.J.; Lazauskas, J.; Mačiulis, A.; Palšaitis, R.; Vasiliauskas, A.V.; et al. Analysis of the current logistics and transport challenges in the context of the changing environment. Transport 2015, 30, 233–241. [Google Scholar] [CrossRef] [Green Version]
- Zollet, S.; Colombo, L.; De Meo, P.; Marino, D.; McGreevy, S.R.; McKeon, N.; Tarra, S. Towards Territorially Embedded, Equitable and Resilient Food Systems? Insights from Grassroots Responses to COVID-19 in Italy and the CityRegion of Rome. Sustainability 2021, 13, 2425. [Google Scholar] [CrossRef]
- Brdulak, H.; Brdulak, A. Challenges and Threats Faced in 2020 by International Logistics Companies Operating on the Polish Market. Sustainability 2021, 13, 359. [Google Scholar] [CrossRef]
- Parfenov, A.; Shamina, L.; Niu, J.; Yadykin, V. Transformation of Distribution Logistics Management in the Digitalization of the Economy. J. Open Innov. Technol. Mark. Complex. 2021, 7, 58. [Google Scholar] [CrossRef]
- Sá, M.J.; Serpa, S. The COVID-19 Pandemic as an Opportunity to Foster the Sustainable Development of Teaching in Higher Education. Sustainability 2020, 12, 8525. [Google Scholar] [CrossRef]
- Zhang, Y.; Fricker, J.D. Quantifying the impact of COVID-19 on non-motorized transportation: A Bayesian structural time series model. Policy 2021, 103, 11–20. [Google Scholar] [CrossRef]
- Dai, J.; Liu, Z.; Li, R. Improving the subway attraction for the post-COVID-19 era: The role of fare-free public transport policy. Transp. Policy 2021, 103, 21–30. [Google Scholar] [CrossRef]
- Corazza, M.V.; Musso, A. Urban transport policies in the time of pandemic, and after: An ARDUOUS research agenda. Transp. Policy 2021, 103, 31–44. [Google Scholar] [CrossRef]
- Eisenmann, C.; Nobis, C.; Kolarova, V.; Lenz, B.; Winkler, C. Transport mode use during the COVID-19 lockdown period in Germany: The car became more important, public transport lost ground. Transp. Policy 2021, 103, 60–67. [Google Scholar] [CrossRef]
- Paul, B.; Sarkar, S. The Contagion Effects of COVID-19 and Public Transportation System: Conceptualizing the Shifting Paradigm in India. In COVID-19 Pandemic Trajectory in the Developing World; Mishra, M., Singh, R.B., Eds.; Advances in Geographical and Environmental Sciences 2021; Springer: Singapore, 2021. [Google Scholar] [CrossRef]
- Christidis, P.; Christodoulou, A. The Predictive Capacity of Air Travel Patterns during the Global Spread of the COVID-19 Pandemic: Risk, Uncertainty and Randomness. Int. J. Environ. Res. Public Health 2020, 17, 3356. [Google Scholar] [CrossRef]
- Hendrickson, C.; Rilett, L.R. The COVID-19 Pandemic and Transportation Engineering. J. Transp. Eng. Part. A Syst. 2020, 146, 01820001. [Google Scholar] [CrossRef]
- De Lucena, A.J.; de Oliveira, L.D.; Ibanez, P.; de Sousa, G.M.; da Rocha, A.S. The Geography of COVID-19 in Rio de Janeiro, Brazil: Conflicts, Tensions, and Challenges. In COVID-19 Pandemic Trajectory in the Developing World; Mishra, M., Singh, R.B., Eds.; Advances in Geographical and Environmental Sciences 2021; Springer: Singapore, 2021. [Google Scholar] [CrossRef]
- Molina, J.A.; Giménez-Nadal, J.I.; Velilla, J. Sustainable Commuting: Results from a Social Approach and International Evidence on Carpooling. Sustainability 2020, 12, 9587. [Google Scholar] [CrossRef]
- Tamagusko, T.; Ferreira, A. Data-Driven Approach to Understand the Mobility Patterns of the Portuguese Population during the COVID-19 Pandemic. Sustainability 2020, 12, 9775. [Google Scholar] [CrossRef]
- Cruz-Rodríguez, J.; Luque-Sendra, A.; de las Heras, A.; Zamora-Polo, F. Analysis of Inter urban Mobility in University Students: Motivation and Ecological Impact. Int. J. Environ. Res. Public Health 2020, 17, 9348. [Google Scholar] [CrossRef]
- Campisi, T.; Acampa, G.; Marino, G.; Tesoriere, G. Cycling Master Plans in Italy: The I-BIM Feasibility Tool for Cost and Safety Assessments. Sustainability 2020, 12, 4723. [Google Scholar] [CrossRef]
- Nikitas, A.; Tsigdinos, S.; Karolemeas, C.; Kourmpa, E.; Bakogiannis, E. Cycling in the Era of COVID-19: Lessons Learnt and Best Practice Policy Recommendations for a More Bike-Centric Future. Sustainability 2021, 13, 4620. [Google Scholar] [CrossRef]
- Timokhina, G.; Ivashkova, N.; Skorobogatykh, I.; Murtuzalieva, N.; Musatova, Z. Management of Competitiveness of Metropolis Public Transport in the COVID-19 Pandemic Based on Core Consumers’ Values. J. Open Innov. Technol. Mark. Complex. 2020, 6, 192. [Google Scholar] [CrossRef]
- Labonté-LeMoyne, É.; Chen, S.-L.; Coursaris, C.K.; Sénécal, S.; Léger, P.-M. The Unintended Consequences of COVID-19 Mitigation Measures on Mass Transit and Car Use. Sustainability 2020, 12, 9892. [Google Scholar] [CrossRef]
- Przybylowski, A.; Stelmak, S.; Suchanek, M. Mobility Behaviour in View of the Impact of the COVID-19 Pandemic—Public Transport Users in Gdansk Case Study. Sustainability 2021, 13, 364. [Google Scholar] [CrossRef]
- Konečný, V.; Brídziková, M.; Senko, Š. Impact of COVID-19 and Anti—Pandemic Measures on the Sustainability of Demand in Suburban Bus Transport. The Case of the Slovak Republic. Sustainability 2021, 13, 4967. [Google Scholar] [CrossRef]
- Abdullah, M.; Ali, N.; Dias, C.; Campisi, T.; Javid, M.A. Exploring the Traveler’s Intentions to Use Public Transport during the COVID-19 Pandemic While Complying with Precautionary Measures. Appl. Sci. 2021, 11, 3630. [Google Scholar] [CrossRef]
- Gutiérrez, R.L.; De Vicente Oliva, M.A.; Romero-Ania, A. Managing Sustainable Urban Public Transport Systems: An AHP Multcriteria Decision Model. Sustainability 2021, 13, 4614. [Google Scholar] [CrossRef]
- Rosstat. The Share of the Urban Population in the Total Population as of 1 January 2020. Available online: https://showdata.gks.ru/report/278932/ (accessed on 31 March 2021).
- Nefedova, T.G.; Treivish, A.I. The Theory of «Differential Urbanization» and the Hierarchy of Cities in Russia at the Turn of the XXI Century; Smolensk: Oikumena, Russia, 2002; pp. 71–86. Available online: http://www.demoscope.ru/weekly/2005/0217/analit01.php (accessed on 30 April 2021). (In Russian)
- Rosstat. Population of the Russian Federation by Municipality as of 1 January 2020. Available online: https://rosstat.gov.ru/storage/mediabank/CcG8qBhP/mun_obr2020.rar (accessed on 21 April 2021).
- Auerbach, F. Das Gesetz der Bevölkerungs konzentration. Petermanns Geogr. Mitt. 1913, 59, 74–76. [Google Scholar]
- Zipf, G.K. Human Behavior and the Principle of Least Effort; Addison-Wesley Press: Cambridge, MA, USA, 1949; p. 573. [Google Scholar]
- Zanadvorov, V.S.; Zanadvorova, A.V. The Economy of the City: An Introductory Course; Akademkniga: Moscow, Russia, 2003; p. 272. Available online: http://window.edu.ru/resource/253/42253/files/index.html (accessed on 28 April 2021). (In Russian)
- Kapitsa, S.P. Paradoxes of Growth: Laws of Human Development; Alpina Non-fiction: Moscow, Russia, 2010; p. 192. (In Russian) [Google Scholar]
- Antlauf, W.; Bernardeau, F.G.; Coates, K.C. Fast track. Civil Engineering. Mag. Am. Soc. Civil. Eng. 2004, 74, 37–43. [Google Scholar]
- Bashirov, V.R.; Melnikova, E.B. Urban agglomerations. Cartographic method for identifying criteria for agglomerations in Russia. Izv. Vuzov. Geod. Aer. Photogr. 2014, 4, 95–99. (In Russian) [Google Scholar]
- Wilcoxon, F. Individual comparisons by ranking methods. Biom. Bull. 1945, 1, 80–83. [Google Scholar] [CrossRef]
- Administration of the City of Tyumen. Department of Road Infrastructure and Transport. Available online: http://www.tyumen-city.ru/ekonomika/transport/ (accessed on 12 March 2021).
- Lorenz, M.O. Methods of Measuring the Concentration of Wealth. Publ. Am. Stat. Assoc. 1905, 9, 209–219. [Google Scholar] [CrossRef]
- Zaninetti, L.; Ferraro, M. On the truncated Pareto distribution with applications. Cent. Eur. J. Phys. 2008, 6, 1–6. [Google Scholar] [CrossRef] [Green Version]
- Wild, C.J.; Seber, G.A.F. Chance Encounters: A First Course in Data Analysis and Inference; John Wiley & Sons: New York, NY, USA, 1999; p. 640. [Google Scholar]
- Donnelly, R.A., Jr. Business Statistics, 3rd ed.; Pearson: Hoboken, NJ, USA, 2020; p. 976. [Google Scholar]


| Main Types of Business Models for Urban Public Transport Systems | ||
|---|---|---|
| Government Enterprise (GE) | Open Competition (OC) | Community Franchise (CF) |
| Aspect of interest–basic structure | ||
| Centrally planned (infrastructure and operations) | Centrally planned (on centrally planned infrastructure) | Centrally planned (infrastructure) |
| Aspect of interest–selection mechanism | ||
| Political | Political | Political |
| Aspect of interest–competition/markets | ||
| For the market by subcontracting operators | For the market by subcontracting operators | For the market by subcontracting operators |
| Aspect of interest–security of asset | ||
| Tenure for length of lease only | Tenure for length of lease only | Tenure for length of lease only |
| Aspect of interest–pricing | ||
| By central planner. | By central planner | By central planner. |
| Aspect of interest–variation | ||
| Standardization across whole system expected of the product | Standardization across whole system expected of the product | Standardization across whole system expected of the product |
| Aspect of interest–development criteria | ||
| Cost benefit | Cost benefit | Cost benefit |
| Aspect of interest–planning | ||
| Top down with cost benefit | Top down with cost benefit | Top down with cost benefit |
| Aspect of interest–alignment of interest | ||
| With political benefactors | With political benefactors | With political benefactors |
| Aspect of interest–risk, loss aversion, and optimism bias | ||
| Minimizes risk taking by employees; Maximizes risk taking by politicians | Minimizes risk taking by employees; maximizes risk taking by politicians | Minimizes risk taking by employees; Maximizes risk taking by politicians |
| Aspect of interest–private firm involvement | ||
| Larger companies | Larger companies | A wide variety of firm types |
| Indicators | City Category | |||||
|---|---|---|---|---|---|---|
| >5,000,000 People | 1,000,000–2,000,000 People | 500,000–1,000,000 People | 250,000–500,000 People | 100,000–250,000 People | <100,000 People | |
| Number of cities, city | 2 | 13 | 24 | 39 | 95 | 944 |
| Cumulative number of cities, city/% | 2/0.18 | 15/1.34 | 39/3.49 | 78/6.98 | 173/15.49 | 1117/100 |
| Total population, thousand people/% | 18,076/16.5 | 15,621/14.3 | 14,604/13.3 | 13,708/12.5 | 14,527/13.2 | 33,026/30.2 |
| Cumulative population, thousand people/% | 18,076/16.5 | 33,697/30.7 | 48,301/44.1 | 62,009/56.6 | 76,536/69.8 | 109,562/100 |
| Indicators | City Category | |||||
|---|---|---|---|---|---|---|
| >5,000,000 People | 1,000,000–2,000,000 People | 500,000–1,000,000 People | 250,000–500,000 People | 100,000–250,000 People | <100,000 People | |
| Typical Russian city | Moscow | Ufa | Tyumen | Kurgan | Zlatoust | Tobolsk |
| City population P, thousand people | 12,636.3 | 1128.8 | 807.4 | 312.4 | 163.9 | 98.9 |
| City size S, km2 | 2561.5 | 708.0 | 698.0 | 393.0 | 236.4 | 222.0 |
| Population density δpopulation, people/km2 | 4933.2 | 1594.5 | 1156.5 | 794.8 | 693.4 | 445.6 |
| Indicators | Year | |||||||
|---|---|---|---|---|---|---|---|---|
| 1940 | 1960 | 1970 | 1980 | 1990 | 2000 | 2010 | 2019 | |
| City population, thousand people | 79 | 152 | 269 | 360 | 477 | 503 | 582 | 807 |
| CPPT routes number (totally), unit | 3 | 10 | 32 | 56 | 67 | 82 | 103 | 110 |
| - Bus/trolleybus routes, unit | 3/- | 10/- | 28/4 | 44/12 | 55/12 | 75/7 | 103/- | 110/- |
| Number of vehicles (totally), unit | No data | 100 | 220 | 410 | 415 | 463 | 998 | 1285 |
| - Number of buses/trolleybuses, unit | No data | 100/- | 190/30 | 260/150 | 290/125 | 413/50 | 998/- | 1285/- |
| Routes network length, km | 14 | 60 | 115 | 205 | 310 | 405 | 490 | 580 |
| Transportations volume (totally), million passengers/year | No data | No data | No data | ≈120 | ≈165 | ≈170 | ≈132 | ≈150 |
| Indicators | Values of Indicators | ||||||
|---|---|---|---|---|---|---|---|
| 2005 | 2010 | 2015 | 2016 | 2017 | 2018 | 2019 | |
| Trips, units | 2,670,563 | 3,390,996 | 3,691,359 | 3,994,706 | 4,223,493 | 4,148,997 | 3,936,277 |
| Annual volumes, thousand passengers | 128,614.3 | 131,707.4 | 137,010.2 | 139,254.1 | 139,931.6 | 146,568.0 | 150,301.7 |
| Specific volumes (per trip), passengers/trip | 48.16 | 38.84 | 37.12 | 34.86 | 33.13 | 35.33 | 38.18 |
| Borders of Values Range | Tyumen CPPT Transportation Process Characteristics on Different Bus Routes (№№ of Buses Routes) | |||
|---|---|---|---|---|
| Qyear, Passengers/Year | Zyear, Trip/Year | Qt, Passengers/Trip | Q1km, Passengers/km | |
| 2020 | ||||
| Minimum value | 16,273 (route № 134) | 990 (route № 157) | 4.9 (route № 26) | 0.447 (route № 134) |
| Maximum value | 5494,412 (route № 30) | 118,820 (route № 30) | 57.5 (route № 2) | 3.650 (route № 25) |
| Law of distribution of statistical value | Exponential | Exponential | Weibull | Weibull |
| 2019 | ||||
| Minimum value | 23,725 (route № 134) | 1119 (route № 157) | 6.6 (route № 26) | 0.584 (route № 134) |
| Maximum value | 8781,695 (route № 30) | 132,722 (route № 30) | 73.6 (route № 2) | 5.023 (route № 25) |
| Law of distribution of statistical value | Exponential | Exponential | Weibull | Weibull |
| 2019 | 2020 | ||||||
|---|---|---|---|---|---|---|---|
| №№ Rank | Q2019, Passengers/Year | №№ Tyumen CPPT Route | Share of Qi in General QCPPT, % | №№ Rank | Q2020, Passengers/Year | №№ Tyumen CPPT Route | Share of Qi in General QCPPT, % |
| Routs with largest transportations volumes | |||||||
| 1 | 8,781,695 | 30 | 5.84 | 1 | 5,494,412 | 30 | 5.47 |
| 2 | 7,359,601 | 25 | 4.90 | 2 | 5,222,611 | 25 | 5.20 |
| 3 | 5,941,693 | 17 | 3.95 | 3 | 3,975,917 | 17 | 3.96 |
| 4 | 5,541,271 | 51 | 3.69 | 4 | 3,969,856 | 51 | 3.95 |
| 5 | 5,041,370 | 14 | 3.35 | 5 | 3,289,019 | 77 | 3.27 |
| Routs with smallest transportations volumes | |||||||
| 106 | 38,267 | 149 | 0.03 | 106 | 26,690 | 129 | 0.03 |
| 107 | 38,075 | 146 | 0.03 | 107 | 25,037 | 124 | 0.03 |
| 108 | 36,524 | 142 | 0.03 | 108 | 19,283 | 149 | 0.02 |
| 109 | 27,253 | 157 | 0.02 | 109 | 19,272 | 157 | 0.02 |
| 110 | 23,725 | 134 | 0.02 | 110 | 16,273 | 134 | 0.02 |
| X/Y | Percentiles of Tyumen CPPT Routes Distribution (Scale X) | ||||
|---|---|---|---|---|---|
| 20 | 40 | 60 | 80 | 100 | |
| Cumulative volume of transportation, share of 1 (scale Y) | 2019 | ||||
| 0.593 | 0.855 | 0.962 | 0.992 | 1.000 | |
| 2020 | |||||
| 0.592 | 0.856 | 0.962 | 0.992 | 1.000 | |
| X/Y | Percentiles of Distribution of Tyumen CPPT Routes (Scale X) | ||||
|---|---|---|---|---|---|
| 0–20.0 | 20.1–40.0 | 40.1–60.0 | 60.1–80.0 | 80.1–100.0 | |
| Volume Q attributable to appropriate percentile, share of 1 (scale Y) | 2019 | ||||
| 0.593 | 0.262 | 0.107 | 0.030 | 0.008 | |
| 2020 | |||||
| 0.592 | 0.264 | 0.106 | 0.030 | 0.008 | |
| X/Y | Percentiles of Distribution of Tyumen CPPT Routes (Scale X) | ||||
|---|---|---|---|---|---|
| 20 | 40 | 60 | 80 | 100 | |
| Cumulative volume of transportation, share of 1 (scale Y) | 2019 | ||||
| 0.591 | 0.846 | 0.955 | 0.990 | 1.000 | |
| 2020 | |||||
| 0.577 | 0.824 | 0.941 | 0.987 | 1.000 | |
| X/Y | Percentiles of Distribution of Tyumen CPPT Routes (Scale X) | ||||
|---|---|---|---|---|---|
| 0–20.0 | 20.1–40.0 | 40.1–60.0 | 60.1–80.0 | 80.1–100.0 | |
| Volume Q attributable to appropriate percentile, share of 1 (scale Y) | 2019 | ||||
| 0.591 | 0.255 | 0.109 | 0.035 | 0.010 | |
| 2020 | |||||
| 0.577 | 0.247 | 0.117 | 0.046 | 0.013 | |
| X/Y | Percentiles of Distribution of Tyumen CPPT Routes (Scale X) | ||||
|---|---|---|---|---|---|
| 20 | 40 | 60 | 80 | 100 | |
| Cumulative volume of transportation, share of 1 (scale Y) | 2019 | ||||
| 0.603 | 0.866 | 0.977 | 0.999 | 1.000 | |
| 2020 | |||||
| 0.634 | 0.877 | 0.985 | 1.000 | 1.000 | |
| X/Y | Percentiles of Distribution of Tyumen CPPT Routes (Scale X) | ||||
|---|---|---|---|---|---|
| 0–20.0 | 20.1–40.0 | 40.1–60.0 | 60.1–80.0 | 80.1–100.0 | |
| Volume Q attributable to appropriate percentile, share of 1 (scale Y) | 2019 | ||||
| 0.603 | 0.263 | 0.111 | 0.022 | 0.001 | |
| 2020 | |||||
| 0.634 | 0.243 | 0.108 | 0.015 | 0.000 | |
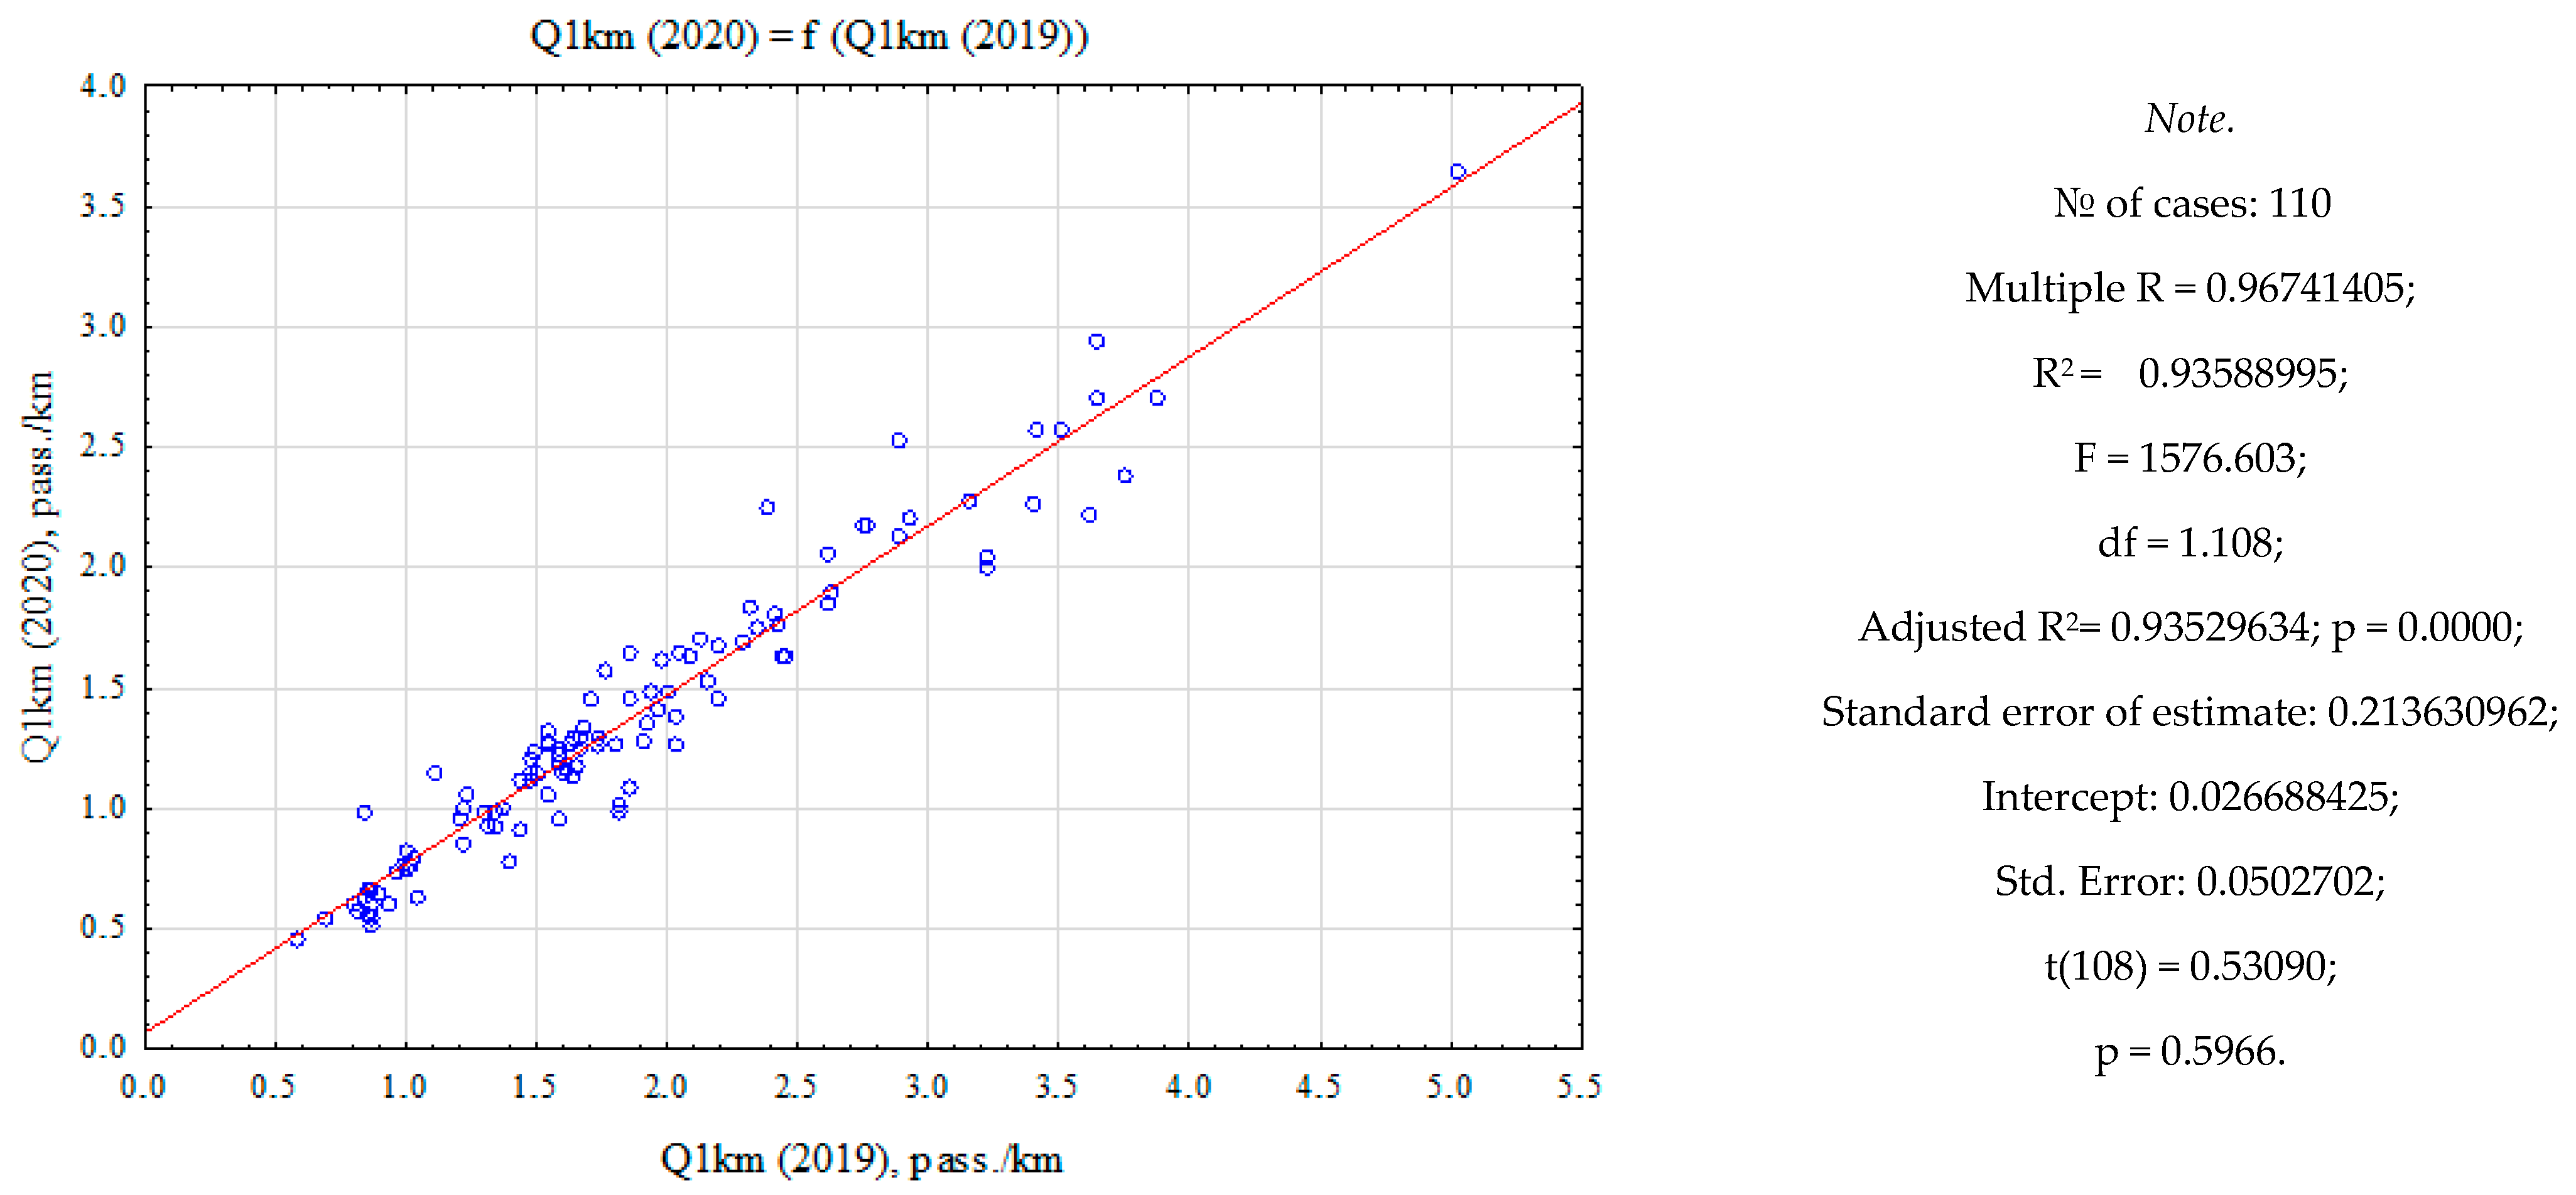
| №№ of Tyumen CPPT Routes | Q1km.i,2019, Pass./km | Q1km.i, 2020, Pass./km | Q1km.i, 2019/Q1km.i,2020 |
|---|---|---|---|
| 30 | 3.87 | 2.71 | 1.376 |
| 25 | 5.02 | 3.65 | 1.376 |
| 17 | 3.16 | 2.28 | 1.388 |
| 149 | 0.84 | 0.63 | 1.336 |
| 157 | 0.69 | 0.55 | 1.256 |
| 134 | 0.58 | 0.45 | 1.307 |
Publisher’s Note: MDPI stays neutral with regard to jurisdictional claims in published maps and institutional affiliations. |
© 2021 by the authors. Licensee MDPI, Basel, Switzerland. This article is an open access article distributed under the terms and conditions of the Creative Commons Attribution (CC BY) license (https://creativecommons.org/licenses/by/4.0/).
Share and Cite
Petrov, A.I.; Petrova, D.A. Open Business Model of COVID-19 Transformation of an Urban Public Transport System: The Experience of a Large Russian City. J. Open Innov. Technol. Mark. Complex. 2021, 7, 171. https://doi.org/10.3390/joitmc7030171
Petrov AI, Petrova DA. Open Business Model of COVID-19 Transformation of an Urban Public Transport System: The Experience of a Large Russian City. Journal of Open Innovation: Technology, Market, and Complexity. 2021; 7(3):171. https://doi.org/10.3390/joitmc7030171
Chicago/Turabian StylePetrov, Artur I., and Daria A. Petrova. 2021. "Open Business Model of COVID-19 Transformation of an Urban Public Transport System: The Experience of a Large Russian City" Journal of Open Innovation: Technology, Market, and Complexity 7, no. 3: 171. https://doi.org/10.3390/joitmc7030171
APA StylePetrov, A. I., & Petrova, D. A. (2021). Open Business Model of COVID-19 Transformation of an Urban Public Transport System: The Experience of a Large Russian City. Journal of Open Innovation: Technology, Market, and Complexity, 7(3), 171. https://doi.org/10.3390/joitmc7030171