Do International Capital Flows, Institutional Quality Matter for Innovation Output: The Mediating Role of Economic Policy Uncertainty


Abstract
:1. Introduction
2. Literature Review
2.1. Open Innovation and Macro Fundamentals
2.2. Economic Policy Uncertainty and Innovation
2.3. Nexus between International Capital Flows and Innovation
2.4. Governance Quality and Innovation
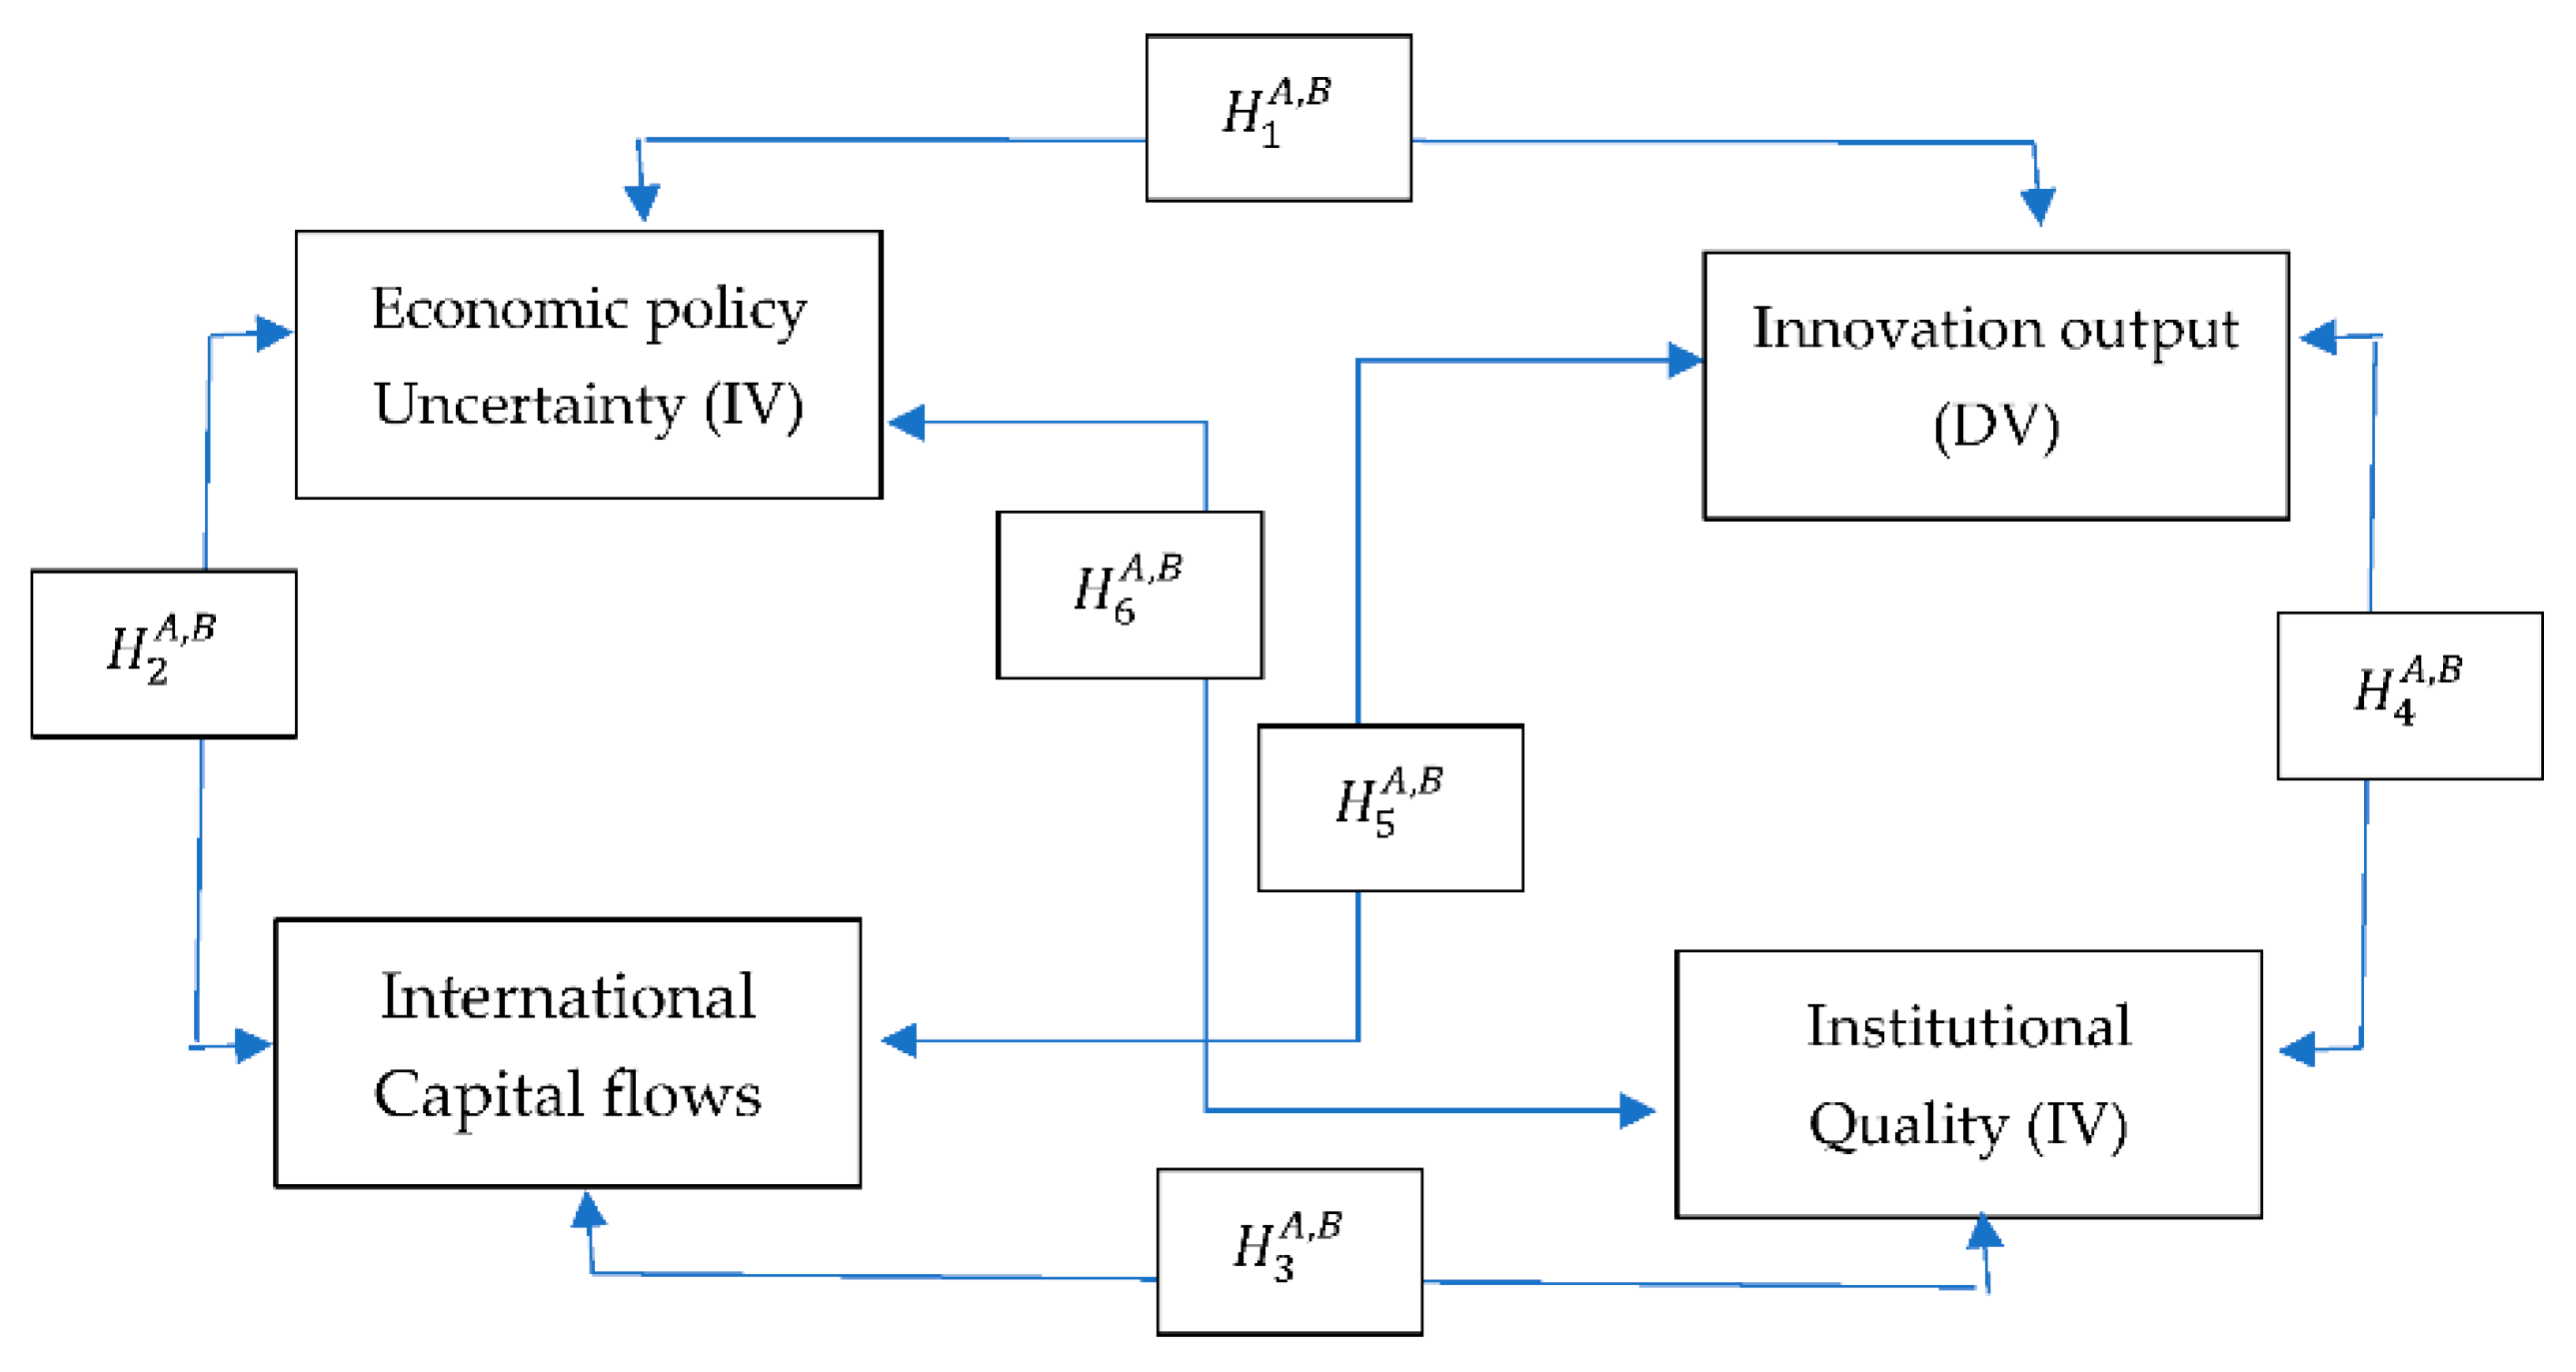
2.5. Motivation and Hypothesis Development
3. Data and Methodology of the Study
4. Results
4.1. Panel Unit Root Test, Cross-Sectional Dependency, and Cointegration Test
4.2. Heterogeneous Effects of EPU, IFCI, and IQ on Innovation Output
5. Findings and Policy Suggestions
Author Contributions
Funding
Institutional Review Board Statement
Informed Consent Statement
Data Availability Statement
Acknowledgments
Conflicts of Interest
References
- Solow, R.M. Technical change and the aggregate production function. Rev. Econ. Stat. 1957, 39, 312–320. [Google Scholar] [CrossRef] [Green Version]
- Alesina, A.; Perotti, R. Income distribution, political instability, and investment. Eur. Econ. Rev. 1996, 40, 1203–1228. [Google Scholar] [CrossRef] [Green Version]
- Bloom, N.; Bond, S.; Van Reenen, J. Uncertainty and investment dynamics. Rev. Econ. Stud. 2007, 74, 391–415. [Google Scholar] [CrossRef] [Green Version]
- Julio, B.; Yook, Y. Political uncertainty and corporate investment cycles. J. Financ. 2012, 67, 45–83. [Google Scholar] [CrossRef]
- Gulen, H.; Ion, M. Policy uncertainty and corporate investment. Rev. Financ. Stud. 2016, 29, 523–564. [Google Scholar] [CrossRef]
- Malik, S. Macroeconomic Determinants of Innovation: Evidence from Asian Countries. Glob. Bus. Rev. 2020. [Google Scholar] [CrossRef]
- Dincer, O. Does corruption slow down innovation? Evidence from a cointegrated panel of US states. Eur. J. Political Econ. 2019, 56, 1–10. [Google Scholar] [CrossRef]
- Lee, S.; Nam, Y.; Lee, S.; Son, H. Determinants of ICT innovations: A cross-country empirical study. Technol. Forecast. Soc. Chang. 2016, 110, 71–77. [Google Scholar] [CrossRef]
- Hartono, A.; Kusumawardhani, R. Innovation barriers and their impact on innovation: Evidence from Indonesian manufacturing firms. Glob. Bus. Rev. 2019, 20, 1196–1213. [Google Scholar] [CrossRef]
- Brunello, G.; Garibaldi, P.; Wasmer, E. Higher education, innovation and growth. In Education and Training in Europe; Oxford University Press: Oxford, UK, 2007. [Google Scholar]
- Villalba, E. The relationship between Education and Innovation. Evidence from European Indicators. 2007. Available online: https://core.ac.uk/download/pdf/38613243.pdf (accessed on 21 May 2021).
- Bosworth, D. The R&D, Knowledge, Innovation Triangle: Education and Economic Performance. 2009. Available online: www.beyondcurrenthorizons.org.uk (accessed on 21 May 2021).
- Marcelin, I.; Mathur, I. Financial development, institutions and banks. Int. Rev. Financ. Anal. 2014, 31, 25–33. [Google Scholar] [CrossRef]
- Pan, X.; Uddin, M.K.; Han, C.; Pan, X. Dynamics of financial development, trade openness, technological innovation and energy intensity: Evidence from Bangladesh. Energy 2019, 171, 456–464. [Google Scholar] [CrossRef]
- Dotta, V.; Munyo, I. Trade Openness and Innovation. Innov. J. 2019, 24, 1–13. [Google Scholar]
- Kacani, J. Innovation as a Prerequisite for Trade Openness in Emerging Economies. In A Data-Centric Approach to Breaking the FDI Trap Through Integration in Global Value Chains; Springer: Berlin/Heidelberg, Germany, 2020; pp. 267–285. [Google Scholar]
- Cheung, K.-Y.; Ping, L. Spillover effects of FDI on innovation in China: Evidence from the provincial data. China Econ. Rev. 2004, 15, 25–44. [Google Scholar] [CrossRef] [Green Version]
- Stiebale, J.; Reize, F. The Impact of FDI on Innovation in Target Firms. 2008. Available online: https://www.econstor.eu/bitstream/10419/26815/1/572037228.PDF (accessed on 21 May 2021).
- Khachoo, Q.; Sharma, R. FDI and innovation: An investigation into intra-and inter-industry effects. Glob. Econ. Rev. 2016, 45, 311–330. [Google Scholar] [CrossRef]
- Tajaddini, R.; Gholipour, H.F. Economic policy uncertainty, R&D expenditures and innovation outputs. J. Econ. Stud. 2020, 48, 413–427. [Google Scholar]
- Schwab, K.; Sala-i-Martín, X. The Global Competitiveness Report 2016–2017; World Economic Forum: Geneva, Switzerland, 2016; pp. 1–399. [Google Scholar]
- Dutta, S.; Lanvin, B.; Wunsch-Vincent, S. Global Innovation Index 2018: Energizing the World with Innovation; World Intellectual Property Organization: Geneva, Switzerland, 2018. [Google Scholar]
- Solow, R.M. A contribution to the theory of economic growth. Q. J. Econ. 1956, 70, 65–94. [Google Scholar] [CrossRef]
- Schumpeter, J.A. Capitalism, Socialism and Democracy; Routledge: Abingdon, UK, 2013. [Google Scholar]
- Leoncini, R. Innovation and inequality. In Inequality in Economics and Sociology; Routledge: London, UK, 2017; p. 189. [Google Scholar]
- Wu, J.; Ma, Z.; Zhuo, S. Enhancing national innovative capacity: The impact of high-tech international trade and inward foreign direct investment. Int. Bus. Rev. 2017, 26, 502–514. [Google Scholar] [CrossRef]
- Janoskova, K.; Kral, P. An in-depth analysis of the summary innovation index in the V4 countries. J. Compet. 2019, 11, 68. [Google Scholar] [CrossRef]
- Romer, P.M. Endogenous technological change. J. Political Econ. 1990, 98, S71–S102. [Google Scholar] [CrossRef] [Green Version]
- Kotha, R.; Zheng, Y.; George, G. Entry into new niches: The effects of firm age and the expansion of technological capabilities on innovative output and impact. Strateg. Manag. J. 2011, 32, 1011–1024. [Google Scholar] [CrossRef]
- Oltra, M.J.; Flor, M. The impact of technological opportunities and innovative capabilities on firms’ output innovation. Creat. Innov. Manag. 2003, 12, 137–144. [Google Scholar] [CrossRef]
- Sudolska, A.; Łapińska, J. Exploring Determinants of Innovation Capability in Manufacturing Companies Operating in Poland. Sustainability 2020, 12, 7101. [Google Scholar] [CrossRef]
- Wong, P.K.; Ho, Y.P.; Autio, E. Entrepreneurship, innovation and economic growth: Evidence from GEM data. Small Bus. Econ. 2005, 24, 335–350. [Google Scholar] [CrossRef]
- Karnizova, L.; Li, J.C. Economic policy uncertainty, financial markets and probability of US recessions. Econ. Lett. 2014, 125, 261–265. [Google Scholar] [CrossRef] [Green Version]
- Law, S.H.; Sarmidi, T.; Goh, L.T. Impact of innovation on economic growth: Evidence from Malaysia. Malays. J. Econ. Stud. 2020, 57, 113–132. [Google Scholar] [CrossRef]
- Huang, Y.; Zhang, Y. The innovation spillovers from outward and inward foreign direct investment: A firm-level spatial analysis. Spat. Econ. Anal. 2020, 15, 43–59. [Google Scholar] [CrossRef]
- Huang, X. Institutions, innovations, and growth. Am. Econ. Rev. 1999, 12, 438–443. [Google Scholar]
- Chesbrough, H.W. Open Innovation: The New Imperative for Creating and Profiting from Technology; Harvard Business Press: Cambridge, MA, USA, 2003. [Google Scholar]
- Herstad, S.; Nås, S.O. De Store Selskapene: Forskningslokomotiver Eller Dresiner? NIFU STEP: Oslo, Norway, 2007. [Google Scholar]
- Lazonick, W. The US stock market and the governance of innovative enterprise. Ind. Corps Chang. 2007, 16, 983–1035. [Google Scholar] [CrossRef]
- West, J. Does appropriability enable or retard open innovation. In Open Innovation: Researching a New Paradigm; Oxford University Press: Oxford, UK, 2006; pp. 109–133. [Google Scholar]
- Chesbrough, H.; Vanhaverbeke, W.; West, J. Open Innovation: Researching a New Paradigm; Oxford University Press: Oxford, UK, 2006. [Google Scholar]
- Lazonick, W.; O’sullivan, M. Maximizing shareholder value: A new ideology for corporate governance. Econ. Soc. 2000, 29, 13–35. [Google Scholar] [CrossRef]
- De Oliveira, L.S.; Echeveste, M.E.S.; Cortimiglia, M.N.; Gonçalves, C.G.C. Analysis of Determinants for open innovation implementation in regional innovation systems. RAI Rev. Adm. Inovação 2017, 14, 119–129. [Google Scholar] [CrossRef] [Green Version]
- Kafouros, M.I.; Forsans, N. The role of open innovation in emerging economies: Do companies profit from the scientific knowledge of others? J. World Bus. 2012, 47, 362–370. [Google Scholar] [CrossRef]
- Herstad, S.J.; Bloch, C.; Ebersberger, B.; van de Velde, E. Open innovation and globalisation: Theory, evidence and implications. Vis. EraNet 2008, 19, 1–96. [Google Scholar]
- Jacob, S. Invention and Economic Growth; Harvard University Press: Cambridge, MA, USA, 1966. [Google Scholar]
- Nelson, R.R.; Peck, M.J.; Kalachek, E.D. Technology, Economic Growth, and Public Policy; a Rand Corporation and Brookings Institution Study; Brookings Institution: Washington, DC, USA, 1967. [Google Scholar]
- Borensztein, E.; De Gregorio, J.; Lee, J.-W. How does foreign direct investment affect economic growth? J. Int. Econ. 1998, 45, 115–135. [Google Scholar] [CrossRef] [Green Version]
- Crescenzi, R.; Rodriguez-Pose, A.; Storper, M. The territorial dynamics of innovation: A Europe–United States comparative analysis. J. Econ. Geogr. 2007, 7, 673–709. [Google Scholar] [CrossRef]
- Bertschek, I. Product and process innovation as a response to increasing imports and foreign direct investment. J. Ind. Econ. 1995, 43, 341–357. [Google Scholar] [CrossRef]
- Filippetti, A.; Frenz, M.; Ietto-Gillies, G. The impact of internationalization on innovation at countries’ level: The role of absorptive capacity. Camb. J. Econ. 2017, 41, 413–439. [Google Scholar] [CrossRef] [Green Version]
- Andrijauskiene, M.; Dumčiuvienė, D. Inward Foreign Direct Investment and National Innovative Capacity. Eng. Econ. 2019, 30, 339–348. [Google Scholar] [CrossRef] [Green Version]
- Kiselakova, D.; Sofrankova, B.; Onuferova, E.; Cabinova, V. Assessing the effect of innovation determinants on macroeconomic development within the EU (28) countries. Probl. Perspect. Manag. 2020, 18, 277. [Google Scholar] [CrossRef]
- Ustalar, S.A.; Şanlisoy, S. The Impact of Foreign Direct Investment on Innovation Performance: Evidence from a Nonlinear ARDL Approach. İzmir J. Econ. 2016, 35, 77–89. [Google Scholar]
- Loukil, K. Foreign direct investment and technological innovation in developing countries. Oradea J. Bus. Econ. 2016, 1, 31–40. [Google Scholar] [CrossRef]
- Wignaraja, G. FDI and Innovation as Drivers of Export Behaviour: Firm-level Evidence from East Asia. UNU-MERIT Work. Pap. 2008. [Google Scholar] [CrossRef] [Green Version]
- Fang, C.; Mohnen, P. FDI, R&D and Innovation Output in the Chinese Automobile Industry. In The Rise of Technological Power in the South; Springer: Berlin/Heidelberg, Germany, 2010; pp. 203–220. [Google Scholar]
- GAO, S.-X.; XU, X.; LI, Y.-H. Empirical Study on the Impact of Technology Spillover of FDI on the Innovation Output of Chinese Enterprises. J. Ind. Eng. Eng. Manag. 2010, 2, 27–45. [Google Scholar]
- Wang, C.C.; Wu, A. Geographical FDI knowledge spillover and innovation of indigenous firms in China. Int. Bus. Rev. 2016, 25, 895–906. [Google Scholar] [CrossRef]
- Blomström, M.; Kokko, A. Foreign investment as a vehicle for international technology transfer. In Creation and Transfer of Knowledge; Springer: Berlin/Heidelberg, Germany, 1998; pp. 279–311. [Google Scholar]
- Li, J.; Strange, R.; Ning, L.; Sutherland, D. Outward foreign direct investment and domestic innovation performance: Evidence from China. Int. Bus. Rev. 2016, 25, 1010–1019. [Google Scholar] [CrossRef] [Green Version]
- Nyeadi, J.D.; Adjasi, C. Foreign direct investment and firm innovation in selected sub-Saharan African Countries. Cogent Bus. Manag. 2020, 7, 1763650. [Google Scholar] [CrossRef]
- Masso, J.; Reino, A.; Varblane, U. Foreign direct investment and innovation in Central and Eastern Europe: Evidence from Estonia. Univ. Tartu Fac. Econ. Bus. Adm. Work. Pap. 2010. [Google Scholar] [CrossRef] [Green Version]
- Masso, J.; Roolaht, T.; Varblane, U. Foreign direct investment and innovation in Estonia. Balt. J. Manag. 2013. [Google Scholar] [CrossRef]
- Islam, M.A.; Liu, H.; Khan, M.A.; Reza, S.M.; Yahia, Y.E.; Nasrin, L. Causal relationship between economic growth, financial deepening, foreign direct investment and innovation: Evidence from China. Asian Econ. Financ. Rev. 2018, 8, 1086. [Google Scholar] [CrossRef] [Green Version]
- Sivalogathasan, V.; Wu, X. The effect of foreign direct investment on innovation in south Asian emerging markets. Glob. Bus. Organ. Excell. 2014, 33, 63–76. [Google Scholar] [CrossRef]
- Kinoshita, Y. Technology Spillovers through Foreign Direct Investment. 1998. Available online: https://papers.ssrn.com/sol3/papers.cfm?abstract_id=157614 (accessed on 21 May 2021).
- Blind, K.; Jungmittag, A. Foreign direct investment, imports and innovations in the service industry. Rev. Ind. Organ. 2004, 25, 205–227. [Google Scholar] [CrossRef]
- Arun, K.; Yıldırım, D.Ç. Effects of foreign direct investment on intellectual property, patents and R&D. Queen Mary J. Intellect. Prop. 2017, 7, 226–241. [Google Scholar]
- Chen, Y. Impact of foreign direct investment on regional innovation capability: A case of China. J. Data Sci. 2007, 5, 577–596. [Google Scholar]
- Yilun, M. The Influence of Foreign Direct Investment on China’s High-tech Industry Innovation—A Mediation Effect Model. Int. J. Sci. Eng. Sci. 2020, 4, 15–18. [Google Scholar]
- Girma, S.; Gong, Y.; Görg, H. Foreign direct investment, access to finance, and innovation activity in Chinese enterprises. World Bank Econ. Rev. 2008, 22, 367–382. [Google Scholar] [CrossRef]
- Koçak, E. Does Institutional Quality Drive Innovation? Evidence from System-GMM Estimates. 2017. Available online: https://www.researchgate.net/publication/324604056_Does_Institutional_Quality_Drive_Innovation_Evidence_from_System-GMM_Estimates (accessed on 21 May 2021).
- Villanueva, A.C.B. Does Institutional Quality Affect Firm Performance? Evidence from The Philippines, Indonesia and Viet Nam. 2019. Available online: http://repository.vnu.edu.vn/handle/VNU_123/70569 (accessed on 5 October 2019).
- Sattar, A.; Mahmood, T. Intellectual property rights and Economic growth: Evidences from high, middle and low income countries. Pak. Econ. Soc. Rev. 2011, 163–186. [Google Scholar]
- Carlin, W.; Soskice, D. Reforms, macroeconomic policy and economic performance in Germany. In Economic Policy Proposals for Germany and Europe; Routledge: Milton Park, Abingdon, UK, 2008; pp. 82–128. [Google Scholar]
- Crafts, N. Regulation and productivity performance. Oxf. Rev. Econ. Policy 2006, 22, 186–202. [Google Scholar] [CrossRef]
- Rodríguez-Pose, A.; Di Cataldo, M. Quality of government and innovative performance in the regions of Europe. J. Econ. Geogr. 2015, 15, 673–706. [Google Scholar] [CrossRef]
- Farole, T.; Rodríguez-Pose, A.; Storper, M. Cohesion policy in the European Union: Growth, geography, institutions. JCMS J. Common Mark. Stud. 2011, 49, 1089–1111. [Google Scholar] [CrossRef] [Green Version]
- Wang, C.; Qiao, C.; Ahmed, R.I.; Kirikkaleli, D. Institutional Quality, Bank Finance and Technological Innovation: A way forward for Fourth Industrial Revolution in BRICS Economies. Technol. Forecast. Soc. Chang. 2020. [Google Scholar] [CrossRef]
- Westerlund, J. Testing for error correction in panel data. Oxf. Bull. Econ. Stat. 2007, 69, 709–748. [Google Scholar] [CrossRef] [Green Version]
- Wu, H.; Ren, S.; Xie, G. Technology Import and China’s Innovation Capability: Does Institutional Quality Matter? Reg. Econ. Dev. Res. 2020, 93–104. [Google Scholar] [CrossRef]
- Tebaldi, E.; Elmslie, B. Does institutional quality impact innovation? Evidence from cross-country patent grant data. Appl. Econ. 2013, 45, 887–900. [Google Scholar] [CrossRef]
- Varsakelis, N.C. Education, political institutions and innovative activity: A cross-country empirical investigation. Res. Policy 2006, 35, 1083–1090. [Google Scholar] [CrossRef]
- Aldieri, L.; Barra, C.; Ruggiero, N.; Vinci, C.P. Innovative performance effects of institutional quality: An empirical investigation from the Triad. Appl. Econ. 2020, 1–13. [Google Scholar] [CrossRef]
- Ervits, I.; Zmuda, M. A cross-country comparison of the effects of institutions on internationally oriented innovation. J. Int. Entrep. 2018, 16, 486–503. [Google Scholar] [CrossRef]
- Anokhin, S.; Schulze, W.S. Entrepreneurship, innovation, and corruption. J. Bus. Ventur. 2009, 24, 465–476. [Google Scholar] [CrossRef]
- Coluccia, D.; Dabić, M.; Del Giudice, M.; Fontana, S.; Solimene, S. R&D innovation indicator and its effects on the market. An empirical assessment from a financial perspective. J. Bus. Res. 2019. [Google Scholar] [CrossRef]
- Knott, A.M.; Vieregger, C. Reconciling the Firm Size and Innovation Puzzle. Available online: http://dx.doi.org/10.2139/ssrn.2756232 (accessed on 21 May 2021).
- Maradana, R.P.; Pradhan, R.P.; Dash, S.; Gaurav, K.; Jayakumar, M.; Chatterjee, D. Does innovation promote economic growth? Evidence from European countries. J. Innov. Entrep. 2017, 6, 1. [Google Scholar] [CrossRef] [Green Version]
- Wusiman, N.; Ndzembanteh, A.N. The Impact of Human Capital and Innovation Output on Economic Growth: Comparative Analysis of Malaysia and Turkey. Anemon Muş Alparslan Üniversitesi Sos. Bilimler Derg. 2020, 8, 231–242. [Google Scholar]
- Monge-González, R.; Rodríguez-Alvarez, J.A.; Leiva, J.C. An impact evaluation of a fund to finance innovation in SMEs. Acad. Rev. Latinoam. Adm. 2016, 29, 20–43. [Google Scholar] [CrossRef] [Green Version]
- Gholipour, H.F. The effects of economic policy and political uncertainties on economic activities. Res. Int. Bus. Financ. 2019, 48, 210–218. [Google Scholar] [CrossRef]
- Baker, S.R.; Bloom, N.; Davis, S.J. Measuring economic policy uncertainty. Q. J. Econ. 2016, 131, 1593–1636. [Google Scholar] [CrossRef]
- Li, Q.; Resnick, A. Reversal of fortunes: Democratic institutions and foreign direct investment inflows to developing countries. Int. Organ. 2003, 57, 175–211. [Google Scholar] [CrossRef] [Green Version]
- Aizenman, J.; Spiegel, M.M. Institutional efficiency, monitoring costs and the investment share of FDI. Rev. Int. Econ. 2006, 14, 683–697. [Google Scholar] [CrossRef]
- Levchenko, A.A. Institutional quality and international trade. Rev. Econ. Stud. 2007, 74, 791–819. [Google Scholar] [CrossRef]
- Habib, M.; Zurawicki, L. Corruption and foreign direct investment. J. Int. Bus. Stud. 2002, 33, 291–307. [Google Scholar] [CrossRef]
- Wijeweera, A.; Dollery, B. Host country corruption level and Foreign Direct Investments inflows. Int. J. Trade Glob. Mark. 2009, 2, 168–178. [Google Scholar] [CrossRef]
- Gani, A. Governance and foreign direct investment links: Evidence from panel data estimations. Appl. Econ. Lett. 2007, 14, 753–756. [Google Scholar] [CrossRef]
- Asamoah, M.E.; Adjasi, C.K.; Alhassan, A.L. Macroeconomic uncertainty, foreign direct investment and institutional quality: Evidence from Sub-Saharan Africa. Econ. Syst. 2016, 40, 612–621. [Google Scholar] [CrossRef]
- Le, T.-H.; Kim, J.; Lee, M. Institutional quality, trade openness, and financial sector development in Asia: An empirical investigation. Emerg. Mark. Financ. Trade 2016, 52, 1047–1059. [Google Scholar] [CrossRef] [Green Version]
- Law, S.H.; Tan, H.B.; Azman-Saini, W. Financial development and income inequality at different levels of institutional quality. Emerg. Mark. Financ. Trade 2014, 50, 21–33. [Google Scholar] [CrossRef]
- Poelhekke, S.; van der Ploeg, R. Do natural resources attract FDI? Evidence from non-stationary sector level data. De Ned. Bank Work. Pap. 2010, 266. [Google Scholar] [CrossRef] [Green Version]
- Globerman, S.; Shapiro, D. Global foreign direct investment flows: The role of governance infrastructure. World Dev. 2002, 30, 1899–1919. [Google Scholar] [CrossRef]
- Daude, C.; Stein, E. The quality of institutions and foreign direct investment. Econ. Politics 2007, 19, 317–344. [Google Scholar] [CrossRef]
- Asiedu, E. Foreign Direct Investment, Natural Resources and Institutions. 2013. Available online: https://www.theigc.org/wp-content/uploads/2014/09/Asiedu-2013-Working-Paper.pdf (accessed on 21 May 2021).
- Buchanan, B.G.; Le, Q.V.; Rishi, M. Foreign direct investment and institutional quality: Some empirical evidence. Int. Rev. Financ. Anal. 2012, 21, 81–89. [Google Scholar] [CrossRef]
- Qamruzzaman, M.; Jianguo, W. The asymmetric relationship between financial development, trade openness, foreign capital flows, and renewable energy consumption: Fresh evidence from panel NARDL investigation. Renew. Energy 2020, 159, 827–842. [Google Scholar] [CrossRef]
- Pesaran, M.H. General Diagnostic Tests for Cross Section Dependence in Panels. 2004. Available online: http://ftp.iza.org/dp1240.pdf (accessed on 21 May 2021).
- Pesaran, M.H. A simple panel unit root test in the presence of cross-section dependence. J. Appl. Econ. 2007, 22, 265–312. [Google Scholar] [CrossRef] [Green Version]
- Koenker, R. Quantile regression for longitudinal data. J. Multivar. Anal. 2004, 91, 74–89. [Google Scholar] [CrossRef] [Green Version]
- Akram, R.; Chen, F.; Khalid, F.; Ye, Z.; Majeed, M.T. Heterogeneous effects of energy efficiency and renewable energy on carbon emissions: Evidence from developing countries. J. Clean. Prod. 2020, 247, 119122. [Google Scholar] [CrossRef]
- Cheng, C.; Ren, X.; Wang, Z.; Yan, C. Heterogeneous impacts of renewable energy and environmental patents on CO2 emission-Evidence from the BRIICS. Sci. Total Environ. 2019, 668, 1328–1338. [Google Scholar] [CrossRef]
- Huang, Y.; Zhu, H.; Zhang, Z. The heterogeneous effect of driving factors on carbon emission intensity in the Chinese transport sector: Evidence from dynamic panel quantile regression. Sci. Total Environ. 2020, 727, 138578. [Google Scholar] [CrossRef]
- Zhang, Y.-J.; Peng, H.-R.; Liu, Z.; Tan, W. Direct energy rebound effect for road passenger transport in China: A dynamic panel quantile regression approach. Energy Policy 2015, 87, 303–313. [Google Scholar] [CrossRef]
- Shabani, Z.D.; Shahnazi, R. Energy consumption, carbon dioxide emissions, information and communications technology, and gross domestic product in Iranian economic sectors: A panel causality analysis. Energy 2019, 169, 1064–1078. [Google Scholar] [CrossRef]
- Soto, M. System GMM Estimation with a Small Sample; Universitat Autònoma de Barcelona: Barcelona, Spain, 2009. [Google Scholar]
- Combes, J.-L.; Ebeke, C. Remittances and household consumption instability in developing countries. World Dev. 2011, 39, 1076–1089. [Google Scholar] [CrossRef] [Green Version]
- Arellano, M.; Bover, O. Another look at the instrumental variable estimation of error-components models. J. Econ. 1995, 68, 29–51. [Google Scholar] [CrossRef] [Green Version]
- Arellano, M.; Bond, S. Some tests of specification for panel data: Monte Carlo evidence and an application to employment equations. Rev. Econ. Stud. 1991, 58, 277–297. [Google Scholar] [CrossRef] [Green Version]
- Blundell, R.; Bond, S. Initial conditions and moment restrictions in dynamic panel data models. J. Econ. 1998, 87, 115–143. [Google Scholar] [CrossRef] [Green Version]
- Arellano, M. Panel Data Econometrics; Oxford University Press: Oxford, UK, 2003. [Google Scholar]
- Baltagi, B. Econometric Analysis of Panel Data; John Wiley & Sons: Hoboken, NJ, USA, 2008. [Google Scholar]
- Baum, C.F.; Schaffer, M.E.; Stillman, S. Enhanced routines for instrumental variables/generalized method of moments estimation and testing. Stata J. 2007, 7, 465–506. [Google Scholar] [CrossRef]
- Han, C.; Phillips, P.C.; Sul, D. X-differencing and dynamic panel model estimation. Econ. Theory 2014, 30, 201–251. [Google Scholar] [CrossRef] [Green Version]
- Levin, A.; Lin, C.-F.; Chu, C.-S.J. Unit root tests in panel data: Asymptotic and finite-sample properties. J. Econ. 2002, 108, 1–24. [Google Scholar] [CrossRef]
- Im, K.S.; Pesaran, M.H.; Shin, Y. Testing for unit roots in heterogeneous panels. J. Econ. 2003, 115, 53–74. [Google Scholar] [CrossRef]
- Breusch, T.S.; Pagan, A.R. The Lagrange multiplier test and its applications to model specification in econometrics. Rev. Econ. Stud. 1980, 47, 239–253. [Google Scholar] [CrossRef]
- Pesaran, M.H.; Ullah, A.; Yamagata, T. A bias-adjusted LM test of error cross-section independence. Econ. J. 2008, 11, 105–127. [Google Scholar] [CrossRef]
- Pesaran, M.H. Estimation and inference in large heterogeneous panels with a multifactor error structure. Econometrica 2006, 74, 967–1012. [Google Scholar] [CrossRef] [Green Version]
- Pesaran, M.H.; Yamagata, T. Testing slope homogeneity in large panels. J. Econ. 2008, 142, 50–93. [Google Scholar] [CrossRef] [Green Version]
- Pedroni, P. Panel cointegration: Asymptotic and finite sample properties of pooled time series tests with an application to the PPP hypothesis. Econ. Theory 2004, 20, 597–625. [Google Scholar] [CrossRef] [Green Version]
- Pedroni, P. Critical values for cointegration tests in heterogeneous panels with multiple regressors. Oxf. Bull. Econ. Stat. 1999, 61, 653–670. [Google Scholar] [CrossRef]
- Pedroni, P. Purchasing power parity tests in cointegrated panels. Rev. Econ. Stat. 2001, 83, 727–731. [Google Scholar] [CrossRef] [Green Version]
- Kao, C. Spurious regression and residual-based tests for cointegration in panel data. J. Econ. 1999, 90, 1–44. [Google Scholar] [CrossRef]
- Baltagi, B.H. Forecasting with panel data. J. Forecast. 2008, 27, 153–173. [Google Scholar] [CrossRef]
- Zhu, H.; Duan, L.; Guo, Y.; Yu, K. The effects of FDI, economic growth and energy consumption on carbon emissions in ASEAN-5: Evidence from panel quantile regression. Econ. Model. 2016, 58, 237–248. [Google Scholar] [CrossRef] [Green Version]
- Kuemmerle, W.; Rosenbloom, R.S. Functional versus capability-oriented innovation management in multinational firms. In Proceedings of the PICMET’99: Portland International Conference on Management of Engineering and Technology, Portland, OR, USA, 29 July 1999; pp. 159–167. [Google Scholar]
- Patra, S.K.; Krishna, V.V. Globalization of R&D and open innovation: Linkages of foreign R&D centers in India. J. Open Innov. Technol. Mark. Complex. 2015, 1, 7. [Google Scholar]
- Ambos, B. Foreign direct investment in industrial research and development: A study of German MNCs. Res. Policy 2005, 34, 395–410. [Google Scholar] [CrossRef]
- Clarke, G. How the Quality of Institutions Affects Technological Deepening in Developing Countries; The World Bank: Washington, DC, USA, 2001. [Google Scholar]
- Hall, B.H. The financing of research and development. Oxf. Rev. Econ. Policy 2002, 18, 35–51. [Google Scholar] [CrossRef]
- Bloom, N. Fluctuations in uncertainty. J. Econ. Perspect. 2014, 28, 153–176. [Google Scholar] [CrossRef] [Green Version]
- Kraft, H.; Schwartz, E.; Weiss, F. Growth options and firm valuation. Eur. Financ. Manag. 2018, 24, 209–238. [Google Scholar] [CrossRef] [Green Version]
- Oakey, R.P. Open innovation and its relevance to industrial research and development: The case of high-technology small firms. Int. Small Bus. J. 2013, 31, 319–336. [Google Scholar] [CrossRef]
- Van Vo, L.; Le, H.T.T. Strategic growth option, uncertainty, and R&D investment. Int. Rev. Financ. Anal. 2017, 51, 16–24. [Google Scholar]
- Jeong, H.; Shin, K.; Kim, E.; Kim, S. Does open innovation enhance a large firm’s financial sustainability? A case of the Korean food industry. J. Open Innov. Technol. Mark. Complex. 2020, 6, 101. [Google Scholar] [CrossRef]
- Yun, J.J.; Zhao, X.; Jung, K.; Yigitcanlar, T. The culture for open innovation dynamics. Sustainability 2020, 12, 5076. [Google Scholar] [CrossRef]
- Canh, N.P.; Schinckus, C.; Thanh, S.D. Do economic openness and institutional quality influence patents? Evidence from GMM systems estimates. Int. Econ. 2019, 157, 134–169. [Google Scholar] [CrossRef]
- Kwan, L.Y.Y.; Chiu, C.y. Country variations in different innovation outputs: The interactive effect of institutional support and human capital. J. Organ. Behav. 2015, 36, 1050–1070. [Google Scholar] [CrossRef]
- Sala-i-Martin, X. Comment On’Growth Empirics and Reality, by William, A. Brock and Steven, N. Durlauf. 2001. Available online: https://openknowledge.worldbank.org/handle/10986/17445 (accessed on 21 May 2021).
- Gradstein, M. Governance and growth. J. Dev. Econ. 2004, 73, 505–518. [Google Scholar] [CrossRef]
- Chen, Y.; Puttitanun, T. Intellectual property rights and innovation in developing countries. J. Dev. Econ. 2005, 78, 474–493. [Google Scholar] [CrossRef]
- Dakhli, M.; De Clercq, D. Human capital, social capital, and innovation: A multi-country study. Entrep. Reg. Dev. 2004, 16, 107–128. [Google Scholar] [CrossRef]
- Jian, L.P.C.X.L. Performance Analysis of R&D Capital Input and Output in Chinese Independent Innovation: With Discussion of the Effects of Human Capital and Intellectual Property Rights Protection. Soc. Sci. China 2007, 2, 32–42. [Google Scholar]
- Berger, M.; Diez, J.R. Can host innovation systems in late industrializing countries benefit from the presence of transnational corporations? Insights from Thailand’s manufacturing industry. Eur. Plan. Stud. 2008, 16, 1047–1074. [Google Scholar] [CrossRef]
- Zhu, X.; Asimakopoulos, S.; Kim, J. Financial development and innovation-led growth: Is too much finance better? J. Int. Money Financ. 2020, 100, 102083. [Google Scholar] [CrossRef]
- Hsu, P.-H.; Tian, X.; Xu, Y. Financial development and innovation: Cross-country evidence. J. Financ. Econ. 2014, 112, 116–135. [Google Scholar] [CrossRef] [Green Version]
- Aghion, P.; Van Reenen, J.; Zingales, L. Innovation andInstitutional Ownership. NBER Work. Pap. 2009. [Google Scholar] [CrossRef]
- Meierrieks, D. Financial development and innovation: Is there evidence of a Schumpeterian finance-innovation nexus? Ann. Econ. Financ. 2014, 15, 61–81. [Google Scholar]
- Caraça, J.; Lundvall, B.-Å.; Mendonça, S. The changing role of science in the innovation process: From Queen to Cinderella? Technol. Forecast. Soc. Chang. 2009, 76, 861–867. [Google Scholar] [CrossRef]
- Chapman, G.; Hewitt-Dundas, N. The effect of public support on senior manager attitudes to innovation. Technovation 2018, 69, 28–39. [Google Scholar] [CrossRef] [Green Version]
- Thongsri, N.; Chang, A.K.-H. Interactions among factors influencing product innovation and innovation behaviour: Market orientation, managerial ties, and government support. Sustainability 2019, 11, 2793. [Google Scholar] [CrossRef] [Green Version]
- Hottenrott, H.; Lopes-Bento, C. (International) R&D collaboration and SMEs: The effectiveness of targeted public R&D support schemes. Res. Policy 2014, 43, 1055–1066. [Google Scholar]
- Hossain, M.; Kauranen, I. Open innovation in SMEs: A systematic literature review. J. Strategy Manag. 2016, 9, 58–73. [Google Scholar] [CrossRef]
- Thurner, T.W.; Zaichenko, S. Technology transfer into Russia’s agricultural sector—Can public funding replace ailing business engagement? Sci. Public Policy 2018, 45, 683–691. [Google Scholar] [CrossRef]
- Huang, C.; Sharif, N. Global technology leadership: The case of China. Sci. Public Policy 2015, 43, 62–73. [Google Scholar] [CrossRef]
- Suh, Y.; Jeon, J. Monitoring patterns of open innovation using the patent-based brokerage analysis. Technol. Forecast. Soc. Chang. 2019, 146, 595–605. [Google Scholar] [CrossRef]

| Positive Effects | Negative Effects | Neutral Effects | |
|---|---|---|---|
| Country-level data | Cheung and Ping [17]; Masso et al. [64]; Islam et al. [65]; Sivalogathasan and Wu [66]; Kinoshita [67]; Blind and Jungmittag [68]; | Loukil [55]; Arun and Yıldırım [69] | Chen [70]; Loukil [55] |
| Firm-level data | Nyeadi and Adjasi [62]; Yilun [71]; Girma et al. [72]; Cheung and Ping [17] |
| Indicators | Definition | Reference |
|---|---|---|
| R&D | Research and development expenditure: expressed as a percentage of real gross domestic product. | [88,89,90] |
| patents application | Patents filed by residents: expressed in numbers per thousand population. | [90,91,92] |
| Patents filed by non-residents: expressed in numbers per thousand population. | [90] | |
| HTX | High-technology exports: expressed as a percentage of real gross domestic product. | [90] |
| V | ps | GE | RQ | L | CC | |
|---|---|---|---|---|---|---|
| v | 1 | |||||
| ps | 0.725652 | 1 | ||||
| GE | 0.518462 | 0.582931 | 1 | |||
| RQ | 0.678391 | 0.640665 | 0.73532 | 1 | ||
| L | 0.709744 | 0.509499 | 0.879439 | 0.799107 | 1 | |
| CC | 0.338795 | 0.725775 | 0.837552 | 0.492579 | 0.792911 | 1 |
| Eigenvalues: (Sum = 6, Average = 1) | ||||||
| Cumulative | Cumulative | |||||
| Number | Value | Difference | Proportion | Value | Proportion | |
| 1 | 4.048765 | 2.833551 | 0.6748 | 4.048765 | 0.6748 | |
| 2 | 1.215214 | 0.821663 | 0.2025 | 5.263979 | 0.8773 | |
| 3 | 0.393551 | 0.217447 | 0.0656 | 5.657529 | 0.9429 | |
| 4 | 0.176104 | 0.075909 | 0.0294 | 5.833633 | 0.9723 | |
| 5 | 0.100195 | 0.034023 | 0.0167 | 5.933828 | 0.9890 | |
| 6 | 0.066172 | --- | 0.0110 | 6.000000 | 1.0000 | |
| Eigenvectors (Loadings): | ||||||
| Variable | PC 1 | PC 2 | PC 3 | PC 4 | PC 5 | PC 6 |
| V | 0.340148 | −0.510462 | 0.722309 | −0.146329 | −0.118082 | 0.258152 |
| PS | 0.304139 | 0.641847 | 0.420379 | 0.555728 | 0.087919 | 0.047428 |
| GE | 0.468207 | 0.080609 | −0.303192 | 0.009098 | −0.825799 | 0.018228 |
| RQ | 0.397804 | −0.427150 | −0.428263 | 0.519370 | 0.353108 | 0.285403 |
| L | 0.480680 | −0.091251 | 0.016122 | −0.136876 | 0.237931 | −0.827656 |
| CC | 0.428112 | 0.360804 | −0.161111 | −0.617406 | 0.339245 | 0.405347 |
| Levin, Lin, and Chu t | Im, Pesaran, and Shin W—Stat | ADF-Fisher Chi-Square | ||||
|---|---|---|---|---|---|---|
| t | t&c | t | t&c | t | t&c | |
| Panel A: Al level | ||||||
| IO1 | −3.64761 | −0.78612 | −1.22451 | 0.09848 | 67.6154 * | 62.0605 ** |
| IO2 | −3.83741 | 0.05830 | −0.81470 | 0.35825 | 50.8792 | 45.4126 |
| IO3 | −0.14883 | −0.69151 | 2.15688 | 0.51934 | 29.3162 | 38.6531 |
| IO4 | 0.57653 | −0.72930 | 4.07206 | 0.39678 | 24.0641 | 37.8156 |
| EPU | −3.12516 | −13.1761 | −1.77977 ** | −13.1458 *** | 57.7772 * | 239.231 *** |
| FDI | −4.09827 | −3.71423 | −4.63286 | −4.04347 | 94.6937 *** | 90.9217 ** |
| GQ | −11.9196 | −11.4280 | −8.17511 | −6.66912 | 145.876 *** | 117.500 *** |
| TO | −2.02767 | −2.4830 *** | −0.09504 | −1.76042** | 39.1578 | 62.7599 ** |
| FD | −5.73119 | −4.60698 | −1.60488 | −4.52428 | 59.4054 | 96.4665 *** |
| Y | −8.29232 | −17.8708 | −7.52229 | −17.0503 | 140.154 *** | 313.235 *** |
| Panel B: After the first difference | ||||||
| IO1 | −7.6887 *** | −7.6792 *** | −7.9772 *** | −7.7281 *** | 158.417 *** | 134.759 *** |
| IO1 | −5.5504 *** | −7.6046 *** | −7.8154 *** | −7.6033 *** | 152.665 *** | 122.011 *** |
| IO1 | −6.4886 *** | −5.2531 *** | −6.6955 *** | −4.5475 *** | 125.526 *** | 98.9149 *** |
| IO1 | −4.3618 *** | −4.0317 *** | −5.5702 *** | −4.5224 *** | 107.494 *** | 94.3955 *** |
| EPU | −13.1761 *** | −9.9788 *** | −13.1458 *** | −9.8047 *** | 239.231 *** | 170.517 *** |
| FDI | −13.8269 *** | −10.8702 *** | −13.7930 *** | −10.5625 *** | 248.373 *** | 181.749 *** |
| GQ | −19.6733 *** | −16.2543 *** | −16.4528 *** | −13.0629 *** | 300.986 *** | 222.669 *** |
| TO | −12.0092 *** | −10.9891 *** | −10.0961 *** | −7.7624 *** | 183.420 *** | 138.739 *** |
| FD | −4.6069 *** | −6.1071 *** | −4.5242 *** | −4.5863 *** | 96.4665 *** | 96.7494 *** |
| Y | −17.8708 *** | −15.0786 *** | −17.0503 *** | −14.3586 *** | 313.235 *** | 243.824 *** |
| CIPS | CADF | |||||||
|---|---|---|---|---|---|---|---|---|
| At Level | ∆ | At Level | ∆ | |||||
| C | C&T | C | C&T | C | C&T | C | C&T | |
| IO1 | −2.523 *** | −2.777 *** | −7.254 *** | −4.987 *** | −2.476 | −2.171 | −6.262 *** | −4.206 *** |
| IO2 | −2.009 | −2.426 | −3.555 *** | −7.818 *** | −2.075 | −2.428 | −5.614 *** | −3.044 *** |
| IO3 | −2.147 | −2.519 *** | −6.945 *** | −5.931 *** | −2.762 *** | −2.107 | −3.637 *** | −5.830 *** |
| IO4 | −2.631 *** | −2.100 | −7.449 *** | −3.442 *** | −2.168 | −2.506 *** | −5.507 *** | −5.933 *** |
| EPU | −2.066 | −2.724 *** | −6.232 *** | −4.553 *** | −2.887 *** | −2.948 *** | −4.773 *** | −4.138 *** |
| FCF | −2.157 | −2.307 | −8.644 *** | −6.384 *** | −2.722 *** | −2.548 *** | −6.451 *** | −8.820 *** |
| IQ | −2.983 *** | −2.864 *** | −3.758 *** | −4.548 *** | −2.678 *** | −2.413 | −3.021 *** | −8.207 *** |
| FD | −2.426 | −2.303 | −8.303 *** | −4.456 *** | −2.448 | −2.231 | −4.031 *** | −3.160 *** |
| TO | −2.988 *** | −2.895 *** | −3.878 *** | −4.826 *** | −2.096 | −2.357 | −3.168 *** | −5.139 *** |
| Y | −2.639 *** | −2.132 | −6.482 *** | −7.804 *** | −2.025 | −2.675 *** | −5.167 *** | −3.945 *** |
| LMBP [129] | LMPS Pesaran [110] | LMadj Pesaran et al. [130] | CDPS Pesaran [131] | |
|---|---|---|---|---|
| IO1 | 1935.008 *** | 79.2776 *** | 78.75381 *** | 13.7594 *** |
| IO2 | 1818.087 *** | 73.8379 *** | 73.3141 *** | 3.2761 *** |
| IO3 | 1387.307 *** | 53.7962 *** | 53.2724 *** | 19.8086 *** |
| IO4 | 451.0266 *** | 19.1012 *** | 18.6965 *** | 4.7713 *** |
| EPU | 2415.723 *** | 101.6425 *** | 101.1187 *** | 44.1026 *** |
| FCF | 378.6877 *** | 6.8715 *** | 6.3472 *** | 5.5946 *** |
| IQ | 5071.172 *** | 225.1852 *** | 224.6614 *** | 71.2119 *** |
| FD | 1896.105 *** | 77.4677 *** | 76.9438 *** | 19.9392 *** |
| TO | 1791.999 *** | 72.6242 *** | 72.1041 *** | 24.4197 *** |
| Y | 526.0243 *** | 13.7257 *** | 13.2196 *** | 15.2867 *** |
| IO | IQ | IQ | IO | EPU | FCF | IQ | FD | TO | Y | |
|---|---|---|---|---|---|---|---|---|---|---|
| ∆ | 25.315 *** | 15.874 *** | 22.875 *** | 25.881 *** | 9.745 *** | 26.445 *** | 57.844 *** | 22.154 *** | 44.594 *** | 19.314 *** |
| Adj.∆ | 32.654 *** | 18.945 *** | 25.841 *** | 32.751 *** | 11.856 *** | 29.845 *** | 75.842 *** | 32.541 *** | 55.214 *** | 22.761 *** |
| (1] | (2] | (3] | (4] | |
|---|---|---|---|---|
| Panel A: Pedroni residual cointegration test | ||||
| Panel v-Statistic | 2.6128 *** | 1.8788 | 2.1876 *** | 2.1924 *** |
| Panel rho-Statistic | −4.8664 *** | −4.4506 *** | −5.1337 ** | −2.0018 *** |
| Panel PP-Statistic | −8.2396 *** | −7.6187 | −8.7829 | −4.1809 *** |
| Panel ADF-Statistic | 2.6128 *** | −2.473 ** | −3.6422 *** | −0.2883 |
| Panel v-Statistic | −0.2543 | −0.8711 | 0.2151 | −0.3393 |
| Panel rho-Statistic | −4.5921 *** | −4.3971 *** | −5.0832 *** | −2.8298 ** |
| Panel PP-Statistic | −7.6674 *** | −7.4689 *** | −9.8478 *** | −5.7774 *** |
| Panel ADF-Statistic | −3.4287 *** | −3.1302 *** | −4.9905 *** | −1.8863 ** |
| Group rho-Statistic | −2.0634 *** | −1.6598 ** | −2.1839** | −0.4156 |
| Group PP-Statistic | −7.1695 *** | −6.6909 *** | −9.0761 *** | −5.0879 *** |
| Group ADF-Statistic | −3.1406 *** | −2.2952 ** | −4.2216 *** | −0.2049 |
| Panel B: Kao residual cointegration test | ||||
| ADF | −2.9726 *** | −1.5814 *** | −2.8971 *** | −5.8228 *** |
| Model | Gt | Ga | Pt | Pa |
|---|---|---|---|---|
| −11.24 *** | −7.884 *** | −14.221 *** | −14.775 *** | |
| −4.257 *** | −15.228 *** | −7.115 *** | −12.338 *** | |
| −9.351 *** | −6.887 *** | −8.208 *** | −21.084 *** | |
| −14.710 *** | −10.247 *** | −9.887 *** | −12.571 *** |
| Pooled | One-Way Fixed Effect | Two-Way Fixed Effect | |||
|---|---|---|---|---|---|
| Panel A: innovation output measured by patents filed by residents | |||||
| IO1 (−1) | 0.9996 *** (257.061) | 0.9609 *** (69.6812) | 0.9736 *** (66.4595) | ||
| EPU | −0.0141 *** (−4.4838) | −0.0341 ** (−3.3423) | −0.0424 ** (−7.0031) | ||
| GQ | 0.0211 (3.2586) *** | 0.0442 ** (2.3268) | 0.036 *** (4.5702) | ||
| FCF | −0.036 ** (−9.6265) | 0.074 ** (5.905) | 0.0102 *** (4.1886) | ||
| FD | 0.013 ** (5.255) | 0.0024 * (2.0807) | 0.0452 ** (4.1831) | ||
| TO | −0.0125 ** (−3.3731) | 0.0348 *** (3.6717) | 0.0995 * (3.6197) | ||
| Y | 0.0446 * (5.8144) | 0.0134 ** (5.4075) | 0.0075 ** (5.7135) | ||
| Panel B: innovation output measured by patents filed by non-residents | |||||
| IO1 (−1) | 1.0081 ** (181.6619) | 0.8082 ** (26.4778) | 0.8197 ** 24.6688 | ||
| EPU | −0.021 ** (−12.1323) | 0.096 ** (8.465) | −0.026 ** (−6.7479) | ||
| GQ | −0.0012 (−1.0577) | −0.0004 (−0.3704) | −0.0028 (−0.6915) | ||
| FDI | −0.0059 * (−1.6542) | 0.0269 *** (2.8861) | 0.0268 *** (3.7632) | ||
| FD | −0.002 (−0.1233) | 0.0587 ** (2.1663) | 0.0107 *** (3.1615) | ||
| TO | −0.011 (−0.7543) | 0.1054 (1.1831) | −0.0024 (−0.0229) | ||
| Y | 0.0193 (1.4586) | 0.012 (0.7359) | −0.0032 (−0.1737) | ||
| Panel C: innovation output measured by R&D expenditure as a percentage of GDP | |||||
| IO1 (−1) | 0.9814 *** (188.653) | 0.8979 | (43.705) | 0.932 | (41.8286) |
| EPU | 0.087 *** (−3.938) | 0.043 *** (3.068) | 0.013 *** (7.4366) | ||
| GQ | −0.0281 ** (−2.460) | −0.0271 *** (−4.496) | −0.014 *** (−5.3751) | ||
| FDI | −0.047 (−1.839) | −0.0009 (−0.203) | −0.011 (−0.3866) | ||
| FD | 0.024 *** (3.692) | −0.0094 (−0.626) | 0.03 (0.2268) | ||
| TO | −0.076 (−1.825) | 0.0711 *** (2.949) | 0.082 (2.9296) | ||
| Y | 0.025 (0.744) | −0.015 (−1.159) | −0.021 (−0.2111) | ||
| Panel D: innovation output measured by high-technology exports | |||||
| IO1 (−1) | 0.9853 *** (205.8377) | 0.8884 *** (38.0057) | 0.8759 *** (30.5931) | ||
| EPU | 0.004 *** (4.6644) | 0.0063 *** (3.6973) | 0.0047 ** (3.3398) | ||
| GQ | −0.0001 (−0.255) | −0.0005 (−1.1538) | −0.0004 (−0.2717) | ||
| FDI | 0.0052 * (3.5556) | 0.0039 (0.6361) | 0.005 (0.7557) | ||
| DCP | 0.0284 *** (3.5891) | −0.0181 (−0.8703) | −0.0252 (−1.0907) | ||
| TO | −0.0012 (−0.2458) | 0.1005 *** (2.833) | 0.0633 (1.5956) | ||
| Y | −0.0003 (−0.0726) | −0.0082 (−1.4378) | −0.0136 ** (−2.0668) | ||
| 0.15 | 0.20 | 0.30 | 0.40 | 0.50 | 0.60 | 0.70 | 0.80 | 0.90 | |
|---|---|---|---|---|---|---|---|---|---|
| Patents Filed by Residents | |||||||||
| EPU | −0.033 *** (−10.8904) | −0.024 *** (−10.685) | −0.151 *** (−14.440) | −0.098 *** (−5.314) | −0.282 *** (−0.808) | −0.549 *** (−51.624) | −0.869 *** (−72.207) | −0.126 *** (−23.034) | −0.216 *** (−44.273) |
| GQ | −0.012 (−0.349) | −0.023 (−0.341) | 0.045 ** (20.107) | 0.144 *** (40.071) | 0.341 *** (60.916) | 0.321 *** (57.154) | 0.415 *** (85.1441) | 0.575 *** (90.385) | 0.655 *** (124.122) |
| FDI | 0.092 (24.1888) | 0.071 (12.0263) | 0.015 (10.324) | 0.042 *** (15.3877) | 0.188 *** (25.1344) | 0.362 *** (57.6469) | 0.287 *** (45.2408) | 0.747 *** (82.8658) | 0.748 *** (84.6123) |
| FD | 0.087 (09.717) | 0.128 *** (21.181) | 0.139 *** (22.322) | −0.276 (−0.641) | −0.0161 (−1.128) | −0.0312 (−1.942) | −0.0183 (−0.916) | 0.0028 (0.143) | 0.0167 (0.582) |
| TO | −0.021 (−10.4593) | −0.098 (10.7667) | −0.018 (10.0791) | 0.222 *** (32.204) | 0.257 *** (37.6046) | 0.346 *** (45.474) | 0.513 *** (65.0282) | 0.5307 *** (68.7167) | 0.564 *** (67.739) |
| Y | 0.022 *** (9.235) | 0.025 *** (10.232) | 0.0304 *** (10.6885) | 0.081 *** (10.849) | 0.277 *** (31.7818) | 0.335 *** (44.9051) | 0.361 *** (45.197) | 0.479 *** (56.278) | 0.475 *** (56.389) |
| IO1 (−1) | 1.115 *** (109.595) | 1.069 *** (101.521) | 1.106 *** (101.871) | 1.137 *** (112.464) | 1.179 *** (117.971) | 1.230 *** (126.452) | 1.151 *** (113.759) | 1.119 *** (115.282) | 1.154 *** (121.714) |
| IO1 (−2) | −0.1032 (−0.9036) | −0.0602 (−0.6554) | −0.1008 (−1.0823) | −0.1344 (−1.4678) | −0.1741 (−2.6201) | −0.2245 (−2.9386) | −0.1529 (−1.8683) | −0.1329 (−1.7573) | −0.1759 (−3.272) |
| EPU | −0.015 *** (−9.014) | −0.029 *** (−9.774) | −0.328 *** (−43.842) | −0.381 *** (−48.554) | −0.421 *** (−52.014) | −0.622 *** (−78.511) | −0.734 *** (−87.214) | −0.763 *** (89.914) | −0.833 *** (−97.251) |
| GQ | −0.095 (−0.001) | −0.012 (−0.047) | −0.056 (0.121) | 0.025 *** (8.557) | 0.091 *** (11.245) | 0.254 *** (35.484) | 0.312 *** (42.785) | 0.417 *** (52.784) | 0.451 *** (55.842) |
| FDI | −0.003 (−0.001) | −0.001 (−0.007) | 0.014 *** (0.007) | 0.213 *** (34.215) | 0.156 *** (27.512) | 0.186 *** (29.754) | 0.212 *** (31.745) | 0.384 (42.845) | 0.313 (42.75) |
| FD | −0.019 (−0.008) | −0.024 (−0.041) | 0.019 *** (6.142) | 0.027 *** (8.021) | 0.142 *** (21.054) | 0.387 *** (47.207) | 0.417 *** (52.774) | 0.523 *** (64.784) | 0.516 *** (64.857) |
| TO | 0.013 (0.002) | 0.015 (0.004) | 0.006 (0.007) | 0.014 *** (8.012) | 0.018 *** (7.051) | 0.257 *** (37.845) | 0.262 *** (38.154) | 0.322 *** (43.512) | 0.411 *** (52.75) |
| Y | 0.023** (9.854) | 0.024 *** (7.852) | 0.147 *** (21.745) | 0.168 *** (29.845) | 0.174 *** (26.773) | 0.137 *** (25.441) | 0.123 *** (23.154) | 0.206 *** (31.842) | 0.283 *** (37.845) |
| IO1 (−1) | 1.057 *** (110.145) | 1.054 *** (112.574) | 1.076 *** (117.862) | 1.643 *** (185.945) | 1.062 *** (110.855) | 1.548 *** (175.007) | 1.062 *** (110.845) | 1.403 *** (154.254) | 1.046 *** (110.845) |
| IO1 (−2) | −0.027 (−0.0215) | −0.0023 (−0.451) | −0.0057 (−0.5512) | −0.0029 (−0.8415) | −0.0091 (−0.5512) | −0.0005 (−0.8451) | −0.0054 (−0.0541) | −0.0081 (−0.5531) | −0.0040 (−0.1201) |
| R@D | |||||||||
| EPU | 0.016 *** (8.124) | 0.023 *** (9.845) | 0.055 *** (10.452) | 0.067 *** (11.421) | 0.164 *** (22.751) | 0.184 *** (28.341) | 0.267 *** (37.154) | 0.265 *** (36.754) | 0.495 *** (55.845) |
| GQ | −0.002 (−0.005) | −0.0015 (0.004) | −0.0046 −(0.005) | 0.027 *** (5.341) | 0.244 *** (35.754) | 0.351 *** (46.742) | 0.134 *** (24.761) | 0.313 *** (43.751) | 0.398 *** (48.974) |
| FDI | −0.0043 (−0.008) | −0.0038 (0.004) | −0.005 (0.005) | 0.016 *** (6.045) | 0.087 *** (10.541) | 0.026 *** (5.742) | 0.118 *** (22.841) | 0.642 *** (75.845) | 0.577 *** (66.844) |
| FD | 0.0013 (0.007) | 0.029 (5.021) | 0.032 (5.124) | 0.042 *** (6.751) | 0.186 *** (28.315) | 0.210 *** (32.541) | 0.483 *** (59.314) | 0.721 *** (83.214) | 0.751 *** (88.845) |
| TO | 0.0062 (0.004) | 0.021 (5.142) | 0.038 (0.599) | 0.074 *** (11.452) | 0.257 *** (36.745) | 0.262 *** (37.552) | 0.322 *** (43.854) | 0.451 *** (56.754) | 0.544 *** (65.254) |
| Y | −0.0063 (−0.1141) | −0.0099 (−0.417) | −0.0054 (−0.712) | −0.004 (−0.541) | 0.034 *** (5.152) | 0.045 *** (5.345) | 0.132 *** (23.451) | 0.283 *** (38.214) | 0.287 *** (39.745) |
| IO1 (−1) | 1.215 *** (132.45) | 1.357 *** (144.751) | 1.267 *** (133.754) | 1.252 *** (134.251) | 0.933 *** (98.311) | 0.222 *** (35.334) | 0.160 *** (25.845) | 0.065 *** (11.745) | 0.072 *** (3.542) |
| IO1 (−2) | −0.0078 (−0.875) | −0.0011 (−0.647) | −0.0092 (−0.812) | −0.0049 (−0.745) | −0.0052 (−0.667) | −0.0044 (−0.554) | −0.0045 (−0.754) | −0.0077 (−0.557) | −0.0055 (−0.664) |
| Export | |||||||||
| EPU | −0.056 *** (−8.512) | −0.018 *** (−5.142) | −0.029 *** (−5.214) | −0.145 *** (−45.214) | −0.178 *** (−75.214) | −0.164 *** (−12.512) | −0.295 *** (−8.314) | −0.194 *** (−77.312) | −0.271 *** (−12.512) |
| GQ | −0.0032 (−0.6614) | −0.0001 (−0.0541) | 0.062 *** (−5.314) | 0.015 *** (12.512) | 0.018** (5.154) | 0.024 *** (4.614) | 0.029 *** (12.374) | 0.096 *** (21.612) | 0.233 *** (23.641) |
| FDI | −0.0051 (−0.6671) | −0.0012 (0.4423) | −0.0019 (−0.4421) | 0.046 *** (12.314) | 0.191 *** (32.415) | 0.281 *** (8.194) | 0.318 *** (23.845) | 0.356 *** (55.314) | 0.426 *** (45.214) |
| FD | 0.018 *** (5.315) | 0.019 *** (12.367) | 0.024 *** (2.452) | 0.087 *** (11.361) | 0.028 *** (25.142) | 0.132 *** (32.845) | 0.252 *** (45.315) | 0.461 *** (45.677) | 0.527 *** (75.612) |
| TO | 0.0013 (0.6614) | 0.0021 (0.5512) | 0.028 *** (5.314) | 0.268 *** (45.761) | 0.121 *** (25.314) | 0.128 *** (55.314) | 0.211 *** (75.612) | 0.275 *** (55.314) | 0.341 *** (65.842) |
| Y | 0.014 *** (5.312) | 0.011 *** (9.314) | 0.0084 *** (5.614) | 0.262 *** (75.612) | 0.171 *** (21.351) | 0.186 *** (45.612) | 0.289 *** (29.751) | 0.329 *** (44.123) | 0.376 *** (56.812) |
| IO1 (−1) | 1.058 *** (25.314) | 1.031 *** (75.612) | 1.034 *** (45.315) | 1.133 *** (55.751) | 1.083 *** (75.612) | 1.059 *** (85.751) | 1.067 *** (11.512) | 1.478 *** (85.315) | 1.788 *** (55.314) |
| IO1 (−2) | −0.006 (−0.552) | −0.0043 (−0.3315) | −0.0035 (−0.4475) | −0.0024 (−0.2241) | −0.0042 (−0.5585) | −0.0023 (−0.6631) | −0.006 (0.5574) | −0.0018 (0.3312) | −0.0076 (0.8842) |
| Short-Run Causalities | Long-Run | |||||||
|---|---|---|---|---|---|---|---|---|
| IO | EPU | GQ | FDI | FD | TO | Y | ECT(t−1) | |
| Panel A: Innovation measured by patent application by a resident | ||||||||
| IO | - | 13.7081 *** | 10.8752 *** | 10.926 *** | 12.8905 *** | 4.678 * | 8.829 *** | 15.942 *** |
| EPU | 1.3682 | - | 0.614 | 7.635 ** | 3.977 | 8.1622 *** | 0.532 | 9.745 *** |
| GQ | 8.7453 *** | 0.325 | - | 7.616 ** | 3.731 | 1.505 | 10.919 *** | 4.754 * |
| FDI | 0.2617 | 9.901 *** | 3.9016 | - | 20.9642 *** | 6.612 ** | 13.3424 *** | 13.887 ** |
| FD | 2.3267 | 0.7983 | 11.611 *** | 0.4477 | - | 6.436 ** | 2.403 | 1.084 |
| TO | 2.1109 | 4.338 | 10.4984 *** | 4.1914 | 11.2344 *** | - | 2.8532 | 2.845 |
| Y | 5.9068 ** | 5.683 ** | 2.9454 | 10.862 *** | 1.8464 | 4.2914 * | - | 45.214 *** |
| Panel A: Innovation measured by patent application by a resident | ||||||||
| IO | - | 10.879 *** | 11.427 *** | 0.175 | 9.736 *** | 21.386 *** | 0.645 | 15315 *** |
| EPU | 4.6264 | - | 7.181 ** | 10.115 *** | 12.554 *** | 7.7127 *** | 0.3237 | 12.514 *** |
| GQ | 8.1228 *** | 0.4265 | - | 4.8791 * | 12.522 *** | 6.205 *** | 12.461 *** | 10.751 *** |
| FDI | 8.1843 *** | 64.251 *** | 3.155 | - | 22.901 *** | 12.276 *** | 9.992 *** | 5.315 ** |
| FD | 0.169 | 7.699 ** | 0.358 | 0.183 | - | 6.292 * | 13.449 ** | 12.384 *** |
| TO | 0.553 | 10.599 *** | 0.384 | 0.017 | 11.025 *** | - | 0.078 | 4.315 |
| Y | 12.512 *** | 7.7828 * | 0.5653 | 14.787 *** | 0.0545 | 5.518 * | - | 16.912 *** |
| Panel A: Innovation measured by R&D | ||||||||
| IO | - | 12.747 *** | 3.440 | 0.814 | 7.115 *** | 2.745 | 11.497 *** | 22.945 *** |
| EPU | 1.253 | - | 0.293 | 0.072 | 15.912 *** | 0.449 | 1.502 | 11.674 ** |
| GQ | 0.442 | 1.925 | - | 7.693 ** | 0.866 | 9.232 ** | 10.157 ** | 2.41 |
| FDI | 12.971 *** | 10.687 *** | 2.0653 | - | 36.529 *** | 0.879 | 8.510 ** | 6.751 ** |
| FD | 0.4229 | 13.416 *** | 8.636 ** | 0.555 | - | 5.328 * | 13.042 *** | 10.612 *** |
| TO | 0.0063 | 0.0154 | 5.543 * | 0.834 | 12.098 *** | - | 0.653 | 3.451 |
| Y | 5.115 * | 0.8508 | 5.035 * | 0.9129 | 11.706 ** | 1.9331 | - | |
| Panel A: Innovation measured by high-tech exports | ||||||||
| IO | - | 10.5647 *** | 0.1918 | 10.2354 *** | 12.933 *** | 0.624 | 0.0212 | 12.345 *** |
| EPU | 13.318 *** | - | 10.384 *** | 0.046 | 13.1641 *** | 0.541 | 1.483 | 15.945 *** |
| GQ | 0.498 | 1.709 | - | 6.2187 *** | 0.0001 | 5.246 * | 0.033 | 9.614 *** |
| FDI | 7.5818 *** | 8.8561 ** | 0.2325 | - | 9.4897 *** | 0.043 | 5.537 * | 1.882 |
| FD | 0.7715 | 0.0091 | 5.805 * | 0.9405 | - | 8.773 ** | 12.441 *** | 2.485 |
| TO | 0.3746 | 0.0206 | 0.0249 | 5.028 * | 0.2295 | - | 0.4367 | 3.481 |
| Y | 0.008 | 0.5157 | 5.905 * | 5.297 * | 0.5411 | 11.634 *** | - | 16.841 *** |
| Causality | [1] | [2] | [3] | [4] |
|---|---|---|---|---|
| IO ← ≠ → EPU | ← | ← | ← | ←→ |
| IO ← ≠ → IQ | ←→ | ←→ | NA | NA |
| IO ← ≠ → FDI | ← | → | → | ←→ |
| IO ← ≠ → FD | ← | ← | ← | ← |
| IO ← ≠ → TO | ← | ← | NA | NA |
| IO ← ≠ → Y | ←→ | → | ←→ | NA |
| EPU ← ≠ → IQ | NA | NA | NA | ← |
| EPU ← ≠ → FDI | ←→ | ←→ | → | → |
| EPU ← ≠ → FD | ←→ | → | ← | |
| EPU ← ≠ → TO | ← | ←→ | ← | ← |
| EPU ← ≠ → Y | → | ←→ | NA | NA |
| IQ ← ≠ → FDI | NA | ← | ← | ← |
| IQ ← ≠ → FD | ←→ | ← | → | → |
| IQ ← ≠ → TO | → | ← | ←→ | ← |
| IQ ← ≠ → Y | ← | ← | ←→ | → |
| FDI ← ≠ → FD | ← | ← | ← | ← |
| FDI ← ≠ → TO | ←→ | ← | NA | ← |
| FDI ← ≠ → Y | ← | ←→ | ← | ←→ |
| FD ← ≠ → TO | ← | ←→ | ←→ | ← |
| FD ← ≠ → Y | NA | ← | ← | ← |
| TO ← ≠ → Y | → | → | → | → |
Publisher’s Note: MDPI stays neutral with regard to jurisdictional claims in published maps and institutional affiliations. |
© 2021 by the authors. Licensee MDPI, Basel, Switzerland. This article is an open access article distributed under the terms and conditions of the Creative Commons Attribution (CC BY) license (https://creativecommons.org/licenses/by/4.0/).
Share and Cite
Qamruzzaman, M.; Tayachi, T.; Mehta, A.M.; Ali, M. Do International Capital Flows, Institutional Quality Matter for Innovation Output: The Mediating Role of Economic Policy Uncertainty. J. Open Innov. Technol. Mark. Complex. 2021, 7, 141. https://doi.org/10.3390/joitmc7020141
Qamruzzaman M, Tayachi T, Mehta AM, Ali M. Do International Capital Flows, Institutional Quality Matter for Innovation Output: The Mediating Role of Economic Policy Uncertainty. Journal of Open Innovation: Technology, Market, and Complexity. 2021; 7(2):141. https://doi.org/10.3390/joitmc7020141
Chicago/Turabian StyleQamruzzaman, Md, Tahar Tayachi, Ahmed Muneeb Mehta, and Majid Ali. 2021. "Do International Capital Flows, Institutional Quality Matter for Innovation Output: The Mediating Role of Economic Policy Uncertainty" Journal of Open Innovation: Technology, Market, and Complexity 7, no. 2: 141. https://doi.org/10.3390/joitmc7020141
APA StyleQamruzzaman, M., Tayachi, T., Mehta, A. M., & Ali, M. (2021). Do International Capital Flows, Institutional Quality Matter for Innovation Output: The Mediating Role of Economic Policy Uncertainty. Journal of Open Innovation: Technology, Market, and Complexity, 7(2), 141. https://doi.org/10.3390/joitmc7020141