Abstract
The role of R&D (research and development) intensity on the effect of knowledge services on the business performance of firms has been discussed by using PLS-SEM and PLS-MGA methods. Research groups were divided into two groups, innovative and non-innovative. Respondents were classified into innovative firms if their R&D intensity was over 3% and vice versa. PLS-SEM and PLS-MGA results were compared for two groups and valuable insights were extracted. For innovative firms, knowledge services seemed to be verified and processed by the decision makers and utilized to achieve their business performance. On the other hand, a large number of non-innovative firms seemed to have a stronger tendency to utilize knowledge services directly for their business without sufficient verification by the decision makers.
1. Introduction
Since the 2000s, the global economy has been moved into a knowledge-based economy in which knowledge and ideas play key roles in economic activities. The OECD defines a knowledge-based economy as “an economy that is based directly on the production, distribution and use of knowledge and information” [1]. In the knowledge-based economy, knowledge and technology are emphasized and knowledge is utilized at every stage of value creation such as the input, process and output of products or services. Recently, due to the advent of a knowledge-based economy, knowledge services have received great attention from researchers in innovation studies because the importance of knowledge is greater than ever before.
Generally, knowledge services are defined as the services that provide knowledge-intensive information to the business processes of other firms or public institutes [2]. The term of knowledge services (KSs) is widely used as knowledge-intensive business services (KIBS) by several researchers. Miles et al. [3] explained the three major characteristics of KIBS as follows:
- They depend heavily upon professional knowledge;
- They use knowledge to make intermediate services for their customers’ production processes;
- They are of competitive importance and supplied mainly to a business.
Based on these characteristics, Miles et al. emphasized that KIBS carry on economic activities to induce the creation, accumulation or dissemination of knowledge [3]. There are other definitions of KIBS in the literature. Muller and Doloreux defined KIBS as service firms that have a high knowledge intensity and offer services to other organizations non-routinely [4]. According to Bettencourt et al., KIBS has been defined as firms whose main value added activities are composed of the accumulation, creation or dissemination of knowledge to develop a customized service or product solution to meet the client’s needs [5]. By the definition of Den Hertog et al., KIBS is referred to as firms that depend upon knowledge or expertise that are related to a specific area or functional domain to supply intermediate products and knowledge-based services [6].
KIBS also can be defined according to the NACE (a European classification of economic activities) scheme. By using the nomenclature of NACE, which has been increasingly popular for the definition of KIBS in Europe, KIBS can be classified into computer and related activities, research and development (R&D) and other business services [7]. Muller et al. [4] insisted that there is a problem to classify and define KIBS according to the NACE scheme as “many of the new services and activities do not fit into the traditional classification scheme”. Hipp [8] also argued that it does not make sense to define KIBS by using the official industry classification. Accordingly, she defined KIBS as firms that have the ability to assimilate external knowledge and to transform them together with a firm’s knowledge base into useful services for their clients.
The objective of our study is to discuss the moderating role of R&D intensity in the relationship between knowledge services and business performance. Our previous findings showed that the decision making of SMEs (small and medium sized enterprises) plays a mediating role when information provided by knowledge services affects business performance [9]. In addition, technology and the market dynamism have been addressed as moderating variables in the mediating effect of decision making on business performance [10]. Our former research models have been revised to address the moderating effect of R&D intensity on the business performance by knowledge services.
Our research questions are as follows.
- RQ1.
- Do knowledge services have a significant and positive effect on the business performance of firms?
- RQ2.
- Do knowledge services have a significant and positive effect on the decision making of SMEs?
- RQ3.
- Does the decision making of SMEs have a significant and positive effect on the business performance of firms?
- RQ4.
- Does the decision making of SMEs have a significantly mediating role in the relationship between knowledge services and the business performance of firms?
- RQ4.
- Does the R&D investment play a significantly moderating role in the relationship between knowledge services and the business performance of firms?
- RQ5.
- Does the R&D investment play a significantly moderating role in the relationship between the decision making of SMEs and the business performance of firms?
2. Literature Review
2.1. KSs and Decision Making
According to Ackoff and Emory [11], knowledge is defined as an “awareness of the efficiency and effectiveness of different action in producing outcomes based on experience”. On the other hand, Nonaka [12] defined knowledge as “a flow of messages, derived from either the flow of information or the ways by which the information is organized or structured”. He also discussed the distinctive nature of knowledge: ‘tacit’ vs. ‘explicit’. ‘Tacit’ knowledge is experience-based, intuitive and intangible. Due to its unstructured nature, it is difficult to transfer, model or pinpoint ‘tacit’ knowledge. The skills and experience of employees can be typical examples of ‘tacit’ knowledge. On the contrary to ‘tacit’ knowledge, ‘explicit’ knowledge has structured characteristics and can be easily manipulated, organized and transferred. Financial reports, marketing research reports and customer databases can be examples of ‘explicit’ knowledge.
There are several methods for decision making such as the phase model [13,14], cognitive mapping [15,16,17], CTA (cognitive task analysis) [18,19], RPD (recognition-primed decision) [20,21] and KBDM (knowledge-based decision making) [22,23,24,25]. Decision making methods can be applied according to the knowledge nature (explicit or tacit) and decision environments (static or dynamic). KBDM is preferred if the knowledge nature is tacit and the decision environments are dynamic. Top managers of SMEs usually use tacit knowledge and deal with strategic issues in the dynamic decision environments. KBDM by using KSs is a kind of open innovation strategy as KSs are described in the literature as key innovation mediators and innovative ideas merged together by different experts or organizations through KSs [26,27,28,29].
2.2. KSs, Innovation and Firm Performance
It has been reported in several studies that KSs play an important role in the innovation process of customers [2,3,4,6,30,31,32,33]. Doloreux and Shearmur [33], Den Hertog [6] and Shi et al. [2] describe the three major functions of KSs as sources, facilitators and carriers of innovation for their client firms. KSs act as sources of innovation when they provoke innovations for their clients. They are facilitators of innovation when they collaborate with their clients in the innovation process. Finally, they are carriers of innovation when they directly take part in innovations with their clients. According to the research of Larsen [30] and Muller and Zenker [31], KSs were recognized not only to contribute to the innovation capabilities of their clients but also to be innovative by themselves. Based on these perspectives, Den Hertog [6] and Gadrey [34] suggested that KSs play a role of a co-innovator for the client firms. The influence of KSs on the clients’ innovation is not unidirectional; that is, KSs and SMEs have interactive service relations and mutually contribute to their respective innovation capacities [31].
Usually, the innovation of firms is closely related to their organizational performance; however, there are few studies addressing the relationship between KSs and the latter. Kamp discussed whether KSs contribute to international business activity [35] and found a strong fit between the consumption of KSs and international competitiveness parameters such as turnover and export performance. Davila et al. investigated the relationship between knowledge absorptive capacity, innovation performance and organizational performance in Brazilian firms [36]. Their study revealed that knowledge absorptive capacity has a significant relevance with innovation and organizational performance and also that realized knowledge absorptive capacity has a stronger impact on innovation performance than potential knowledge absorptive capacity. Pereira and Leitão reported the effect of absorptive capacity and coopetition on the generation of product innovation for Italian and Portuguese firms [37]. The acquisition of external R&D, internal R&D activities and the expertise of employees were selected as enablers or determinant factors of absorptive capacity. They showed that absorptive capacity and coopetition had a positive and significant relationship with innovation in most manufacturing firms. Tomlinson [38,39] and Baker [40] focused on the gains of productivity or national value added that client manufacturing sectors could obtain from KSs by using an input-output framework. They introduced KSs as an input in the production function and dealt with the impacts of KSs in the industry or at a national level, not at the firm level. On the other hand, a few researchers have investigated the relationship between knowledge input and organizational innovation in KS firms [41,42,43].
2.3. Moderating Effect of R&D Intensity
R&D intensity refers to the ratio of R&D expenditure to the firm’s revenue. Morbey reported on the effects of R&D spending on company performance for the major US companies from 1976 to 1985 [44]. He found a strong correlation between R&D spending and subsequent sales growth. However, he concluded that there is an R&D funding threshold level to contribute to future sales growth. Connolly and Hirschey discussed the effects of firm size and R&D on Tobin’s Q selecting US companies in 1997–2001 as a sample [45]. They insisted that R&D intensity had a positive correlation with a firm’s market value. Xu and Jin investigated the relationship of R&D investment and a firm’s performance in the IOT (internet of things) industry [46]. In their study, there was a positive relationship between R&D investment and the profit margin in the current and next year. However, cumulative R&D investment had a negative influence on a firm’s performance. Li investigated the relationship between a firm’s R&D intensity and performance [47]. His research showed that current R&D investment did not immediately affect a firm’s performance. On the other hand, Savrul et al. addressed the effect of R&D intensity on innovation performance not at the firm level, but at the country level [48]. Cassiman and Veugelers [49] and Li [50] insisted that the more firms invested in internal R&D activities, the more prepared they were to innovatively absorb external knowledge.
Several studies have reported on the moderating role of R&D intensity. Xie et al. discovered that R&D intensity has a significant moderating role on the effect of the non-R&D innovation of firms on a new product performance [51]. Carvache-Franco et al. examined the moderating effect of R&D intensity on the relationship between sources of information and innovative performance [52]. Berchicci et al. revealed the moderating effect of R&D intensity from the relationship between remote collaboration and innovative performance [53]. They showed that the relationship had no statistical significance at a low R&D intensity. Dieguez-Soto et al. investigated the moderating effect of R&D intensity on the relationship between family management and a firm’s performance [54]. Their results showed that R&D intensity negatively moderated the effect of family management on a firm’s performance.
3. Methods
A survey was conducted to collect data that were related to independent, dependent and mediating variables. A total of 1384 SMEs that received and utilized KISTI knowledge services more than once was invited to the survey. An online questionnaire was implemented and the questionnaire was sent to the target users by email. The questionnaire details can be found in Appendix A. The online survey was carried out for two months and 308 firms responded to the survey with a response rate of 22.3%.
Our research model is shown in Figure 1. The information utilization of knowledge services was used as an independent variable and the contribution degree to the decision making of SMEs was introduced as a mediating variable. Business performance such as the contribution degree to the growth of current revenue, future exports and employment were selected as dependent variables. The moderating role of R&D intensity of the survey-responded firms was investigated by using PLS-SEM (partial least squares-structural equation modeling) and PLS-MGA (multi-group analysis). A SmartPLS program was used to analyze the collected data.
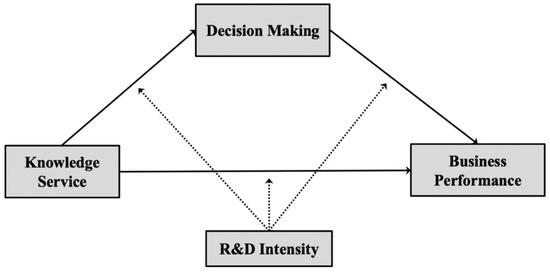
Figure 1.
Research Model.
To elucidate the moderating effect of R&D intensity, respondents were divided into two research groups, innovative and non-innovative. If a firm’s R&D intensity was over 3%, they were classified as innovative firms. On the other hand, if their R&D intensity was below 3%, they were regarded as non-innovative firms. As the EU aimed to achieve R&D intensity up to 3% by 2020 [55], innovative and non-innovative firms were distinguished by referring to the value.
4. Results and Discussion
The characteristics of the respondents for the survey were analyzed as shown in Table 1. Most respondents were from firms with a revenue of USD 0~12 million, employees of 1~50 and R&D costs of USD 0~0.05 million. They accounted for over 75% of the total responses. Respondents who belonged to firms with revenue of USD 12-150 million or 50~300 employees accounted for about 22% and they were from firms where R&D costs accounted for 16.2% (USD 0.5~2 million). On the other hand, 2~3% respondents were from relatively large-sized firms with a revenue greater than USD 150 million and employee numbers greater than 300. There were also 20 respondents who belonged to firms with R&D costs of more than USD 2 million.

Table 1.
Responsive Characteristics.
Table 2 shows the descriptive statistics and correlations for the constructs of KS (utilization degree of knowledge services), DM (contribution degree of knowledge services to the decision making of firms) and PERF (contribution degree of knowledge services to the business performance of firms). The mean values of KS, DM and PERF were 75.55%, 47.34% and 31.68%, respectively. The utilization degree of knowledge services was as high as 75.55%. KISTI knowledge services contributed to the decision making of firms at a rate of 47.34% and to the business performance of firms as much as 31.68%. From the correlation results, KS had a positive significant correlation with DM; however, there was no significant correlation between KS and PERF. Additionally, DM had a positive significant correlation with PERF. It could be seen that KISTI KSs had an indirect effect on the business performance of firms by contributing to the decision making of them. The direct effect of KSs on the business performance of firms was very weak and non-significant as the correlation coefficient between KS and PERF was 0.061. It could be confirmed that these results were consistent with the results of our previous studies [9,10].
Table 2.
Descriptive Statistics and Correlations Matrix.
Table 3 shows the results of the convergence validity and reliability for the constructs. PLS-SEM can be evaluated by two stages: a measurement model (inner model) and a structural model (outer model). In the measurement model, which is also called an inner model, indicator loadings, Cronbach’s alpha, the composite reliability and AVE should be examined. The recommended threshold value of the indicator loadings is 0.7 as it means that over 50% of the indicators’ variance can be explained by the construct. The composite reliability and Cronbach’s alpha evaluate the internal consistency reliability of the constructs. Their standardized values range from 0 to 1. The closer their values are to 1, the higher the reliability of the construct is. Values over 0.7 are considered statistically acceptable. The convergence validity can be assessed by the average variance extracted (AVE) values for all constructs. The AVE value can be calculated as the mean of all squared indicator loadings related to each construct. If the AVE value is over 0.5, it indicates that over 50% of the variance of the indicators can be explained by their constructs. After the measurement modeling has been conducted, the structural model should be assessed. In PLS-SEM, there is no standard goodness-of-fit statistic. Normally, path coefficients are tested in the validation of a structural model. Standardized path coefficients range from −1 to 1. If the path coefficients are closer to +1, it represents strong positive relationship between one endogenous latent variable and the other variable. On the contrary, if the path coefficients are closer to −1, it indicates a strong negative relationship. The R2 value of each endogenous latent variable should be evaluated to determine the predictive accuracy of the research model and range 0 from 1. The closer the R2 value is to 1, the higher the prediction accuracy is.
Table 3.
Convergence Validity and Reliability.
As shown in Table 3, there were three constructs in our study. As each of the two constructs such as KS and DM have only one indicator, there was no need to test the convergence validity and reliability for these constructs. On the other hand, the other construct, PERF, has three indicators; therefore, the indicator loadings, Cronbach’s alpha, composite reliability and AVE were examined for this construct. The indicator loadings for PERF1, PERF2 and PERF3 were 0.900, 0.883 and 0.766, respectively. All of the indicator loadings were over 0.7 and also the AVE value was 0.726, which was greater than the threshold value of 0.5, indicating that the construct PERF could explain 50% of the variance of all indicators. As the AVE value of the construct PERF was over 0.5, it could be confirmed that the convergence validity was satisfied for the construct. Cronbach’s alpha and the composite reliability were 0.811 and 0.888, respectively, satisfying the internal consistency reliability for the construct.
The discriminant validity can be determined by the Fornell and Larcker criterion [56]. The AVE values of each construct are compared with the squared correlations in the discriminant validity test. If the AVE values of each construct are greater than the squared correlations between one construct and the other constructs, it indicates that the discriminant validity for the construct has been satisfied. Table 4 shows the result of the discriminant validity test. Diagonal entries are AVE values and entries below the diagonal are squared correlation values. As all AVE values in Table 4 were greater than the squared correlations, it could be confirmed that the discriminant validity was satisfied.
Table 4.
Discriminant Validity Test.
Table 5 shows the results of the structural model test to examine the statistical significance and relevance of the structural paths. Based on the ratio of R&D cost to revenue, respondents were divided into two groups, innovative firms and non-innovative firms. If the ratio exceeded 3%, the respondents were classified as innovative firms and below that, they were classified as non-innovative firms. For the innovative firms, the path coefficients for structural paths I, II and III were −0.015, 0.504 and 0.360, respectively. Both structural path II (from KS to DM) and path III (from DM to PERF) had a statistical significance; however, there was no statistical significance in the structural path I (from KS to PERF). KS had an indirect effect on PERF mediated by DM. The indirect effect was 0.181. As the direct effect was non-significant and weak, it could be seen that KS had a fully-mediated effect on PERF through DM. On the other hand, for non-innovative firms, all of the structural paths showed a statistical significance. The path coefficients for structural paths I, II and III were 0.138, 0.389 and 0.305, respectively. As structural path I was significant and its direct effect was slightly greater than the indirect effect, it could be seen that KS had a partially-mediated effect on PERF through DM.
Table 5.
Structural Model Test.
The PLS-SEM results in Table 5 indicated that the utilization of knowledge services affected the achievement of the business performance of firms. However, the results of the two groups were different. In the case of innovative firms, knowledge services affected business performance through the decision making process of the SME executives. The direct effect from knowledge services to business performance had no statistical significance. The decision making process of the SME executives mediated the influence of knowledge services on business performance. It could be seen that, for innovative firms, the decision making of the SME executives played a major role in the influence of knowledge services on business performance. On the other hand, for non-innovative firms, knowledge services had a direct effect on business performance and also affected them indirectly through the decision making of the SME executives. The direct effect was slightly greater than the indirect effect; however, the difference between the two effects was negligible. Therefore, it could be concluded that the two effects affected business performance almost equally.
The path coefficients of structural path II and III for innovative firms were higher than those for non-innovative firms. These results indicated that knowledge services had higher impacts on the decision making of the SME executives for innovative firms than for non-innovative firms. In addition, the route from the decision making of the SME executives to business performance was more effective for innovative firms. The main difference between innovative and non-innovative firms was in structural path I. This difference was supported by the results of the PLS-MGA in Table 6. The PLS-MGA method was used to statistically analyze the differences in the SEM results among the different groups. In our study, the PLS-MGA was conducted for the two groups, innovative and non-innovative firms. In the PLS-MGA, if the p-value of each path was over 0.95 or below 0.05, it was generally judged that the path coefficients of the two groups were statistically different. As shown in Table 6, the p-values for the differences of path I, II and III coefficients were 0.956, 0.123 and 0.290, respectively. The PLS-MGA results in Table 6 indicated that the difference of the path I coefficients for the two groups was statistically significant. However, path II and III coefficients showed no significant differences.
Table 6.
Analysis Results of the PLS-MGA.
Path I could be considered to mean that the information provided by the knowledge service directly affected the business performance of firms. On the other hand, path II and III indicated that the information provided by the knowledge service affects a firm’s business performance through the decision making process of the SME executives. From the results of the PLS-SEM and PLS-MGA, the reason why path I of innovative firms was not statistically significant seemed to be that, for innovative firms, most of the information provided by knowledge services was sufficiently verified and processed by the decision makers and was utilized to achieve their business performance. However, for non-innovative firms, the direct effect of path I was greater than the indirect effect from path I to path III through path II. It seemed that a large number of non-innovative firms directly utilized information from knowledge services in their business without undergoing sufficient verification or processing by the decision makers. As the indirect effect from path I to path III mediated by path II was significant, it could be seen that a number of non-innovative firms, like innovative firms, utilized the information from knowledge services for their business operations through a sufficient review by the decision makers.
The above research results were closely related to the absorptive capacity of firms. Absorptive capacity is usually defined as the capacity to assimilate and align external knowledge with a firm’s knowledge base and to apply it in a firm’s R&D activities. Corso et al. [57] and Garcia-Morales et al. [58] suggested that a strong absorptive capacity affects a firm’s innovation by improving the capacity to access external knowledge. According to Escribano et al. [59] and Lin et al. [60], innovative firms are more likely than non-innovative firms to extract valuable insights from external knowledge by integrating them with their knowledge stocks. From the PLS-SEM results as shown in Table 4, it seemed that innovative firms with an R&D intensity over 3% had a stronger absorptive capacity than non-innovative firms. Wu and Voss [61] insisted that when firms have a stronger absorptive capacity they can assimilate and exploit new business ideas and knowledge impacting more on a firm’s business innovation.
Firms introducing knowledge services as a strategy of open innovation showed different behaviors according to R&D intensity, which is the ratio of R&D investment to revenue. The open innovation strategy of firms seemed to be more effective with a high R&D intensity. However, a high R&D intensity itself did not act as a catalyst for an open innovation strategy. As the path II/III coefficients for innovative firms, as shown in Table 5, were higher than those of non-innovative firms, it could be seen that a high R&D intensity enhanced the KBDM of firms. In other words, if the ratio of R&D investment to revenue of firms increased, the SME executives could have a more critical view of knowledge services and also their capability to verify external knowledge could be reinforced.
From our research results in Table 5, it could be concluded that a firm’s R&D intensity had a significant effect with a positive moderation on the relationship between knowledge services and a firm’s business performance. This result, which was related to R&D intensity, was consistent with several previous studies [51,52,53]. According to Cassiman and Veugelers [49] and Li [50], when R&D intensity is high, firms can be more prepared to achieve business performance. Martín-de Castro [62] addressed the definition of absorptive capacity as a set of four dimensions; (1) identification, (2) assimilation, (3) transformation, (4) exploitation of external knowledge. Transformation refers to the combination of a firm’s own knowledge stocks and acquired external knowledge. Exploitation represents applying the transformed knowledge to generate the innovation of firms. For innovative firms, it was judged that the transformation and exploitation of external knowledge took place more actively than non-innovative firms.
From Table 5 and Table 6, it could be concluded that when the R&D intensity of firms increased, the absorptive capacity of firms accordingly increased. The strengthened absorptive capacity promoted the open innovation of firms by the decision making of a firm’s executives and employees. The transformation and exploitation of external knowledge occurs during the decision making process of firms. It becomes more active when the R&D intensity of firms is high. On the other hand, if the R&D intensity of firms is low, there may be a higher tendency for firms to utilize knowledge services directly to achieve business performance as the transformation and exploitation of external knowledge would be less active and absorption capacity would be low. Therefore, securing a high R&D intensity can be a positive and desirable strategy to generate open innovation and achieve a firm’s business performance.
5. Conclusions
In our study, the mediating role of R&D intensity was discussed regarding the effect of knowledge services on the business performance of firms. The PLS-SEM method was introduced to discuss the effect of knowledge service on business performance and the PLS-MGA method was used to study the mediating role of R&D intensity. Respondents were divided into two groups, innovative firms and non-innovative firms, to discuss the mediating role of R&D intensity. From the PLS-SEM and PLS-MGA results, for innovative firms, knowledge services seemed to be utilized intensively by the decision makers and applied to their business operations. On the other hand, for non-innovative firms, knowledge services seemed to be utilized directly for business operations or were sufficiently verified by the decision makers. It could be seen that the former tendency was greater than the latter. These results indicated that, in the case of innovative firms with a large ratio of R&D expense to revenue (over 3% in our study), information from knowledge services was mainly utilized after sufficient verification and processing by the decision makers. As innovative firms have a high R&D intensity and absorptive capacity, the transformation and exploitation of external knowledge takes place actively during the decision making process of firms. However, it could be seen that the tendency of knowledge services to undergo sufficient verification by the decision makers decreased if the R&D intensity was relatively low (below 3% in our study). Introducing external knowledge into a firm’s management belongs to an open innovation strategy. From the research results it could be seen that a high R&D intensity acted as an open innovation facilitator as it could enhance the absorptive capacity and KBDM of firms and also bring a more critical view of knowledge services to the SME executives.
Our research results can provide several useful implications not only for SMEs but also for policy makers. SMEs need to make greater efforts to increase R&D intensity to generate a firm’s innovation. The reinforcement of both the absorptive capacity of employees and the knowledge base of firms is also important to achieve business performance. When policy makers plan firm support programs providing R&D funding or knowledge services, they can consider the R&D intensity of firms or the degree of knowledge asset establishment as criteria for selecting the beneficiary firms.
The ratio of R&D expenses to revenue was used as the criterion to classify innovative and non-innovative firms; however, it was very difficult to determine how the criterion ratio should be set to distinguish between innovative and non-innovative firms. In our study, the criterion ratio was 3%. The data that supported the basis for the criterion should be further improved in future research. In addition to R&D intensity, there will be other criteria for innovative and non-innovative firms. Innovative firms can develop high-tech products or belong to high-tech sectors. They can also cooperate with universities to improve internal R&D activity or they can have knowledge assets such as patents, knowledge management systems and technology know-how. These criteria will be considered in future research.
Author Contributions
Conceptualization and writing—original draft preparation, H.P.; research design and writing—review, H.H.; investigation, S.L.; validation and writing—editing, J.-H.P. All authors have read and agreed to the published version of the manuscript.
Funding
This research was supported by KISTI (Korea Institute Science and Technology Information) (project number: 1711121665).
Institutional Review Board Statement
Not applicable.
Informed Consent Statement
Not applicable.
Data Availability Statement
The data presented in this study are available on request from the corresponding author.
Conflicts of Interest
The authors declare no conflict of interest. The funders had no role in the design of the study; in the collection, analyses or interpretation of data; in the writing of the manuscript or in the decision to publish the results.
Appendix A
Questionnaire for the online survey:
- Write down the utilization degree of knowledge services you supported. (Answer should be a percentage number.)
- Write down the contribution degree to the decision making by knowledge services you supported. (Answer should be a percentage number.)
- Write down the contribution degree to the revenue growth of your company by knowledge services you supported. (Answer should be a percentage number.)
- Write down the contribution degree to the export growth of your company by knowledge services you supported. (Answer should be a percentage number.)
- Write down the contribution degree to the employment growth of your company by knowledge services you supported. (Answer should be a percentage number.)
References
- OECD. The Knowledge Based Economy; OECD: Paris, France, 1996; p. 7. [Google Scholar]
- Shi, X.; Wu, Y.; Zhao, D. Knowledge Intensive Business Services and Their Impact on Innovation in China. Serv. Bus. 2014, 8, 479–498. [Google Scholar] [CrossRef]
- Miles, I.; Kastrinos, N.; Flanagan, K.; Bilderbeek, R. Knowledge-Intensive Business Services: Their Role as Users, Carriers and Sources of Innovation; European Comission: Brussels, Belgium, 1995. [Google Scholar]
- Muller, E.; David, D. What We Should Know about Knowledge-intensive Business Services. Technol. Soc. 2009, 31, 64–72. [Google Scholar] [CrossRef]
- Bettencourt, L.A.; Ostrom, A.L.; Brown, S.W.; Roundtree, R.I. Client Co-Production in Knowledge-Intensive Business Services. Calif. Manag. Rev. 2002, 44, 100–128. [Google Scholar] [CrossRef]
- Den Hertog, P. Knowledge-Intensive Business Services as Co-Producers of Innovation. Int. J. Innov. Manag. 2001, 4, 491–528. [Google Scholar] [CrossRef]
- Eurostat. NACE Rev. 2—Statistical Classification of Economic Activities; Eurostat: Brussels, Belgium, 2008. [Google Scholar]
- Hipp, C. Knowledge-intensive Business Services in the New Mode of Knowledge Production. AI Soc. 1999, 13, 88–106. [Google Scholar] [CrossRef]
- Park, H.; Kwon, T.-H.; Jang, T.-J.; Yoo, J.-Y.; Lee, H.-S.; Moon, S.-H.; Hahn, H. Role of Information in SMEs Supporting Services on Business Performance in South Korea. Sci. Technol. Soc. 2017, 22, 440–454. [Google Scholar] [CrossRef]
- Park, H.; Yoo, J.Y.; Moon, S.H.; Yoo, H.S.; Lee, H.S.; Hahn, H. Effect of Technology and Market Dynamism on the Business Performances of SMEs by Supporting Services. Sci. Technol. Soc. 2019, 24, 144–160. [Google Scholar] [CrossRef]
- Ackoff, R.L.; Emery, F.E. On Purposeful Systems: An Interdisciplinary Analysis of Individual and Social Behavior as a System of Purposeful Events; Transaction Publishers: Piscataway, NJ, USA, 2005. [Google Scholar]
- Nonaka, I.a.N.I. A Dynamic Theory of Organizational Knowledge Creation. Organ. Sci. 1994, 5, 14–37. [Google Scholar] [CrossRef]
- Lipshitz, R.; Bar-Ilan, O. How Problems Are Solved: Reconsidering the Phase Theorem. Organ. Behav. Hum. Decis. Process. 1996, 65, 48–60. [Google Scholar] [CrossRef]
- Polya, G. How to Solve It: A New Aspect of Mathematical Method; Princeton University Press: Princeton, NJ, USA, 2004. [Google Scholar]
- Axelrod, R. The Cognitive Mapping Approach to Decision Making. In Structure of Decision; Princeton University Press: Princeton, NJ, USA, 1976; pp. 221–250. [Google Scholar]
- Klein, J.H.; Cooper, D.F. Cognitive Maps of Decision-makers In a Complex Game. J. Oper. Res. Soc. 1982, 33, 63–71. [Google Scholar] [CrossRef]
- Tolman, E.C. Cognitive Maps in Rats and Men. Psychol. Rev. 1948, 55, 189. [Google Scholar] [CrossRef]
- Gordon, S.E.; Gill, R.T. Cognitive Task Analysis. In Naturalistic Decision Making; Psychology Press: London, UK, 1997; pp. 131–140. [Google Scholar]
- Klein, G.A.; Calderwood, R.; Macgregor, D. Critical Decision Method for Eliciting Knowledge. IEEE Trans. Syst. Man Cybern. 1989, 19, 462–472. [Google Scholar] [CrossRef]
- Klein, G.A. A recognition-primed decision (RPD) model of rapid decision making. In Decision Making in Action: Models and Methods; Ablex: Northwood, NJ, USA, 1993; Volume 5, pp. 138–147. [Google Scholar]
- Janis, I.L.; Mann, L. Decision making: A psychological Analysis of Conflict, Choice, and Commitment; Free Press: New York, NY, USA, 1977. [Google Scholar]
- Yim, N.-H.; Kim, S.-H.; Kim, H.-W.; Kwahk, K.-Y. Knowledge based decision making on higher level strategic concerns: System dynamics approach. Expert Syst. Appl. 2004, 27, 143–158. [Google Scholar] [CrossRef]
- Pawlak, Z. Rough set approach to knowledge-based decision support. Eur. J. Oper. Res. 1997, 99, 48–57. [Google Scholar] [CrossRef]
- Khan, M.S.; Lee, S.; Rangaiah, G.; Lee, M. Knowledge based decision making method for the selection of mixed refrigerant systems for energy efficient LNG processes. Appl. Energy 2013, 111, 1018–1031. [Google Scholar] [CrossRef]
- Uricchio, V.F.; Giordano, R.; Lopez, N. A fuzzy knowledge-based decision support system for groundwater pollution risk evaluation. J. Environ. Manag. 2004, 73, 189–197. [Google Scholar] [CrossRef] [PubMed]
- Howells, J. Intermediation and the role of intermediaries in innovation. Res. Policy 2006, 35, 715–728. [Google Scholar] [CrossRef]
- Hargadon, A.; Sutton, R.I. Technology brokering and innovation in a product development firm. Adm. Sci. Q. 1997, 42, 716–749. [Google Scholar] [CrossRef]
- Bessant, J.; Rush, H. Building bridges for innovation: The role of consultants in technology transfer. Res. Policy 1995, 24, 97–114. [Google Scholar] [CrossRef]
- Mina, A.; Bascavusoglu-Moreau, E.; Hughes, A. Open service innovation and the firm’s search for external knowledge. Res. Policy 2014, 43, 853–866. [Google Scholar] [CrossRef]
- Larsen, J.N. Supplier-user interaction in knowledge-intensive business services. Types of expertise and mode of organization. In Services and the Knowledge-Based Economy; Bloomsbury Academic: London, UK, 2000. [Google Scholar]
- Muller, E.; Zenker, A. Business services as actors of knowledge transformation and diffusion: Some empirical findings of the role of KIBS in regional and national innovation systems. Res. Policy 2001, 30, 1501–1516. [Google Scholar] [CrossRef]
- Miles, I. Patterns of innovation in service industries. IBM Syst. J. 2008, 47, 115–128. [Google Scholar] [CrossRef]
- Doloreux, D.; Shearmur, R. The Use of Knowledge-Intensive Business Services in SME Manufacturing Firms in Quebec: Performance Diagnosis and Drivers of Innovation by Sector and Region; INRS: Quebec City, QC, Canada, 2012. [Google Scholar]
- Gadrey, J. Les Relations de Service dans le Secteur Marchand. In Relations de service, marchés de services; CNRS Éditions: Paris. France, 1994; pp. 23–41. [Google Scholar]
- Kamp, B. Are KIBS beneficial to international business performance: Evidence from the Basque Country. Compet. Rev. Int. Bus. J. 2017, 27, 80–95. [Google Scholar] [CrossRef]
- Dvila, G.A.; Durst, S.; Varvakis, G. Knowledge Absorptive Capacity, Innovation, and Firm’s Performance: Insights From the South of Brazil. Int. J. Innov. Manag. 2018, 1850013. [Google Scholar] [CrossRef]
- Pereira, D.; Leitão, J. Absorptive capacity, coopetition and generation of product innovation: Contrasting Italian and Portuguese manufacturing firms. Int. J. Innov. Manag. 2016, 71, 10–37. [Google Scholar] [CrossRef]
- Tomlinson, M. Information and technology flows from the service sector: A UK-Japan comparison. In Services and the Knowledge-Based Economy; Routledge: Abington, UK, 2000; pp. 209–221. [Google Scholar]
- Tomlinson, M. The Contribution of Knowledge-Intensive Services to the Manufacturing Industry. In Knowledge and Innovation in the New Service Economy; Edward Elgar: Cheltenham, UK, 2000. [Google Scholar]
- Baker, P. The impact of business-sevices use on client industries: Evidence from input-output data. In Business Services in European Economic Growth; Palgrave MacMillan: London, UK, 2007; pp. 97–116. [Google Scholar]
- Tseng, C.-Y.; Pai, D.C.; Hung, C.-H. Knowledge absorptive capacity and innovation performance in KIBS. J. Knowl. Manag. 2011, 15, 971–983. [Google Scholar] [CrossRef]
- Santos-Vijande, M.L.; Angel, L.-S.J.; Celina, G.-M. Organizational learning, innovation, and performance in KIBS. J. Manag. Organ. 2012, 18, 870–904. [Google Scholar] [CrossRef]
- Santos-Vijande, M.L.; González-Mieres, C.; Lopez-Sanchez, J.A. An assessment of innovativeness in KIBS: Implications on KIBS’co-creation culture, innovation capability, and performance. J. Bus. Ind. Mark. 2013, 28, 86–102. [Google Scholar] [CrossRef]
- Morbey, G.K. R&D: Its Relationship to Company Performance. J. Prod. Innov. Manag. 1988, 5, 191–200. [Google Scholar]
- Connolly, R.A.a.H.M. Firm size and the effect of R&D on Tobin’s q. R&D Manag. 2005, 35, 217–223. [Google Scholar]
- Xu, J.; Jin, Z. Research on the Impact of R&D Investment on Firm Performance in China’s Internet of Things Industry. J. Adv. Manag. Sci. 2016, 4, 112–116. [Google Scholar]
- Li, X. R&D Intensity and firm performance: Evidence from Chinese manufacturing firms. In Proceedings of the 2012 IEEE International Conference on Management of Innovation & Technology (ICMIT), Bali, Indonesia, 11–13 June 2012; pp. 45–50. [Google Scholar]
- Savrul, M.; Incekara, A. The effect of R&D intensity on innovation performance: A country level evaluation. Procedia Soc. Behav. Sci. 2015, 210, 388–396. [Google Scholar]
- Cassiman, B.; Veugelers, R. In search of complementarity in innovation strategy: Internal R&D and external knowledge acquisition. Manag. Sci. 2006, 52, 68–82. [Google Scholar]
- Li, X. Sources of external technology, absorptive capacity, and innovation capability in Chinese state-owned high-tech enterprises. World Dev. 2011, 39, 1240–1248. [Google Scholar] [CrossRef]
- Xie, X.; Wang, H.; Jiao, H. Non-R&D innovation and firms’ new product performance: The joint moderating effect of R&D intensity and network embeddedness. R&D Manag. 2019, 49, 748–761. [Google Scholar]
- Carvache-Franco, O.; Gutiérrez-Candela, G.; Guim-Bustos, P.; Carvache-Franco, M.; Carvache-Franco, W. Effect of R&D intensity on the innovative performance of manufacturing companies. Evidence from Ecuador, Peru and Chile. Int. J. Innov. Sci. 2020, 12, 509–523. [Google Scholar]
- Berchicci, L.; de Jong, J.P.J.; Freel, M. Remote collaboration and innovative performance: The moderating role of R&D intensity. Ind. Corp. Chang. 2015, 25, 429–446. [Google Scholar] [CrossRef]
- Diéguez-Soto, J.; Manzaneque, M.; González-García, V.; Galache-Laza, T. A study of the moderating influence of R&D intensity on the family management-firm performance relationship: Evidence from Spanish private manufacturing firms. BRQ Bus. Res. Q. 2019, 22, 105–118. [Google Scholar]
- Eurostat. EUROPE 2020 A Strategy for Smart, Sustainable and Inclusive Growth; Eurostat: Brussels, Belgium, 2010. [Google Scholar]
- Fornell, C.; Larcker, D.F. Evaluating Structural Equation Models with Unobservable Variables and Measurement Error. J. Mark. Res. 1981, 18, 39–50. [Google Scholar] [CrossRef]
- Corso, M.; Martini, A.; Paolucci, E.; Pellegrini, L. Knowledge management configurations in Italian small-to-medium enterprises. Integr. Manuf. Syst. 2003, 14, 46–56. [Google Scholar] [CrossRef]
- García-Morales, V.J.; Jiménez-Barrionuevo, M.M.; Gutiérrez-Gutiérrez, L. Transformational leadership influence on organizational performance through organizational learning and innovation. J. Bus. Res. 2012, 65, 1040–1050. [Google Scholar] [CrossRef]
- Escribano, A.; Fosfuri, A.; Tribó, J.A. Managing external knowledge flows: The moderating role of absorptive capacity. Res. Policy 2009, 38, 96–105. [Google Scholar] [CrossRef]
- Lin, R.J.; Che, R.H.; Ting, C.Y. Turning knowledge management into innovation in the high-tech industry. Ind. Manag. Data Syst. 2012, 112, 42–63. [Google Scholar] [CrossRef]
- Wu, A.; Voss, H. When does absorptive capacity matter for international performance of firms? Evidence from China. Int. Bus. Rev. 2015, 24, 344–351. [Google Scholar] [CrossRef]
- Martín-de Castro, G. Knowledge management and innovation in knowledge-based and high-tech industrial markets: The role of openness and absorptive capacity. Ind. Mark. Manag. 2015, 47, 143–146. [Google Scholar] [CrossRef]

Publisher’s Note: MDPI stays neutral with regard to jurisdictional claims in published maps and institutional affiliations. |
© 2021 by the authors. Licensee MDPI, Basel, Switzerland. This article is an open access article distributed under the terms and conditions of the Creative Commons Attribution (CC BY) license (https://creativecommons.org/licenses/by/4.0/).