Abstract
The design and development processes are full of decisions. Ranging from simple and straightforward to complex and elaborated. These decisions are taken by individuals that constantly rely on their intuition and heuristics to support their decision-making processes. Although heuristics tend to be very helpful, in many cases, they can lead to cognitive biases. This article postulates a method to recognize some of these biases and to apply dedicated strategies to diminish their effects. To do so, the study reviews different decision models in engineering design and consolidates them into one; here, called ABC decision model—ABC stands for Allaying Biased Choices. This model consists of four phases describing four different decision types. Subsequently, four matching strategy sets are prescribed to target some of the most prone biases on those phases. Then, to demonstrate the application opportunities of this method, the ABC decision model is applied to the process of Strategic Release Planning (SRP). Finally, to show the theory in real-world conditions, the results of a pilot industrial application are presented. This article offers promising opportunities for allaying biased choices in design and development processes.
1. Introduction
Design frameworks are defined in most companies by well-established processes. Depending on the company business model, some Design Processes (DPs) will incorporate open innovation methods. Generally, DPs are described by blocks that represent activities like decisions, operations and tests. DPs—like VDI 2221 [1]—define and support their decision blocks—or decision stages—with standardized decision-making models and algorithms. On the one hand, algorithm inputs are composed of objective and subjective variables, which simplify a complex reality by assuming what is relevant and what is not. On the other hand, the output of these models is interpreted according to the reality surrounding the decision—for example, company’s long-term goals, latest market trends and open innovation strategy. Hence, decision-makers make constant use of intuition and heuristics to navigate through these well-established processes [2,3,4,5,6,7].
Heuristics are mental shortcuts that in most cases help individuals to cope with complex and/or uncertain scenarios—e.g., when diagnosing open business models [3]. Although these shortcuts generally lead to fast and suitable results, they sometimes lead to biased conclusions [8]. A cognitive bias is a subjective judgment that deviates from those judgments made by objective observers. For example, designers looking for evidence to promote their own innovations will unconsciously tend to overweight the supporting evidence over the contradictory one; this is known as the confirmation bias. A study on reproducibility showed that more than half of the interviewed scientists admitted failing to reproduce their own published results, but still trusted the publications on their fields of expertise [9]. For decades, psychologists and behavioral economists have studied bias-mitigation strategies and their allying effects, such as fostering constructive discussion on contradictory evidence by playing the Devil’s Advocate to incentivize a more balanced judgement [10]—other strategies are covered later in this article. However, not all decisions are susceptible to the same biases, hence there is need for matching decisions to mitigation strategies. This leads to the research question: How can DP decisions be matched to their most persuasive bias-mitigation strategies?
Following Chesbrough’s principle of secondary market innovation [11], this article takes the well-researched and widespread subject of cognitive biases from psychology and behavioral economy and implements it in decisions along with the DP. By analyzing decision-making models in engineering design, this article postulates a decision-making method that clusters decisions along DPs into four categories: Clarification, Analysis–realization, Analysis–evaluation and THAT-decision. Then, it matches common cognitive biases to their most susceptible decision categories. Subsequently, it presents suitable bias-mitigation strategies to apply to each of the four categories. Then, for evaluation purposes, the introduced decision-making method is applied to the process of Strategic Release Planning (SRP) by identifying the dominant decision categories along the SRP process, and with it, allaying their vulnerability to certain biases. The used SRP process is based on the work of Şahin et al. [12], where a methodology for value-oriented strategic product-release planning is presented. Lastly, the postulated method and corresponding bias-mitigation strategies are successfully tested on five engineers from a product development division of an international corporation.
Arnot developed a decision support model based on a comprehensive list of biases [13]; however, his model does not match biases with different bias-mitigation strategies, instead, it focuses on increasing bias awareness. Kinsey et al. offer a bias-mitigating approach to fire engineering. Their approach covers biases, mitigation strategies and implementation initiatives [14]; nevertheless, there is no generic application for DPs. Although the literature on biases is vast, no literature could be found on a generic approach that offered bias-mitigation strategies to support decision making along with the DP.
The significance of this article relies on the postulation of an interdisciplinary decision-making method that can be used for categorizing decisions along with DPs and reduce the effect of cognitive biases along the decision-making process.
2. Literature Review on Decision-Making Models in Engineering Design
Not all decisions are created equal. People come to decisions with different levels of awareness; some decisions are made on the fly—almost unconscious and automatic—and others are the conscious result of elaborated analysis. Some decisions are documented and shared, and others are not. The uncertainty levels of the decision criteria also vary among decisions. Some decisions are more exploratory and others more conclusive, some are more complex, and others straightforward. On top of all these decision shades comes the fact that people have different experiences and knowledge levels, and this prompts them to make use of heuristics that will vary from case to case and from person to person. Therefore, in order to support decision-makers, the first step opposed was to identify the different types of decisions that design engineers face and then map them into a decision-making model.
In order to create a holistic decision-making model in the field of engineering design, this article considered decision-making models starting from the classic and well-established model from Miller et al. to more recent ones like the decision-making model from Hanse et al. [15,16,17,18,19,20]. The resulting model unifies the analyzed models into one evolving cycle with four categories/phases.
2.1. Miller et al. TOTE Model (Test Operate Test Exit)
Miller et al. defined a decision model in the mid-90s that consist of two blocks—called Test and Operate—plus an Exit. Figure 1 illustrates the Test Operate Test Exit cycle, commonly known as the TOTE model [5,15]. This model describes a cycle that enters through the test block, which analyses the status quo. This block acts as a Y junction; if the analysis results unsatisfactory, then the Y junction leads to the operation block. The operation runs actions/activities to provide a new—and hopefully satisfactory—level, which is then forwarded back to a new test. The Test–Operation cycle runs until a satisfactory state is found, in which case, the Y junction leads to an end: exit.
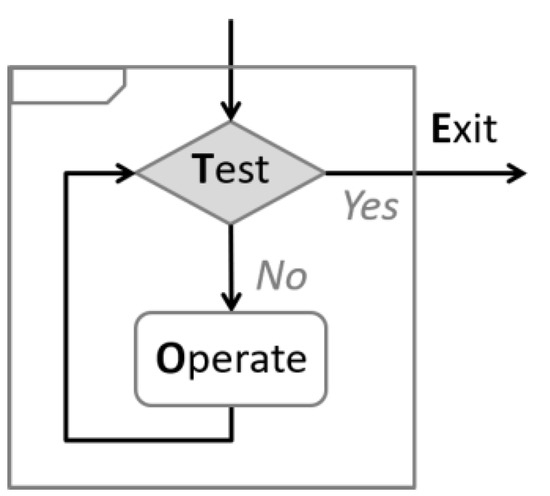
Figure 1.
Basic TOTE model. Adapted from ref. [15].
To ease the comparison of blocks among models, the decision-making models from Figure 1, Figure 2 and Figure 3 were slightly modified to share the same semantics among them. Likewise, the semantics are kept until Figure 5.
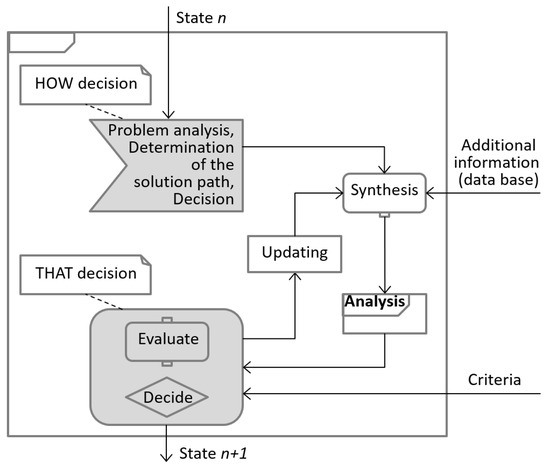
Figure 2.
Höhne’s model of operations. Adapted from ref. [19].
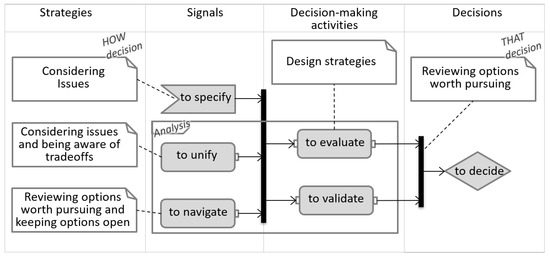
Figure 3.
Decision-making model on individual designer level. Adapted from ref. [18].
The model above implies the existence of a set of criteria that predefines the satisfactory state. Yet, the TOTE model does not cover the decision process for defining those criteria, nor for defining actions needed during the Operate block to achieve satisfaction.
2.2. Höhne’s Model of Operations
In the 1990s, Galle and Kovács defined two types of decisions: HOW-decisions and THAT-decisions. The former selects the strategies on how to approach the problem; the latter defines decisions taken based on the results of the strategy chosen by the HOW-decision [16].
Höhne proposes a model (Figure 2) that follows the TOTE flow but also adds the two types of decisions from Galle. The first block in Höhne’s model is the HOW-decision that determines the decision strategy/path. Then it follows two operations: Synthesis and Analysis. The former operation collects all available and relevant information that is needed in order to run the analysis. The analysis strategy used was defined in the HOW-decision block. Finally, a THAT-decision is taken by evaluating the results of the analysis in the context of external criteria. The result is a decision that changes the initial status [19].
The feedback loop might not only be part of the synthesis but could also change the way to approach the problem, thus this article postulates that the feedback should go back to the HOW-decision instead of going to the synthesis block. Furthermore, Höhne places evaluate in the final decision block—THAT-decision—and leaves the analysis part outside of it. This article agrees that analysis is not a final decision but rather provides evidence for it; however, this article recognizes that all analyses have an evaluation phase. This article declares evaluation as forming an opinion and making an interpretation of the evidence produced by the analysis–execution phase. Therefore, all analyses have an execution phase and an evaluation phase, and none of these phases belong to the final decision block. The following model favors the notion that evaluation is an activity block that precedes the THAT-decision.
2.3. Ahmed and Hansen’s Decision-Making Model
Ahmed and Hansen studied several decision-making models and processes for engineering design and stated that “a complete cognitive theory of problem-solving in design does not exist and research in this area is still in its early stages [18].” Then, they examined the decision map and the decision node and interviewed designers on the topic of decision making. From their study, the scientists suggested that the design process contains the following decision activities: considering issues, being aware of tradeoffs, reviewing options worth pursuing, keeping options open, specifying, unifying, navigating, evaluating, validating and deciding. They also determined that not all decision activities were decisions per se, but instead, most activities were, in essence, operations that preceded decision [17,18].
The strategies in the decision-making model shown in Figure 3 describe very similar characteristics to those of the HOW-decisions, clarifying the context framing the decision. In this model, the strategies lead to signals, and two of these signals—to unify and to navigate—show great similarities to synthesis and analysis from Höhne. The decision-making activities—to evaluate and to validate—are both about forming an opinion and making an interpretation of the evidence produced by the signals. Following the notion of two analysis phases, the signals would belong to the analysis–execution phase and decision-making activities to the analysis–evaluation phase. Lastly, in this model, the THAT-decision is clearly about bringing the considerations to a resolution or to an end to pursue the worthiest option.
Recapitulating, all models presented above consist of decisions and operations/activities. Galle and Kovács identified two types of decisions: HOW-decisions and THAT-decision. Respectively, most of the remaining blocks are operations that could be identified as analysis–execution blocks or analysis–evaluation blocks. These results in a total of four blocks, two decision blocks and two operation blocks; these four blocks are the basis of the subsequent model.
3. Development of the ABC Decision Model and Bias Allaying Strategies
The last section analyzed different decision models in engineering design. The literature review exposed four distinct blocks describing different types of decisions. These blocks become the four phases of the here postulated decision-making model:
- Clarification phase—HOW-decision
- Analysis–realization phase
- Analysis–evaluation phase
- THAT–decision phase
These phases are arranging as a loop—as in the TOTE model. This, however, does not mean that the decision repeats but rather evolves iteratively. By every loop, the decision cycle evolves from an introspective and almost unconscious decision cycle continuously to a more collective and cognitively demanding one. Below, Figure 4 illustrates this evolving nature. Here again, the decision blocks keep consistent semantics.
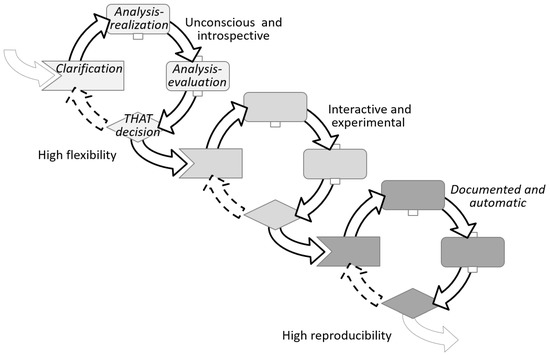
Figure 4.
ABC decision cycles.
To make clear how the cycles evolve, after each cycle, this study names blocks of the same phase, and thus same semantics, with novel names that best represent the evolution of the given blocks. For example, Figure 5 illustrates how in the clarification phase, the block in the early phase is called reflect—indicating a personal mental process of clarification. In the next cycle, the block in the clarification phase is called convey—meaning a clarification to others. In the latter phase, the block is named publish—indicating an agreed and public way of proceeding, like standard operating procedures (SOP). Figure 5 displays the evolving decision cycles arranged by phases.
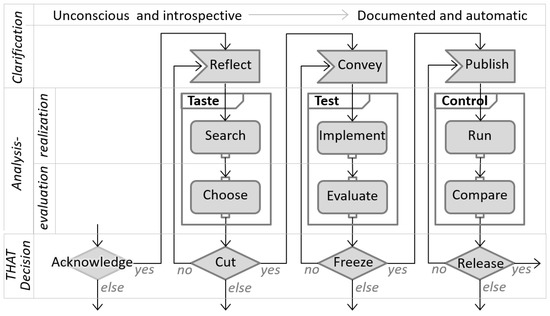
Figure 5.
ABC decision model.
Allaying Biased Choices (ABC) was the main driver of this study; therefore, the models in this section were named accordingly.
3.1. Four Evolving Phases of the ABC Decision Model
The ABC decision model is described in the following pages focusing on the four phases but also alluding to the evolving blocks and how they relate to each other.
3.1.1. Clarification
A cycle starts with the clarification phase. This, in turn, is triggered by a previous cycle, where a decision was taken. This decision was expressed as a goal, and the general formulation of a decision-goal is: There is an unsatisfactory status, and actions should be taken to improve the status.
The first part of the goal—There is an unsatisfactory status—expresses an acknowledged context. The second part—actions should be taken to improve the status—expresses a required perspective.
Clarifying the acknowledged context is about understanding the criteria responsible for unsatisfaction.
- What could define a satisfactory status?
- What factors are or absence of factors is responsible for the unsatisfactory status?
- Who is responsible for the actual modus operandi?
- Is there a cause-and-effect relationship?
- Where are these factors located?
- Why are the factors producing unsatisfaction?
- When does the unsatisfaction occur, and how often?
- How much is it needed to change to an acceptable status?
Clarifying the required perspective is about considering action plans that have the potential to improve the status.
- What actions are feasible?
- Who will be responsible for the new modus operandi?
- Who should be involved in the actions?
- Where should the actions take place?
- When and in what order should the actions take place?
- Why will the actions address the unsatisfaction?
- How should the actions be executed?
- What are the costs/tradeoffs of those actions?
At the early decision cycles, this clarification phase runs mentally. If the criteria are known or are assumed to be known, the decision is straightforward, implicit, and sometimes even unconscious. As the cycles evolve, this phase becomes more interactive and explicit. Regardless of the number of unknown criteria and required actions, decision-makers will select only a few of them, those perceived as the most imminent roadblocks on the path towards the goal. This phase has two outcomes:
- Awareness of the known criteria responsible for the unsatisfactory status
- An action plan to reduce uncertainty by:
- Gain knowledge on the unknown perceived as the decision roadblock
- Test the hypothesis that a given action will truly improve the status
The next two phases are about implementing the action plan aiming to reduce uncertainty to a level that matches the risk–tolerance of the decision-maker.
3.1.2. Analysis–Realization
“To analyze: Examine something methodically and in detail, typically in order to explain and interpret it. Identify and measure the chemical constituents of a substance or specimen” [21].
Based on its definition, the verb to analyze can be seen as a two-step action: first, executes/applies a defined method, and then evaluates/interprets the results. In this article, these two steps will be referred to, respectively, as analysis–realization and analysis–evaluation.
The noun realization in this phase was also selected due to its double meaning: “the achievement of something desired or anticipated” [22]. Additionally, “an act of becoming fully aware of something as a fact” [22]. The analysis–realization phase is about gathering data by means of executing an action plan, and it is also about doing so while observing with curiosity. Combined, the execution and the observation yield data, and this data can be later interpreted to generate knowledge.
At the early decision cycles, the action plan aims at discovering while doing, primarily to gain knowledge; for example, searching for information or looking for options, solutions, ideas, materials, resources, etc. At the final cycles, this phase tends to be more about challenging hypotheses, primarily to gain certainty; for example, running a test and looking if the concept behaves as expected. Realizing the action plan produces data such as a pallet of ideas or test results, but ideas without screening are just ideas, and numbers from a test bench are just numbers. Without evaluation, data has no meaning: are the ideas and/or results good, bad or useful for reaching the goal? To create knowledge out of data, the latter needs to get organized and ranked, and this takes place in the next decision phase. In the same manner, Hammond and Summers divided the cognitive analysis into two components: knowledge acquisition and deciding based on knowledge; and then named these phases knowledge and control [23].
The analysis-realization phase is primarily bout knowledge acquisition by exploration. During this exploration, constant decisions are made on where to focus the attention. One example: when looking for materials, the focus could be on its look, feel, mechanical properties, etc. Another example: when testing a machine, the focus could be on the measured values, the stability of the system, unexpected noises, etc. The decisions in this phase determine what data is collected and neglected—generally, a person will have higher chances of finding something when he/she is actively looking for it. Based on the exploration, the next phase—analysis–evaluation—will determine the worth of the collection.
3.1.3. Analysis–Evaluation
The last section defined analysis as a two-step process that: first applies a defined method and then evaluates/interprets the results. Analysis–evaluation is that second step. Evaluation is about ordering and labelling data, or options, based on present knowledge and circumstances in order to obtain information that is useful for reaching the goal. Information is not only structured data but useful data [24]. Analysis–evaluation is not about yes and no judgments, but about categorizing data points among them as better–or worse options—or else more– or less–valuable options—based on current knowledge and context. Generally, the categorization of data points is based on multiple criteria/dimensions; some are straightforward—e.g., cost—while others are less so—e.g., appeal. Furthermore, these dimensions tend to be in conflict with each other, and decision-makers will seldomly have mathematical models available describing the behavior of those conflicting correlations. Thus, knowledge and experience are heavily used to allocate values to data, especially but not exclusively in the early decision cycles, where evaluations rely primarily on personal judgments and heuristics to manage implicit complexity. An intrinsic challenge of complexity is that, depending on the level of detail used to reflect on, observe, assess, and manage an artifact, this artifact can be perceived both as simple or complex; just like a simple pencil requires a 12 pages essay to explain the complexity of the machinery that moves around sourcing and producing a lead pencil [25].
When one or more criteria cannot be numerically represented or correlated, then a good visualization of multi-criteria is necessary to support such evaluations [26]. As decision cycles progress, the correlations among dimensions become more transparent, and the stakes become higher. Consequently, decision-makers make use of multi-criteria decision analysis tools like analytic hierarchy processes and fuzzy sets [27,28]. This leads to semi-automatic evaluations and reports that highlight the most promising data/options. This article considers an automatic–evaluation as the act of reusing previous THAT-decisions; more on that in the next section.
Analysis–evaluation results in hierarchically organized data, making useful information out of the data collected on the analysis–realization phase. The top-ranked data can be interpreted as the most promising option, or group of options, for the given criteria. This information adds knowledge and reduces uncertainty to overcome the roadblocks found in the clarification phase. All these prepare the ground to make a decision that will bring the decision-maker closer to the goal.
3.1.4. THAT-Decision
THAT-decision is the phase that relates best with the popular understanding of the word decision. Coming from the Latin decider, meaning cut-off, to decide means to make up one’s mind on what is really needed to reach the goal, taking that, and cutting off the rest.
The decision cycle started with the goal of improving satisfaction. The clarification phase created awareness on the context, the path, and the roadblocks—like, knowledge gaps and uncertainty—that needed to be addressed in preparation for taking action with a tolerable confidence level. The analysis phases produced and collected the information needed to overcome the roadblocks. Lastly, considering context, goal, knowns, unknowns and ranked options, decision-makers resolve for that option or a group of options. A THAT-decision promises the best possible result that maximizes satisfaction with the given uncertainty within a descriptive decision theory framework [29].
There are four possible outcomes for a THAT-decision:
- Yes: the top-ranked option shall be implemented. The option to follow is clear, but the way to implement the option may not be that clear; thus, a new decision cycle starts focusing on the implementation. In the latter decision cycles, the focus moves to prove the effectiveness or repeatability of the selected option.
- No, next: the top-ranked option lays out of reach or scope after holistic scrutiny—e.g., missing infrastructure or competence, conflict of interest, no business case, you cannot fire your boss, etc. It’s very challenging to run analysis–evaluations with all thinkable criteria incorporated within the model; thus, criteria will be left out to be considered only at the holistic scrutiny of the THAT-decision. Once the number one option is left aside, the decision focuses on the number two.
- No, refine: when the uncertainty of options seems too high and/or the gained knowledge seems too low, the decision can be to repeat the cycle again, this time looking for more details. However, this is a decision against time, a tradeoff between deciding and moving on vs. increasing knowledge and certainty on the available options.
- Else: often, decision cycles end with an else result. One reason could be that none of the options obtained reached the minimum threshold or that the unexpected analysis findings or recent external factors change the urgency of the goal or made it irrelevant. All else cases terminate—or completely redirect—the pursue of the satisfactory status.
All four options are cutting-off slag. Yes leaves the option dilemma behind and moves on. No and next discards the top-ranked option and moves to the next. No and refine loses time. Lastly, else puts the decision aside—as a decision of not to decide—and moves on to another decision or goal. Once a THAT-decision is made, there is no way back; this action has irreversible consequences. On the one hand, this decision frees up resources that allow for a leaner process. On the other hand, by cutting off, opportunities and options are left behind, creating a sense of loss. Consequently, THAT-decisions have an implicit tradeoff between losses and gains. Prospect theory states that decision-makers tend to overweight options framed as gains over those framed as losses in a nonlinear manner that differs from a normative linear behavior [7]. Thus generally, how a THAT-decision is framed will tend to influence the outcome, and this is something that decision-makers need to be aware of.
The ABC decision model postulates four phases that represent four different types of decisions, each with its unique challenges. Clarification is about recognizing and managing uncertainty. Analysis–realization is about selecting the relevant data sources and their processes while neglecting the rest—managing attention. Analysis–evaluation is about making proper use of personal judgment and heuristics—managing complexity. Lastly, THAT-decision is about balancing the way gains and losses are framed.
3.2. Decisions, Biases and Mitigation Strategies
As stated earlier, bias-mitigation strategies, such as the Devil’s Advocate [10], have proven useful against biased decision making. However, not all decisions are created equal; thus, certain biases influence some decisions stronger than others; hence, there is a need for matching decisions to mitigation strategies. The ABC decision model described before allows decision-makers to sort decisions into one of four types/phases. In addition, to match these four phases with their strongest bias-mitigation strategies, this section takes the following steps: First, it presents the results of a literature review done in the fields of psychology and behavioral economics, with a focus on biased decision making. The review selected studies where individuals were confronted with decisions that involved uncertainty and/or complexity. These studies forecasted and proved that certain decisions paired with certain circumstances could yield biased decision making. Next, this section shows how mitigation strategies applied during the decision phase can reduce the effects of cognitive biases. Ultimately, this section outlines a list of biases with their corresponding mitigation strategies, all grouped within the four ABC decision phases.
3.2.1. Biases Affecting Clarification
The Clarification phase—as described in Section 3.1.1—is about understanding and recognizing what decision criteria are known and what is unknown but also about elaboration and action plans to gain knowledge and reduce uncertainty. The literature review showed a set of biases that directly affect these decisions and circumstances:
- Bias: Overconfidence
Societies and teams work best when expertise is spread among the group and individuals can focus on their own know-how while trusting the expertise and results of others—e.g., the butcher buys bread from the baker and vice-versa. Moreover, knowledge seems easy to obtain when explained by the expert or a quick YouTube tutorial. Unfortunately, the YouTube audience usually finishes the tutorial assuming that they know the topic as well as the one that gave the talk, and even in the same depth. On the first step of a study conducted by Rozenblit and Keil, participants were asked if they knew in-depth how a ball-pen or a zipper worked. Most people claimed to have deep knowledge. On a second step, participants were asked to proceed with a deep explanation on that matter, but then almost no one was able to do so [30]. Generally, individuals think that they know more than what they really do. This leads decision-makers to neglect risk and gaps that might be important for a decision.
- ○
- Strategy: Breaking it down
Rozenblit and Keil provided the remedy for overconfidence within the same experiment. The second step of the experiment brought participants to realize how little they really knew about the subject. Breaking the problem or system down into smaller pieces helps to see the complexity, dangers, unknowns and risks hidden behind the detail. This strategy is a straightforward approach to deep dive into the problem at hand and increases awareness about the unknowns [30].
- Bias: Optimism and the planning fallacy
Individuals tend to overestimate the probability of outcomes turning in their favor. Optimism lessens factual risk available in plain sight through wishful thinking—thoughts such as this time will be different, or this time we know better. Yes, circumstances will be different, but there is no certainty that they will be different in favor of the goal. Likewise, the knowledge and experience gain in the past generally speeds up the tasks, but rarely by the optimistic amount estimated [31].
- ○
- Strategy: Asking externals
While optimism acts strongly on personal expectations of success, it does not distort what people expect about others outside their group. Thus, it is recommended to collect the points of view of externals who have no stakes on the goal in hand but have experience in similar matters. To avoid that those externals fall victims to the same fallacy, they should provide or support their estimations based on similar past experiences and do not assume that this time will be different [32].
3.2.2. Biases Affecting Analysis–Realization
Circumstances, experience, searching tools available, strategies and even the decision-maker’s mood will affect what data is collected and neglected in this phase. Three biases stood up in this topic.
- Bias: Bounded awareness
On a famous experiment ran by Simons and Chabris from Harvard University, participants were presented with a video. The video showed two basketball teams, one dressed in black uniforms and the other in white ones. Each team had a ball, and they were passing the ball among team members while moving randomly around the court. Before starting the video, participants were asked to count the number of passes done by the white team. In this video, a man with a gorilla custom walks into the middle of the scene, faces the camera, and crosses the court while the teams are passing the ball. Although many participants get the passes-count right, only half noticed the gorilla. This experiment illustrates how people focused on a task—counting passes of the white team—will automatically filter out the noise—other individuals in black. A risk of this tunnel vision is that decision-makers are unaware of that what they are missing, and this can lead to unconsciously ignoring relevant information or requirements [33].
- ○
- Strategy: Looking at the bigger picture
When working in teams, a team member can be assigned to step back and assess the decision-making process and the given circumstances like team dynamics, methodologies implemented, news from outside, stakeholder perspectives, invisible gorillas, etc. Team members can take breaks and change hats before making important decisions.
- Bias: Confirmation
As mentioned in the introduction, this bias manifests when decision-makers are looking for evidence to confirm their own postulations. In those cases, they will unconsciously tend to overweigh the supporting evidence over the contradictory one. The previously mentioned study—published on Nature—demonstrates the biased behavior [9].
- ○
- Strategy: Devil’s Advocate
This is a well-known strategy used for hundreds of years, where a person in the team is assigned to challenge the status quo, and the team believes. An article from Schwenk, in this regard, postulates and effective use of the devil’s advocate strategy [10].
- Bias: Search type
As long as the results give suitable outcomes, decision-makers will not consider the strategies used for the search to judge its reliability. When participants are asked if there are more words in the English vocabulary of at least three letters, starting with the letter r, or more words with r in the third position, most of them favor the former option. In fact, there are more words with the letter r in the third position than in the first. Nevertheless, it is just easier to recall words by vocalizing the first letter, making this the default searching strategy. When the time does not allow to finding other strategies, the ineffectiveness to recall words by the third letter gets neglected. The same goes true when looking for a solution, options, information, etc.; people tend to use their default search strategy with little or no consideration of its effectiveness and/or impartiality [34].
- ○
- Strategy: Searching different
Trying out different search methods and channels will not only test the impartiality of the individual searches but will also enrich the gathered data. For the example of words with the letter r: searching for words in this article’s paragraphs will quickly demonstrate the abundance of words with the letter r in the third position.
3.2.3. Biases Affecting Analysis–Evaluation
This decision phase is primarily about ranking data/options by assigning values. In principle, the values assigned should consider the complexity within the system but also its surroundings—such as team dynamics, business context, sociopolitical issues, etc. To manage this complexity, individuals make use of judgments and heuristics. The literature review yielded three biases that strongly affect evaluations.
- Bias: Anchoring
When a value is unknown, the value appraised will gravitate to the last available figure. This figure is sometimes formulated in the question, and others it’s just an unrelated or random figure; regardless of its origin, this figure will affect the estimated value. Tversky and Kahneman conducted an experiment in 1974 where participants were brought to spin a wheel of fortune that had numbers going from 0 to 100. Unknown to the participants, this wheel was tweaked to land only in 10 or 65. After the wheel stopped, they were asked two questions: first, to say if they believed that the percentage of African countries affiliated to the United Nations was higher or lower than the figure given by the wheel. Subsequently, they were asked to estimate an actual percentage. The average estimate for those who got 65 was 45%, and the average estimate for those who got 10 was 25% [8].
- ○
- Strategy: Applying contrafactual thinking
In this strategy, decision-makers reflect on the given answer with what-ifs: What if the assessed value is wrong? What if the real value is completely on the opposite side of the spectrum? What if the assumptions for the assessment are wrong? Answers to questions of this sort deliver other anchors that help decision-makers to pull away from the original one, allowing for a more distributed evaluation [29].
- Bias: Inconsistency
Hammond and Summers conducted a study on their two decision phases: knowledge and control, named here analysis–realization and analysis–evaluation, respectively. There, they analyzed participants making decisions in one or the other phase. Through multiple regression analysis, they found that participants made more cognitive errors in the control phase. Moreover, the errors were not biased to one or the other direction but spread in both, meaning that all things being equal, participants will fail to give a constant value to the same figure [23].
- ○
- Strategy: Calibrating by continual comparisons
The straightforward strategy to reduce inconsistency is to calibrate continuously. Making use of some reference examples can help to keep values consistent. It is important to highlight that this strategy does not improve the assertiveness of the values but only their consistency. Nevertheless, having consistent values is a good first step towards comparable results.
- Bias: Redundancy
This bias describes the false belief that adding interdependent/redundant inputs will linearly increase system reliability [8]. Adding a second seatbelt to the same passenger—or improving the first restrain system—will unlikely double the safety that the first seatbelt provided.
- ○
- Strategy: Doing the math
Sometimes, decision-makers just need to sit down and crunch the numbers to prove their assumptions before they invest more resources, especially when the stakes are high.
3.2.4. Bias Affecting THAT-Decision
This phase focuses on cutting off slag, keeping the important part, and letting go of the rest. Letting go implies losing something on the one side, but on the other side, winning something else. A pair of biases stood out during the literate review for dealing with wins and losses in decision making.
- Bias: Framing and loss aversion
This bias is one of the main concepts presented by Kahneman and Tversky on a theory called the prospect theory, published in 1979. On multiple studies, they tested how individuals will experience a nonlinear behavior when confronted with decisions framed as losses vs. decisions framed as wins. Their studies yield the following conclusions:
- “A gain is more preferable than a loss of the same value.
- A sure gain is more preferable that a probabilistic gain of greater value.
- A probabilistic loss is more preferable than a sure–loss of lower value” [7].
Additionally, Kahneman and Tversky vary the experiments by incrementally increasing the premium of the bet. Doing so, they could plot the nonlinear and unsymmetrical sensitivity of people against a premium; they call the plot: hypothetical value function in prospect theory. The part of the value function describing losses shows that the perceived value of the loss is greater when the financial losses are small, but it gets even as the financial losses grow. However, on the gains side of the value function, the perceived and financial gains start even when the gains are small, and as the financial gains get bigger the perceive value of the gain gets smaller.
- ○
- Strategy: Turning it around
This approach aims to bring all decisions to a similar level to avoid the winning or losing dilemma. The strategy recommends finding the positive side of the losses and framing all decisions by their gains [35].
- Bias: Sunk Cost fallacy
This bias appears when decision-makers consider their non-recoverable expenses—sunk costs—as if they were of value for the next investment decision. For example, investing time on a tour, game or activity that was purchased to bring joy but is not doing so, just to get the money worth.
- ○
- Strategy: 100 times
This strategy can be applied to both biases in this phase. Since losses loom larger than gains, decision-makers might be willing to sacrifice above their rational threshold to avoid one loss. However, this willingness dissolves when asked to repeat the same decisions 100 times in the future. This tactic magnifies the consequences of the upcoming decision and moves the decision-maker away from the steep decline of the loss from the hypothetical value function in prospect theory [7].
This article’s hypothesis postulates that bias decisions along the DP can be mitigated. To do so, the decision phases need first to be identified along the process, and then the corresponding bias-mitigation strategies can be applied. In the next section, the SRP methodology was used to exercise the implementation of the above-mentioned hypotheses.
4. Implementation of the ABC Decisions and Strategies to the SRP Methodology
Customer purchase decisions are increasingly focusing on added features—or at least improved ones—when comparing products within and between brands. The rising share of software in previously mechanically based products enables products to be upgraded not only by mechanically based technological changes but also by software-based features and services. As a result, companies can develop novel innovative business models, but at the same time, face increased complexity in upgrading their products. Accordingly, companies are faced with the question of how to upgrade future products by introducing new features. Here, decisions have to be made on which features are valuable or should be postponed for future releases. This type of product evolution planning—by deciding which and when new features and releases should be introduced—is part of SRP. This planning can be seen as an optimization problem, more precisely, as an application of the knapsack problem. This problem is experienced by anyone who is limited by a given size of a knapsack and seeks to fill it with the most valuable items. With respect to release planning, a similar problem can be characterized by selecting an optimal set of features of the highest value for the next release, which must be developed with limited resources and costs. Additionally, the planning decisions need to consider strategic goals, market timing, feature feasibility/maturity and portfolio dependencies. The challenge for decision-makers in SRP is the fine line between value creation and cost effects. On one side, companies expect profits, and customers expect added value from new features. On the other side, the introduction of new features means costs and risks. For this reason, SRP is considered an optimization problem in the sense of the knapsack problem. As a result, decision-makers in release planning are faced with the challenge of making several correlated decisions while considering system complexity. SRP can therefore be seen as a very vulnerable process for biases.
4.1. SRP Methodology Steps
This section presents a methodology on value-oriented strategic release planning based on the work of Şahin et al. [12] alongside. This methodology is examined through the lens of the ABC decision model to identify opportunities to improve the decisions along with the 13 SRP steps. Hence, the SRP methodology steps are described with a focus on their relevant decision. The SRP methodology endeavors to illustrate how the ABC decision model can be applied to any process within the DP, even when this process includes actors from different disciplines. The way to implement the ABC model throughout the SRP process is clarified in Section 4.2. Figure 6 shows an overview of the SRP process, its three stages and 13 steps.
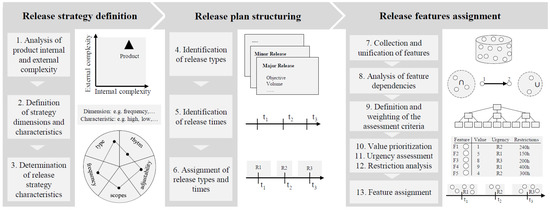
Figure 6.
Methodology for value-oriented strategical release planning. Adapted from ref. [12].
- 1.
- Analysis of product internal and external complexity
The SRP begins with the stage of the release strategy definition. The release strategy provides a guideline for the entire planning process and contains fundamental principles—e.g., release frequency, planning scope and level of systematization—to be followed when updating the product. Defining a release strategy depends primarily on the internal—e.g., architectural flexibility—and external complexities—e.g., market dynamics—that a product is subjected to, as well as the underlying product, portfolio and business strategy. Thus, the first step of SRP (1) is an analysis of the external and internal complexity of a product.
- ○
- Assessment: This step focuses on planning and attaining business clarity; hence, this step can be considered a clarification phase.
- 2–3.
- Definition and determination of strategy dimensions and characteristics
The classification of a product’s complexity may be done very roughly with no reference products and supporting criteria to determine the complexity, since in most cases, the staff involved in details of a product, tend to rate their products as being complex—as previously shown with the pencil example. Based on a product’s complexity classification, the according release strategy dimensions—e.g., rhythm—and their characteristics—e.g., cyclic, feature-based—can be defined (2) and consequently determined (3). The automotive industry, for example, follows highly fixed release strategies with predefined release types—e.g., facelift—of low frequency and cyclically predefined releases [36]. As the example indicates, the release strategy forms the planning process. Here, strategic roles and opinions, as well as soft factors, have a significant influence in this phase, making this phase highly subjective. Since the overall long-term planning is based on the strategy, biases should be minimized in order to avoid the long-term consequences of wrong decisions. The determination of the release types has enormous effects on the entire product evolution and should therefore be reviewed regularly.
- ○
- Assessment: Step two and three are mainly evaluating figures and ranking characteristics while managing system complexity; hence, these steps can be considered analysis–evaluation phases.
- 4–5.
- Identification of release types and times
After defining the release strategy, the release plan is structured by determining release types (4) and times (5). Since a product’s evolution is based on different types of releases, these types need to be determined as the first step in the stage of release plan structuring. The release types can be differentiated according to various characteristics, such as implementation purpose, release size and frequency. For instance, product generations, facelifts, limited editions and motorization releases are quite common in the automotive industry [12]. The definition of release types is mostly based on established release types in the related product branches. Once release types are defined, they typically become rapidly traditional release types—e.g., facelifts—that are difficult to be changed. The difficulty of providing methodological procedures for determining release types, except for suggesting release type attributes, results in the fact that release types are mostly determined based on the experience and intuition of the decision-makers. Once the release types are defined, potential release times are determined (5), considering, if possible, all relevant aspects—e.g., critical release time from the market’s perspective—that influence the value of the releases. This primarily requires a closer look at how the values of existing features in the current product perform in order to identify critical upgrade times or release dates. Furthermore, key events, as well as portfolio, technology, competitive and high-level roadmaps, provide a basis for identifying critical release dates.
- ○
- Assessment: The values assigned in these steps are mainly given by comparing and referring to former types and times; hence, these steps combine both analysis–realization and analysis–evaluation phases.
- 6.
- Assignment of release types and times
Using the identified dates from different perspectives, the release dates are aggregated, and suitable release types are assigned (6). The result is a structured release plan with defined release dates and types. During the identification of release times and the assignment of release types, it is likely that many important release times could be neglected despite methodical support and influencing timing aspects. This situation is mostly caused by the fact that the decision-makers have already in advance personally preferred release times and the corresponding release types in mind and enforce during decision making.
- ○
- Assessment: Step six is strongly affected by the know-how introspective done by decision-makers and the cut-decisions needed to assign the plan; hence, this step can be considered a clarification and THAT-decision phase.
- 7.
- Collection and unification of features
In the last stage of an SRP process, the features for upgrading the product are selected and assigned to the previously determined releases. As a first step, potential features are gathered from various responsible departments of an organization into a feature pool and are described by relevant information for the subsequent process steps in a standardized and comparable way (7). A challenge in doing this is to acquire the relevant information of the features—e.g., customer attractiveness, implementation effort—from responsible entities in a correct way. Here, templates for feature profiles can be used to ensure standardization and comparability.
- ○
- Assessment: Step seven is about knowledge and control—as defined by Hammond and Summers— hence, this step can be considered an analysis–evaluation phase.
- 8.
- Analysis of feature dependencies
The features are then put into a dependency analysis, in which their interdependencies are analyzed (8). Dependency may arise if certain features should be introduced together, subsequently or separately. Dependencies between features can have various reasons—e.g., technical, customer demand— that can only be identified by involving respective experts.
- ○
- Assessment: This step is about running analysis and searching for dependencies; hence, this step can be considered an analysis–realization phase.
- 9.
- Definition and weighting of the assessment criteria
Following the dependency analysis, it is necessary to determine and weigh the criteria for feature selection and assignment (9). The identified criteria are used to assess the value, urgency, and restrictions of each feature. The selection and weighting of the criteria play a critical and often underestimated role since it determines the overall result significantly. An incorrect selection and weighting of criteria, despite correctly performed process steps before and after, can result in a poor quality of the release plan.
- ○
- Assessment: Like step two and three, this step focuses on evaluating criteria and ranking dependencies while managing system complexity; hence, this step can be considered an analysis–evaluation phase.
- 10–13.
- Value prioritization, urgency assessment, restriction analysis and feature assignment
Based on the criteria, the features are prioritized on their value (10). The value is mostly measured in monetary terms; however, it is recommended that appropriate prioritization techniques are used depending on the number of characteristics and criteria to be considered. Complementary benefit aspects—such as customer value, strategic value, etc.—should be considered to ensure that the reasoning is not only carried out from a monetary point of view. In parallel, the urgency of each feature is analyzed to determine whether a feature should be implemented in earlier or later versions (11). For this purpose, the value influencing aspects—e.g., customer urgency, competition pressure—should also be considered. After value prioritization and urgency assessment, the restrictions—e.g., cost, resource availability and technological maturity—are analyzed for each feature to determine if a feature can be assigned to specific releases (12). Based on the mentioned process step, each feature is described by specific values, urgencies and restrictions. This enables the selection of features and their assignment to the respective releases (13). The assignment process is the most complex process steps in which all data and interrelations need to be considered. The aim of the selection and assignment is to achieve the highest possible value of a release in terms of the knapsack problem, considering all parameters from the previous process steps. Current computer-based algorithms are usually not sufficient to achieve an optimal selection and allocation, as they do not take into account expert knowledge and experience. As a result, this decisive step is highly characterized by subjectivity, which can be objectified to a certain extent by methodological procedures.
- ○
- Assessment: Steps 10 to 13 are about selecting values that have consequences on what feature will be pushed up on the planning list and what others will be lost at the bottom; hence, these steps can be considered THAT-decision phases.
The characteristics of the decisions in each step made the assessment of the ABC decision phases very straightforward. However, some steps required more than one phase to better cover the decision activities on those steps. Next, decision-makers should be presented with the bias-mitigation strategies that correspond to the step they are running.
4.2. Putting It All Together
To apply the ABC decision model and strategies, the SRP team first gets an introductory workshop and training on ABC decision theory—covered in Section 2 and Section 3—. Then, during their SRP assessment meetings but also during individual decision-making processes, team members are requested/invited to incorporate biases mitigation–strategies to support their decisions. For example, during SRP step 1—Analysis of product internal and external complexity—team members will be asked to be aware of overconfidence biases but also of optimism and the planning fallacy; whenever they see it suited, they will apply the corresponding bias-mitigation strategy: breaking it down or asking externals.
On SRP steps that incorporate more than one ABC decision phase—e.g., SRP steps 4–5—the team would be generally exposed to more types of biases—typical of those two phases—. On the one hand, this requires more vigilance from the team. On the other hand, having two phases applicable at the same step will also mean that the number of strategies available also doubles. This is one of the situations where upfront training on identifying bias and applying the corresponding strategies will ease implementation.
Once the team is trained and the most relevant ABC decision phase/phases are matched with each of the 13 SRP steps—as shown in the last section— decision-makers have a dedicated set of bias-mitigation strategies that can be applied to each step; as described in Section 3.2 and recapped below.
SRP step >> Matching ABC decision phase:
- ○
- Prone bias >> Corresponding mitigation–strategies
- 1.
- Analysis of product internal and external complexity >> Clarification phase:
- ○
- Overconfidence bias >> Breaking it down
- ○
- Optimism and the planning fallacy >> Asking externals
- 2–3.
- Definition and determination of strategy dimensions and characteristics >> Analysis–evaluation phases:
- ○
- Anchoring bias >> Applying contrafactual thinking
- ○
- Inconsistency >> Calibrating by continual comparisons
- ○
- Redundancy >> Doing the math
- 4–5.
- Identification of release types and times >> Affecting analysis–realization and Analysis–evaluation phases:
- ○
- Bounded awareness >> Looking at the bigger picture
- ○
- Confirmation bias >> Devil’s Advocate
- ○
- Search type >> Searching different
- ○
- Anchoring bias >> Applying contrafactual thinking
- ○
- Inconsistency >> Calibrating by continual comparisons
- ○
- Redundancy >> Doing the math
- 6.
- Assignment of release types and times >> Clarification and THAT–decision phase:
- ○
- Overconfidence bias >> Breaking it down
- ○
- Optimism and the planning fallacy >> Asking externals
- ○
- Framing and loss aversion >> Turning it around
- ○
- Sunk–Cost fallacy >> 100 times
- 7.
- Collection and unification of features > > Analysis–evaluation phase:
- ○
- Anchoring bias >> Applying contrafactual thinking
- ○
- Inconsistency >> Calibrating by continual comparisons
- ○
- Redundancy >> Doing the math
- 8.
- Analysis of feature dependencies >> Affecting analysis–realization phase:
- ○
- Bounded awareness >> Looking at the bigger picture
- ○
- Confirmation bias >> Devil’s Advocate
- ○
- Search type >> Searching different
- 9.
- Definition and weighting of the assessment criteria > > Analysis–evaluation phase:
- ○
- Anchoring bias >> Applying contrafactual thinking
- ○
- Inconsistency >> Calibrating by continual comparisons
- ○
- Redundancy >> Doing the math
- 10–13.
- Value prioritization, urgency assessment, restriction analysis and feature assignment > > THAT–decision phases:
- ○
- Framing and loss aversion >> Turning it around
- ○
- Sunk Cost fallacy >> 100 times
As proven by the experiments referred to in Section 3.2, these strategies offer promising opportunities for allaying biased choices in decision-making processes. This section showed how the SRP could take advantage of these opportunities; nevertheless, the here-presented ABC decision model and strategies were designed as a general application for DPs in the field of engineering design. To further improve the quality of decision making in the release planning process, the approach of open innovation can be beneficial, involving external stakeholders directly in the relevant decisions [37]. The following section presents a more generic application.
5. ABC Decisions and Strategies Applied in the Industry
This first industry application of ABC strategies served to test the approach and its relevance on real-world industry projects. The goal of this intervention was to bring some light to the following questions.
- Can the ABC strategies be applied in real-world industry projects?
- Would the strategies be followed beyond the workshop?
- Are the topics heuristics and allaying biased decision relevant among engineers?
- How could the impact that biases have on projects be quantified?
To find some answers to the above-mentioned questions, a group of research and development (R&D) engineers were invited to a non-compulsory two-session workshop. Before deep-diving into the ABC decision theory, the group received an initial survey on the topics of decision making, heuristics and biases. Later, participants were presented with the ABC decisions and strategies, followed by a pocket-size summary of the strategies grouped by decision. The summary served as a reminder but also as an invitation to apply the approach in their running projects whenever they found it suitable. Lastly, the group was approached one month later with a final survey that served as a comparison against the initial survey.
Unlike Section 4, where ABC phases were matched with product development phases (SRP steps), in this first industry application, participants only received the pocket-size summary and were invited to use all 10 bias-mitigation strategies from the summary. This was because matching ABC phases had required, in addition to the R&D engineers, the involvement of the project management office.
The findings of this intervention were very promising, proving that in this initial sample, the ABC theory and strategies were applicable and revealing that engineers see a high need of reducing the effect of biases in their field. The coming paragraphs cover the responses of both surveys, followed by a before-and-after assessment of those responses, and closes with the conclusions of the first industry application.
5.1. Industry and Group Demographics
The study was conducted on the product development division of a corporation located in the D–A–CH region. This division develops high-precision mechatronic products that are produced and sold in high volumes all around the world. In order to avoid productivity losses, the group size established for the study was limited to seven developers. This accounts for 16% of the developers in that division. The seven invitees were randomly selected. Due to conflicting meeting schedules and project priorities, only five of the seven invitees concluded the workshop.
The five participants were all engineers, three males and two females, with ages spreading from mid–30′s to 60′s. Their academic degrees varied from bachelors to PhDs, all on engineering disciplines—Electronics, Mechanics and Physics. They all studied and worked in the D–A–CH region, and their work experience in R&D averaged 21 years.
5.2. Initial Survey Results
To quantify and sense the awareness of decision making along with the DP, participants were asked to give the average number of R&D decisions made in a typical development day; the answers varied from 10 to 200; however, most participants gave a double-digit number. The group average was 65 decisions per day. Then, they were asked to individually assign the percentage of R&D decisions—whit in an average day—that fall into the categories below. The list below presents the given categories with the resulting group average.
- Mostly objective decisions—Not influenced by personal feelings, tastes, or opinions—: 20%
- Mostly subjective—Based on, or influenced by personal feelings, tastes, or opinions—: 34%
- An even mix of objective and subjective: 42%
- Random decisions: 4%
The group then received an explanation of the terms heuristics and cognitive biases to provide a common understanding. Next, they were asked to assign the percentage of R&D decisions—on an average day—that required heuristics for the decision-making process and to indicate the percentage of biased decisions each made in an average day. The resulting group averages were:
- R&D decisions that made use of Heuristics: 56%
- R&D decisions that were misled or biased: 20%
Lastly, and before the theoretical part of the workshop started, participants were asked to list their known bias-mitigation strategies and to mention—in percentage—how often they apply those strategies to support their R&D decisions. Two participants could not list any strategy; one of them listed one strategy, and the other two engineers gave at least three strategies. These last two engineers also reported using their strategies often—20% and 50% of the time— resulting in a group average of 15%.
After the initial survey, the group received an interactive lecture that covered the theory presented in Section 2 and Section 3 of this article with a focus on bias-mitigation strategies. The lecture finished with an invitation to apply the ABC strategies on a voluntary basis; for this, a pocket-size summary was given to them as aid. The group was informed that a final survey would follow one month later, and no further interventions were done during that month.
5.3. Final Survey Resutls
One month after the workshop, participants were invited to complete the same survey plus two supplementary questions. They were also asked to avoid looking at aid material nor their previews answers. On this final survey, the perceived number of decisions per day dropped on average by half to 32 decisions, and the number of objective decisions increased from 20% to 34%, as shown below:
- Mostly objective—Not influenced by personal feelings, tastes, or opinions—: 34%
- Mostly Subjective—Based on, or influenced by personal feelings, tastes, or opinions—: 13%
- An even mix of Objective and Subjective: 49%
- Random decisions: 4%
Regarding heuristics and biases, the proportion of R&D decisions that made use of heuristics remained very similar; however, the perceived group average of biased decisions almost doubled, going from 20% in the initial survey to 38% in the final one.
- R&D decisions that made use of Heuristics: 48%
- R&D decisions that were misled or biased: 38%
On this final survey, all engineers were able to recall at least three bias-mitigation–strategies; also, they reported to have applied those strategies to 34% of their daily decisions, on average.
The final survey had two supplementary questions; one of them asked participants to assess the need of reducing the effect of biases in their R&D decisions. The available options were: no need, some need, highly need, indispensable or other-answer. Four out of five declared the need for reducing biases to be high or indispensable, and only one of them selected other-answer. The last supplementary question was an open one, asking engineers about what could be done by/for their R&D community to reduce the effect of biases in R&D decisions. The responses covered: awareness, training and reminders about biases and decision-making strategies but also expressed the importance of giving sufficient time for better decision making.
5.4. Surveys Assessment
As mentioned at the beginning of Section 5, the industry intervention aimed to answer, at least partially, questions about relevance, applicability and impact of biased decisions in R&D projects. Those questions are the guiding basis of this section.
- 1.
- Can the ABC strategies be applied in real-world industry projects? and
- 2.
- Would the strategies be followed beyond the workshop?
In general, the workshop was very well received by the participants, and on the supplementary questions, engineers shared their interest in the topic and their appetite for more content on biases and decision making. Before the workshop, only two of the five participants could name three or more bias-mitigation strategies; and one month after, all participants could do so. Moreover, the average usage of those strategies went from 15% up to 34%. These results indicate that the material covered in the workshop remained present in their minds, but more importantly, it shows that those engineers voluntarily decided to apply those strategies more often to their R&D decision-making processes.
- 3.
- Are the topic heuristics and allaying biased decision relevant among engineers?
To answer this question the following question was placed in the supplementary section of the final survey: “Do you see the need of reducing the effect of biases in your R&D decisions?”
The results clearly show that they see a high need for allaying biased decision, and this gives the topic relevancy.
- 4.
- How could the impact that biases have on projects be quantified?
The sample size of this intervention does not have the statistical power to draw any general conclusion, but it serves to give first indications on the impact of biases for the projects where those engineers are involved.
On the initial and the final survey, on average, participants applied heuristics in one of every two R&D decisions. Moreover, their average percentage of biased decisions was estimated to be 20% in the initial survey and almost double in the final one. Most DPs follow a sequential/waterfall flow, e.g., VDI 2221 [2]. Consequently, many decisions of today are based on facts and figures that resulted from yesterday’s decisions. Accordingly, when considering 20% of the daily decisions as biased, it would only take weeks for a project to get half of the R&D decisions polluted with biases. This does not necessarily mean that those decisions are wrong, but it highlights the potential that heuristics and bias have in the DP to mislead engineering decisions and thus to have an impact on the final product.
Additional considerations: On the one hand, it can be said that the change in figures from the initial to the final survey—e.g., the drop of daily decisions and/or increase of biased decisions—can be partially attributed to an increase in awareness. Meaning that, for the final survey, engineers were more educated about biases—due to the workshop—and more mindful of their decisions along the days—since they knew upfront that a second survey was coming. On the other hand, it can be said that the change in figures from the initial to the final survey is partially influenced by the content of the workshop. With the data acquired from the survey alone, it would be difficult to attribute more weight to one explanation or the other. To improve this, a future industry intervention could repeat the initial survey at the end of the workshop. Judging only by the supplementary questions, the topic appears relevant to R&D engineers, and this opens the opportunity for further interventions.
This first industry application of ABC strategies showed that, with a fairly small intervention (a four-hour workshop divided into two evening sessions), it is possible to increase the awareness on the topic of cognitive biases along with the DP, but also to increase the use of bias-mitigation strategies on day-to-day engineering decisions. The final survey also helped to illustrate that engineers are not only interested in the topic but also see the need for Allaying Biased Choices in DPs.
6. Discussion
This article is the first fragment of ongoing research on decision making in engineering design and strategies to improve decisions by reducing the effects of cognitive biases. The ongoing research is part of the doctoral work of the first author.
DPs come in all sizes and forms, and taking them apart might result in an infinite number of steps, phases, and decision activities. However, this research focuses on decision models in engineering design to claim that there is only a limited number of decision phases. The here-presented results show that the four phases of the ABC decision model are very different among them and can also be matched with many decisions along with the DP, as demonstrated in Section 4. The differences among phases also show independent affinity to certain cognitive biases, and this makes the allocation of bias-mitigation strategies a straightforward exercise.
To achieve a more comprehensive method, it is possible to add more cognitive biases. However, as the number of strategies increases, the simplicity of allocating and applying the right strategy reduces. The next step in this research is to find a method that allows for a substantial increment in the biases and corresponding strategies but remains simple and pragmatic in its implementation.
Author Contributions
Conceptualization, J.G.S.R.; methodology, J.G.S.R.; validation, J.G.S.R. and T.Ş.; formal analysis, J.G.S.R.; investigation, J.G.S.R. and T.Ş.; resources, J.G.S.R. and T.V.; writing—original draft preparation, J.G.S.R. and T.Ş.; writing—review and editing, J.G.S.R., T.Ş. and T.V.; visualization, J.G.S.R.; supervision, T.V.; project administration, J.G.S.R.; funding acquisition, T.V. All authors have read and agreed to the published version of the manuscript.
Funding
We acknowledge the support from the German Research Foundation and the Open Access Publication Funds of Technische Universität Braunschweig.
Data Availability Statement
Not applicable.
Conflicts of Interest
The authors declare no conflict of interest.
References
- VDI, VDI 2221, Düsseldorf: VDI-Gesellschaft Produkt- und Prozessgestaltung. 1993.
- VDI, VDI 2221, vol. 1, Düsseldorf: VDI-Gesellschaft Produkt- und Prozessgestaltung. 2019.
- Khodaei, H.; Ortt, R. Capturing dynamics in business model frameworks. J. Open Innov. Technol. Mark. Complex. 2019, 5, 8. [Google Scholar] [CrossRef]
- Fricke, G.; Pahl, G. Zusammenhang zwischen personenbedingtem Vorgehen und Lösungsgüte. In Proceedings of the ICED, Zürich, Switzerland, 27–29 August 1991. [Google Scholar]
- Pahl, G.; Beitz, W.; Feldhusen, J.; Grote, K.-H. Engineering Design: A Systematic Approach; Springer: Berlin/Heidelberg, Germany, 2007. [Google Scholar]
- Haidt, J. The emotional dog and its rational tail: A social intuitionist approach to moral judgment. Psychol. Rev. 2001, 108, 841. [Google Scholar] [CrossRef] [PubMed]
- Kahneman, D.; Tversky, A. Prospect theory: An analysis of decision under risk. Econometrica 1979, 47, 263–291. [Google Scholar] [CrossRef]
- Tversky, A.; Kahneman, D. Judgment under uncertainty: Heuristics and biases. Science 1974, 185, 1124–1131. [Google Scholar] [CrossRef] [PubMed]
- Baker, M.; Penny, D. 1500 Scientists Lift the Lid on Reproducibility; Macmillan Publishers Limited: San Francisco, CA, USA, 2016. [Google Scholar]
- Schwenk, C.-R. Devil’s advocacy in managerial decision-making. J. Manag. Stud. 1984, 21, 153–168. [Google Scholar] [CrossRef]
- Chesbrough, H. The new environment for business models. In Open Business Models; Business School Press: Boston, MA, USA; Harvard, MA, USA, 2006; pp. 49–80. [Google Scholar]
- Şahin, T.; Huth, T.; Axmann, J.; Vietor, T. A methodology for value-oriented strategic release planning to provide continuous product upgrading. In Proceedings of the IEEE International Conference on Industrial Engineering and Engineering Management, Singapore, 14–17 December 2020. [Google Scholar]
- Arnott, D. Decision Biases and Decision Support Systems Development; Monash University: Melbourne, VIC, Australia, 2002. [Google Scholar]
- Kinsey, M.; Kinateder, M.; Gwynne, S.M.V.; Hopkin, D.J. Burning biases: Mitigating cognitive biases in fire engineering. Fire Mater. 2020, 45, 543–552. [Google Scholar] [CrossRef]
- Miller, G.A.; Galanter, E.; Pribram, K. Plans and the Stucture of Behavior; Rinehardt & Winston: New York, NY, USA, 1960; pp. 1065–1067. [Google Scholar]
- Galle, P.; Kovacs, L. Replication protocol analysis: A method for the study of real-world design thinking. Des. Stud. 1996, 17, 181–200. [Google Scholar] [CrossRef]
- Hansen, C.; Andreasen, M. Basic thinking patterns of decision-making in engineering design. In Proceedings of the International Conference on Multi-Criteria Evaluation, Neukirchen, Austria, 1 January 2000. [Google Scholar]
- Ahmed, S.; Hansen, C.T. A decision-making model for engineering designers. In Proceedings of the Engineering Design Conference, London, UK, 9–11 July 2002. [Google Scholar]
- Höhne, G. Treatment of decision situations in the design process. In Proceedings of the International design conference—DESIGN 2004, Dubrovnik, Croatia, 18–21 May 2004. [Google Scholar]
- Hanse, C.T.; Andreasen, M. A mapping of design decision making. In Proceedings of the DESIGN—International Design Conference, Dubrovnik, Croatia, 18–21 May 2004. [Google Scholar]
- Oxford University Press. 2017. Available online: https://www.oxforddictionaries.com. (accessed on 11 November 2017). Searched term: Analyse.
- Oxford University Press. 2017. Available online: https://www.oxforddictionaries.com. (accessed on 11 November 2017). Searched term: Realization.
- Hammond, K.R.; Summers, D.A. Cognitive control. Psychol. Rev. 1972, 79, 58. [Google Scholar] [CrossRef]
- Ackoff, R. Ackoff’s Best; John Wiley & Sons: New York, NY, USA, 1999. [Google Scholar]
- Read, L.E. I, Pencil: My Family Tree as Told to Leonard, E. Read; The Freeman: New York, NY, USA, 1958; Volume 8, pp. 32–37. [Google Scholar]
- Sanchez Ruelas, J.; Stechert, C.; Vietor, T.; Schindler, W. Requirements Management and Uncertainty Analysis for Future Vehicle Architectures. In Proceedings of the FISITA, Beijing, China, 23–30 November 2012. [Google Scholar]
- Zadeh, L. Fuzzy sets. Inf. Control 1965, 8, 338–353. [Google Scholar] [CrossRef]
- Saaty, T. The Analytic Hierarchy Process: Planning, Priority Setting, Resource Allocation; McGraw-Hill: New York, NY, USA, 1980. [Google Scholar]
- Kahneman, D. Thinking, Fast and Slow; Farrar, Straus and Giroux: New York, NY, USA, 2011. [Google Scholar]
- Rozenblit, L.; Keil, F. The misunderstood limits of folk science: An illusion of explanatory depth. Cogn. Sci. 2002, 26, 521–562. [Google Scholar] [CrossRef] [PubMed]
- Hogarth, R.M. Judgement and Choice: The Phychology of Decision; John Wiley & Sons: Oxford, MA, USA, 1987. [Google Scholar]
- Rogers, T.; Milkman, K.; John, L.; Norton, M. Beyond good intentions: Prompting people to make plans improves follow-through on important tasks. Behav. Sci. Policy 2015, 2, 33–41. [Google Scholar] [CrossRef]
- Simons, D.; Chabris, C. The invisible gorilla. 2010. Available online: http://www.theinvisiblegorilla.com (accessed on 31 July 2018).
- Galbraith, R.C.; Underwood, B.J. Perceived frequency of concrete and abstract words. Mem. Cogn. 1973, 1, 56–60. [Google Scholar] [CrossRef] [PubMed]
- Mitchell, D.J.; Russo, J.E.; Pennington, N. Back to the future: Temporal perspective in the explanation of events. J. Behav. Decis. Mak. 1989, 2, 22–38. [Google Scholar] [CrossRef]
- Weinreich, S.; Şahin, T.; Inkermann, D.; Huth, T.; Vietor, T. Managing disruptive innovation by value-oriented portfolio planning. In Proceedings of the DESIGN Conference, Pittsburgh, PA, USA, 26–29 October 2020. [Google Scholar]
- Nayebi, M.; Ruhe, G. An open innovation approach in support of product release decisions. In Proceedings of the 7th International Workshop on Cooperative and Human Aspects of Software Engineering, Hyderabad, India, 2–3 June 2014. [Google Scholar]


Publisher’s Note: MDPI stays neutral with regard to jurisdictional claims in published maps and institutional affiliations. |
© 2021 by the authors. Licensee MDPI, Basel, Switzerland. This article is an open access article distributed under the terms and conditions of the Creative Commons Attribution (CC BY) license (https://creativecommons.org/licenses/by/4.0/).