Abstract
Most of the studies related to technology analysis have focused on one specific technological field such as autonomous driving or blockchain. Most technologies have large and small relationships with each other. Therefore, it is necessary not only to perform technology analysis focusing on one target technology, but also to analyze several integrated technologies at the same time. In this paper, we propose a methodology for integrating technologies and analyzing the integrated technologies. We integrate patent big data for technological integration and use text mining, boosting, and ensemble for integrated technology analysis. To evaluate the performance of proposed method, we search the patent documents related to disaster artificial intelligence (AI) and extended reality (XR). In our case study, we integrate the patent data from disaster AI and XR technologies and analyze the integrated patent data using regression trees, random forest, extreme gradient boosting, and ensemble models. Therefore, we illustrate how our proposed method can be applied to the real domain.
1. Introduction
Technology has been constantly researched and developed for the continuous development of our society [1]. Of course, the direction of technology development has also changed according to the needs of society [1]. Technological sustainability has been an important issue in management of technology [2,3]. Rather than a single technology being used alone, the demand for convergence technology that combines various technologies increases continuously. Therefore, to manage convergence technology efficiently and effectively, we need to technology integration and analysis. However, most of the existing studies for technology analysis were about one target technology. In other words, intensive analysis using machine learning algorithms was mainly conducted for one technological field. Park and Jun (2017) studied statistical technology analysis for three-dimensional (3D) printing as a target technology [4]. They performed a technology analysis for one technological field called 3D printing technology. Wanga et al. (2020) also considered 3D printing technology as one target for technology analysis based on mapping technological trajectories and exploring knowledge sources [5]. Many studies related to technology analysis selected and analyzed only one target technology [6,7,8]. For a more advanced technology analysis and a systematic understanding of convergence technology, there is a need to analyze two or more technologies at the same time. By this necessity, we propose a methodology for integrating technologies and analyzing integrated technologies. In this paper, we use ensemble models based on a tree structure and boosting by majority voting. The remainder of this paper is organized as follows. In Section 2, we show the machine learning for technology analysis as research backgrounds. We show the proposed methodology of boosting and ensemble models for technology integration and analysis in Section 3. The next section provides a case study to illustrate how our paper can be used in real domains. We discuss some implications and limitations of our research in Section 5. In the conclusion section, we conclude our research and describe our future works.
2. Machine Learning for Technology Analysis
Machine learning is a representative learning tool that analyzes data along with statistics [9,10]. Many studies have been conducted on technology analysis using machine learning algorithms [2,3,4,5,6,7,8]. Technology analysis is to analyze diverse technologies for a target domain [1]. There have been two major approaches to technology analysis so far. They are qualitative and quantitative approaches. The qualitative methods for technology analysis are based on the experts’ knowledge and experience [1]. Delphi is a popular method for qualitative technology analysis. This is a method of analyzing target technologies through repeated surveys of expert groups. Delphi is a subjective technology analysis method, because it relies on the subjective knowledge of each domain expert [11]. In other words, the results of technology analysis may vary depending on the experts’ experiences. Of course, the result of Delphi technology analysis by experts with sufficient knowledge about the target technology will be good. Compared to qualitative technology analysis, quantitative technology analysis is more objective. Quantitative technology analysis does not depend on experts’ knowledge, but on technological documents such as patents and papers [12,13]. We collect patent documents related to the target technology and analyze patent data using quantitative data analysis methods. At this time, we analyze the patent data using various analysis methods provided by machine learning, and through this, a technology analysis of target domain is performed. As research on big data and machine learning is actively conducted, technology analysis is increasing by quantitative techniques rather than qualitative techniques. In this paper, we also use machine learning algorithms such as trees, boosting, and ensemble to analyze patent documents related to target technology.
3. Boosting and Ensemble Models for Technology Integration and Analysis
For effective analysis of convergence technology that combines two or more technologies, we study a methodology of patent big data integration and integrated technology analysis. In this paper, we use boosting and ensemble models based on regression trees, random forest, and extreme gradient boosting (XGBoost) for integrated technology analysis [14,15,16]. Figure 1 shows the procedure of technology integration in our methodology.
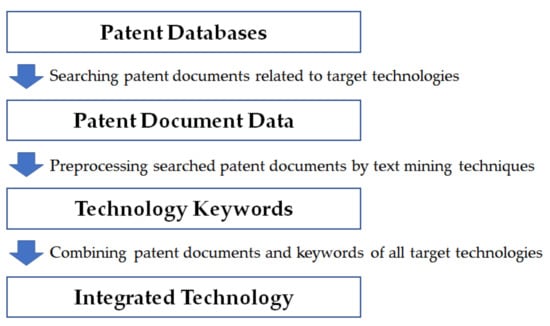
Figure 1.
Technology integration using text mining.
First, we integrate target technologies by preprocessing text mining techniques. Using a keyword equation for target technology field, we search patent documents related to target technologies from patent databases. If n target technologies are selected, we collect n groups of patent documents. The collected patent documents are preprocessed by various text mining techniques and transformed to text corpus. Next, the corpus is modified to text database by text parsing. We extract technology keywords from the text database. In traditional natural language processing (NLP), the measure of term frequency–inverse document frequency (tf–idf) is used to measure how well a term makes up a document [17]. The role of keywords in NLP is how well they can represent the document to which the keyword belongs [18]. However, in technology analysis, we need the keywords representing technological descriptions of a target technology that consist of patent documents. Therefore, in this paper, we do not use the tf–idf measure. Instead, we apply the text mining techniques of stemming, whitespace elimination, stop-words removal, and synonyms to text database, and select the keywords with high frequency of occurrence. From the list of keywords selected in this way, a call for papers of the academic conferences and textbooks related to the target technology, and with the help of a group of experts in the relevant technology field, the keywords to be used for technology analysis are finally determined. Using the final keyword data, we construct patent document and keyword matrix. The matrix consists of patent documents (rows) and keywords (columns), and its elements are occurred frequency values of keywords in each patent document. A target technology has its own patent document and keyword matrix. That is, if the number of target technologies is n, we construct n matrix data. We extract keywords describing the corresponding target technology from each of the n matrices. We select common keywords representing n technologies, and finally integrate all keywords for n technologies for integrated technology analysis. In our research, we consider ensemble model based on regression trees, random forest and XGBoost for technology analysis based on patent documents and keyword matrix. Therefore, we first consider a regression tree model to choose meaningful keywords for target technology. The keyword data D for regression tree is represented as follows.
In Equation (1), is an explanatory variable (keyword) and is a response variable (target keyword). In general, the regression tree model is used for prediction, estimation, and explanation in regression tasks [14]. Among them, we use this model for explanation to select the predictors (explanatory variables) that significantly explain target keyword (response variable) using relative contributions of different predictors. Basically, decision trees with classification and regression are constructed by measures of homogeneity [9]. Therefore, in the regression tree model, we use variance (F-test) of target as a measure cost, because the greater the homogeneity of the nodes included in the model, the better the model performance. The cost measure used in our regression tree is defined as follows [9].
is the mean of values of y included in a node, and k is the number of y values in the node in equation (2). Using this measure, we determine threshold t of predictor x by minimizing the following equation (3) and split each node to left and right nodes of the next step.
In the regression tree model, explanatory variables that have a significant effect on the response variable are used in the tree growing process. Therefore, from the result of the fitted tree model, we can select only the keywords that affect the target keyword. Next, we use another tree model called random forest to select significant predictors. The random forest is an extended decision tree model with bagging [19]. This model performs keyword sampling with patent documents sampling. The random forest provides feature selection and splitting points (patents) by minimizing impurity criterion such as Gini index and entropy. Compared to decision trees such as classification and regression trees, this model has the steps of bagging and bootstrapping of explanatory keywords at each step. The procedure for the random forest model to select predictor variables that affect target is as follows.
- (Step 1)
- Given data (n: the number of data points, p: the number of variables)
- (1-1)
- Determine m (the number of sampled variables),
- (Step 2)
- Carry out bootstrap
- (2-1)
- Sample n data points with replacement
- (2-2)
- Sample m variables at random without replacement
- (Step 3)
- Apply tree splitting algorithm to p sampled variables
- (3-1)
- Given value t of X splitting node A into two sub nodes
- (3-2)
- as one partition (sub node) and as another partition (sub node)
- (3-3)
- Choose optimal t to minimize homogeneity within node
- (Step 4)
- Perform next split
- (4-1)
- Repeat (Step 2) and (Step 3) until the conditions for stopping tree growth are satisfied
Like the regression tree model, we use the result of random forest for choosing the explanatory keywords that affect the target keyword. Lastly, we consider ensemble models for analyzing integrated technologies. Boosting is a basic method to build an ensemble model. Both bagging and boosting are used in the decision trees, but boosting is much more advanced and powerful than bagging. Boosting algorithms have several types such as Adaboost, gradient boosting, and stochastic gradient boosting [19]. Ensemble methods have been used for decision trees efficiently and effectively; also, they are so powerful to select important variables in the regression tree and random forest models [19]. In our research, we apply ensemble to choose the keyword that affects the target significantly. Therefore, we consider XGBoost as another approach to keyword selection from patent keyword data. XGBoost has been used for tree-based modeling, and this is an implementation of boosting such as stochastic gradient boosting [19]. In general, boosting is an algorithm to carry out an ensemble of various tree models [19]. We perform the following steps for our ensemble modeling.
- (Step 1)
- Initialize and K = the number of models
- (Step 2)
- Iterate k = 1, 2, …, K
- (2-1)
- Train a model minimizing weighted error using weights
- (2-2)
- Compute = sum of weights for misclassified observations
- (2-3)
- Compute
- (2-4)
- Add ensemble mode
- (2-5)
- Update increased in proportion to
- (Step 3)
- Repeat Step 2 until k = K
- (3-1)
- Estimate boosted model
In this procedure, we select value by the smaller the error, the greater the weight. This boosting algorithm expands to gradient boosting optimizing cost function and stochastic gradient boosting sampling from data points and predictor variables. XGBoost is most popular algorithm and software among diverse boosting approaches. The ensemble model combines models and provides better performance than an individual model. In this paper, we propose an ensemble, learning to select important keywords representing the technology of target keyword. In our ensemble learning, we combine the results of regression trees, random forest, and XGBoost models and determine the significant keywords to target. Ensemble model is a linear combination of models as follows [9].
where is weight of ith model. In this paper, we consider ensemble learning as a committee model. Therefore, we select the important keywords by voting based on weights. This is a majority voting. Figure 2 shows our ensemble model to choose the important keywords.
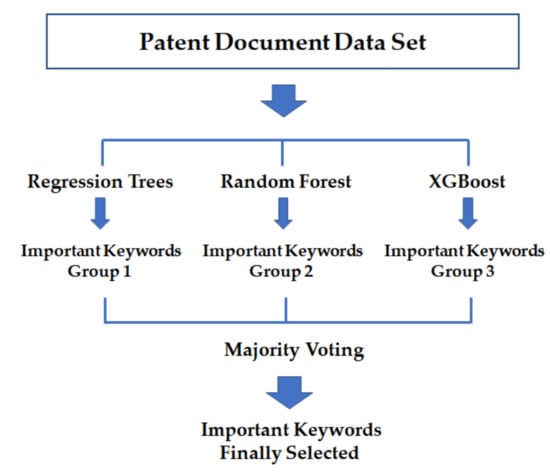
Figure 2.
Proposed ensemble model of important keyword selection.
From the patent document data set, we extract important keywords by feature selection models. Group 1, 2, and 3 contain the extracted keywords with importance given to target by regression trees, random forest, and XGBoost, respectively. In order to finally select important keywords, we perform ensemble learning by majority voting in Group 1, 2, and 3. Next, Figure 3 shows the overall procedure for the methodology we propose in this paper.
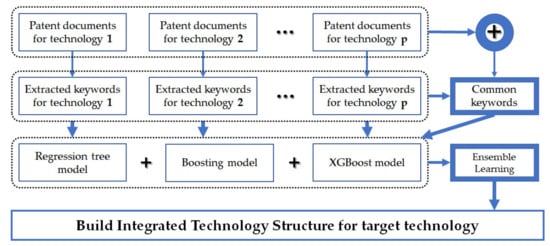
Figure 3.
Proposed technology integration and analysis process.
We collect related patent documents for each of the p technologies. The keywords representing the technology are extracted from patent documents for each technology. For example, we search patent documents related to technology k from patent databases around the world, and extract patent keywords representing technology k from the searched patent documents in Figure 3. In the next section, we carry out a case study to illustrate how our methodology can be applied to practical problems. In model training, we always have to consider the overfitting problem. This is because overfitting decreases the accuracy of the prediction or increases the fluctuation of the prediction result. To avoid overfitting in our model, we carry out regularization. This adds a penalty based on model complexity to cost function to overcome the overfitting problem. In addition, we determine the size of tree model by relative error of dividing the value of residual sum of squares (RSS) according to the number of divisions by the undivided RSS value [19].
4. Case Study Using Disaster AI and Extended Reality Technologies
In this case study, we used the patent documents related to disaster AI and XR technologies to show how the proposed methodology can be applied to practical fields. We retrieved the patent documents related to disaster AI and XR technologies from the patent databases of WIPSON, USPTO, and KIPRIS [20,21,22]. Disaster AI is an AI with functions that protect human life and property from disaster and minimize damage in case of a disaster [6]. Park and Jun (2020) studied patent keyword analysis of disaster AI and used Bayesian network modeling and factor analysis for technology analysis of disaster AI. In addition, the authors selected 162 technology keywords from the patent documents related to disaster AI, and extracted 10 factors among 162 keywords [6]. Therefore, the authors found the technological structure of disaster AI in 10 sub technologies (factors) by Bayesian network modeling [6]. We used the list of 162 keywords representing disaster AI. Another technological field used in this case study is XR technology. XR technology is defined as an expanded virtual reality technology that provides an experience very similar to the actual experience by utilizing human cognitive ability and sensory organs based on information and communication technology [23,24,25,26]. Jun (2020) proposed a method of sparse patent data analysis using a robust general linear model. The author used patent documents related to XR technology for verifying the performance of the proposed method [27]. We selected 59 technology keywords representing XR technology using the results [27]. Table 1 shows the technology keywords representing disaster AI, XR, and (disaster AI ∩ XR).

Table 1.
Technology keywords of disaster AI, XR, and (disaster AI ∩ XR).
We have collected patent documents related to disaster AI and XR technologies that have been applied and issued from 2000 to 2019. The final valid patents were 15,306 disaster AI and 2783 XR patents. The total number of integrated patent documents related to disaster AI and XR is 18,089. Additionally, the number of keywords representing the technologies of disaster AI, XR, and (disaster AI and XR) is 193. Using the extracted keywords, we carry out patent keyword analysis by regression trees, random forest, and XGBoost models. Figure 4 illustrates the step-by-step procedure for the case study in this paper.
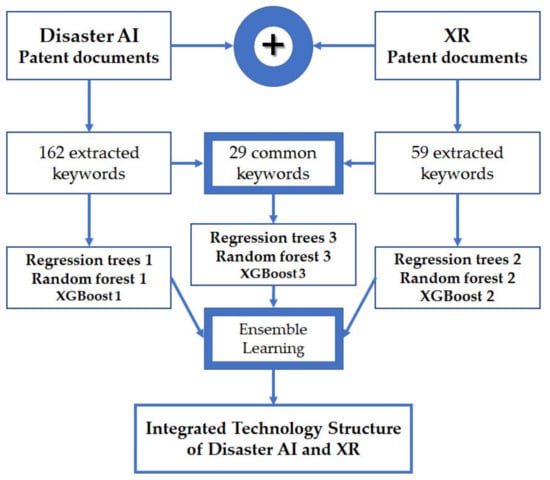
Figure 4.
Technology integration and analysis of disaster AI and XR.
In Figure 4, we illustrate the ensemble learning that combines the results of regression trees, random forest, and XGBoost models according to three keyword groups, disaster AI, XR, and integrated technologies of disaster AI and XR. In ensemble learning, we use the voting method to finally select important keywords that affect the target keyword. Additionally, we use the R data language and R packages for patent keyword data in this paper [28,29,30,31,32]. We selected disaster, artificial, intelligence, extend, and reality as target keywords. This is because these keywords constitute the title of the target technology considered in this paper. Therefore, among all keywords, all keywords except these five keywords play the role of explanatory variables in each analysis model. First, we performed the regression tree model for important variable selection. Decision tree models have two types, classification and regression trees. A classification tree needs a categorical (or binary) data type for the response variable. However, a regression tree needs numeric (continuous or discrete) data types for the response variable [18]. Therefore, in our regression tree model, the five response variables are formatted to a numeric type that can have a value from 0 to infinity. Compared to a classification tree that builds a model using measures such as Chi-square test statistic, Gini index, and Entropy for a node, a regression tree builds a model using an F-test statistic based on the amount of variance reduction of a node [18]. Figure 5 shows the result of regression trees for target keyword disaster.
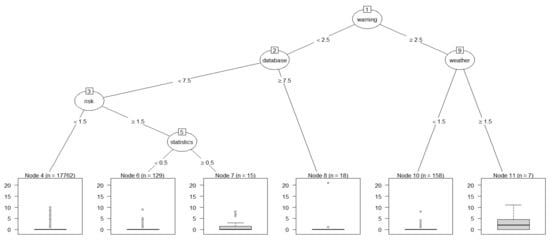
Figure 5.
Regression tree plot of disaster.
In Figure 5, the circle-shaped nodes represent the variables explaining target variable, and the square-shaped nodes are terminal nodes. Additionally, the plot of each terminal node is boxplot. Boxplot is a plot to visualize data distribution using a box and whisker [18]. A box consists of the 25th, 50th, and 75th percentiles. Additionally, the whisker illustrates data points out of the box. The following regression tree plots of other target keywords (artificial, intelligence, extend, reality) also have the same structure as in Figure 5. We found the keyword warming is the most important keyword for target keyword disaster because this was first used in the tree model. The keywords database and weather are the next most important variables. Next is the order of the keywords risk and statistics. Therefore, it can be seen that among the total 193 technology keywords, five keywords that have a meaningful effect on the target technology disaster were warming, database, weather, risk, and statistics. Figure 6 illustrates the regression tree plot of keyword artificial.
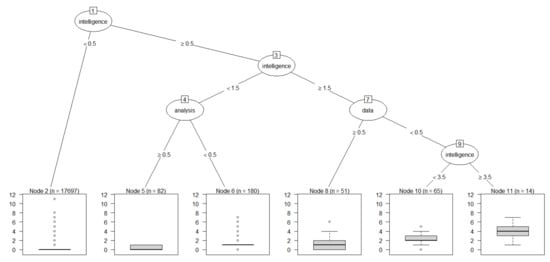
Figure 6.
Regression tree plot of artificial.
The most important keyword for artificial was intelligence; we also found the keywords analysis and data were importantly linked to artificial. This result shows the importance of data analysis in the field of AI. Figure 7 represents the plot of regression tree result of target keyword intelligence.
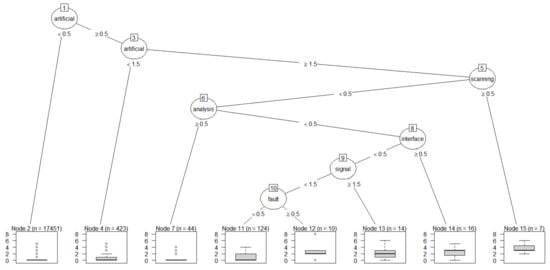
Figure 7.
Regression tree plot of intelligence.
Like the result of keyword artificial in Figure 6, the keyword intelligence was found to be most affected by keyword artificial. However, we can see that intelligence is linked to more keywords than artificial. The keywords of scanning, analysis, interface, signal, and fault were significantly related to intelligence. This means that in disaster AI, the interface for collecting disaster-related information, the collection method, and the process of analyzing the collected information are treated as important. Next, we applied the regression tree model to XR technology. Figure 8 provides the regression tree plot of keyword extend.
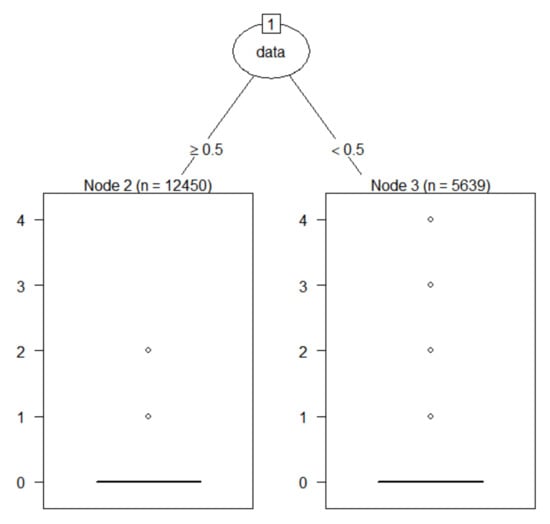
Figure 8.
Regression tree plot of extend.
In a regression tree model, the keyword data was only important keyword for target keyword extend. The keyword data was also an important keyword in disaster AI. Therefore, we can see that the keyword data is the keyword linking extend and disaster AI. Lastly, Figure 9 shows the regression tree plot of target keyword reality.
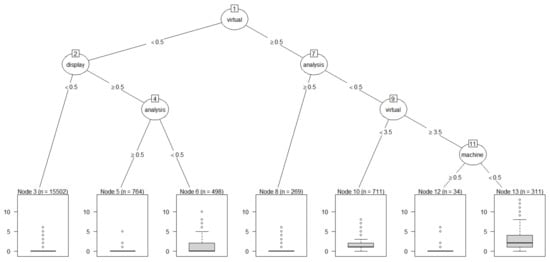
Figure 9.
Regression tree plot of reality.
We knew that the keyword reality is influenced by several keywords compared to the result of keyword extend. The virtual is most important keyword for reality. In addition, the keywords of display, analysis, and machine are also important keywords for target reality. Like the keyword data in target extend, the keyword analysis is the common keyword connecting reality and disaster AI. Up to now, we have extracted important keywords that affect each target keyword using the regression tree model. Table 2 represents the important explanatory keywords and model performances for targets disaster, artificial, intelligence, extend, and reality.
Table 2.
Important keywords and model performances for targets.
In Table 2, mean CP is the mean value of the complexity parameter (CP) that provides information of optimal pruning. Additionally, mean RE represents the mean value of relative error (RE) computed by cross validation [30]. All mean CP values of target keywords are close to zero. In addition, all mean RE values are less than one. Therefore, we can confirm that the validity of performance of all tree models. We also found that the keywords, data and database are common keywords of disaster AI and XR technologies; therefore, the data technology is important in integrated technological field of disaster AI and XR. Like the keywords of data and database, statistics and analysis are also important common keywords connecting disaster AI and XR. Using the result of Table 2, we build an integrated technology diagram for disaster AI and XR in Figure 10.
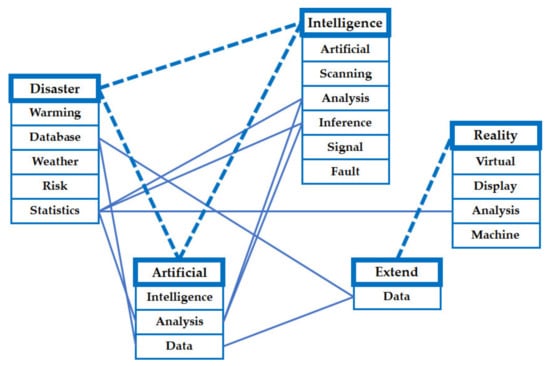
Figure 10.
Integrated technology diagram for disaster AI and XR.
The lines represent the relations between keywords, and the solid and dashed lines show the relations between technologies. The disaster AI technology consists of three keywords of disaster, artificial, and intelligence. Additionally, the XR technology is composed of two keywords of extend and reality. Therefore, we can find that the statistics technology is basic of the integrated technology of disaster AI and XR. Next, we carry out another model called random forest to select important keywords for understanding integrated technology of disaster AI and XR. Table 3 shows the keyword importance results by random forest for target keywords.
Table 3.
Variable importance ranking of explanatory keyword for targets.
Top 10 keywords according to the importance of the keyword are shown in Table 3. The keywords underlined in Table 3 were selected as important in Table 2. The keyword, data (or database) is important in all target keywords disaster, artificial, intelligence, extend, and reality. In disaster AI, information and communication are basic keywords. By combining the keywords of monitoring, risk, air, signal, sensor, fire, environment, and memory, we knew the technologies related to collecting information of disaster are important in disaster AI. In XR, we found the technologies related to the device of presenting virtual contents by various structure and environment by combining the keywords of device, present, structure, layer, head, position, virtual, display, view, content, and environment. In integrated disaster AI and XR, we found the technologies related to the system of disaster data analysis are basic and important for developing the integrated technology with sustainability. XGBoost is the last model we used in this paper to extract important keywords from the integrated technology documents. Like the classification tree model, XGBoost requires a categorical or binary type as the data format of the response variable. Therefore, in our XGBoost model, if the value of the target variable is greater than or equal to 1, we set all values to 1, and if the value of the target variable is 0, we set the values to 0. Therefore, we convert the target variable to binary data type. Table 4 represents the XGBoost results of feature (important keyword) selection for target keywords.
Table 4.
XGboost results of feature selection for targets.
In XGBoost results, we can find the integrated technologies of disaster AI and XR. In target disaster, we found the representative keywords of XR, extend, present, augment, and generation. We also found the keywords of extend, augment, and reality in target artificial. In addition, the keywords of extend, augment, reality, and generation were found in target intelligence. Like the results of regression trees and random forest, the keyword statistics was found in disaster AI and XR technologies at the same time. Therefore, we conclude that statistical analysis is a necessary technology for integrated technologies of disaster AI and XR. Using our ensemble learning based on the results of regression trees, random forest, and XGBoost, we build a technological structure for integrated technologies of disaster AI and XR in Figure 11.
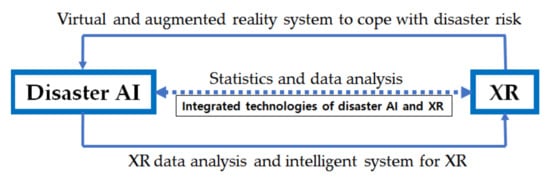
Figure 11.
Technological structure diagram of integrated technologies of disaster AI and XR.
In Figure 11, the arrows illustrate the technological influences with directions, and the solid and dashed arrow represents technologies that express interrelationships. We found that statistics and data analysis are the most fundamentally necessary technologies in the integrated technology for disaster AI and XR. In addition, we could confirm that disaster AI influences XR through the technology of XR data analysis and intelligent system, and XR affects disaster AI by the technology of virtual and augmented reality system to cope with disaster risk. Therefore, we can derive various insights or implications from the results in Figure 11. A company with data science and XR technology can increase its market competitiveness by choosing disaster AI as its new business field. In addition, companies with disaster AI technology and statistical data analysis capabilities will have strong technological potential in the XR field. To derive the technological relations between disaster AI and XR presented in Figure 11, we used the results of the regression tree, random forest, and XGBoost. In particular, we tried to increase the objectivity of the technology analysis results by considering an ensemble model that combines all three analysis results. The technological structure diagram finally constructed in this paper is based on the evidence included in the procedure, shown in Figure 12.
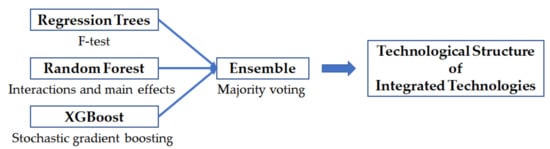
Figure 12.
Technological structure of integrated technologies of disaster AI and XR.
We used the model fitting methods of F-test, interaction and main effects, and stochastic boosting for regression trees, random forest, and XGBoost, respectively. We did not rely on the result of one analysis model, but tried to increase the validity of technology analysis by deriving the final result by majority voting on the results of three analysis models. Further implication, insights, contributions, and limitations to this paper will be covered in the next discussion section.
5. Discussion
In this section, we illustrate some implications of our research. First, the technological structure of integrated technologies from the results of integrated technology analysis can be applied to research and development (R&D) planning for management of convergence technology. Second, using the proposed method, companies can develop innovative products to increase market competitiveness. This is because innovative products and services such as smartphones and autonomous vehicles are the result of the integration of several technologies at the same time. Lastly, combining our results and statistical forecasting models, we can forecast the future technologies based on technological relations between various technologies. That is, our technological structure diagram can be applied to technology forecasting. For instance, we forecast a convergence technology of disaster AI and XR, and the future technology will be based on the technologies related to statistics and data analysis. Therefore, the diagram of technology structure in Figure 11 contributes to technology forecasting tasks of various technology domains.
In the existing research related to technology analysis, we could not find a study on the method that integrates various technologies by their related patent documents and analyze the integrated technologies. However, in the environment where various technologies are converging, research on technology integration and analysis is deemed necessary. Therefore, this paper proposes a methodology for analyzing selected important keywords after collecting and integrating patent documents for target technologies. However, in this paper, we did not propose an objective measure to evaluate the technological structure constructed by text mining, boosting, and ensemble. We can consider diverse approaches to make the measures. For example, we can evaluate the performance of integrated technology analysis by domain experts’ opinions of target technology. In addition, we can make statistical evaluation measures to verify the results of integrated technology analysis. In our future research, we will carry out these research topics.
6. Conclusions
The demand of convergence technology is constantly increasing. So, we need to integrate various technologies and analyze the integrated technology for understanding the technologies. To cope with this need, we proposed a methodology of technology integration and integrated technology analysis in this paper. To integrate various technologies, we searched patent documents according to target technologies and combined the searched patent documents. The combined patent documents of target technologies were used for integrated technology analysis. To analyze integrated technologies, we considered ensemble learning based on regression trees, random forest, and XGBoost. Using majority voting for the results of three models, we selected important keywords that influence the target technology keywords. We finally built the technological structure of integrated technologies using the ensemble model results.
Our study provided a methodology for how to integrate and analyze various technologies for convergence technology management. In this paper, we proposed a method of selecting patent keywords that best describe the target technology using the ensemble model. As the demand for convergence technology increases, the need for this study will increase. In our case study, we considered two different technologies, disaster AI and XR, for technology integration and analysis. To understand technological convergence of disaster AI and XR, we integrated the patent documents of two technologies and analyzed the integrated patent data using our proposed method. Finally, we provided the technological structure of integrated technologies of disaster AI and XR. Additionally, our proposed method can be extended to the integration and analysis of technologies in more than three technological fields. Furthermore, we will study how to add the experience and knowledge of technology experts to integrated technology analysis using machine learning algorithms and Bayesian inference.
Funding
This research received no external funding.
Institutional Review Board Statement
Not applicable.
Informed Consent Statement
Not applicable.
Data Availability Statement
Not applicable.
Conflicts of Interest
The authors declare no conflict of interest.
References
- Roper, A.T.; Cunningham, S.W.; Porter, A.L.; Mason, T.W.; Rossini, F.A. Banks, Forecasting and Management of Technology; John Wiley & Sons: Hoboken, NJ, USA, 2011. [Google Scholar]
- Kim, J.; Jun, S.; Jang, D.; Park, S. Sustainable Technology Analysis of Artificial Intelligence Using Bayesian and Social Network Models. Sustainability 2018, 10, 115. [Google Scholar] [CrossRef]
- Lee, J.; Kang, J.; Jun, S.; Lim, H.; Jang, D.; Park, S. Ensemble Modeling for Sustainable Technology Transfer. Sustainability 2018, 10, 2278. [Google Scholar] [CrossRef]
- Park, S.; Jun, S. Statistical Technology Analysis for Competitive Sustainability of Three Dimensional Printing. Sustainability 2017, 9, 1142. [Google Scholar] [CrossRef]
- Wanga, L.; Jiang, S.; Zhang, S. Mapping technological trajectories and exploring knowledge sources: A case study of 3D printing technologies. Technol. Forecast. Soc. Chang. 2020, 161, 120251. [Google Scholar] [CrossRef]
- Park, S.; Jun, S. Patent Keyword Analysis of Disaster Artificial Intelligence Using Bayesian Network Modeling and Factor Analysis. Sustainability 2020, 12, 505. [Google Scholar] [CrossRef]
- Kim, J.; Jun, S. Integer-Valued GARCH Processes for Apple Technology Analysis. Ind. Manag. Data Syst. 2017, 117, 2381–2399. [Google Scholar] [CrossRef]
- Park, S.; Jun, S. Technology Analysis of Global Smart Light Emitting Diode (LED) Development Using Patent Data. Sustainability 2017, 9, 1363. [Google Scholar] [CrossRef]
- Murphy, K.P. Machine Learning: A Probabilistic Perspective; MIT Press: Cambridge, MA, USA, 2012. [Google Scholar]
- Theodoridis, S. Machine Learning: A Bayesian and Optimization Perspective; Elsevier: London, UK, 2015. [Google Scholar]
- Keller, J.; Gracht, H.A.V.D. The influence of information and communication technology (ICT) on future foresight processes—Results from a Delphi survey. Technol. Forecast. Soc. Chang. 2014, 85, 81–92. [Google Scholar] [CrossRef]
- Uhm, D.; Ryu, J.; Jun, S. Patent Data Analysis of Artificial Intelligence Using Bayesian Interval Estimation. Appl. Sci. 2020, 10, 570. [Google Scholar] [CrossRef]
- Kim, J.; Yoon, J.; Hwang, S.; Jun, S. Patent Keyword Analysis Using Time Series and Copula Models. Appl. Sci. 2019, 9, 4071. [Google Scholar] [CrossRef]
- Efron, B.; Hastie, T. Computer Age Statistical Inference; Cambridge University Press: New York, NY, USA, 2017. [Google Scholar]
- Chen, T.; Guestrin, C. Xgboost: A Scalable Tree Boosting System. In Proceedings of the 22nd ACM SIGKDD International Conference on Knowledge Discovery and Data Mining, San Francisco, CA, USA, 13–17 August 2016; pp. 785–794. [Google Scholar]
- Chen, C.; Zhang, Q.; Yu, B.; Yu, Z.; Lawrence, P.J.; Ma, Q.; Zhange, Y. Improving protein-protein interactions prediction accuracy using XGBoost feature selection and stacked ensemble classifier. Comput. Biol. Med. 2020, 123, 103899. [Google Scholar] [CrossRef]
- Silge, J.; Robinson, D. Text mining with R.; O’Reilly: Sebastopol, CA, USA, 2017. [Google Scholar]
- Han, J.; Kamber, M.; Pei, J. Data Mining: Concepts and Techniques, 3rd ed.; Morgan Kaufmann: Waltham, MA, USA, 2012. [Google Scholar]
- Bruce, P.; Bruce, A.; Gedeck, P. Practical Statistics for Data Scientists; O’Reilly Media: Sebastopol, CA, USA, 2020. [Google Scholar]
- WIPSON. WIPS Corporation. Available online: http://global.wipscorp.com/main.do (accessed on 15 December 2019).
- USPTO. The United States Patent and Trademark Office. Available online: http://www.uspto.gov (accessed on 15 December 2019).
- KIPRIS. Korea Intellectual Property Rights Information Service. Available online: http://www.kipris.or.kr (accessed on 15 June 2020).
- Jeršov, S.; Tepljakov, A. Digital Twins in Extended Reality for Control System Applications. In Proceedings of the International Conference on Telecommunications and Signal Processing, Budapest, Hungary, 6–8 July 2020; pp. 274–279. [Google Scholar]
- Tromp, J.G.; Le, D.N.; Le, C.V. Emerging Extended Reality Technologies for Industry 4.0: Experiences with Conception, Design, Implementation, Evaluation and Deployment; Wiley: Hoboken, NJ, USA, 2020. [Google Scholar]
- Köse, A.; Tepljakov, A.; Petlenkov, E. Real Time Data Communication for Intelligent Extended Reality Applications. In Proceedings of the IEEE International Conference on Computational Intelligence and Virtual Environments for Measurement Systems and Applications, Tunis, Tunisia, 22–24 June 2020; pp. 1–6. [Google Scholar]
- Palmas, F.; Klinker, G. Defining Extended Reality Training: A Long-Term Definition for All Industries. In Proceedings of the IEEE 20th International Conference on Advanced Learning Technologies, Tartu, Estonia, 6–9 July 2020; pp. 322–324. [Google Scholar]
- Jun, S. Robust Generalized Linear Model for Sparse Text Data Analysis. J. Korean Inst. Intell. Syst. 2020, 30, 391–397. [Google Scholar] [CrossRef]
- R Development Core Team. R: A Language and Environment for Statistical Computing; R Foundation for Statistical Computing: Vienna, Austria. Available online: http://www.R-project.org (accessed on 15 July 2019).
- Feinerer, I.; Hornik, K. Package ‘tm’ Ver. 0.7-5, Text Mining Package, CRAN of R Project. Available online: https://cran.r-project.org/web/packages/tm/tm.pdf (accessed on 15 January 2020).
- Therneau, T.; Atkinson, B.; Ripley, B. Package ‘rpart’ Ver. 4.1-15, Recursive Partitioning and Regression Trees, CRAN of R Project. Available online: https://cran.r-project.org/web/packages/rpart/rpart.pdf (accessed on 1 January 2020).
- Breiman, L.; Cutler, A.; Liaw, A.; Wiener, M. Package ‘randomForest’ Ver. 4.6-14, Breiman and Cutler’s Random Forests for Classification and Regression, CRAN of R Project. Available online: https://cran.r-project.org/web/packages/randomForest/randomForest.pdf (accessed on 1 January 2020).
- Chen, T.; He, T.; Benesty, M.; Khotilovich, V.; Tang, Y.; Cho, H.; Chen, K.; Mitchell, R.; Cano, I.; Zhou, T.; et al. Package ‘xgboost’ Ver. 1.2.0.1, Extreme Gradient Boosting, CRAN of R Project. Available online: https://cran.r-project.org/web/packages/xgboost/xgboost.pdf (accessed on 1 January 2020).
Publisher’s Note: MDPI stays neutral with regard to jurisdictional claims in published maps and institutional affiliations. |
© 2021 by the author. Licensee MDPI, Basel, Switzerland. This article is an open access article distributed under the terms and conditions of the Creative Commons Attribution (CC BY) license (http://creativecommons.org/licenses/by/4.0/).