1. Introduction
Water’s role in health and wellness is becoming more and more emphasized nowadays, as the number of people who prefer to buy bottled water keeps increasing. This has led to a strong demand for bottled water. Sometimes, bottled water is associated with a healthy lifestyle and is presented as a convenient, safe, and healthy hydration beverage [
1]. Some people have tried organic beverages due to their supposed health benefits compared to other commercially produced foods. As a result, manufacturers are focusing on special and limited-edition releases, brand redesigns, packaging innovation, and new organic products where secret recipes with special ingredients are created. Interesting organic drink products have been introduced and researched [
2,
3,
4,
5,
6]. Moreover, people are interested in organic beverage businesses and the concept of the Do-It-Yourself (DIY) filling machine has become quite popular for saving production costs.
The coronavirus 2019 (COVID-19) pandemic likely began in late January or early February 2020. Hundreds of millions of people around the world have lived through lockdowns. Many have made the sudden shift to working from home (WFH), and millions have lost jobs. Yet people have lost more than just their regular salary; losing employment has also caused people to suffer from a sudden loss of self-confidence and a diminished sense of identity and purpose. Moreover, those with a low self-esteem often have a more negative view of life since their social status and routine activities can quickly disappear. In order to solve these problems, people have tried to start earning more money by running their own business via a “work-at-home” platform. However, since the future looks uncertain, a small-scale business is recommended.
Micro, small, and medium enterprises (SMEs) compose one of the largest groups of economic activity conducted by most people in Southeast Asia, especially Thailand. Recently, according to the Asian Development Bank (ADB) data from 2016, the contribution of SMEs to the total gross domestic product (GDP) in Thailand is 37%, of which 20% of those SMEs in Thailand focus on home businesses (e.g., drinking water/beverage, bakery, foods, or organic fruits and vegetables) [
7]. The significant consumption by Thai people has offered a major opportunity for Thailand to develop its home industry with affordable capital, limited capacity, and unique and attractive products. This condition, therefore, has forced the homemade industry to fight to meet the increasing demand with limited resources and capital. However, adding manpower would be an unexpected choice due to the high labor cost nowadays. An automatic machine could be an appropriate solution with certain specifications that fit the SME requirements—for example, capital cost, production capacity, and efficiency.
For new manufacturers, the future depends on how well they do in the analysis of purchasing decisions, customer behaviors, and product characteristics. Creating a new design to challenge the existing ones is quite difficult since the methods applied for analyzing the specific requirements and characteristics of the customers have changed dramatically due to the influences of perceptions and experiences [
8,
9].
This research presents an alternative direction for SMEs to quickly launch beverage products via the new innovation of the automatic filling machine. The proposed design of this new innovation automatic filling machine consists of three main components: translated data from the voice of the customer, drafted design of the machine, and creation of a virtual model and a prototype of the machine. Each of those components requires some technical concepts for quickly accomplishing the desired goal.
In order to induce customers to believe in the novelty and value of a product that is similar to a known one, methods such as the quality function deployment (QFD) and house of quality (HoQ) should be considered and applied. To satisfy customer requirements and quickly launch the machine design in a competitive market, QFD analyzes customer expectations to match the engineering points of view [
10]. Moreover, this method is essential, especially in terms of product design and innovation. The concept of QFD is very effective at giving the appropriate engineering elements at each stage of engineering design, production process, and development and prototype evaluation [
11,
12,
13,
14,
15,
16,
17,
18,
19].
In this research, before drafting the design of the product, self-administered questionnaires related to customers’ behaviors and perceptions of drinking water/beverages were created and distributed to the target group, i.e., people or SMEs who live in or around metropolitan areas and are of various genders and ages, since the selling volume of beverage is higher than in other uptown areas. After obtaining the drafted design of the filling machine, a virtual model and a prototype of the new product were created.
2. Literature Review
Recently, many researchers have discussed applications of the QFD method to translate the voice of the customer into product design criteria by making customer expectations a mathematical correlation. In practice, the building of a house of quality (HoQ) is considered an essential first step in creating a new design [
20]. Those correlations are used as the input parameters for the product design optimization by using mathematical programming. For accelerating successful implementation, a combination of benchmarking and the QFD method was suggested by Gutierrez and Tulkoff in 1994 [
11], with the Austin’s Electronic Card Assembly and Test (ECAT) manufacturing process applied as the case study. Customer satisfaction was obtained when the time taken to make similar changes was reduced. Benchmarking was used in the first stage to avoid hidden dangers or difficulties, save costs, and reduce implementation time. Then, QFD was used to prioritize needs and concerns. QFD is a mechanism for ensuring that customer requirements are achieved by all functions. QFD focuses and coordinates skills within an organization. For example, starting with a marketing group, the types of product that customers want and will continue to purchase are clearly identified. Then, the results are sent to the design section to create the structure of a new product with proper materials. Finally, the manufacturing division starts to produce a prototype.
In developing a competitive strategy, manufacturers cannot limit their consideration to the quality aspect, since there are always trade-offs between quality and other constraints. An optimization method of the product design has become essential to gain the maximum satisfaction level under several resource constraints. Moreover, Wang et al. (2017) introduced a combination of the theory of inventive problem solving (TRIZ) and the QFD approach in order to design a model for self-service restaurants [
12].
For identifying the “service satisfaction level,” the process started with a “problem definition stage” in order to formulate and briefly analyze the problem. The next step was called “the service resolution stage,” wherein the parameters were analyzed based on TRIZ and QFD. Then, an evaluation method was provided whereby a new self-service restaurant with functions of interactive menus and interoperable meal ordering was proposed in the final stage. The study revealed that the proposed method can empirically enhance restaurant service satisfaction.
The benefits obtained from the TRIZ technique are as follows: (i) providing a systematic approach, (ii) solving any problem with innovation or invention, (iii) designing an effective service, and (iv) allowing a company or project team to consider many combinations that are suitable for fulfilling the requirements of a new design. For QFD, it is utilized in service innovation to generate the optimal service based on customers’ service requirements.
Recently, in terms of product development, the QFD method has been applied as a main tool for extracting customers’ perceptions on existing products to show where some functions or components could be improved. The optimal characteristics were easily matched to customer requirements using mathematical programming models [
13,
14,
15,
16,
17,
18,
19]. Moreover, to help designers determine the optimal design characteristic levels (i.e., the target design characteristic values), a prescriptive modeling approach in the QFD platform was presented. This approach would maximize overall customer satisfaction under the system and budget constraints in a systematic and efficient manner when the built-in optimization routine of a popular spreadsheet system was applied [
20]. However, previous methods mostly paid attention to engineering elements (design characteristics—DC); using this method might require more effort to identify the expected elements. Decision-maker bias was found in that personal perceptions were used to imagine the worst-case scenario and choose the attributes that would improve the situation the most. Some engineering elements might be overlooked.
Other optimization methods were proposed in terms of the QFD analysis, mostly based on integer or linear programming. The main objective was to allocate all resources to the several engineering elements of a product, aiming to maximize overall customer satisfaction and minimize dissatisfaction [
21,
22]. Lai et al. (2005) proposed a dynamic programming approach for the QFD optimization in which the resources were allocated into engineering attributes [
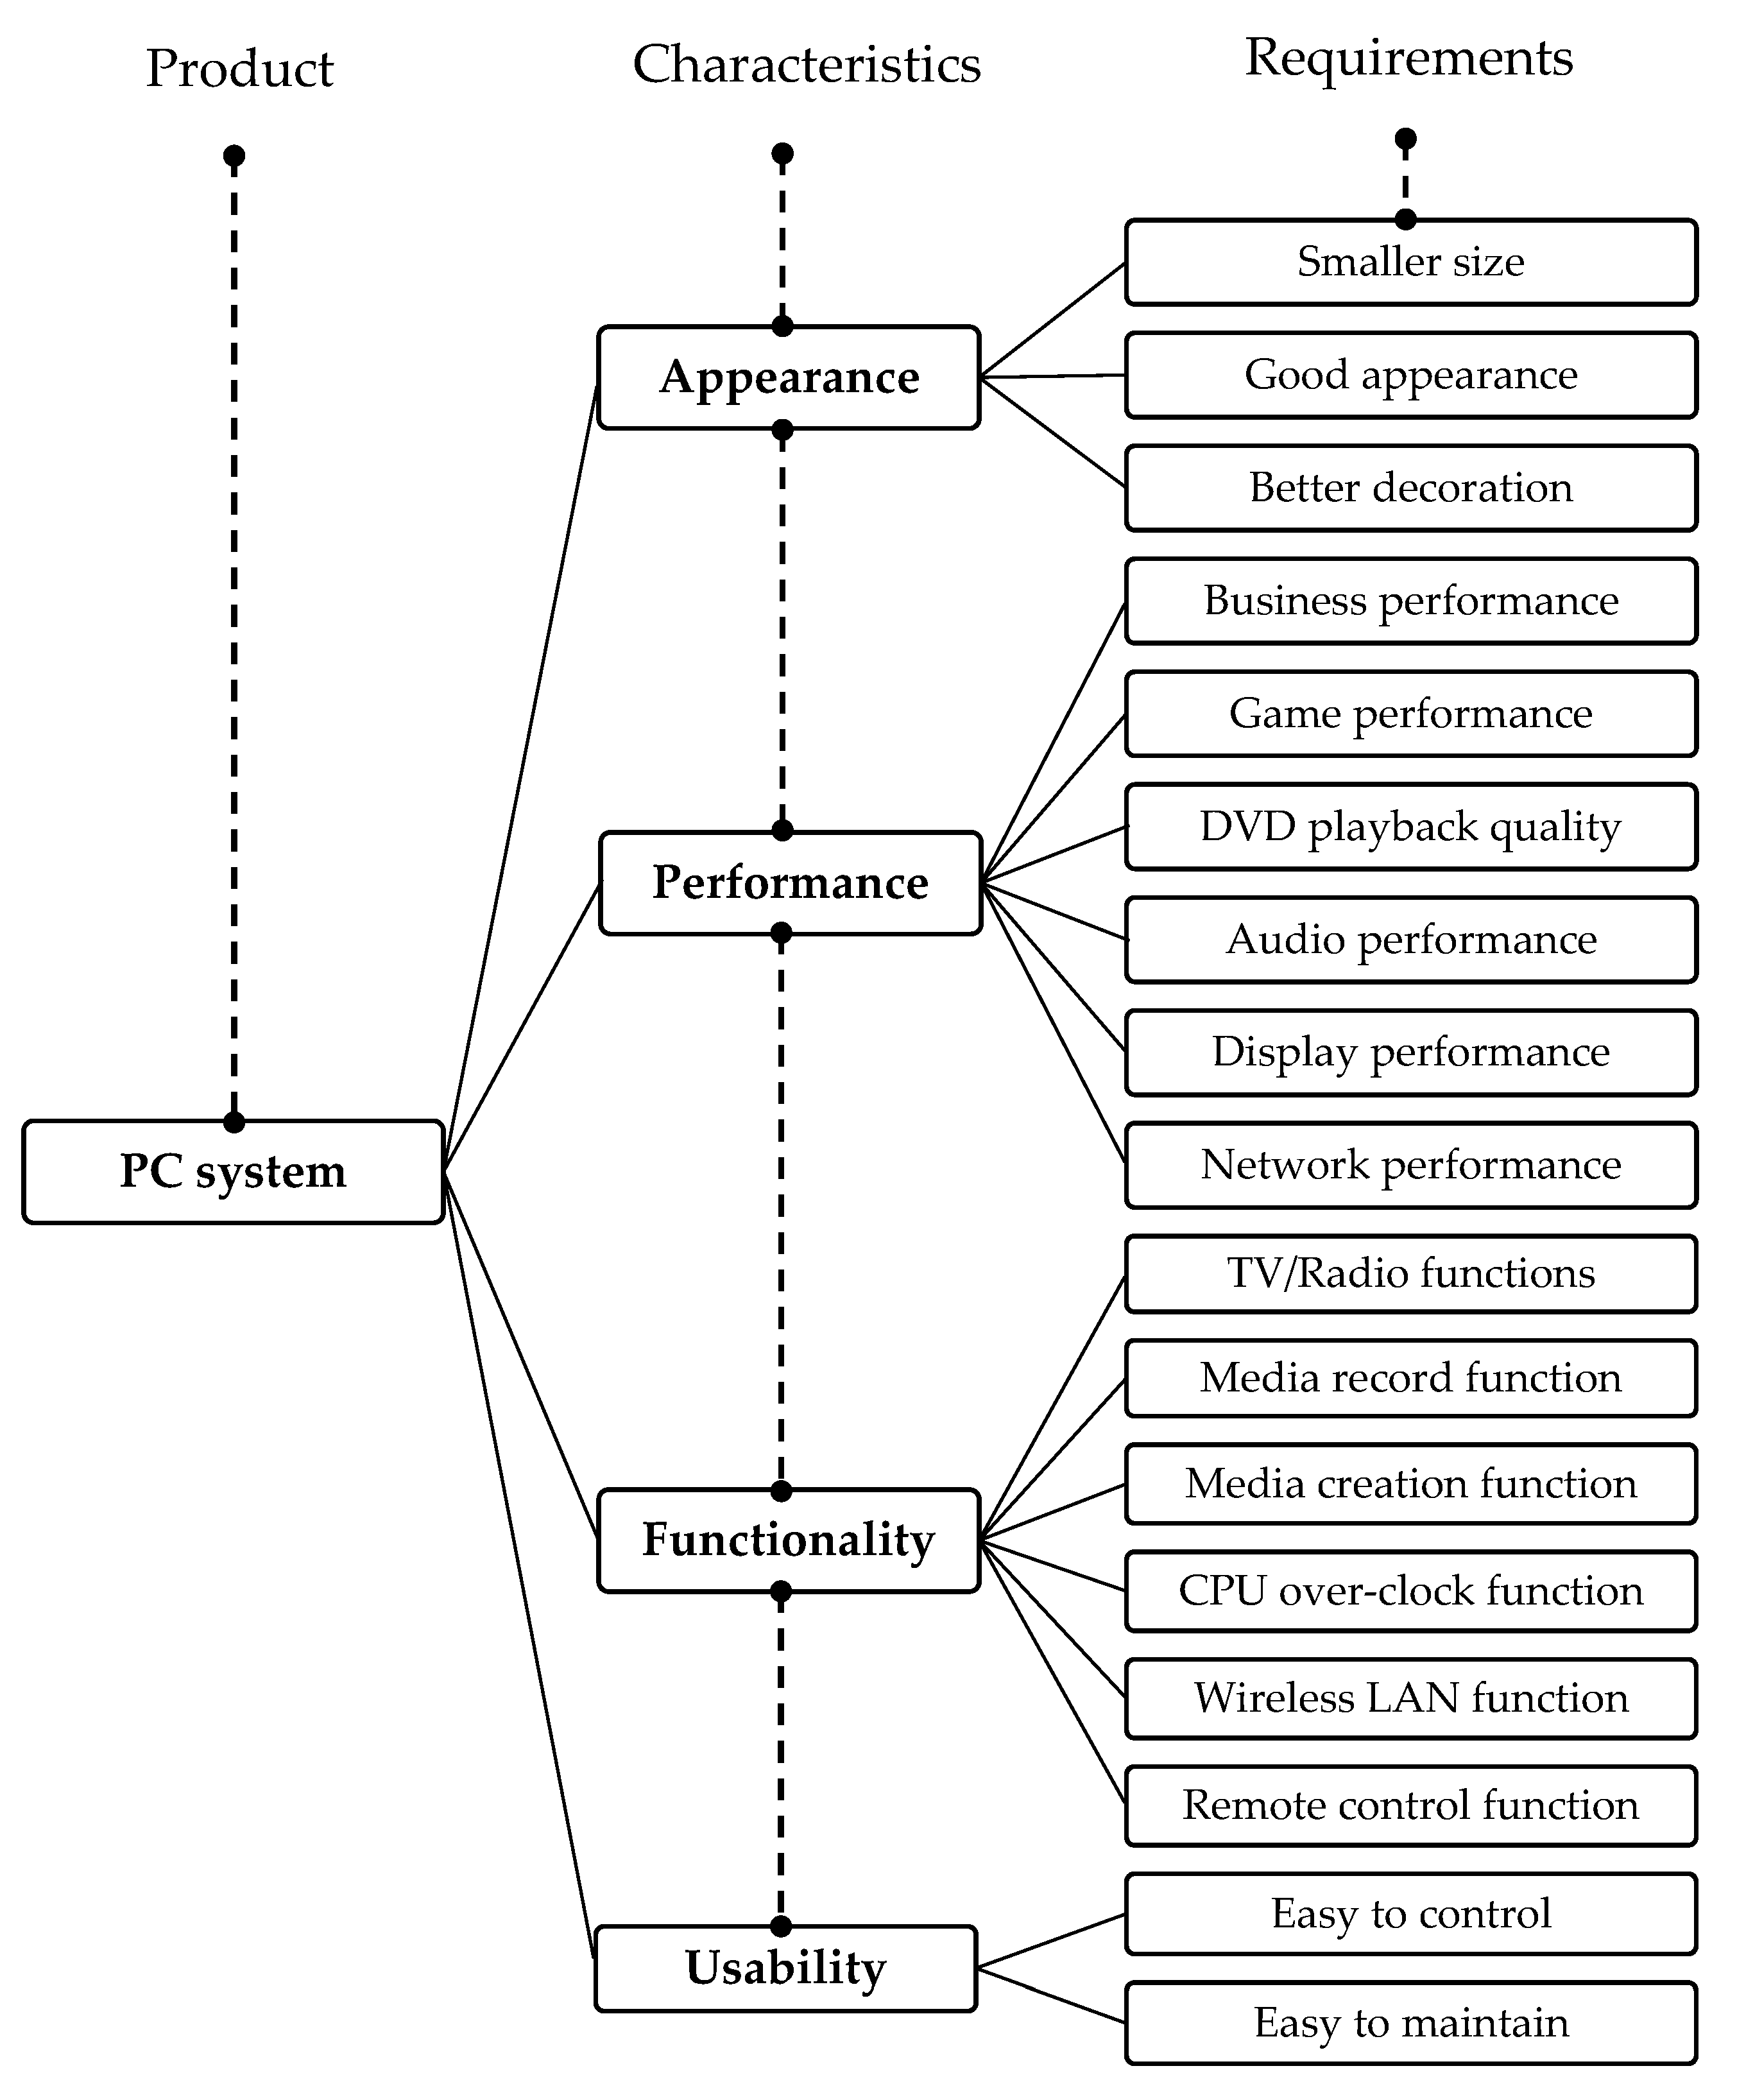
23]. This revealed that the dynamic approach required less information in comparison to other mathematical programming approaches with more relevant optimal results. An example of the specific requirements for creating a new product is shown in
Figure 1. Moreover, in order to capture the unexpected vagueness related to the product design, a fuzzy approach was introduced to QFD [
24,
25,
26].
The Kano model is another approach used to classify customer requirements and help explain the nature of those particular requirements for increasing customer satisfaction. Lai et al. introduced an approach combining the Kano model and QFD to satisfy customer requirements through optimal product design based on the goal programming approach [
27,
28]. In practice, using the goal programming model allows the designer to optimize the customer fulfillment level, which possibly fits with any particular company strategy.
Semantic differential techniques, systematic studies, and a statistical approach were presented as vital tools for evaluating the designer’s and customer’s perceptions in the conceptual design stage. We can advance research and development (R&D), innovation, and technology management by building on past and present studies in the field and providing future direction [
29,
30,
31,
32].
3. Research Background
Before beginning the design, extracting hidden issues and customers’ needs is necessary. To effectively create a new design of product, two main issues must be addressed: ways to identify customer requirements and methods used for determining their importance weights. After studying these fundamental concepts, the drafted structure of a new product can be extracted into lists of physical characteristics and functions in a mechanical platform.
3.1. Understanding Customer Requirements
Firstly, understanding customers’ behaviors, needs, and perceptions about the product of interest is the main thing that a design engineer has to consider before arranging customer requirements in groups. These groups are used to create guidelines for identifying the specific characteristics of a new product; three main methods are applied: Kano’s model analysis and questionnaire, quality function deployment, and an integrated approach to innovative product development using the Kano model and QFD.
3.1.1. Kano Model Analysis and Questionnaire
The Kano model is a method for identifying groups of customer attributes: must-be, one-dimensional, and attractive. A Kano questionnaire that consists of pairs of one positive and one negative question has to be launched to target customers to obtain a set of data that contains some drafted and rough ideas of customers’ viewpoints on existing products where “functions and physical characteristics” are key considerations and might be compared with a new product. The obtained results are then translated to customer attributes. To apply the Kano method, the following constraints are required [
33]:
Each customer attribute is assumed to fall into one of the three basic Kano categories.
Each identified customer requirement will be analyzed on the basis of the Kano model, where the researcher can classify the requirements into groups; the appropriate Kano categories are determined by using the Kano questionnaire or a forced-choice classification method.
A forced-choice scale is a rating scale that does not allow for an undecided, neutral, don’t know, or no opinion response; the questions are designed to force respondents to express an opinion.
However, sometimes customers cannot clearly express their opinions of a particular characteristic or feature of a product. Therefore, the obtained data might be classified as “indifferent” or “having no particular interest” rather than in one of the three main categories (“must-be”, “one-dimensional”, or “attractive”).
3.1.2. Quality Function Deployment
Since difficulties have been found during the process of data analysis, customer needs and satisfaction levels on a new of product design need to be extracted with simple words and definitions. Quality function deployment (QFD) can help design engineers to properly translate voice of customer (VOC) into product specifications where “a customer-oriented approach” is the key component. The evaluation of customer needs can be accomplished by analyzing the customers’ nature, behaviors, experiences, and perceptions from the answers. The obtained results inform the process and quality requirements. The benefits derived from using the QFD tool include [
34,
35]:
The important information for supporting a new design can be explored and documented in a good pattern.
The design engineer can specify the proper direction to achieve an optimal model, where a way of solving a problem by trying a number of different methods randomly can be eliminated.
Reduced production costs by eliminating redundant features and overdesign.
3.1.3. An integrated Approach to Innovative Product Development Using Kano’s Model and QFD
The Kano concept can help a design engineer classify customer requirements into appropriate categories and subcategories whereby hidden views can be properly extracted; for example, some product characteristics can indicate whether a target customer will be satisfied with a new design or not, whereas some specific product criteria can induce customers to make better decisions. Sometimes, regarding basic needs, customers’ perceptions fall into the category of must-be attributes, such that merely attractive attributes are considered “must-have” requirements (such as luxury handbags or shoes); however, this type of attribute is quite difficult to add into mass-production products because of the investment costs. To achieve the customer requirements for “must-have” items, in-depth interviews with influencers or experienced people should be taken into consideration. However, classifying the requirements into groups is subjective, so a deep analysis of customer voices should be added to obtain better results. QFD provides a means of translating customer requirements into proper technical or engineering characteristics for each stage of product development and production [
34,
36,
37].
The Kano model and QFD method can help a design engineer to quickly manage the interviewed results at the first stage (by applying Kano’s application), and can also enhance customer satisfaction and loyalty, and minimize dissatisfaction when the detailed design components of a future product can be revealed clearly in a proper format (by applying the QFD method).
3.2. The Relationship between the Customer Requirements and Technical (Engineering) Attributes
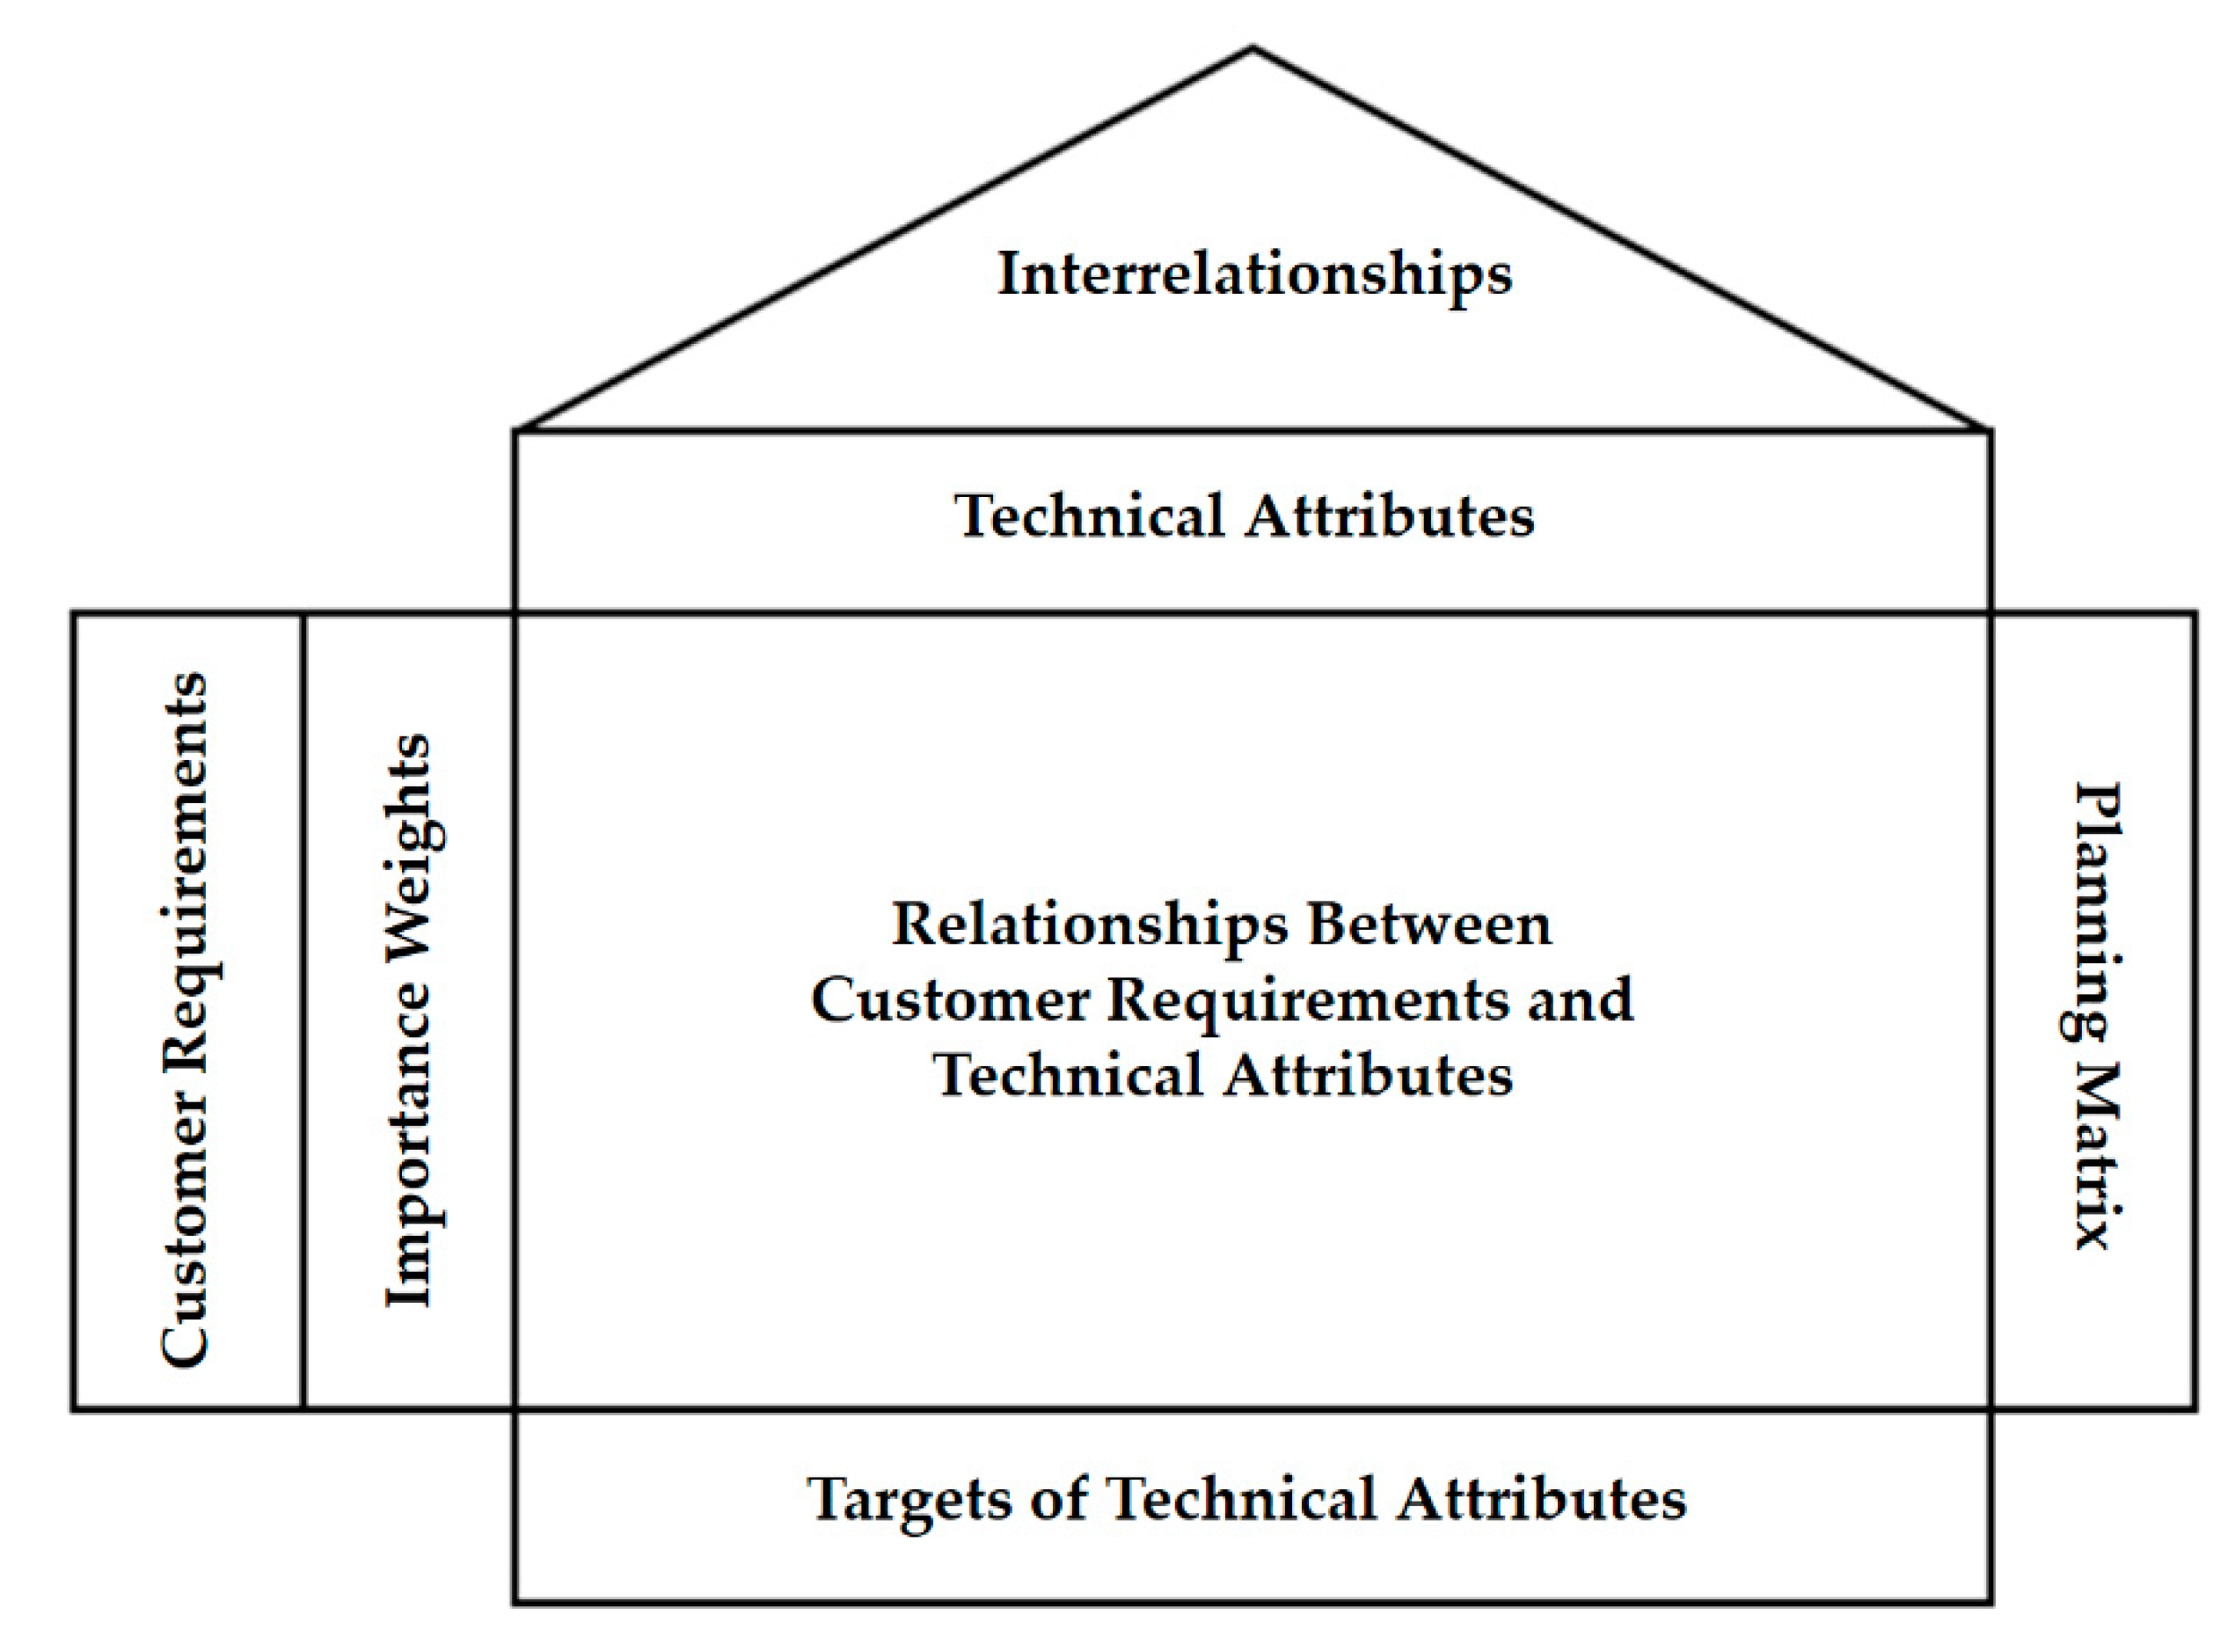
The way to find the relationship between customer requirement and engineer attribute is to apply the house of quality, as presented in
Figure 2. Completing the house of quality starts with the question: What do customers want? Their requirements are called customer needs. These are phrases that are used by customers to describe products and product characteristics.
3.3. The Relationships between Engineering Attributes
In product design, it is important to find the relationships between engineering attributes because a change in a value of one engineering attribute will affect one or more others. The relationships between the engineering attributes are found by using Wasserman’s [
14] model, as presented in the equation below:
where
| is the importance weight of engineering attribute j,
j = 1, 2,..., n |
| is the importance weight of customer requirement i,
i = 1, 2,..., m; |
| is the normalized relationship between customer requirement i and engineering attribute j. |
3.4. Optimizing Product Design Using the Kano Model and Goal Programming
The Kano model, combined with goal programming, provides an effective way to categorize customer requirements [
10]. When this model was applied in this study, the values of “
i” (customer requirements) and “
j” (engineering attributes) were set to
i = 11 and
j = 5, respectively.
The optimization model:
Constraints:
where
| is the correlation between the ith customer requirement and the jth engineering attribute, where i = 1, 2,...,11; j = 1, 2,..., 5 |
| is the weight of the ith customer requirement |
| is the deviation between the customer dissatisfaction level for each ith customer requirement ( and the coefficient of customer satisfaction level for each ith customer requirement () |
| is the coefficient of customer satisfaction level for each ith customer requirement () |
| is the coefficient of customer satisfaction level for each ith customer requirement |
| is the coefficient of customer dissatisfaction level for each ith customer requirement |
| is the deviation between the target satisfaction level value for each ith customer requirement and the extended satisfaction coefficient of the ith customer requirement |
| is the deviation between the maximum consideration value (1) and the extended satisfaction coefficient of the ith customer requirement |
| is the extended satisfaction coefficient of the ith customer requirement |
| is the target satisfaction level value for each ith customer requirement |
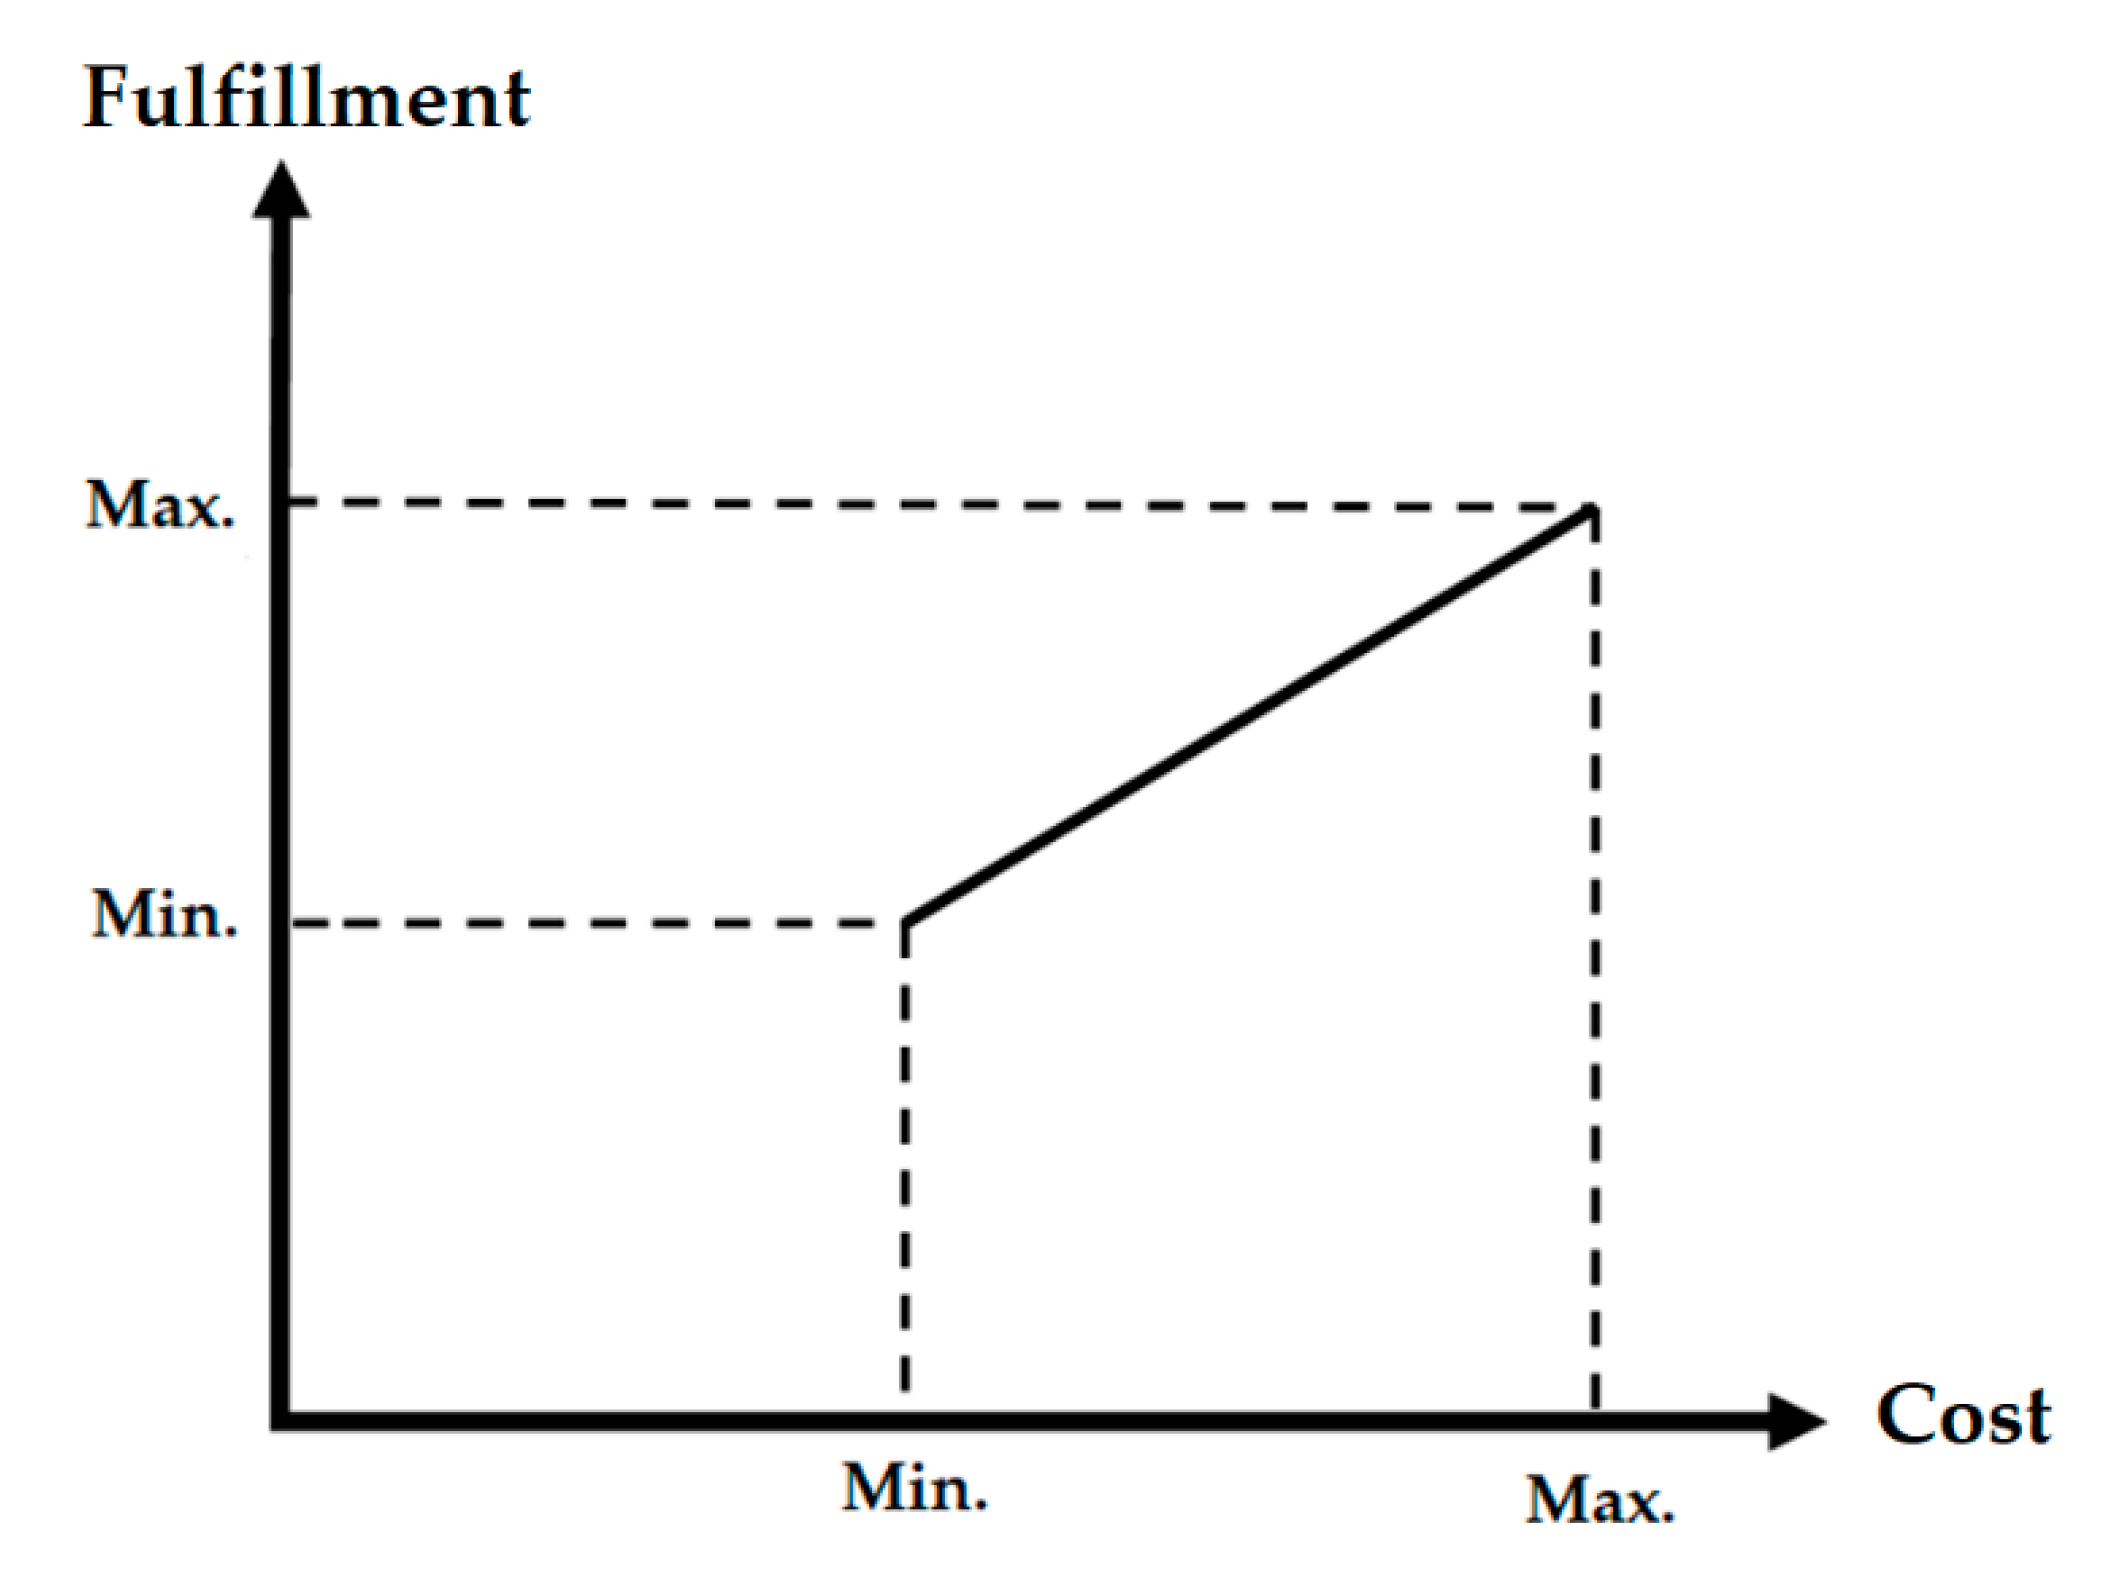
| is the fulfillment level of each engineering attribute j |
| is the minimum fulfillment level of each engineering attribute j |
| is the maximum cost of each engineering attribute j |
| is the minimum cost of each engineering attribute j |
| is the budget allocated to each engineering attribute j |
| B | is the cost limitation of the entire production cost. |
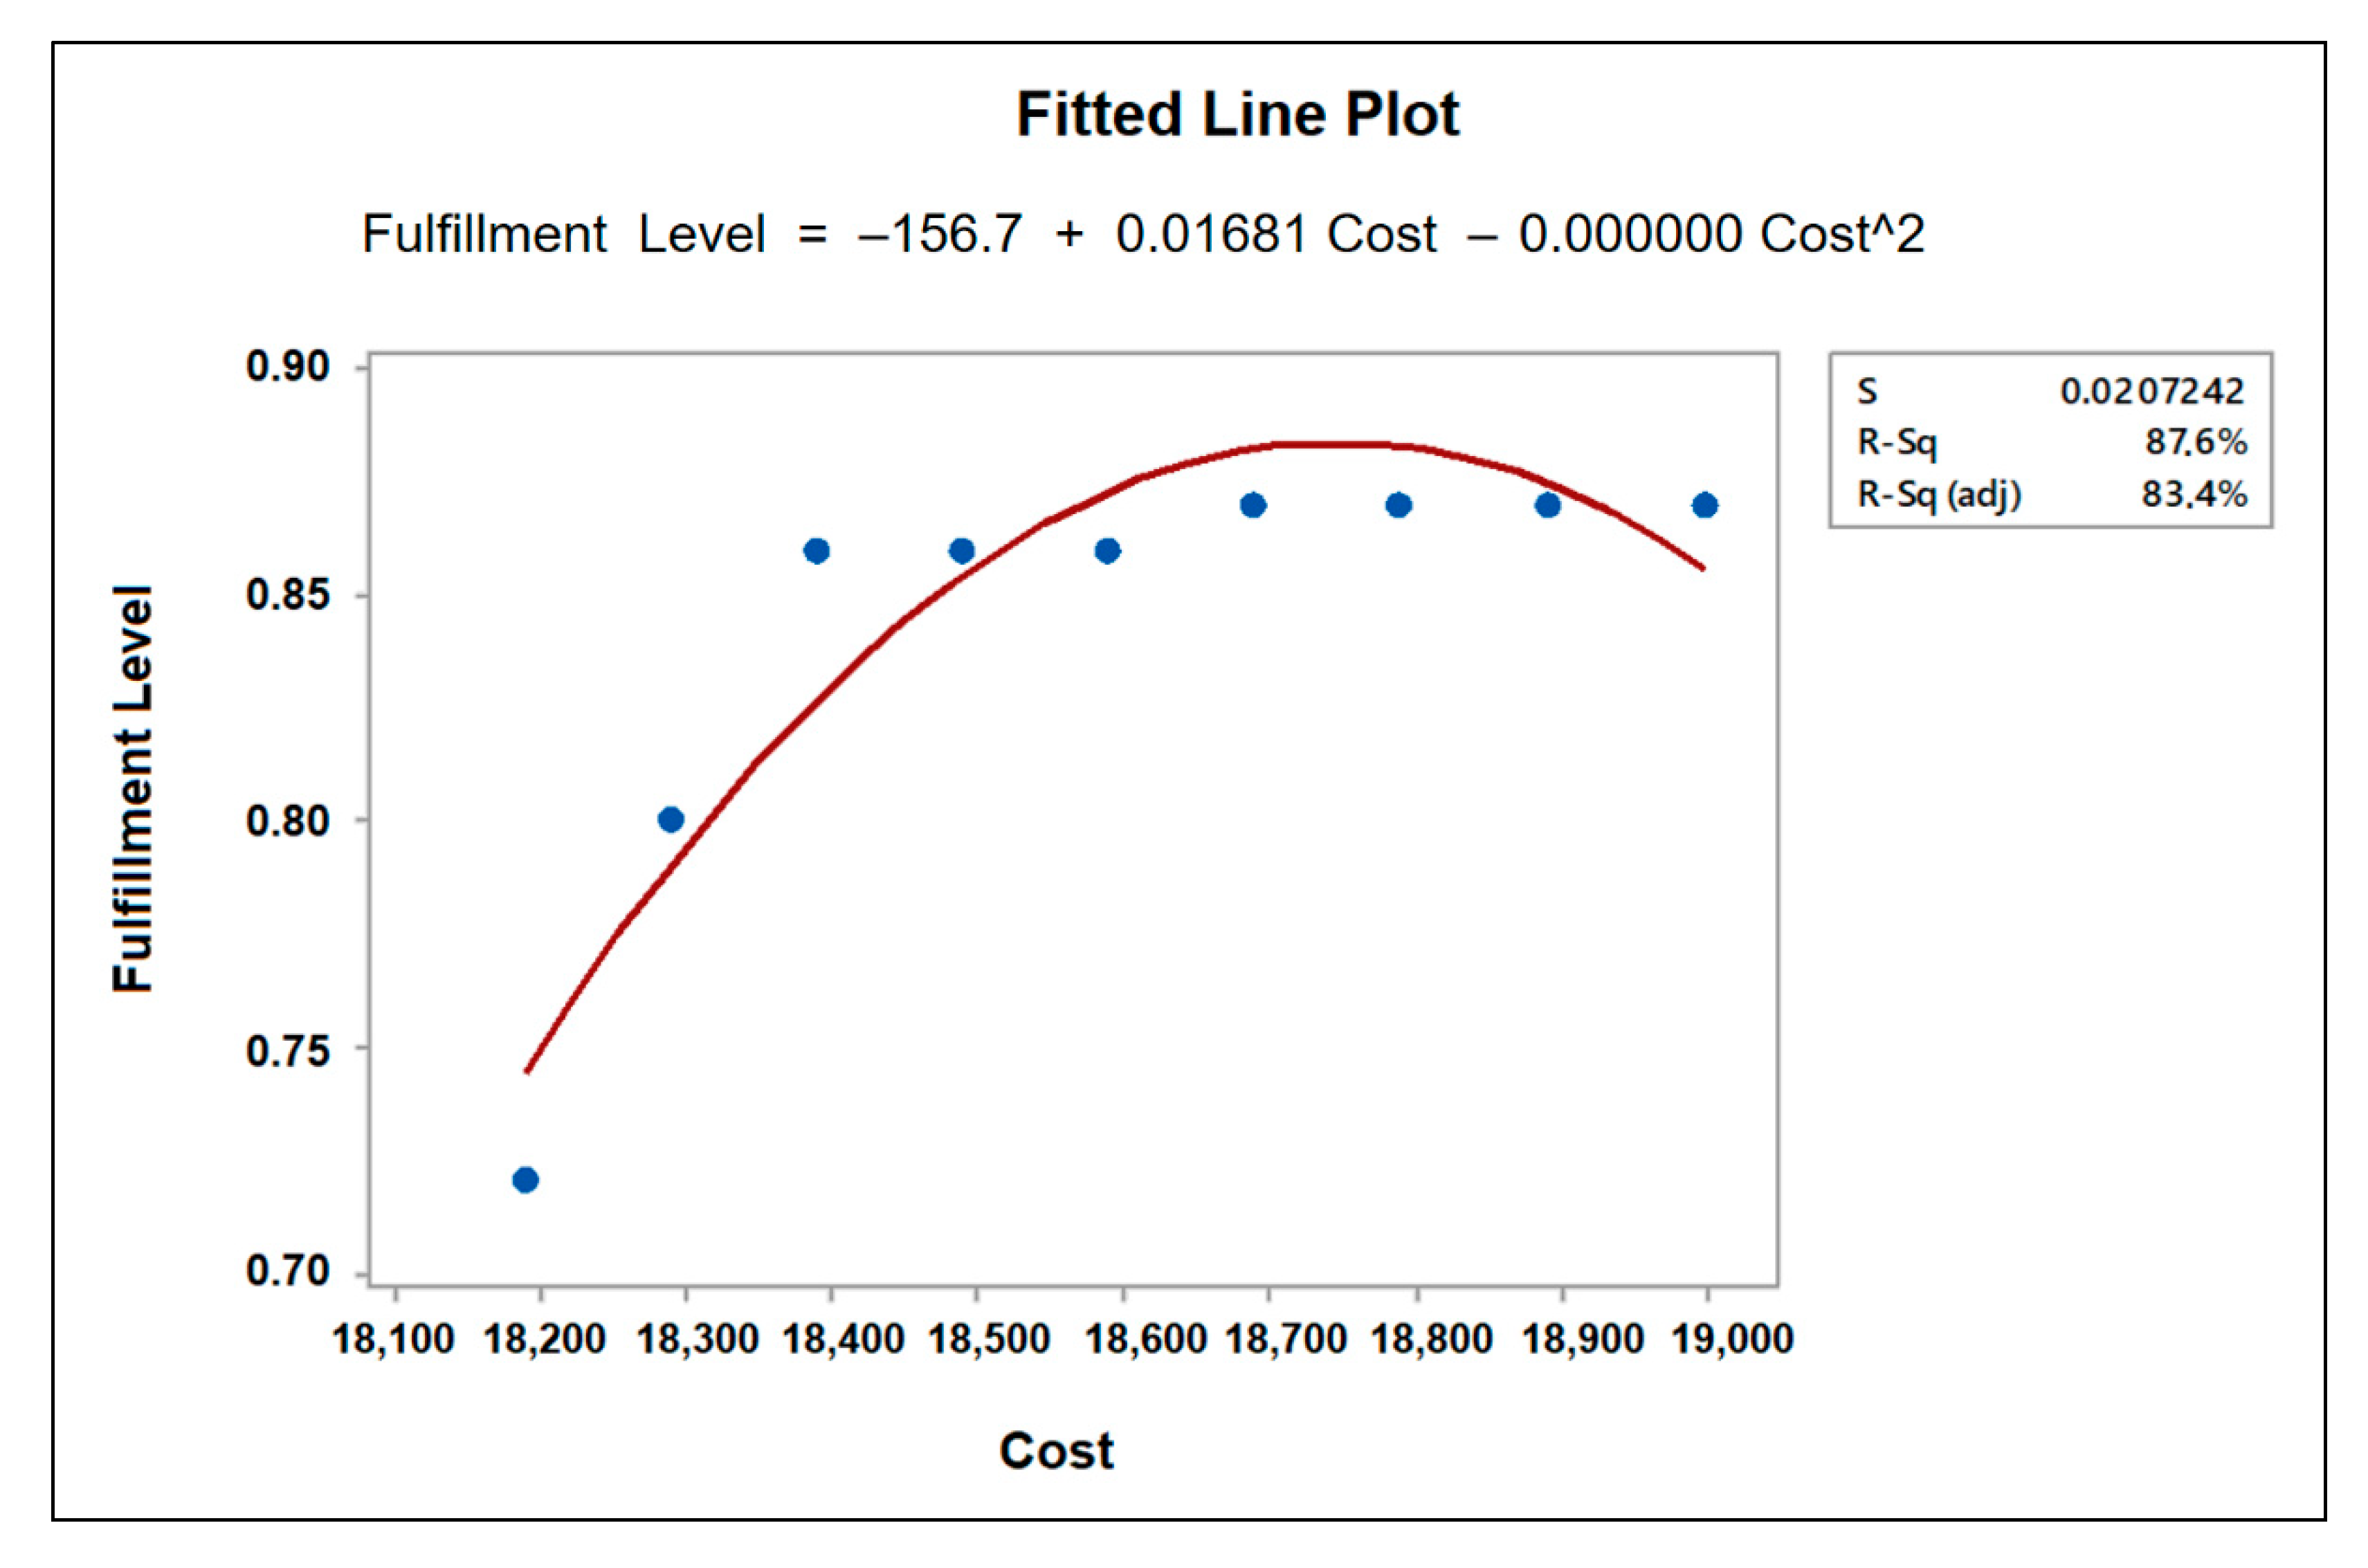
Results are presented as the cost function diagram, as shown in
Figure 3.
Proper historical data are required. The ways to consider the weight of customer requirements, the satisfaction level for each customer, and the target or benchmark values are subjective. Normally, designers list the performance of competitors (e.g., ratings) with respect to each customer requirement as a reference by using their own judgment. The best rating can be used as the limit for the ideal, and the worst rating can be used as the limit for the unsupportable. Moreover, for using reference data to scale or rate the important factors, designers’ experiences are applied to construct the ranges of values. This information is considered during the calculations and analysis. The statements of customer preferences are commonly applied to assess the importance of customer requirements [
38,
39].
However, it is difficult to prove the optimality of the obtained results in a practical way since the success of a company or manufacturer when creating a new design of product depends on many factors such as the selling price, influencers, brand designers, discount promotions, and brand identity.
4. Analysis of Results from Multiple Research Methods
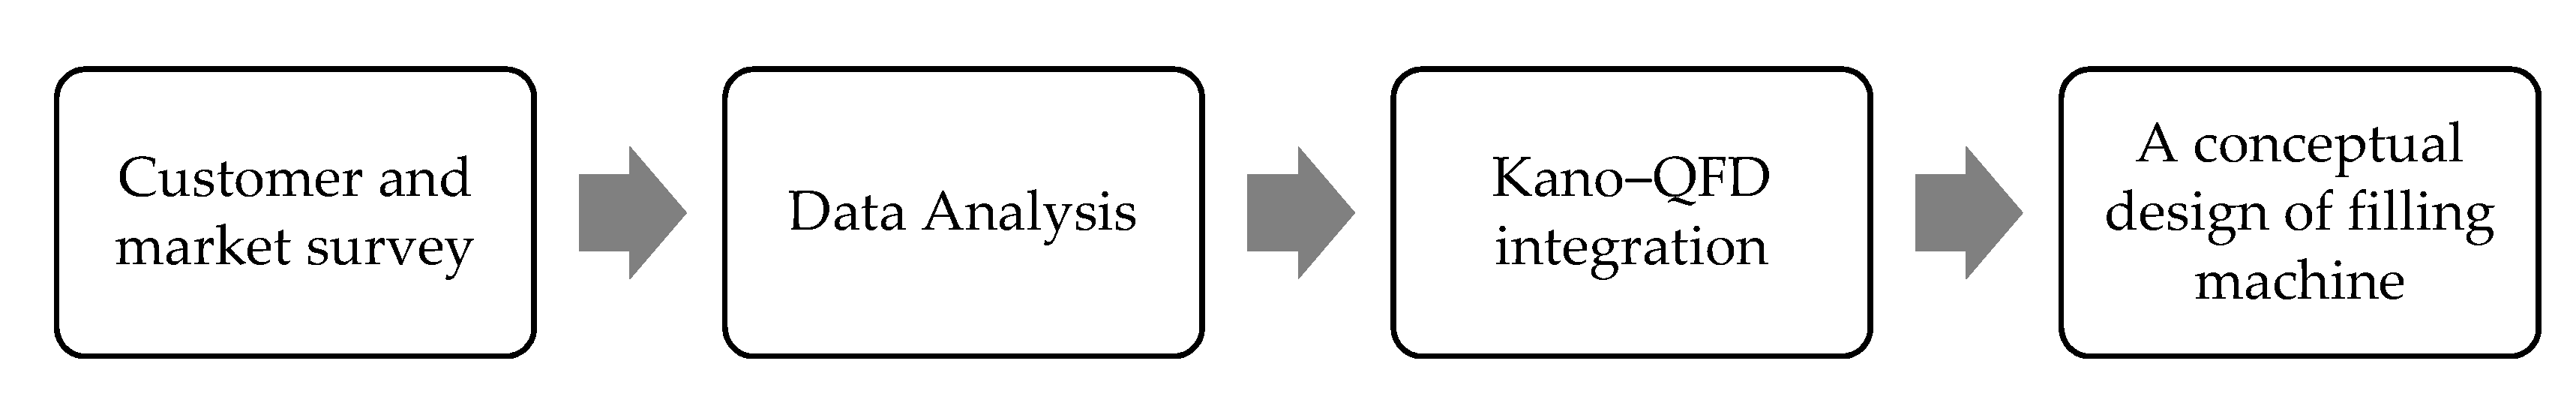
To optimize the design of the automatic filling machine proposed in this study, there are three requirements, as illustrated in
Figure 4. First, we reviewed related works using digital sources such as websites, published articles, and previous market surveys. Secondly, we constructed a tree diagram to classify customer requirements into several groups and translate them into product characteristics with definitions. The relationship between customer attributes and engineering viewpoints is discussed. Third, we applied a “Kano–QFD integration model” to create the appropriate direction of the developed filling machine. Finally, we created a conceptual design of a filling machine.
4.1. Customer and Market Surveys
4.1.1. Market Survey
Currently, automatic water filling machines can be classified into two types. The first type is “small-scale automatic water filling machines” for schools, offices, or canteens. The second type is “large-scale automatic water filling machines” for use in industry. The details of each are presented in
Table 1.
4.1.2. Customer Survey
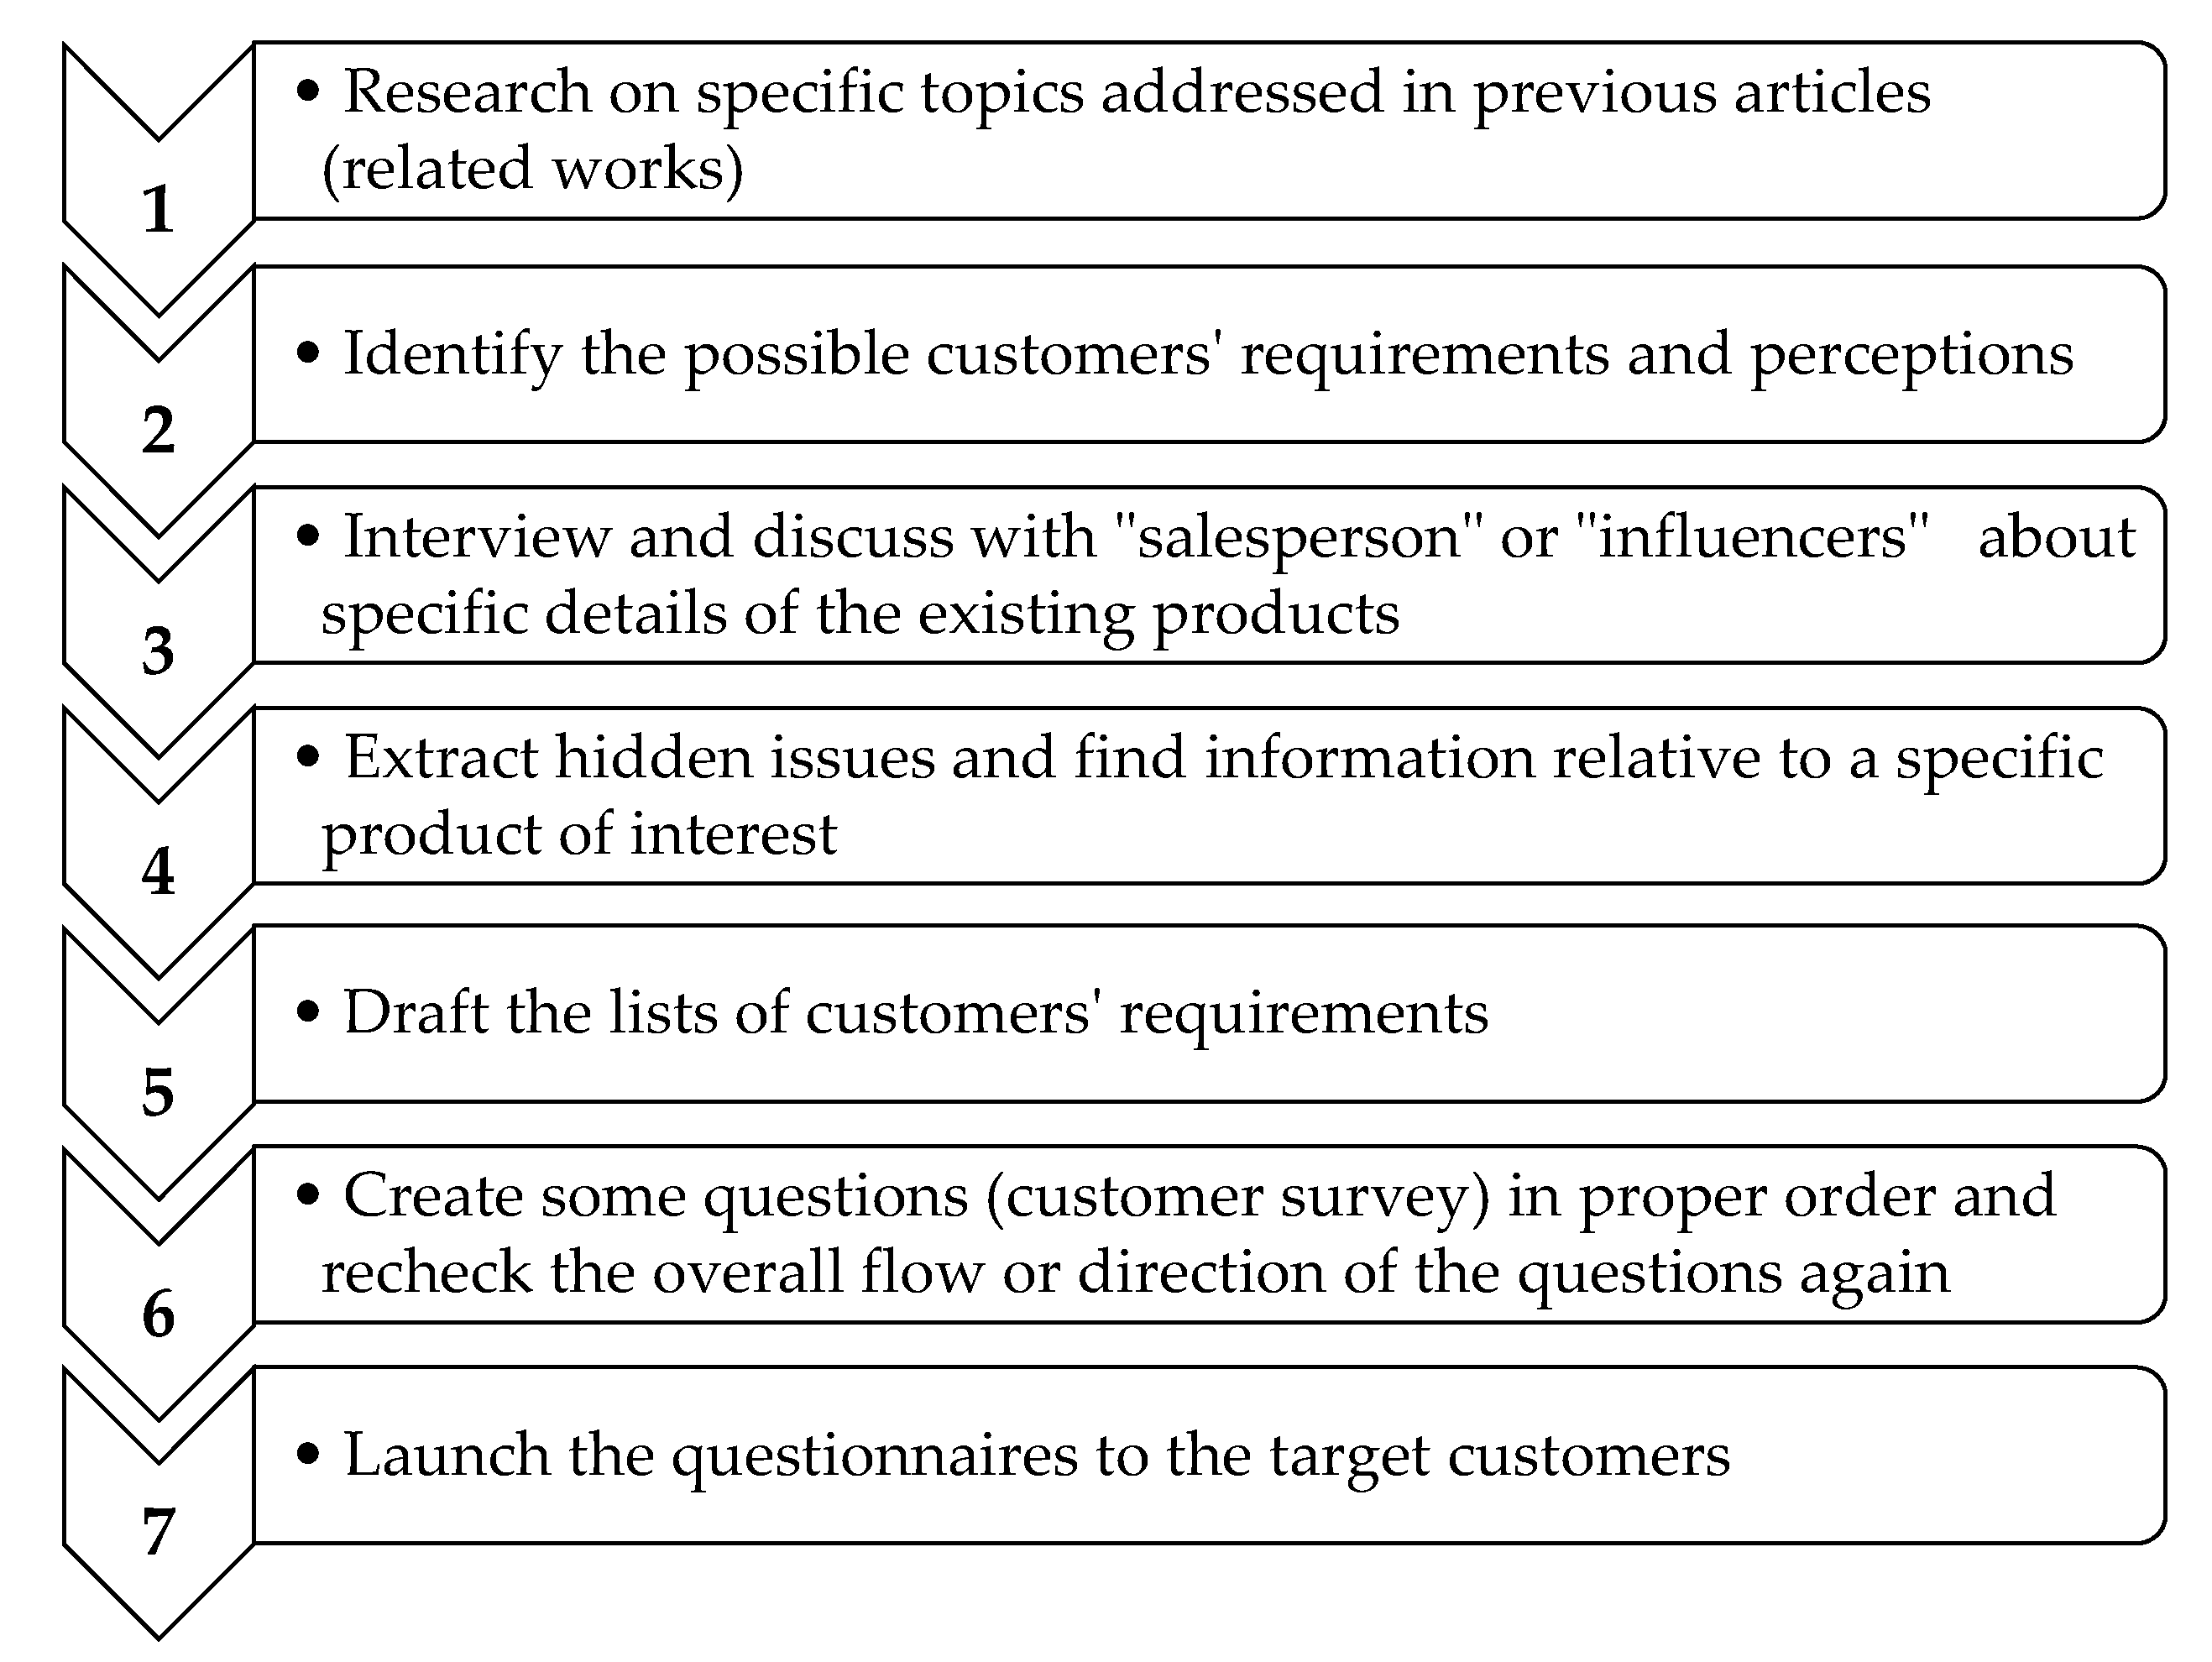
To identify customer requirements, seven steps are necessary (
Figure 5). Self-administered questionnaires (SAQs) are created and distributed to the target customers. This type of questionnaire is designed specifically to be completed by a respondent without the intervention of the researchers (e.g., an interviewer). However, the researchers might need to review the market status where similar products (existing ones) are in competition. These considerations include the characteristics (i.e., form, fit, and function) and costs of the existing product, and customers’ perceptions of those products. Then, the data obtained from customers are translated into an engineering design platform where the shape, color, and size are used as key components for creating a conceptual model.
The researchers have studied the perceptions and behaviors of people who live in the capital city (i.e., the Bangkok metropolitan region) and the survey questions were constructed to assess how people feel about water filling machines, and how many of them decided to purchase bottled water.
The researchers did not have much information on the subject to begin with, so assumed that half of the respondents purchase bottled water; this gave us maximum variability. We used the following equation (Equation (11)) [
40]:
where
| is the desired level of precision (the margin of error, or confidence interval) |
| is the estimated proportion of the population that has the attribute in question |
| is 1 − p. |
Therefore, in this study,
p = 0.5 indicates 95% confidence, and at least 5%—plus or minus—precision. A 95% confidence level gave Z values of 1.96, per the normal tables, giving
From this calculation, it was found that a random sample of 385 respondents in the target population was enough to give the confidence levels needed. In practice, around 400 questionnaires were distributed to target customers. At this initial stage of the concept development phase, 390 respondents returned their answers; these data were recorded and translated into a conceptual model of the filling machine.
For the detailed design phase, in order to extract some hidden issues with the filling machine structure, where the form, fit, and function (the 3 Fs) expected were clearly expressed and discussed in sequence, 72 potential users with technical skills in design and/or engineering backgrounds were interviewed.
Table 2 presents the data collected from the obtained answers.
4.1.3. Factor Correlation Analysis
A descriptive analysis was conducted to determine the characteristics of the variable being investigated. The purpose of this analysis is to give readers a history and description of the relevant aspects of the market segment being targeted in this study. The results of this study on the proposed design of the automatic water filling machine were gained through respondents using a basic questionnaire. The questionnaire, therefore, was distributed to owners of drinking water industries, shops, and restaurants located around Rangsit, Pathum Thani. The profile of respondents consisted of gender, age, education, number of employees, and monthly salary.
4.2. Data Analysis
4.2.1. Classifying Customer Attributes into Groups
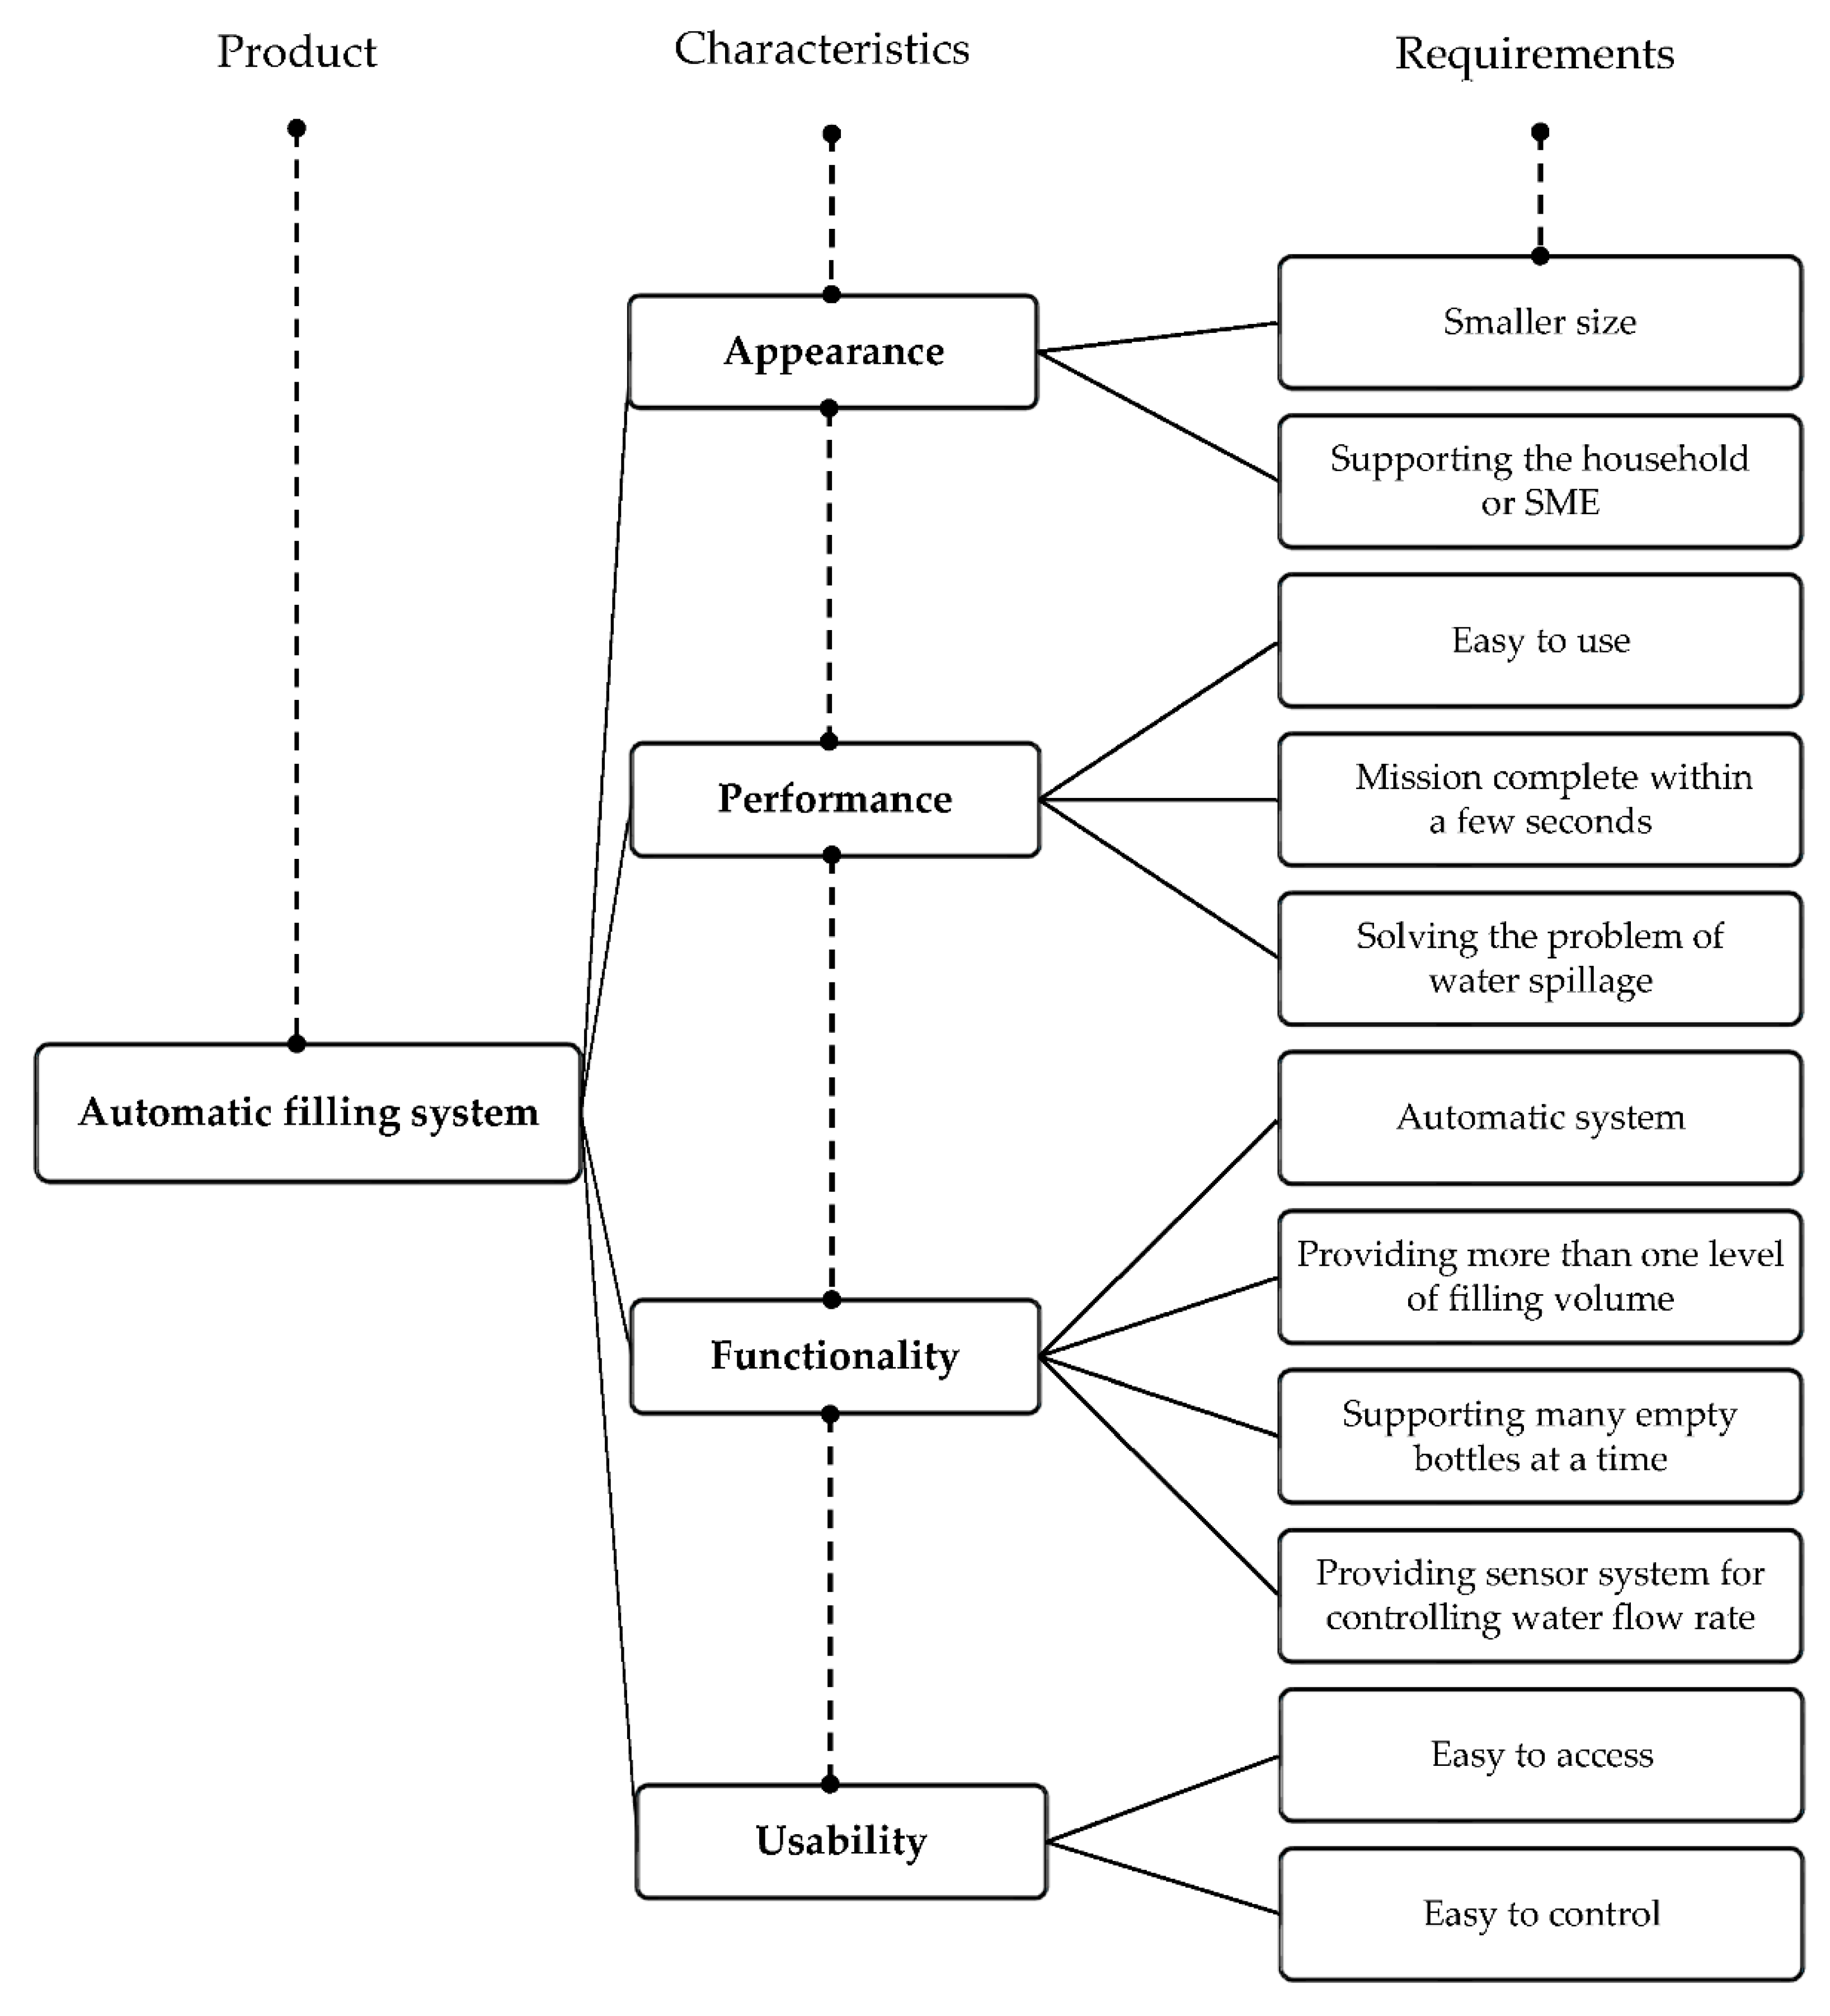
After obtaining the data from questionnaires, the researchers tried to classify the obtained requirements and perceptions of the target customers into four groups: appearance, performance, functionality, and usability, as shown in
Figure 6.
4.2.2. Factor Correlation Analysis
In this study, 67% of respondents were interested in having an automatic filling machine with the proposed qualifications. Therefore, in order to study the effect of factors, namely “business monthly income,” “the size of bottle used,” the “business production capacity,” and “the price of the expected machine” on the customer buying decision, a correlation analysis was employed.
Table 3 indicates that only the product price had a significant correlation (
p = 0.023 < 0.05) with the buying decision of the potential users (customers). This means that the “buying decision” and “expected price of the machine” correlated with each other. The correlation factors were negative (−0.267), which indicated that the lower the price the higher the demand for the proposed machine from customers. It revealed the pricing and demand function had an increase in price, which resulted in a decrease in customer demand. The other factors, statistically, had no significant correlation with the customer buying decision.
4.2.3. Weight of Customer Requirement
According to the customer attributes grouped as in the diagram (
Figure 6), a design engineer can easily identify the specific attributes of the developed filling machine that meet the customer requirements. The target customers—who were in the age range of 21–30 years old, with a monthly salary between THB 20,000 and 50,000 (USD 665.56 1663.89; the U.S. dollar equaled 30.05 Thai Baht as of 11 December 2020)—were surveyed. In this survey, the respondents were asked to give a 1–9 rating to each of the customer requirements, where “1” indicated the least important variable whereas “9” indicated the most important. The weight of customer requirements was normalized to assess their relative importance. The data are provided in
Table 4.
4.2.4. Determine the Relationship between Customer Requirements and Engineering Attributes
To accurately visualize the correlation between engineering attributes and customer requirements, the sub-attributes of engineering attributes should be analyzed properly to give a clearer understanding of the product characteristics that satisfy customer requirements at the “sub-attribute level”. Interviewing 20 potential users allowed designers to easily and effectively draw a correlation matrix between the user requirements and engineering attributes whereby hidden issues were revealed. The full matrix is provided in
Table 5. In order to explain the degree of importance of elements, a scale of 1 to 7 was utilized, where a higher value indicates a stronger correlation.
4.2.5. Analyze the Relationships between Engineering Attributes
In terms of product design, a change in the expected value of a particular engineering attribute of a new product can affect the value of the other engineering attributes, which may also affect customer expectations. Therefore, it was essential to draw a correlation between engineering attributes. For that, the engineering attributes were also studied at the component level, as shown in the previous section (
Table 5). The normalized importance weight of each engineering attribute was determined by using Equation (1), presented in
Section 3.3. The results are shown in
Table 6.
4.3. Determine the Optimized Design Using the Kano–QFD Integration Method
The way to get an optimized design is to apply the Kano–QFD integration method, wherein the final step is the formulation of the goal programming model. First, the coefficients of the customer satisfaction (CS) and dissatisfaction (DS) levels for each customer requirement variable were determined according to a market survey of the existing products, which was similar to our proposed design. The notation used in the optimization model is presented in
Table 7 and Equations (2) to (10) in
Section 3.4.
A goal programming model with cost constraints was used to find the optimum design of the new product considering the customer fulfillment levels. The results revealed that the proposed method could improve the average customer fulfillment level from 0.74 to 0.87 by adding 500 THB (30.05 THB = 1 USD as of 11 December 2020).
Figure 7 shows that the average fulfillment level increases when additional money is spent to improve the product characteristics.
4.4. The Design of an Automatic Filling Machine
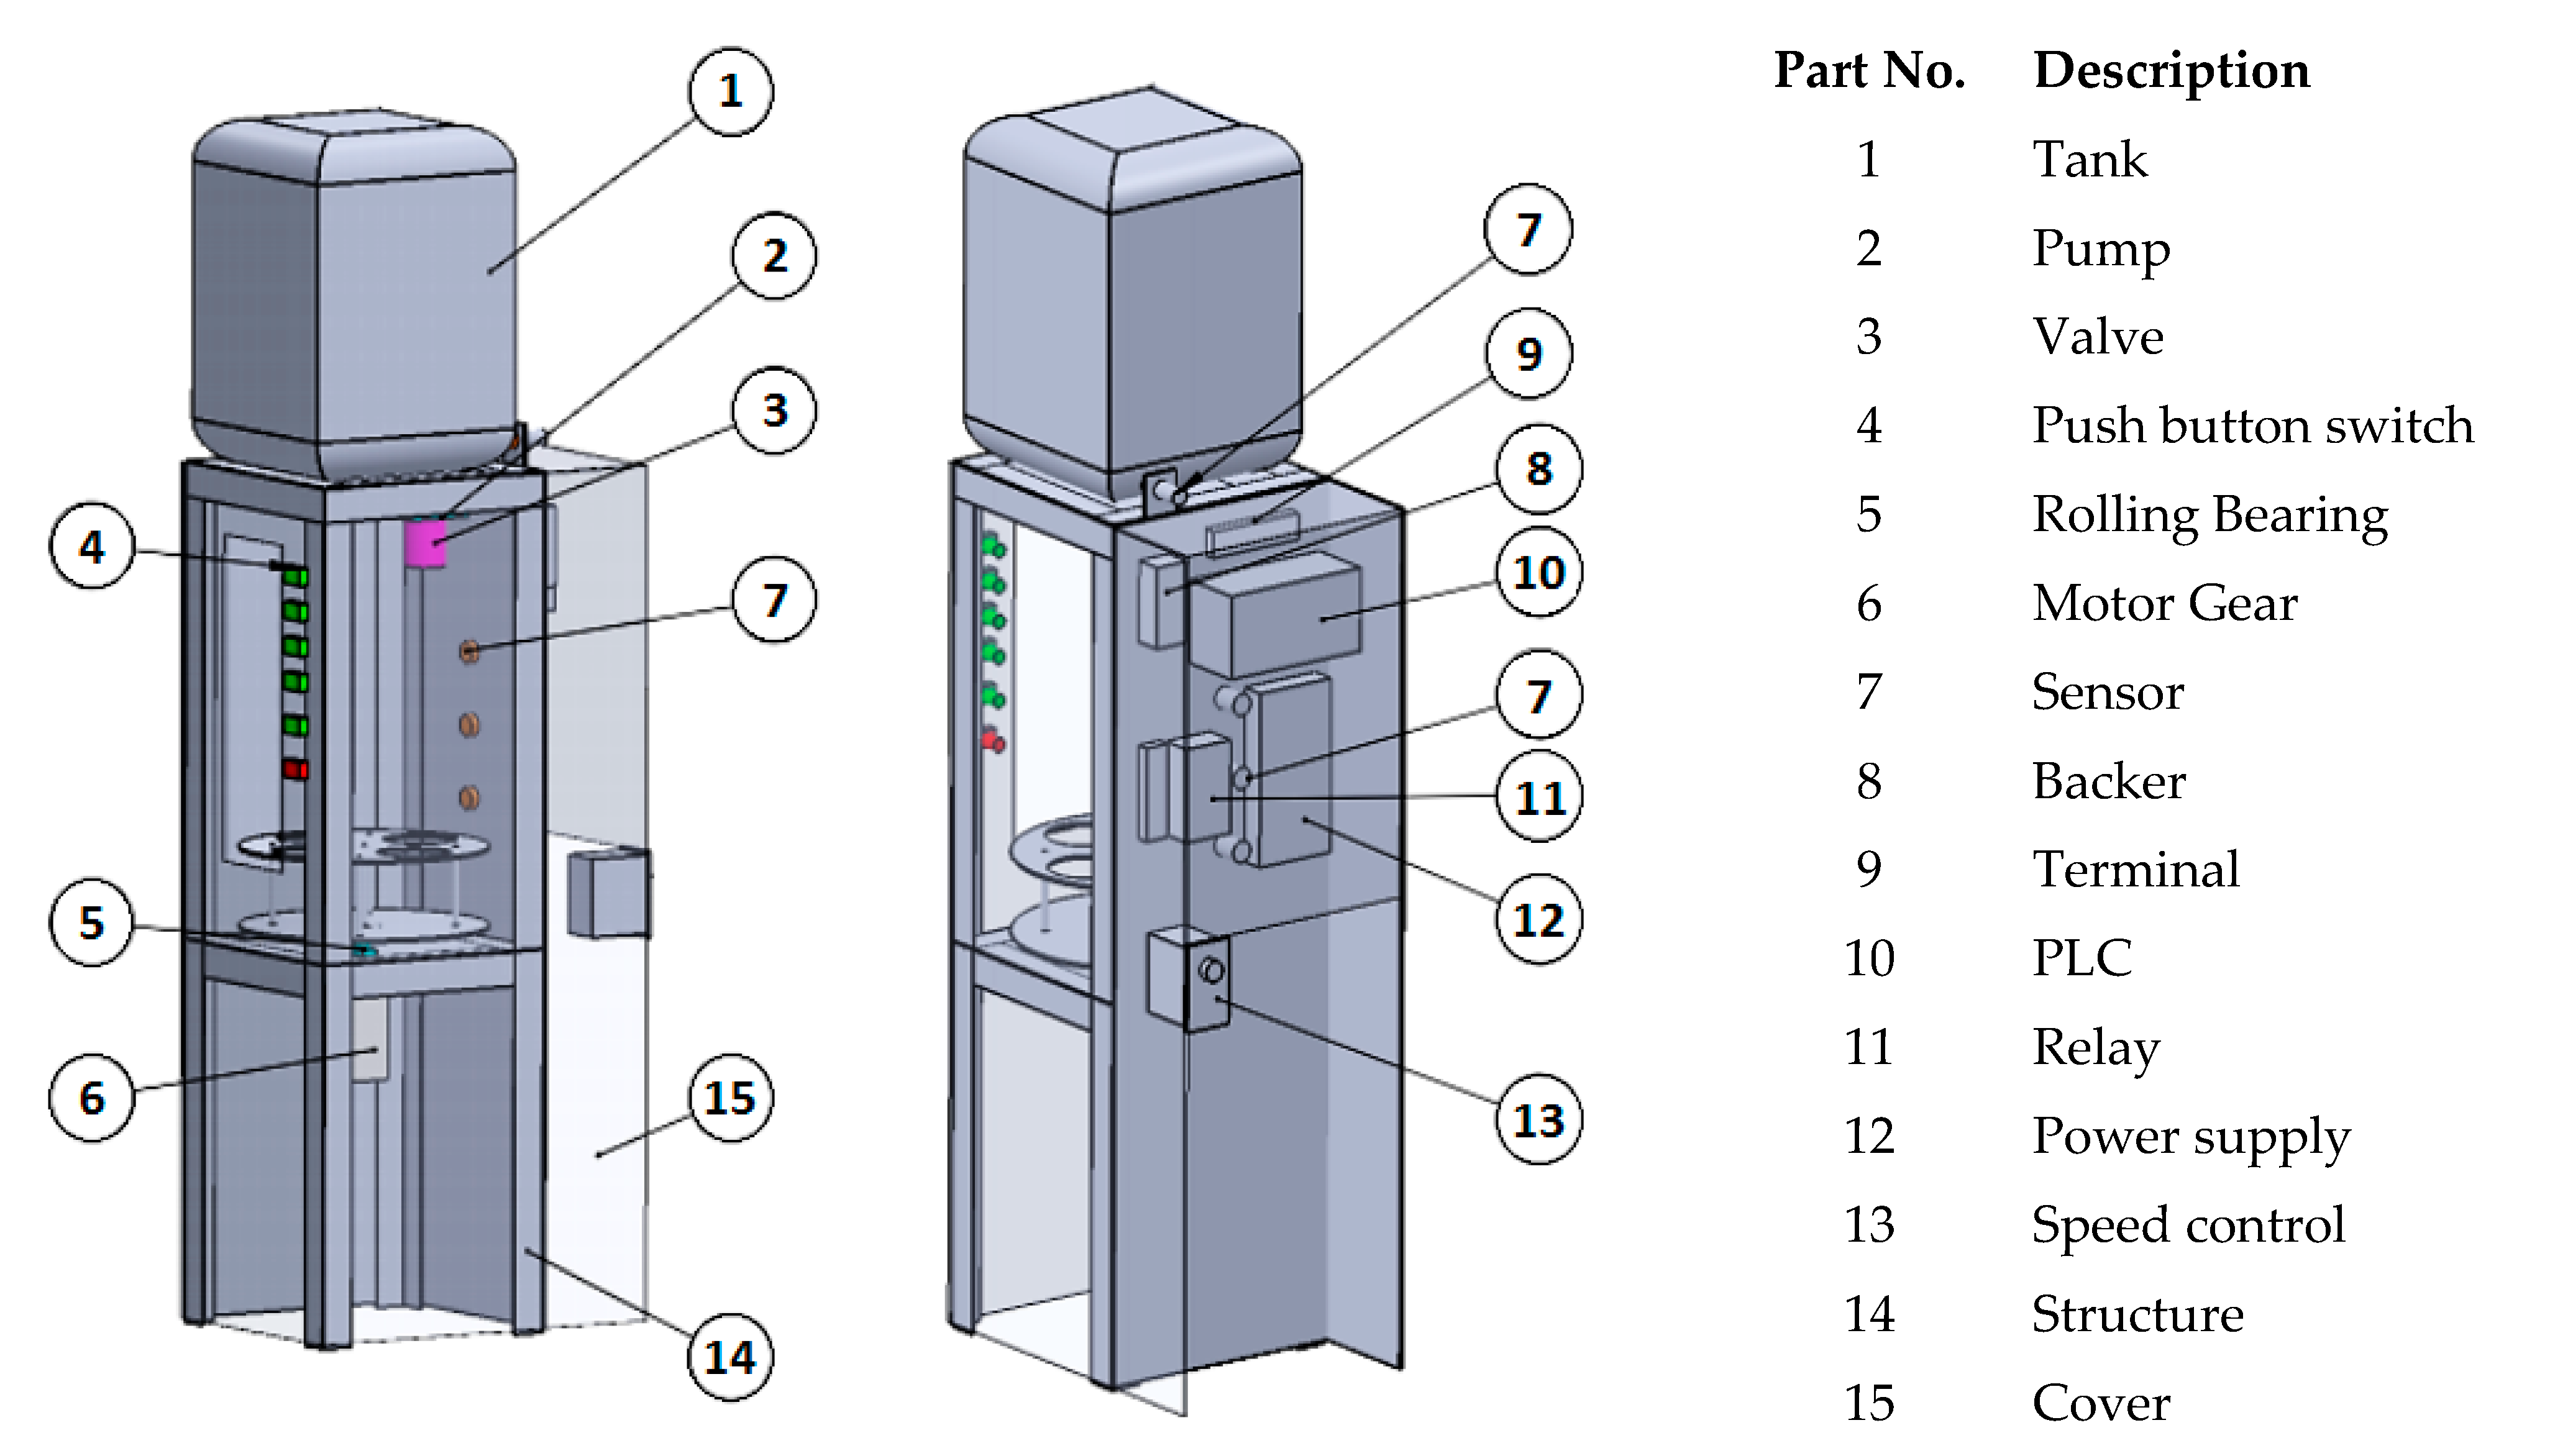
After obtaining results from the goal program, the automatic filling machine was designed. A description of the final model is presented in
Table 8 and
Figure 8. The design engineers have tried to combine the concepts of the filling single bottle and multi-head filling machine. Price, function, and size are key components in the design of a structural platform of an automatic filling machine that can effectively support a SME’s projects. According to the aforementioned customer requirements, before creating a 3D virtual model of automatic filling machine, the product characteristics should be discussed and the engineering viewpoints expressed in terms of form, fit, or function, as shown in
Table 8.
For the draft design in
Figure 8, the proposed machine can fill the bottle at a rate of up to 62.5 mL/s and is suitable to use for filling bottles of 750 mL up to 1500 mL in size. The machine has an automatic rotating table that works based on the adjustable leveling sensor. This function enables the user to precisely adjust the expected water level. The machine can be equipped with a conveyor machine, which allows for higher productivity. Thus, these attributes mean the proposed machine can be tailored to suit a SME’s needs.
4.5. Summary of the Analysis Results
This study proposed an innovative product. Starting with a survey of the literature on similar existing products in the market, we then analyzed the strengths and weaknesses of the product. Therefore, a product was designed with unique accessories that may fit customer needs. After that, we conducted a statistical analysis to determine the characteristics of the market segment—in this case, the potential users of the proposed machine. This was necessary in order to study the factors that contribute to their buying decisions. Thus, we carried out a descriptive analysis of potential users. Variables such as gender, age, gender, education level, production capacity, and business income were collected using a basic questionnaire. The results indicated that the potential users of the machine were 38% female and 62% male. More than 70% of them were in the age range 21–40 years, and more than 79% have an education level between senior high school and bachelor’s degree with an income range of 20,000–50,000 THB monthly (USD 666–1664).
From the questionnaire results, 63% of the potential users are expected to buy the proposed machine. In order to know the factors affecting customer buying decisions, a correlation analysis was employed. It was found that price has a significant (negative) correlation with customer buying decisions. This fits the cost demand function, which states that an increase in price is always followed by a decrease in market demand. Or, in other words, the lower the price of the proposed product, the higher possibility of it selling out. However, for the other factors—namely, business income, bottle size used, and production capacity of the user’s business—there was no statistical correlation between the factors and customers’ decision to buy the product.
After analyzing the market segment, the QFD method was used to analyze the customer requirements and the engineering attributes. This method started by generating the HoQ construction to translate customer expectations into product characteristics. The Kano model was also applied to incorporate additional data in the HoQ construction. The Kano model helps product designers to classify a product’s elements into three categories: “must have,” “attractive,” and “expected.”
Incorporating the QFD method into the marketing study was an attractive approach to not only analyze the market segmentation but also to optimize the product design based on the market expectations. However, the disadvantage of the QFD method is the inability to involve the company market strategy in the product design, since the QFD approach is only focused on product design based on customer requirements. The goal programming can reduce this pure condition by assigning a constraint to the model based on the company strategy.
In conclusion, based on the issues raised, the recommended steps are as follows:
- (1)
Identify the factors related to the buying decisions of potential buyers of the proposed automatic water filling machine.
- (2)
Identify the customer requirements and engineering attribute expectations that are part of the QFD analysis of the proposed automatic water filling machine.
- (3)
Evaluate the current design in order to find the optimal design in relation and enhance the customer satisfaction level given the cost constraints.
5. Discussion of the Proposed Approach to Innovation Dynamics
QFD integrated with Kano applications allows engineering designers and manufacturers to clearly understand what customers want and what their expectations are of existing or new products. House of quality (HoQ) is the main tool required in the first stage. For supporting innovation dynamics, a controlling system with an Internet of Things (IoT) platform can be added to assist users with sending commands across borders or from any place around the world to fill the empty bottles via a mobile application; once the whole process is terminated, outputs are provided to the user and the notification is sent directly to the user’s mobile phone. Moreover, voice command is an interesting attribute to add to the IoT platform for the convenience of the target groups.
6. Limitations of the Case Study
The QFD-based method has some limitations. Some are inherent in the parameters of the QFD platform itself. Other limitations are of a more practical nature, in terms of the perceptions, ideas, knowledge, and experiences of the target customers and design engineers. As shown by the results, it is hard to prove the optimality of the values calculated in a practical way. This does not guarantee that the target customers will be completely satisfied by all components created according to the proposed approach. Moreover, the success of a product depends on a lot of factors such as the pricing strategy, promotions, or product manufacturing. The success or failure of a product cannot be directly linked to an optimal or unsuccessful product design.
7. Conclusions, Contributions, and Recommendations
7.1. Conclusions
In the first stage, we conducted a literature review to find works related to the product’s quality attributes, with “water filling machine” and “bottled water” as keywords. The concepts obtained from related works were used as the guidelines for constructing questionnaires whereby data about the perceptions and behaviors of the target customers could be collected. All data were translated to create a conceptual model of a filling machine. To make the final design more robust, we conducted interviews to put specific questions to experts with a background in engineering design and product development. In this way, the machine quality attributes and consumer requirements could be determined properly.
For the second stage, a questionnaire was distributed to determine which quality attributes bottled water consumers perceived to be most important as part of a convenient lifestyle. We classified their answers using the quality attributes in the Kano model in order to effectively understand consumers’ needs.
For the third stage, consumers’ demand for quality attributes was transformed into a technique of product quality development. In a matrix of the two constructs, quality classification of the water filling machine in the Kano model, and assessment of consumers’ satisfaction with the functions of the filling machine, quality factors were transformed into technical specifications of product development for QFD. In conclusion, QFD can help design engineers to understand the needs of target consumers when customer needs are properly translated into engineering design attributes.
7.2. Contributions
The results can serve as a reference for companies or manufacturers to effectively distribute resources and establish strategies for product development that will enhance product quality and consumer satisfaction, reduce product development time, and increase the success rate of products in the market. The results mean that water/liquid filling machine enterprises not only make a profit from the product but also meet customers’ needs.
For creating a new product design, identifying the proper components of engineering design to support customer requirements is key. In practice, the contributions can be shown through the guidelines for starting to create a platform for a new design, where four main parts are required (
Figure 9): determine the product characteristics and requirements, determine the relationship between customer requirements and engineering attributes, determine the relationship between the engineering attributes, and optimize the design of a new product.
7.3. Recommendations for Future Products
Proper quantitative methods are required to improve the reliability of the QFD process since the subjective decisions made in the use of QFD often rely on the decisions of design engineers and researchers. In this case study, a quantitative approach using goal programming and Kano’s model was used to obtain an optimal product design and make process more robust. Applying other quantitative methods that are better suited to identifying unspoken needs is also recommended. When applying QFD in a new design, it is sometimes quite difficult to get results, since without an effective management-supporting team (nontechnical) for implementing QFD, some necessary data may be missed. Moreover, QFD requires the cooperation of people from different fields or departments.
Author Contributions
Conceptualization, literature review, methodology, formal analysis, investgation, data validation, supervision, and writing—review and editing S.R.; literature review, methodology, writing—original draft preparation, data collection and primary analysis, S.W. All authors have read and agreed to the published version of the manuscript.
Funding
This research received no external funding.
Institutional Review Board Statement
Not applicable.
Informed Consent Statement
Not applicable.
Data Availability Statement
Not applicable.
Conflicts of Interest
The authors declare no conflict of interest.
References
- New York, 21 May 2020 (GLOBE NEWSWIRE)—Reportlinker.com Announces the Release of the Report “Global Bottled Water Industry”. Available online: https://www.reportlinker.com/p05817810/?utm_source=GNW (accessed on 10 December 2020).
- Graybill, S. “Organic Retailers Seize Opportunity to Grow”. 2 October 2020. Available online: https://www.bevindustry.com/articles/93508-organic-retailers-seize-opportunity-to-grow (accessed on 10 December 2020).
- Jacobsen, J. “Clean Label Finds its Roots in Nature”. 13 July 2020. Available online: https://www.bevindustry.com/articles/93221-clean-label-finds-its-roots-in-nature (accessed on 10 December 2020).
- Harfmann, B. “OWYN Powers Market with Plant-Based, Vegan Lineups”. 12 March 2020. Available online: https://www.bevindustry.com/articles/92901-owyn-powers-market-with-plant-based-vegan-lineups (accessed on 10 December 2020).
- Beverage Industry. 12 March 2020. Available online: https://www.bevindustry.com/keywords/organic%20beverages (accessed on 10 December 2020).
- Gugler, J. “Organic drinks: Next Level for Pure Taste”. Available online: https://www.austriajuice.com/news-blog/organic-drinks-next-level (accessed on 10 December 2020).
- Yoshino, N.; Taghizadeh-Hesary, F.; Charoensivakorn, P.; Niraula, B. ASIA PATHways: A Blog of the Asian Development Bank Institute. Asian Development Bank (ADB). Available online: http://www.asiapathways-adbi.org/2015/07/importance-of-smes-in-the-thai-economy/ (accessed on 20 August 2020).
- Wiegers, T.; Langeveld, L.; Vergeest, J. Shape language: How people describe shapes and shape operations. Des. Stud. 2011, 32, 333–347. [Google Scholar] [CrossRef]
- Racela, O.C. Customer orientation, innovation competencies, and firm performance: A proposed conceptual model. Prodedia Soc. Behav. Sci. 2014, 148, 16–23. [Google Scholar] [CrossRef]
- Lai, X.; Tan, K.C.; Xie, M. Optimizing product design using quantitative quality function deployment: A case study. Qual. Reliab. Eng. Int. 2007, 23, 45–57. [Google Scholar] [CrossRef]
- Gutierrez, S.; Tulkoff, C. Benchmarking and QFD: Accelerating the successful implementation of no clean soldering. In Proceedings of the 16th IEEE/CPMT International Electronic Manufacturing Technology Symposium, LA Jolla, CA, USA, 12–14 September 1994; pp. 389–397. [Google Scholar] [CrossRef]
- Wang, Y.H.; Lee, C.H.; Trappey, A.J. Service design blueprint approach incorporating TRIZ and service QFD for a meal ordering system: A case study. Comput. Ind. Eng. 2017, 107, 388–400. [Google Scholar] [CrossRef]
- Karsak, E.E.; Sozer, S.; Alptekin, S.E. Product planning in quality function deployment using a combined analytic network process and goal programming approach. Comput. Ind. Eng. 2002, 44, 171–190. [Google Scholar] [CrossRef]
- Wasserman, G.S. On how to prioritize design requirements during the QFD planning process. IIE Trans. 1993, 25, 59–65. [Google Scholar] [CrossRef]
- Kujit-Evers, L.F.M.; Morel, K.P.N.; Eikelenberg, N.L.W.; Vink, P. Application of the QFD as a design approach to ensure comfort in using hand tools: Can the design team complete the House of Quality appropriately? Appl. Ergon. 2009, 40, 519–526. [Google Scholar] [CrossRef]
- Cherif, M.S.; Chabchoub, H.; Aouni, B. Integrating customer’s Preferences in the QFD Planning Process Using a Combined Benchmarking and Imprecise Goal Programming Model. Int. Trans. Oper. Res. 2010, 17, 85–102. [Google Scholar] [CrossRef]
- Askin, R.; Dawson, D. Maximizing Customer Satisfaction by Optimal Specification of Engineering Characteristics. IEEE Trans. 2000, 32, 9–20. [Google Scholar] [CrossRef]
- Tsai, Y.C.; Chin, K.S.; Yang, J.B. A Hybrid QFD Framework for New Product Development. Asian J. Qual. 2002, 3, 138–158. [Google Scholar] [CrossRef]
- Crowe, T.J.; Cheng, C. Using quality function deployment in manufacturing strategic planning. Int. J. Oper. Prod. Manag. 1996, 16, 35–48. [Google Scholar] [CrossRef]
- Kim, K. Determining optimal design characteristic levels in quality function deployment. Qual. Eng. 1997, 10, 295–307. [Google Scholar] [CrossRef]
- Lai, X.; Xie, M.; Tan, K.C. QFD optimization using linear physical programming. Eng. Optim. 2006, 38, 593–607. [Google Scholar] [CrossRef]
- Gungor, Z.; Delice, E.K. An new mixed integer linear programming model for product development using quality function deployment. Comput. Ind. Eng. 2009, 57, 906–912. [Google Scholar]
- Lai, X.; Xie, M.; Tan, K.C. Dynamic Programming for QFD Optimization. Q. Reliab. Eng. Int. 2005, 21, 769–780. [Google Scholar] [CrossRef]
- Labib, A.; Vanegas, L. A Fuzzy Quality Function Deployment (FQFD) model for deriving optimum targets. Int. J. Prod. Res. 2001, 39, 99–120. [Google Scholar]
- Chen, Y.; Fung, R.Y.K.; Tang, J. Fuzzy expected value modelling approach for determining target values of engineering characteristics in QFD. Int. J. Prod. Res. 2005, 43, 3583–3604. [Google Scholar] [CrossRef]
- Elif, K.D.; Zülal, G. Determining design requirements in QFD using fuzzy mixed-integer goal programming: Application of a decision support system. Int. J. Prod. Res. 2013, 51, 6378–6396. [Google Scholar] [CrossRef]
- Lai, X.; Xie, M.; Tan, K.C. Optimization product design using the Kano and QFD. In Proceedings of the 2004 IEEE International Engineering Management Conference: Innovation and Entrepreneurship for Sustainable Development, IEMC 2004, Singapore, 18–21 October 2004; Volume 3, pp. 1085–1089. [Google Scholar]
- Tontini, G. Integrating the Kano model and QFD for designing new products. Total Qual. Manag. Bus. Excell. 2007, 18, 599–612. [Google Scholar] [CrossRef]
- Yodwangjai, S.; Pimapunsri, K. Application of semantic differential technique and statistical approach to evaluate designer’s and customer’s perception in furniture Design. Int. J. Appl. Sci. Technol. 2011, 4, 23–30. [Google Scholar]
- Yun, J.J.; Kim, D.; Yan, M.-R. Open Innovation Engineering—Preliminary Study on New Entrance of Technology to Market. Electronics 2020, 9, 791. [Google Scholar] [CrossRef]
- Enkel, E.; Gassmann, O.; Chesbrough, H. Open R&D and open innovation: Exploring the phenomenon. R&D Manag. 2009, 39, 311–316. [Google Scholar]
- Cooke, P. World Turned Upside Down: Entrepreneurial Decline, Its Reluctant Myths and Troubling Realities. J. Open Innov. Technol. Mark. Complex. 2019, 5, 22. [Google Scholar] [CrossRef]
- Shahin, A.; Pourhamidi, M.; Antony, J.; Hyun Park, S. Typology of Kano models: A critical review of literature and proposition of a revised model. Int. J. Qual. Reliab. Manag. 2013, 30, 341–358. [Google Scholar] [CrossRef]
- Lee, Y.-C.; Sheu, L.-C.; Tsou, Y.-G. Quality function deployment implementation based on Fuzzy Kano model: An application in PLM system. Comput. Ind. Eng. 2008, 55, 48–63. [Google Scholar] [CrossRef]
- Kuo-Chien, C.; Mu-Chen, C. Applying the Kano model and QFD to explore customers’ brand contacts in the hotel business: A study of a hot spring hotel. Total Qual. Manag. 2011, 22, 1–27. [Google Scholar]
- Kuo, C.M.; Yuo, S.H.; Lu, C.Y. Integration of the Kano and QFD model in health food development: Using black beans as examples. Qual. Quant. 2014, 48, 225–242. [Google Scholar] [CrossRef]
- Shen, X.X.; Tan, K.C.; Xie, M. An integrated approach to innovative product development using Kano’s model and QFD. Eur. J. Innov. Manag. 2000, 3, 91–99. [Google Scholar] [CrossRef]
- Chen, L.H.; Weng, M.C. An evaluation approach to engineering design in QFD processes using fuzzy goal programming models. Eur. J. Oper. Res. 2004, 172, 230–248. [Google Scholar] [CrossRef]
- Shen, X.X.; Tan, K.C.; Xie, M. The implementation of quality function deployment based on linguistic data. J. Intell. Manuf. 2001, 12, 65–75. [Google Scholar] [CrossRef]
- Cochran’s Sample Size Formula, “Sample Size in Statistics (How to Find it): Excel, Cochran’s Formula, General Tips”. Available online: https://www.statisticshowto.com/probability-and-statistics/find-sample-size/ (accessed on 10 December 2020).
| Publisher’s Note: MDPI stays neutral with regard to jurisdictional claims in published maps and institutional affiliations. |
© 2021 by the authors. Licensee MDPI, Basel, Switzerland. This article is an open access article distributed under the terms and conditions of the Creative Commons Attribution (CC BY) license (http://creativecommons.org/licenses/by/4.0/).


