1. Introduction
This article presents a study on visitor flow simulation at rail station entrances, based on a preliminary assessment of the importance of some perceived consumer factors. Railways remain the “main arteries of city transport networks” for many countries [
1]. Moscow is the largest metropolis in Europe and at the same time, it is a center of agglomeration in Russia [
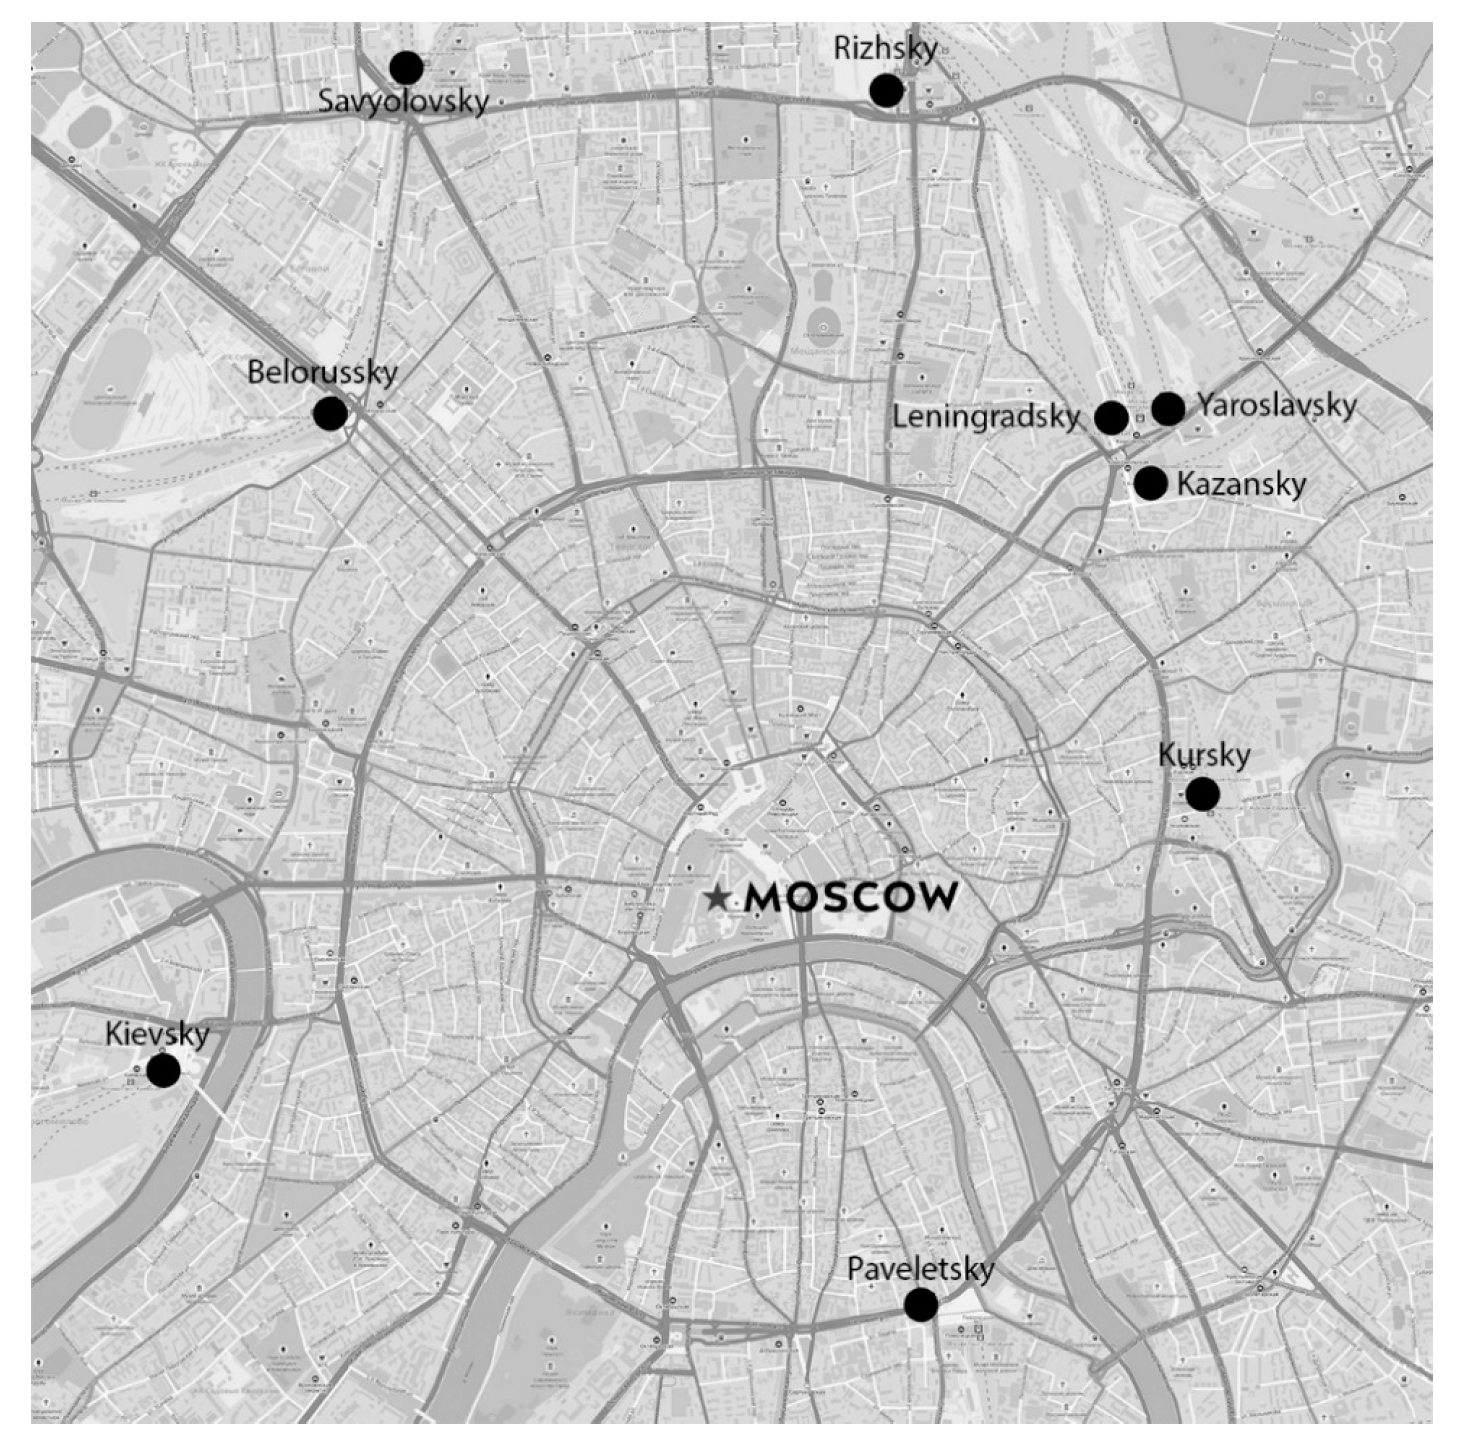
2]. This makes the city an important and large passenger hub. The existing nine rail stations and two more upcoming stations make this a global hub (
Figure 1).
Nowadays Open innovation has become the essential basis of the modern metropolis development. Open innovation can be “modeled as Entrepreneurial Cyclical Dynamics of Open Innovation” [
3]. An important issue here is the possibility of actors’ development adapting to the ongoing changes [
4]. The peculiarity of railway stations in Russia is that they are an important public space. Thus, public spaces need an enabling environment for open innovation, from which companies, society and the city will benefit [
5].
In these conditions, the role of the state is especially important but it should been changed from “regulation to assistance” [
6] Thus, it is necessary to identify and analyze specific problems and look for innovative patterns in order to ensure such assistance [
7] based on the use of both external and internal influences in the innovation process [
8]. Stations in these conditions are no exception. Passenger flow control is one of the most significant tasks in elaborating approaches to rail station modernization and management. This problem becomes especially urgent when restricting free access to the stations in the wake of terrorist attacks, or, a problem seen in recent months, the danger of the COVID-19 pandemic proliferation. With regard to the specific features of public transport in general and railway stations in particular, special measures are needed to prevent the infection spread [
9]. Disinfection gateways that are widely used in medical institutions represent one of such measures [
10,
11]. This study does not analyze the medical or sanitary-epidemiological aspects of taking such measures.
In this article, we present part of the results of a large-scale study of consumer preferences and existing solutions for the modernization of Moscow rail stations, studying the opinions of passengers, companies, and citizens. Here, we consider the issues of safety as perceived by the passengers and visitors of rail stations, taking into account the importance of the issue of “sanitary and epidemiological safety”, and simulate forecast passenger flows at the station entrances. The simulation is carried out with or without the installation of disinfection gateways. While modeling, we use statistical forecasting methods as described in the literature [
12].
The research was performed from December 2019 to June 2020. In the framework of the study, several methodological approaches were used:
- −
analysis of station visitors’ complaints to city authorities and their messages on social networks (netnography research of 1062 complaints and negative reviews from visitors and passengers of Moscow train stations over the period from 2018 to 2020);
- −
passenger flow measurements during rush hours using observation methods;
- −
simulation of flows of groups entering the territory of the rail station during peak traffic on the basis of secondary data on the dynamics of the train station workload and factors influencing it and primary data on the number of the existing groups entering the territory of the station at rush hour (observation data);
- −
field marketing research in the form of an online survey based on the “online panel”, quota arrangement provided sample representativeness by gender and age, 1183 persons took part in the online survey.
The online questionnaire survey was conducted among respondents who use Moscow rail stations. To obtain data on current flows, the observation and fixation method was used [
13]. Various sources of secondary data were also used for subsequent simulation.
The data array was analyzed in this study using the IBM SPSS Statistics 20 software package to simulate passenger flows. The literature review revealed a certain lack of studies of the visitor flows at the rail station entrances, and we could not find studies related to the analysis of the impact of disinfection gateways on the flows of people at the station entrances. Hence, the objectives of this study were:
- −
to obtain data on the importance of factors of sanitary and epidemiological safety for visitors to Moscow rail stations;
- −
to build a forecast of visitor flows at Moscow rail stations;
- −
to identify the impact of the disinfection gateway installation on the forecast flows of station visitors.
Proceeding from the identified objectives, the following hypotheses were proposed:
Hypothesis 1 (H1): Security issues, including sanitary–epidemiological safety, significantly affect the perceived quality of rail station visitors’ servicing.
Hypothesis 2 (H2): Installation of disinfection gateways will not significantly affect the accessibility of rail station entrances.
Our findings showed that for train station visitors, even before active measures to prevent the COVID-19 proliferation in Moscow, it was important to perceive sanitary and epidemiological safety. Forecast models demonstrated that the installation of disinfection gateways exerts impact on the duration of passengers’ entry into a rail station, which can negatively affect the visitors’ satisfaction with a transport service. According to the results obtained, the permissible time of entry into the station should not exceed 5 min (90% of respondents). Thus, the forecast models allow for assessment of the impact of installed disinfection gateways on passenger flow, and for determination of the required number of gateways for the installation so that their installation does not adversely affect the perception of quality and customer value of the transport service at the rail stations.
The novelty of the study is conditioned, firstly, by the identified cause-and-effect relationships between the sanitary and epidemiological situation and customer value perception of the rail station services. Secondly, in the context of a virus pandemic, the concept of transportation security is expanding, including sanitary and epidemiological safety. Thirdly, a disinfection step added to the standard inspection may affect negatively customer value in passengers’ servicing because of the increased time of passengers’ entry into rail stations. We assume that municipal authorities and railway companies can use the results obtained to plan entry groups at rail stations and territories adjacent to station entrances.
2. Literature Review
In this article, we do not consider the medical and sanitary–epidemiological aspects of passenger safety in transport. Our focus is on the aspects of the perceived safety value and simulation of passenger flow decisions at the entrance to the metropolitan rail stations based on this perception. In the literature, these issues are reflected in several aspects: the problems of the perceived value of transportation security, including current challenges; the problems of arranging passengers’ entry into rail stations and the problem of simulating passenger flow data. The literature review suggests that previous research has focused on models for measuring the travel behavior of passengers, stated preferences, perceived customer quality, and satisfaction [
14,
15,
16,
17].
At the same time, as analysis has shown in very few studies, the authors consider the accessibility of train stations and stations for users as a significant factor in passenger entries and exits and the choice of the railway as their preferred mode of transport [
18]. Different works emphasize the importance of solving the problem of congestion in different parts of the stations and suggest different methods for its assessment [
19,
20,
21]. However, in general, the methods discussed in the literature are not sufficient for applications in the context of railway station entrances.
Our focus is on the aspects of the perceived safety value and simulation of passenger flow decisions at the entrance to the metropolitan rail stations based on this perception. In the literature, these issues are reflected in several aspects: the problems of the perceived value of transportation security, including current challenges; the problems of arranging passengers’ entry into rail stations; and the problem of simulating passenger flow data. At the same time, as analysis has shown in just a few studies, the authors consider the accessibility of train stations and stations for users as a significant factor in passenger entries and exits and the choice of the railway as their preferred mode of transport.
As noted in the literature, “security therefore plays an important role in helping public transport to become the mode of choice for today’s citizens” [
22]. Many train stations were created as magnificent monumental buildings, functionally relying only on the technological aspects of transportation. At the same time, according to some authors, when train stations were being designed, the issues of transportation security were rarely considered [
23].
However, more recently transportation security has been the subject of numerous studies. Researchers underline that security perceptions and a good assessment of information are important predictors of visitor behavior [
24]. Analyzing various aspects of transfer satisfaction, the authors give their literature survey, where they show the importance of the safety factor for railway passengers, including at transfer points—train stations. At the same time, safety factors are not broken down in this study into components.
The access mode to the rail stations affects the use of public transport; therefore, the integration of the station with the access mode is a significant factor that determines the success of public transport. Moreover, “accessibility to public transport is represented not only by walking distance, but also by other factors that overall reflect walking accessibility” [
25]. Furthermore, in their study, the authors highlighted the importance of security as a factor affecting passenger satisfaction, but at the same time focused on the analysis of paratransit and walking access to train stations, without analyzing the rail users’ flows.
In this sense, D’Acierno et al. [
26] came closer to the problem of interest to us. They analyzed the problem of timetabling for the purposes of planning station throughput. The approach to the throughput analysis developed by the authors was based on the dwell time evaluation. The supply model, travel demand model and services simulation model were used for the analysis. It should be noted that, despite an attempt to comprehensively analyze such an approach, substantial adjustment of the proposed methodology is required for stations with different locations and facilities (for example, built-in or combined shopping and entertainment centers, etc.). Fox et al. [
27] analyzed the problem of the passenger behavior at the station entrances to some degree. They considered concentrated boarding as a phenomenon that described the concentration of railroad passengers in certain areas. The authors used the observation method and analyzed the passengers’ behavior when already inside the station, without simulating passenger flows.
Nevertheless, all the considered publications emphasized the importance of the influence of safety aspects on passenger behavior. Consideration of these circumstances requires an extended approach to the analysis of passenger flows at station entrances. Public transport issues should be considered both in terms of public interest and in terms of passenger satisfaction and commercial benefits [
28]. Analysis of previous studies shows the importance of taking into account the perceived attributes of the service at stations. These attributes, in our opinion, undoubtedly include perceived security. In this regard, it is necessary to consider both implemented innovations and technological solutions.
At the same time, new challenges often require urgent implementation of certain solutions. The proliferation of COVID-19 pandemic was a challenge of this kind. Under these conditions, the Union Internationale des Transports Publics (UITP) has developed recommendations for public transport operators since public transport is a high-risk environment for users and staff [
9]. Thorough cleaning and careful tidying was recommended, while the main attention should be paid to surface disinfection in the public transport. One should also remember the public transportation security perception on the part of passengers. There are many technological and organizational solutions that will increase the safety perception by passengers [
22], including the disinfection gateway treatment at the station entrance. Sanitary gateways can be equipped with a remote thermometer and disinfectant sprays, for example, as described on the EVENT TRAILERS website [
29]. Such a gateway can have a positive effect on the safety perceived by passengers. It should be noted that the use of such gateways is evaluated quite differently. In particular, one of the recommendations of the World Health Organization (WHO) does not recommend the use of gateways, especially on the basis of chlorine atomization [
30]. In this paper, we do not evaluate these recommendations, but we want to evaluate the impact of using gateways as a tool to increase perceived safety on passenger flows at station entrances.
The review of the existing literature showed the lack of studies related to the analysis of passenger flows at station entrances with regard to gateway installation. Therefore, we analyzed the related publications concerning the analysis and simulation of passenger flows at station entrances.
Cai et al. [
31,
32,
33] predicted passenger flow using AutoRegressive Integrated Moving Average (ARIMA) and collected input and output data. The indicated approach is one of the methods of machine learning. The researchers used short-term correlation, and excluded seasonality and trend. Ding, Cai et al. proposed using the Gradient Boost Decision Tree (GBDT) model to estimate passenger traffic, which has significant advantages in improving short-term forecasting of passenger numbers in a multimodal public transport system. Similar approaches based on modeling and machine learning are widely used in various works [
33,
34].
In some works, the authors, based on their models, propose using station entry limiters to reduce crowding [
35,
36] or synchronize the operation of transport networks [
37]. However, these approaches do not solve the problem of crowding with the introduction of additional restrictions (sanitary gateways or security gateways). Similar approaches to simulation are criticized for excluding passengers’ characteristics from the analysis. In addition, for the passenger flow analysis when installing gateways, it is also necessary to take into account their throughput, which requires the ability to enter special parameters.
An approach presented by Yamamura et al. [
38] uses the multi agent simulation method. The ability to use differences in passengers’ preferences is an undoubted advantage of the simulator proposed by the researchers; these differences can affect the passenger flow and consider various measures to reduce the delay time. At the same time, the model does not provide for the possibility of using historical data and does not allow the creation of forecasts of the load at station entrances.
Another approach is based on considering the process of passengers’ queuing at the entrances as a dynamic random process. Xu et al. [
39] proposed to use a probabilistic method of queuing arrangement based on the theory of discrete-time Markov chains. The deviations obtained by the researchers (about 20%) are insufficient for planning and managing passenger flows, especially in conditions where the task is to prevent passengers’ queues and congestion. In general, it should be noted that a wide class of simulation models are widely used by various authors, including those based on well-proven modeling platforms such as Anylogic, where the environment and behavior are used to simulate pedestrian actions [
40].
At the same time, the approaches to passenger flow simulation at stations based on statistical methods are quite widely presented in the literature [
19,
20,
41,
42,
43]. These methods are often criticized: “However, broadly speaking, these methods are not generic enough to be applied in contexts other than those in which they were developed, and moreover, they provide no details about passenger behavioral rules when a train arrives” [
20]. At the same time, the ease of use and the flexibility to configure these methods allow them to be more productively used in practical detail. The problem of analyzing passengers’ behavior, in particular their safety perception, can be solved by conducting marketing research in conjunction with respective simulation [
2].
Thus, it should be stated that there are research gap in the literature that analyze passenger flows at the entrances to railway stations simultaneously with assessing their impact when installing sanitary locks or security locks. In addition, passenger flows in the literature are not analyzed in terms of perceived value from passengers. Our work is aimed at closing this gap.
3. Methods and Materials
In the framework of the study, several methodological approaches were used: secondary data analysis, analysis of station visitors’ complaints to city authorities and their messages on social networks (netnography research), passenger flow measurements during rush hours, and simulation of flows of groups entering the territory of the rail station during peak traffic.
Secondary data analysis was performed using content analysis. A search was carried out for secondary data on the dynamics of the train station workload and the factors influencing this workload. The relevance of the data in terms of the set goal for the passenger flow analysis at the station key points during peak hours was a search criterion.
Social network statements were surveyed based on the netnography research methodology described by Kozinets [
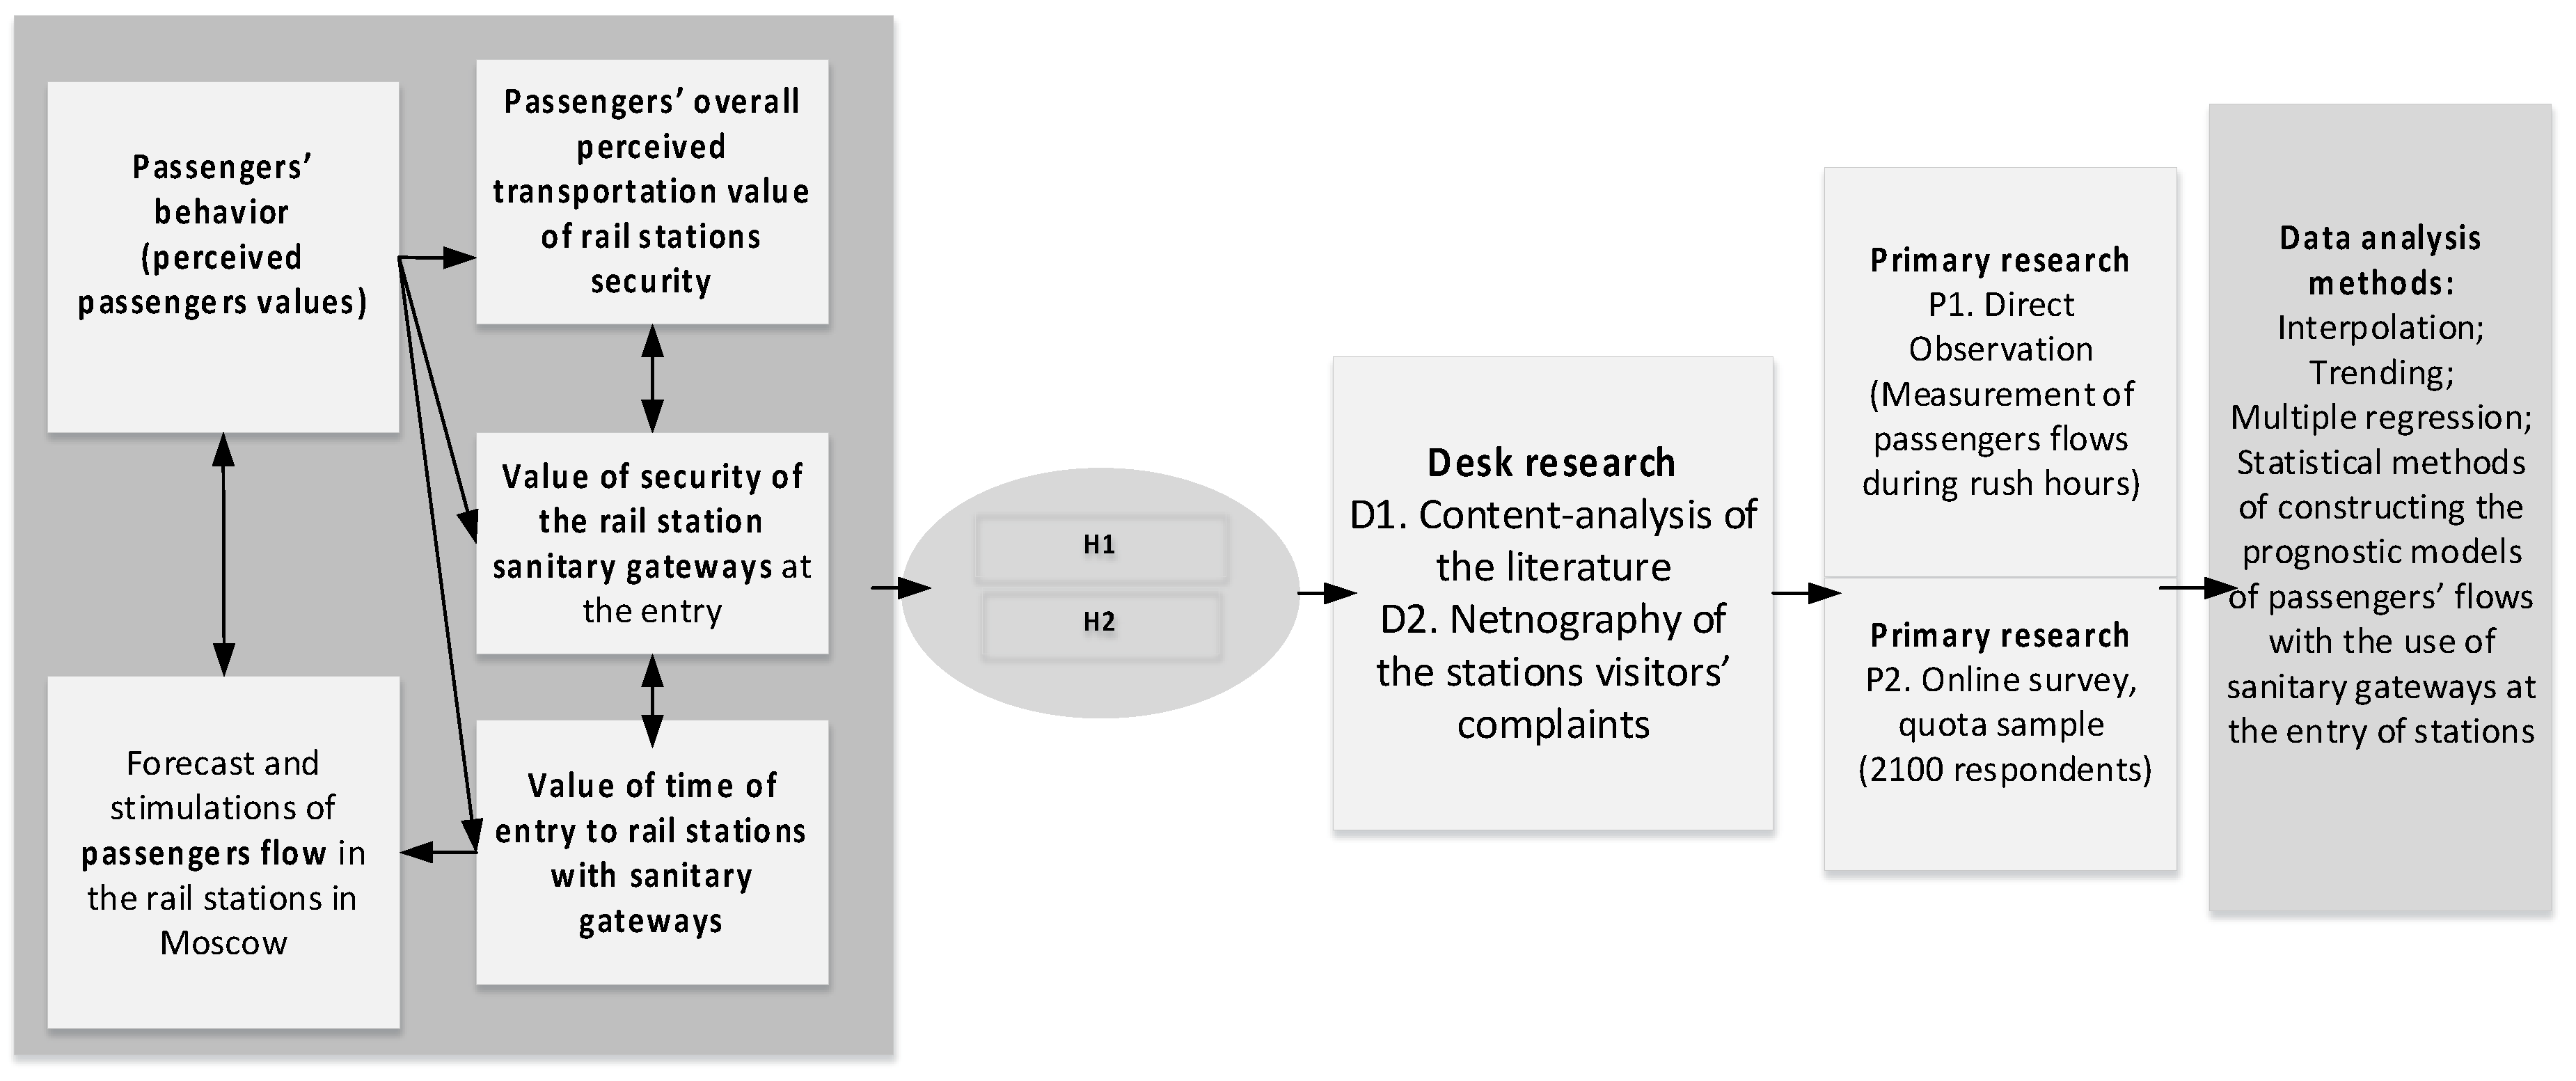
44]. The text array was processed using linguistic and frequency analysis of the obtained data. The connection with the problem at the railway station (servicing, security, infrastructure, etc.) served as a criterion for the selection of statements. Research study design is shown in
Figure 2.
To measure the visitor flow at station entrances, the observation technique was used as described by Malhotra and Birks [
13] and Sidorchuk et al. [
12] based on a sample study of the number of passengers at the train station entrance/exit. The study was performed with regard to differences in passenger flow during a day and on each weekday. The passenger flow at the rail station was assessed visually by long-term or short-term observation. The passenger flow was recorded in the time corresponding to the average and high density of passenger traffic (rush hour). Passenger flows were measured manually, measurements were carried out for five minutes, and the measurement result was entered in the observation sheet. Passenger flow measurements were carried out in December 2019. For each train station, the main measurements were made on Friday (morning and evening rush hours), and Sunday (morning and evening rush hours). In addition, verification measurements were made for each train station. Control measurements were repeated in days and peak load times of passenger traffic at key nodes. The survey was conducted from March 03 to March 19, 2020 to assess consumer experience at points of contact for passengers and visitors to rail stations. The method of marketing research is a field study in the form of an online survey based on the “online panel”. Sample was formed by a quota arrangement method, with gender and age as quoting parameters. Corresponding with age and gender density for the Moscow population quota arrangement provides sample representativeness by gender and age. Data of age and gender density for the Moscow population were taken from Federal State Statistic Service (Rosstat) [
45]. For the research tasks, the Online Market Intelligence (OMI) Online Panel was used [
46] to implement the research objectives; OMI is one of the leading panels in Russia, providing 100% representativeness of the online audience. Sample quotas for a particular study (online survey) ensure representativeness. The SurveyMonkey platform was selected for conducting the online survey, which allowed for programming questionnaires using complex logic; continuity of answers to related questions; the ability to program logical transitions from tabular questions with multiple choices.
To assess visitor flows at the railway complexes of Moscow, a modeling technique was developed that enables the prediction of passenger flow at key nodes for each of the nine stations until 2022, considering the dynamics of passenger traffic in the directions of commuter and long-distance trains. The hypothesis of the model under development was based on the assumption that the passenger flow of Moscow train stations is mainly influenced by the population size in Moscow and the Moscow region, the passenger flow of the main metropolitan airports, and by the commissioning of directions of Moscow Central Diameter rail lines [
34]. The following data were used for the simulation:
- −
secondary data on the dynamics of the train station workload and factors influencing it;
- −
primary data on the number of the existing groups entering the territory of the station at rush hours (field study data).
Interpolation, trending, and multiple regression were employed as statistical methods for constructing a prognostic model. The simulation technique included the following sequence of actions:
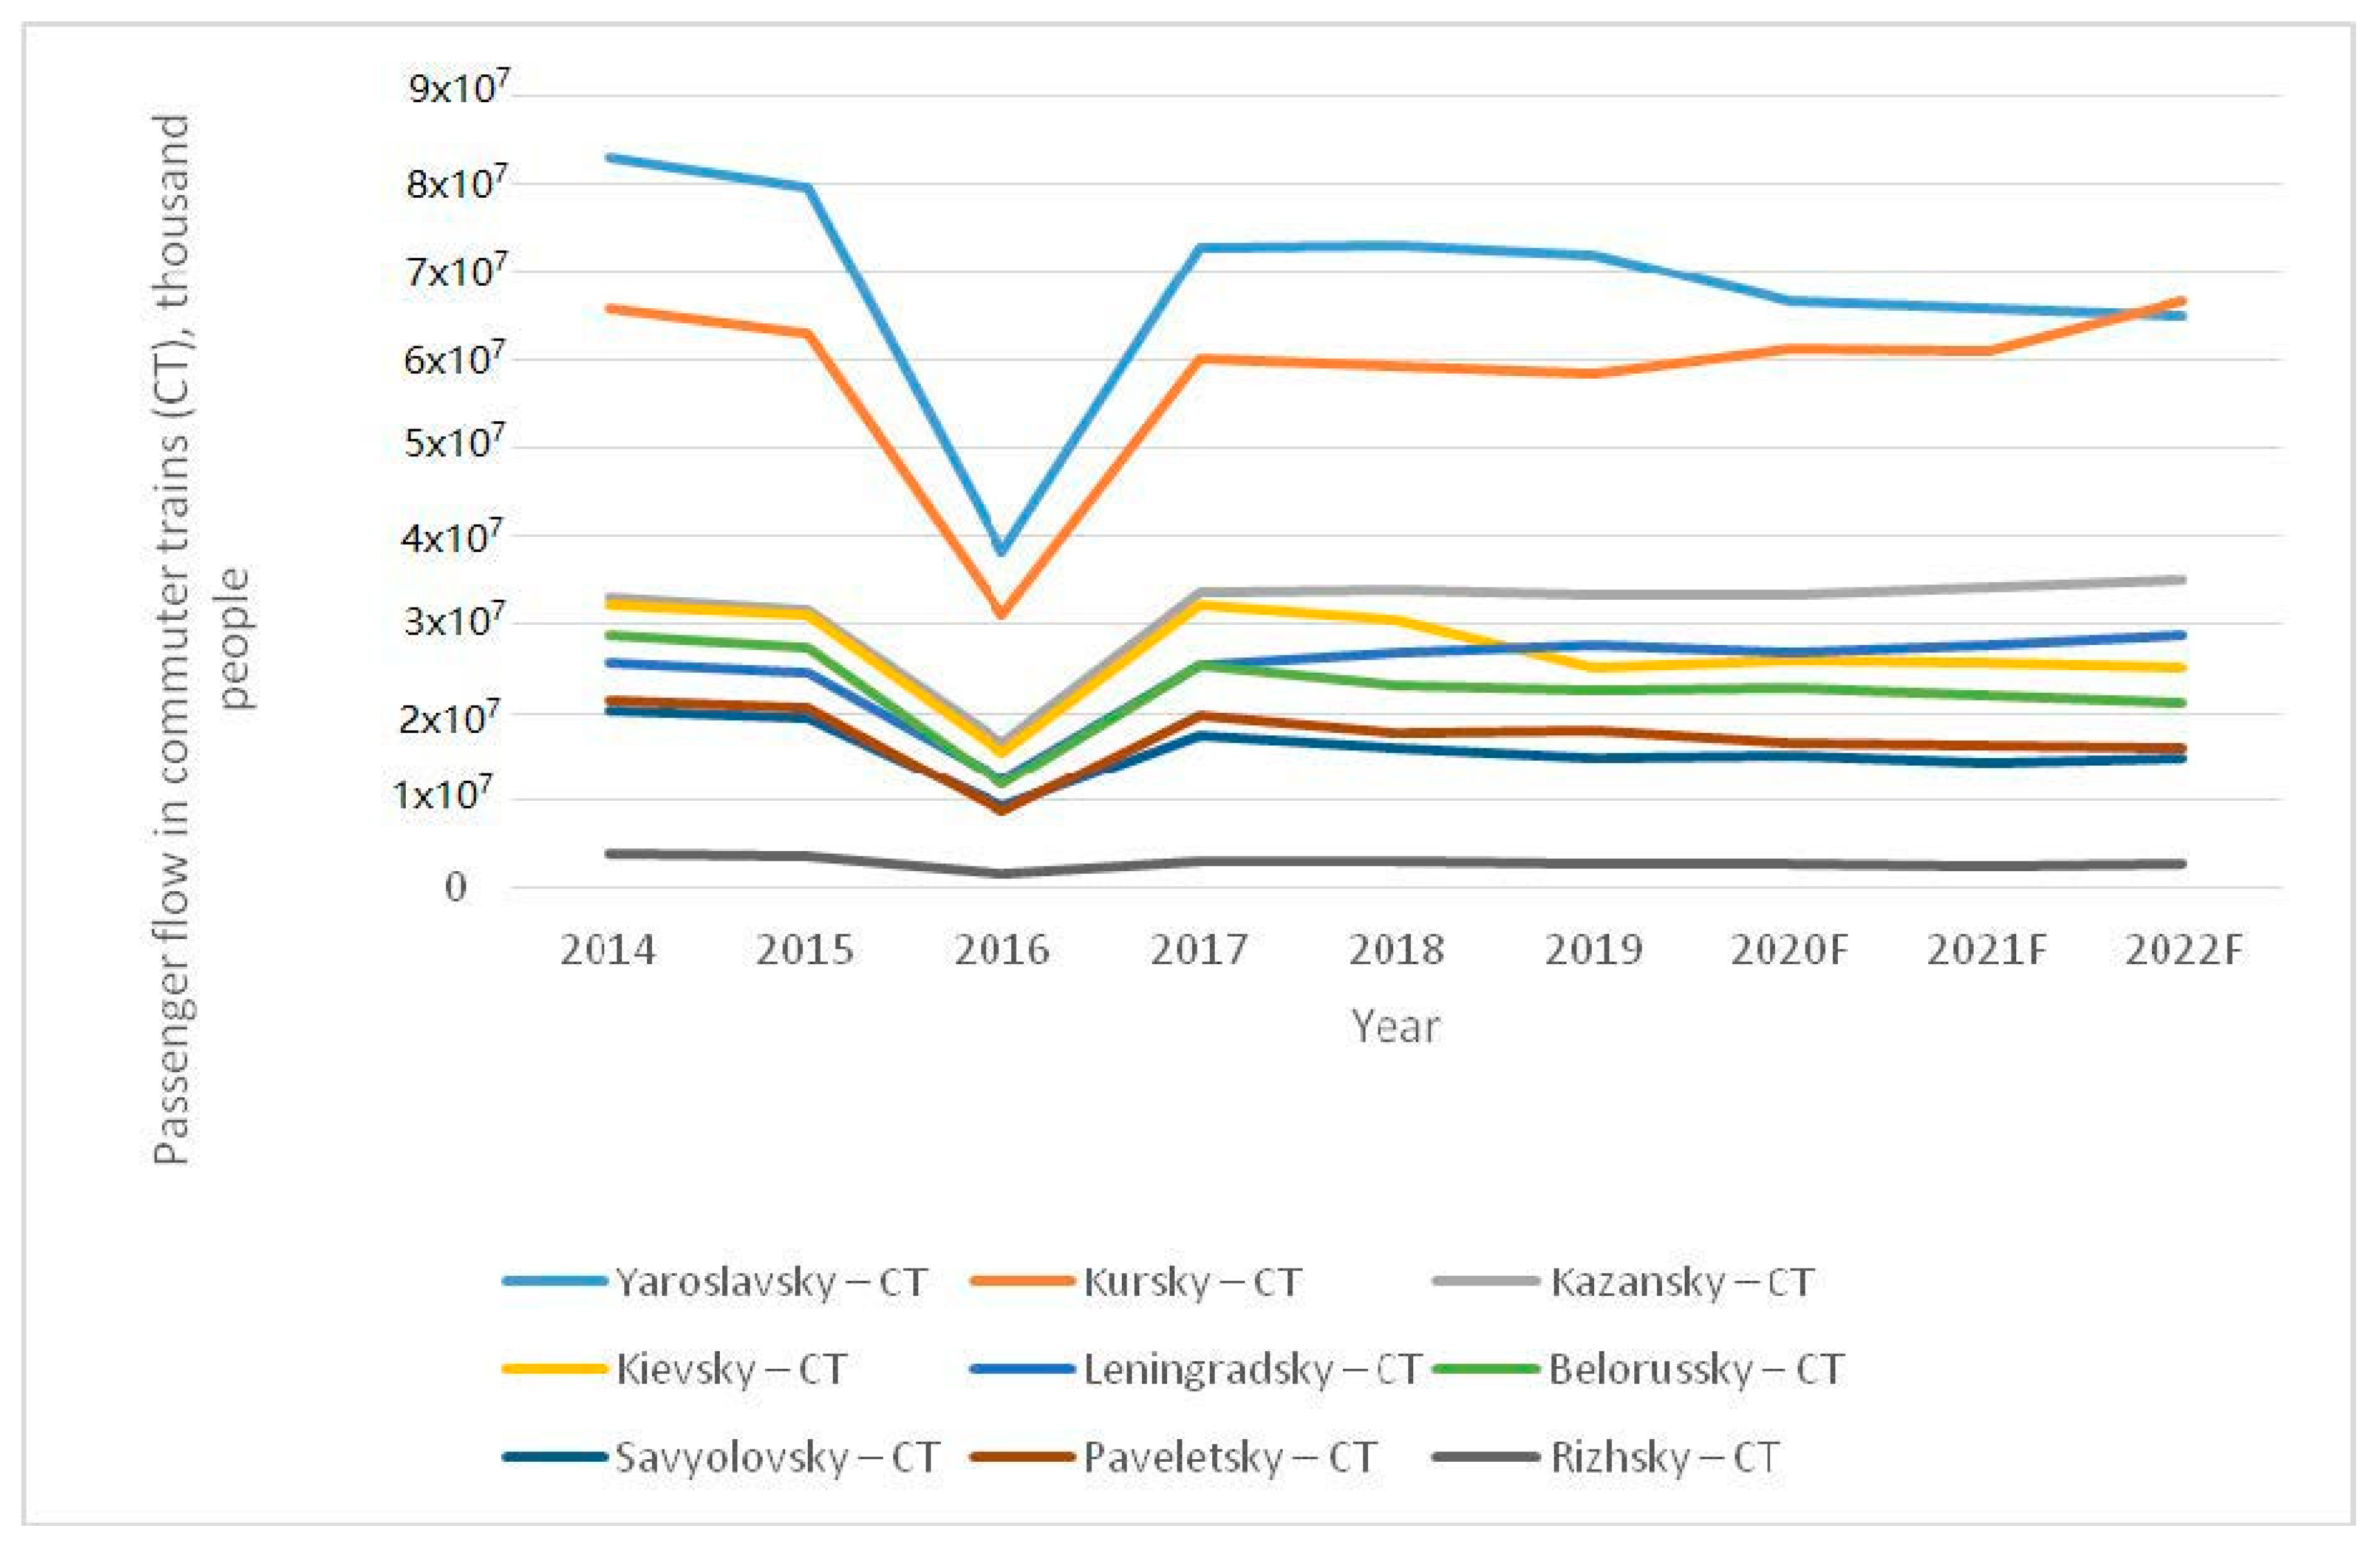
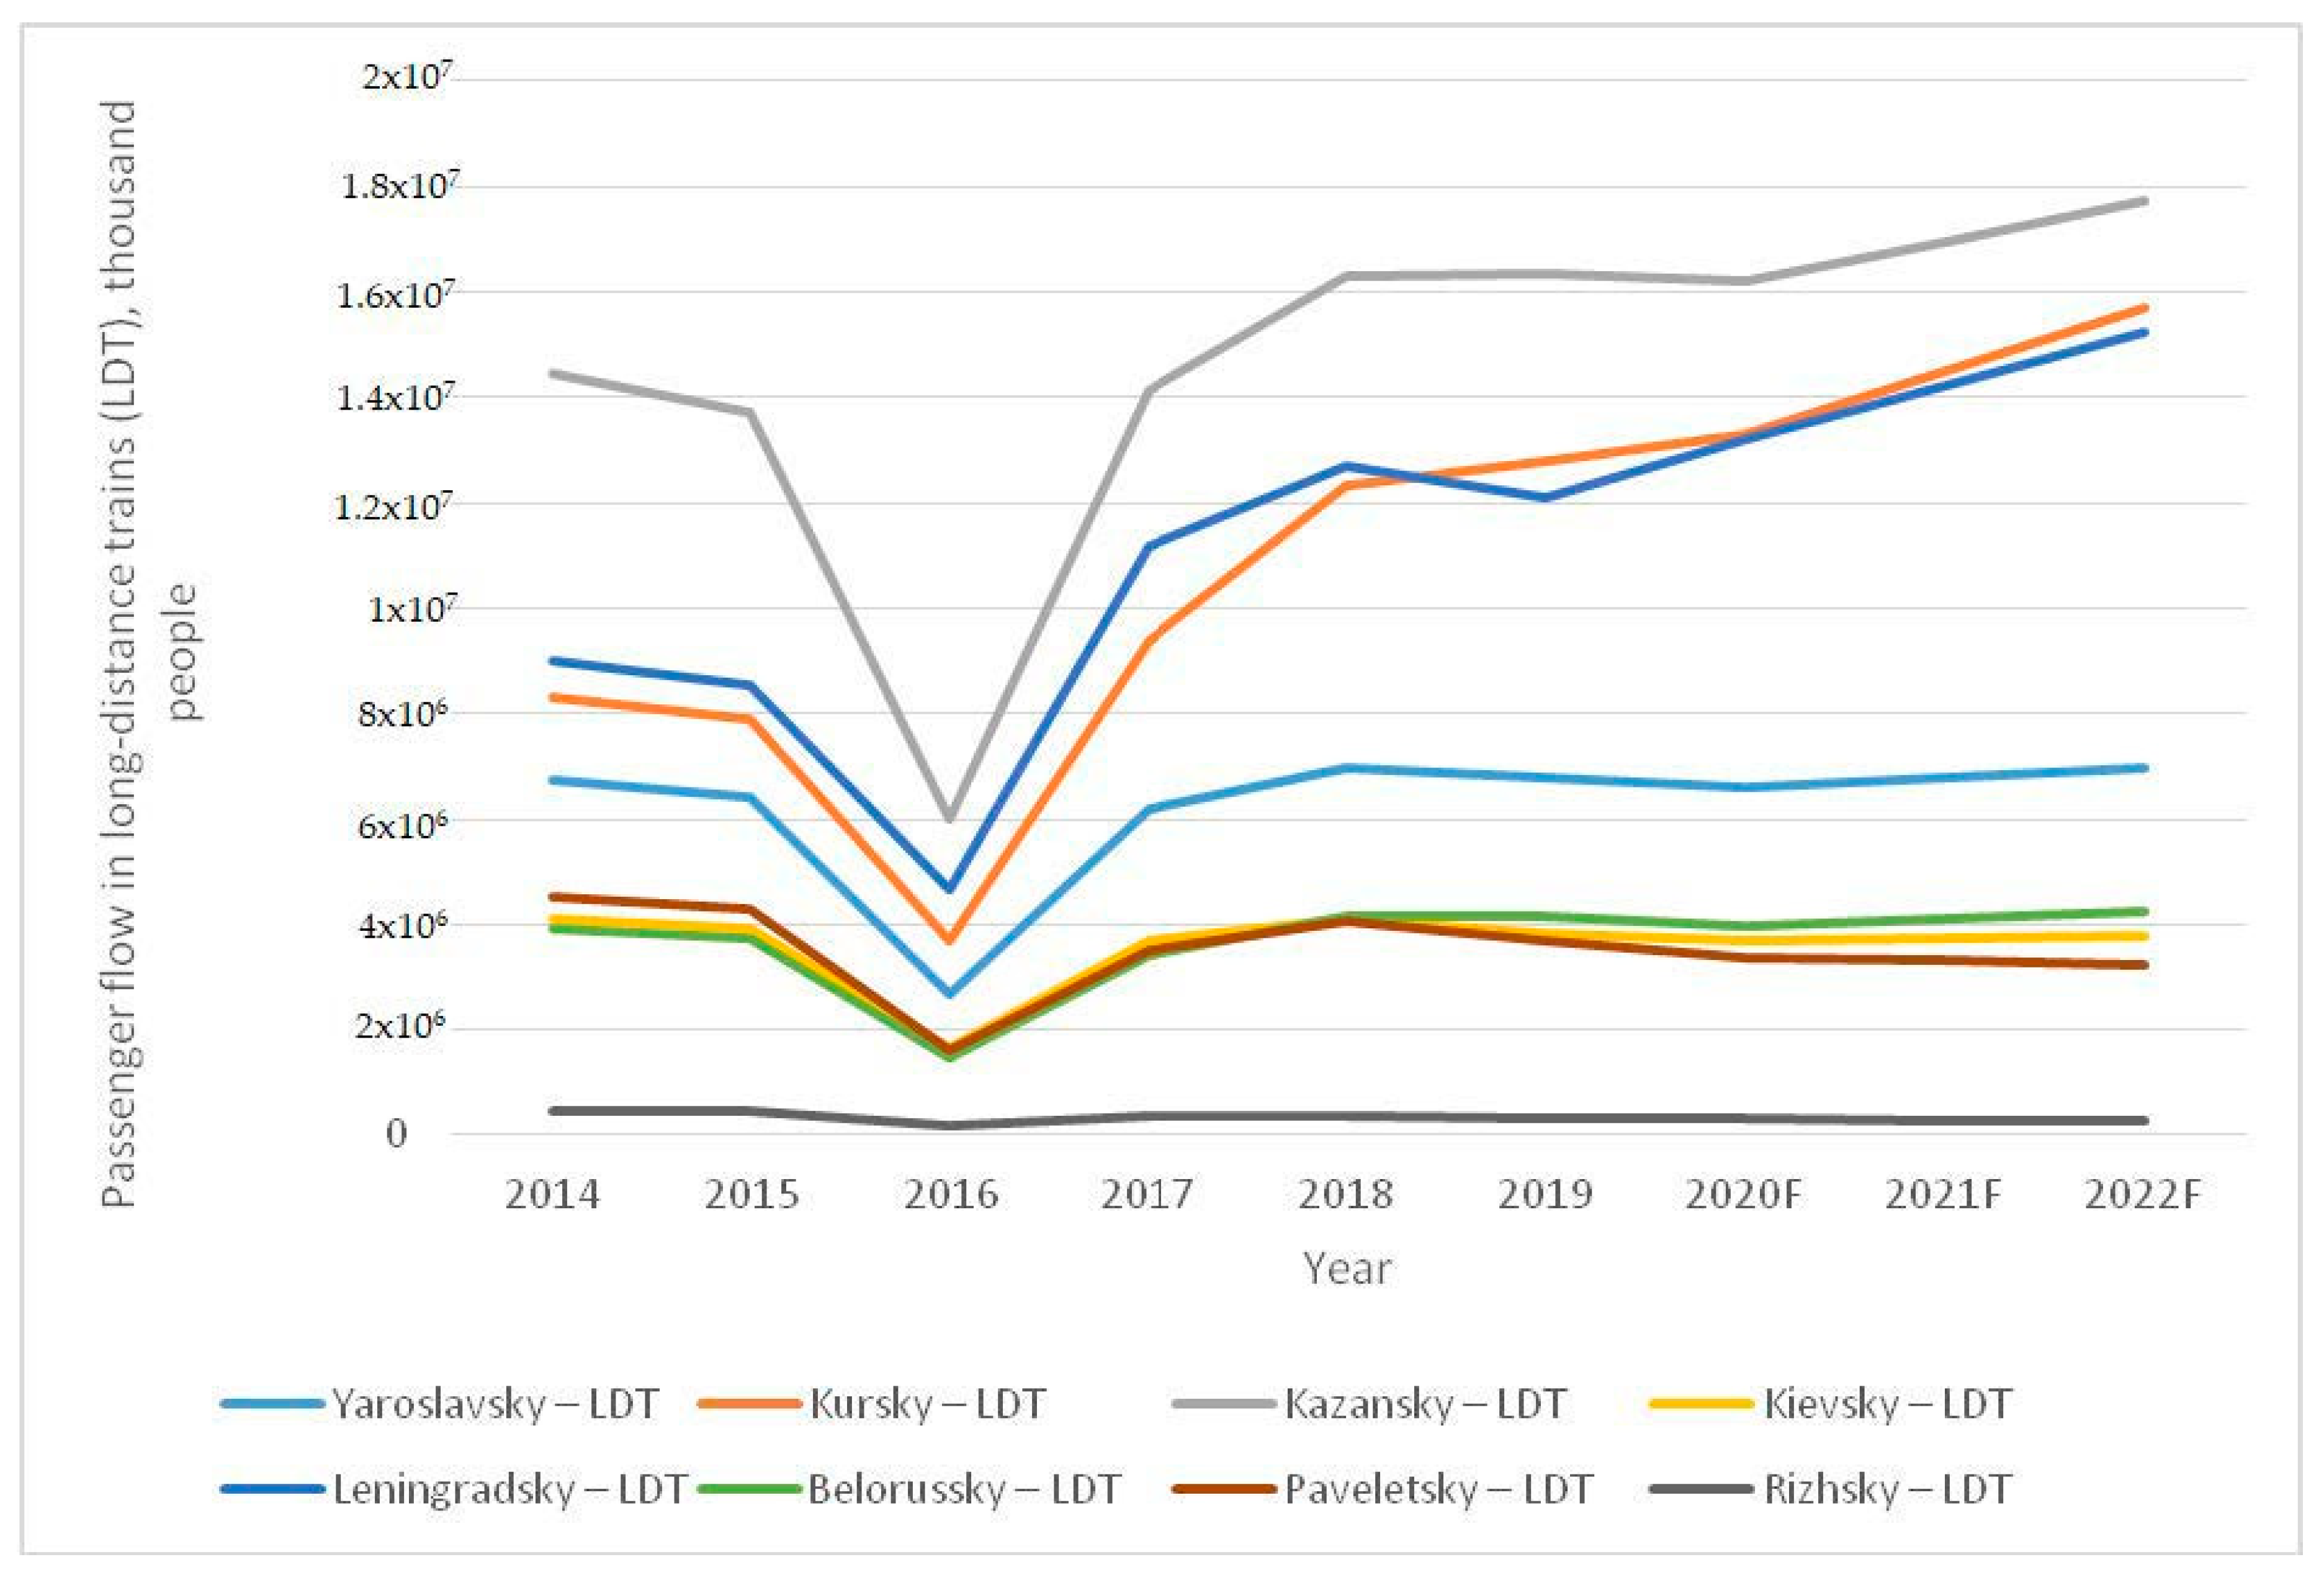
Analysis of the passenger flow dynamics (directions of commuter and long-distance transportation) at Moscow Train Stations from 2014 to 2019: the Yaroslavsky, Kursky, Kazansky, Kievsky, Leningradsky, Belorussky, Savyolovsky, Paveletsky, and Rizhsky stations.
Analysis of the dynamics of the population size in Moscow and the Moscow region from 2014 to 2019 and forecasting for 2020–2022.
Analysis of the passenger flow dynamics at Moscow airports (Sheremetyevo, Domodedovo, Vnukovo) from 2014 to 2019 and forecasting for 2020–2022.
Evaluation of the impact of launching Moscow Central Diameter (MCD) lines on the passenger flow of Moscow train stations.
Evaluation of the statistical relationship between the variables characterizing passenger flows at train stations and airports, as well as the population size.
Development of passenger flow models for rail stations and evaluation of their adequacy.
The passenger flow prediction for train stations in 2020–2022 based on the obtained regression models, with regard to the assumed commissioning of the Moscow Central Diameter rail lines.
The rush-hour passenger flow prediction at key train station nodes (entrances). The primary research data were used. Primary data were obtained as a result of measurements carried out on the days of the highest peak load. Data on seasonal fluctuations in passenger flows were also taken into account during this simulation.
Calculation of train station throughput during rush hours when installing disinfection gateways based on the data on availability of the entrance groups at the train stations (the Yaroslavsky, Kursky, Kazansky, Kievsky, Leningradsky, Belorussky, Savyolovsky, Paveletsky, and Rizhsky Stations) and the technical characteristics of the disinfection gateway of one of the manufacturers.
Evaluation of the impact of the disinfection gateway installation on the satisfaction of passengers and station visitors with servicing based on the comparison of the estimated time spent on passing the rail station entrance group and the allowable time spent on the passage to the station from the passengers’ viewpoint.
It should be noted as a limitation of the study that during the survey, and in the process of netnography research, the respondents’ attitude to the problem of the COVID-19 proliferation was not directly evaluated. The authors assumed that the perception of a possible virus infection hazard referred to the field of a general attitude to sanitary and epidemiological problems. When modeling, we used the parameters of one of the possible gateway options and, when using other models, the data obtained may differ. In the course of simulation based on statistical methods, the authors were guided by common limitations inherent in this approach that were described by Dubrov et al. [
47]. The impact of the pandemic was considered as a fluctuation that has a time-limited impact and does not affect the forecast values of future periods.
To assess the current passenger flow at Moscow train stations, the observation method was used, which has a number of disadvantages and limitations that should be considered when processing and using the results obtained by this method. The following shortcomings will be most significant with regard to the tasks set in our study.
It is impossible to draw conclusions from single observations of facts to patterns or to detect the determinants of events or behavior [
13]. This is especially relevant for our study, since the passenger flow was estimated at a certain, limited period of time during rush hours (in the morning and in the evening), on certain days of the week and only during one month of a calendar year (the study was conducted in December 2019).
This means that there is a probability of taking a passenger flow measurement at rush hour that is non-standard for the observed phenomenon, at a moment that could arise under the influence of uncontrolled, unpredictable and in no way observable factors. To reduce the negative impact of this drawback, in accordance with the methodology, passenger flow measurements were carried out several times at different time periods, but within the rush hours and on different days of the week. As a result, five measurements were made for each observation point. Such a number of measurements at each observation point makes it possible to apply mathematical and statistical methods later on that can smooth out possible significant fluctuations in the measurement results.
Additionally, in accordance with the developed methodology, the observers were not limited only to the passenger flow calculation. In case of difficulties for passenger flow transfer, the observers recorded this fact and made a comment that described the fact itself and, if possible, the reasons for its occurrence. Thus, the observers commented upon a sharp surge in passenger flow at the Kazansky Station at one of the entrances, in a separate measurement. According to this comment, a large tourist group came through this entrance at the time of the measurement, which determined a multiple increase in passenger flow.
Passenger flow at rail stations has significant seasonality and the peak passenger flow is typical for July and August. This limitation of the study is quite surmountable. To adjust estimates and forecast passenger flow, it is possible to use corrective factors for the results obtained during the field study.
Observation errors associated with the observer himself can arise because of the observer’s characteristics, in particular, to correctly perceive events, the observer’s readiness to register the necessary evaluation parameters. Errors can also arise because of circumstances that are not related to the observer himself but interfere with the necessary observations.
To reduce the impact of this shortcoming, the following was done in the framework of the study: instructions for observation were developed and observers were trained; training measurements of passenger traffic were conducted at key nodes of the rail station; in case of questions and problems during the study, observers had the opportunity of operational contact with the curators; the researchers informed the field work curator about the beginning and end of the observations, which made it possible to monitor the days and time when observers measured passenger flow; at each observation point and at the same time, two researchers conducted the observation, which reduced the possibility of errors in estimating passenger flow; in the event of circumstances hindering the measurement of passenger flow, observers interrupted the passenger count and started it again as soon as the correct circumstances arose; a short measurement period (5 min) made it possible to reduce the probability of an error in counting. In the event of an obstacle to the passenger flow counting, this time period provided an opportunity for the researchers to quickly finish and start anew measurement without significant moral and physical costs on part of the observers.
The research was also limited by the fact that the territory of the train station complexes is dynamically developing and changing, which leads to a change in the routes of passenger flows and affects passenger traffic at the station key nodes, at the rail station entrances/exits. In addition, the train station complexes are part of the urban transport infrastructure; hence, changes in the transport infrastructure associated with the station complexes will affect the passenger flow at the station entrances/exits.
The visual way of measuring the entrance throughput, including turnstiles of ticket validators, is an important limitation. In addition, when evaluating the effect of the disinfection gateway throughput, no studies and comparative analyses of gateways of different systems and manufacturers were conducted. When assessing the speed of passage through the gateway, experiments were not conducted. To accurately assess the required time, additional experiments should be conducted.
4. Results
4.1. Analysis of Secondary Data, and the Results of Netnography Research and a Survey on the Sanitary and Epidemiological Safety Perception
Our previous studies [
48] revealed that most passengers believe that measures to ensure transportation security are insufficient (55% of respondents). While studying the service component related to the sanitary and epidemiological situation, an analysis was made of the influence of travelling companions in dirty clothes and drunk passengers on the perception of the transport service quality. Most respondents noted that companions in dirty clothes and drunk passengers significantly decrease the transport service quality perception, reducing the travel experience.
We analyzed complaints and negative reviews from visitors and passengers of Moscow train stations over the period from 2018 to 2020. This analysis covered the official appeals of passengers to the directorate of rail stations, as well as the passengers and visitors’ feedback posted on the Internet. In total, 1062 appeals and reviews were analyzed. As a result, it was found that in general, more than 30% of all complaints and negative reviews account for the share of complaints about the sanitary–epidemiological situation within the territory of station complexes (
Table 1).
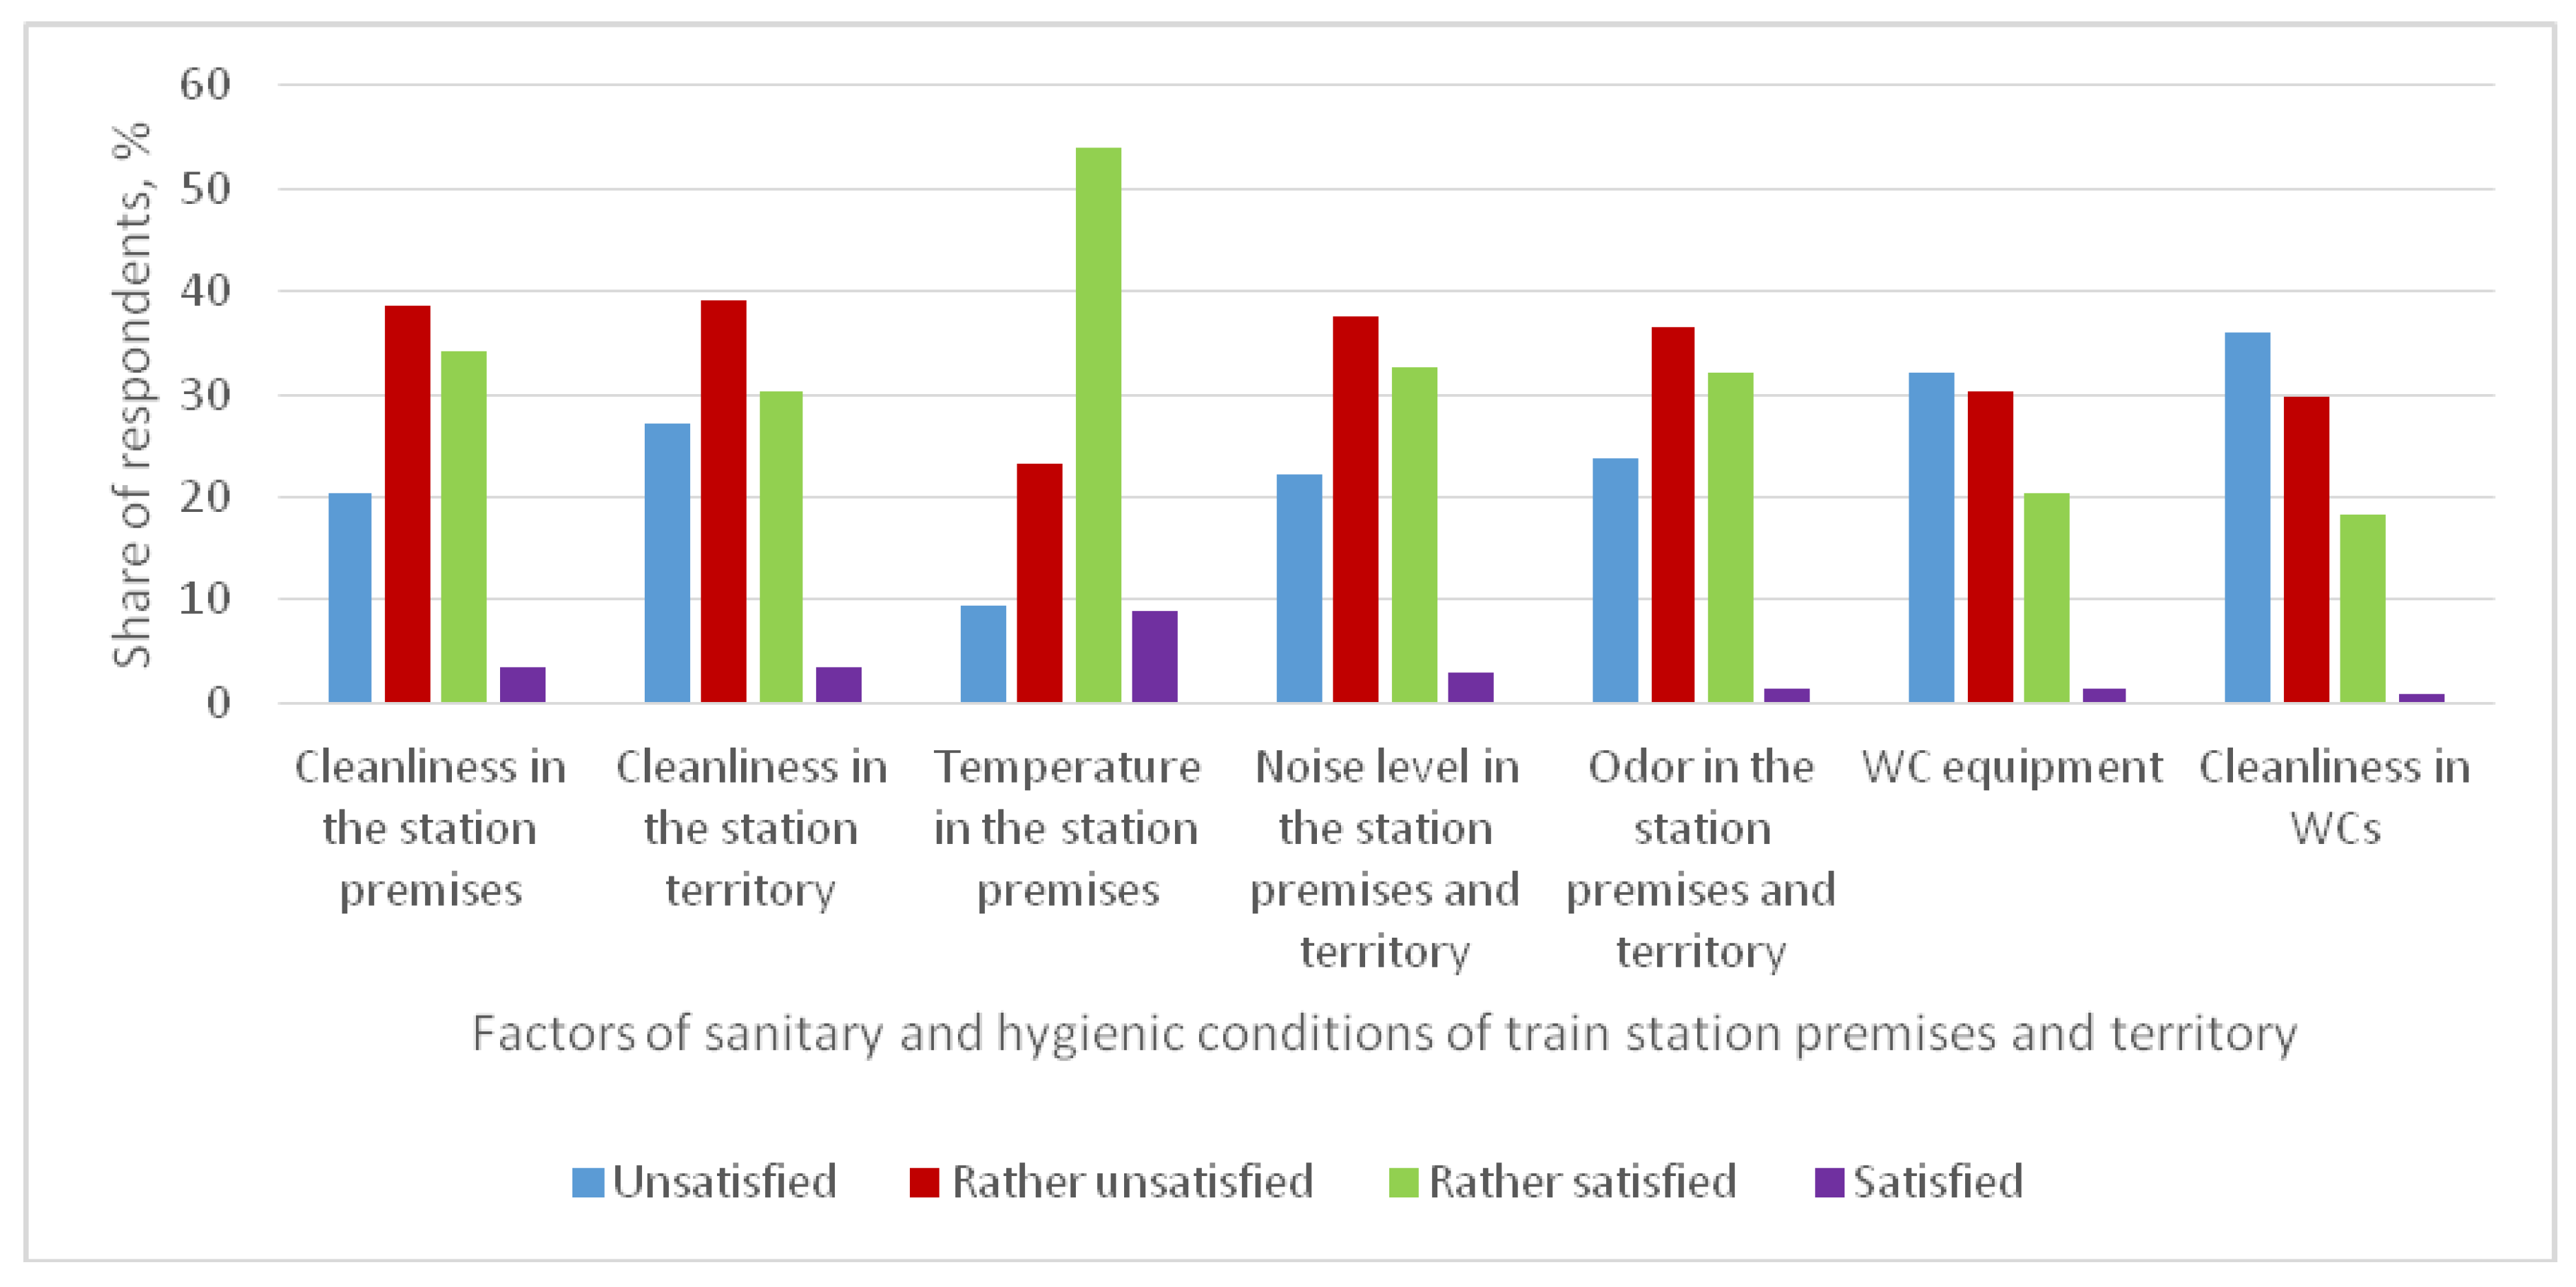
In total, 1183 persons took part in the online survey. Those who expressed dissatisfaction with the general conditions of their stay at the train station were asked a series of clarifying questions to determine the reasons for their dissatisfaction. As a result, 202 respondents expressed their dissatisfaction with the general conditions at the station. An analysis of the reasons for the expressed dissatisfaction was carried out among these respondents. We have obtained the following results. The degree of respondents’ satisfaction with the sanitary and hygienic conditions of the premises and the territory of the train stations is shown in
Figure 3.
An extremely low degree of satisfaction regarding all factors except the temperature in the train station premises should be noted. Thus, passengers as unsatisfactory evaluate most of the factors of stay, safety and the sanitary and epidemiological situation at Moscow rail stations. Answering the question about the types of pollution that are considered to be most significant at Moscow train station complexes, more than half of the respondents indicated dirt in the station premises and territory, extraneous odors at the station and visitors in dirty clothes with an unpleasant odor. All these problems have a serious impact on the sanitary and epidemiological situation at the stations.
To correlate the identified problems of the sanitary and epidemiological situation in transport in the context of the coronavirus pandemic, the current experience of installing disinfection gateways in some countries was analyzed. For example, in April 2020, in the United Arab Emirates (UAE), the Dubai Police installed a gate at the entrances and exits from the historic district, which was the first in Dubai to be closed to the strictest round-the-clock lockdown [
49].
According to a monitoring survey of Russians about an outbreak of a disease caused by coronavirus, its dangers and methods to deal with it, conducted by the All-Russian Center for the Public Opinion in Study in March 2020, 70% of Russians are worried about themselves or their relatives becoming ill. This share has increased by 18% since the beginning of February. At the same time, 64% of Russians consider that they can protect themselves from a disease caused by coronavirus [
50]. It can be mentioned that the public generally perceives the innovation with the installation of disinfection gateways quite positively, despite the lack of a sufficient amount of scientifically confirmed data on assessing the effectiveness and safety of aerosol spraying of certain products used in gateways onto a person in household clothes.
Train stations are part of the transportation hubs and a number of trading enterprises, as well as catering enterprises, are necessarily located within their territory. Thus, it is extremely important for rail stations to enhance preventive measures and strengthen the disinfection regime aimed at maintaining a favorable sanitary and epidemiological situation. Taking into account the possibility of equipping the entrances of rail stations with agents and equipment providing disinfection (disinfection gateways), the evaluation analysis of their various effects also requires passenger flow simulation at the train stations. The rail station entrances/exits were selected to obtain the predicted values of passenger flows during rush hours.
4.2. Simulation of the Forecast Flow of the Rail Station Visitors, Including the Parameters of Disinfection Gateway Passage
To forecast the passenger flow at rush hours at basic hubs, the authors used the data of preliminary studies (observations) and projected values of passenger flow at the stations, obtained by means of statistical forecasting methods. To develop the projected value, the data from secondary sources were used, namely informational internet portals [
45,
51,
52,
53,
54]. According to the regression analysis results, a model of passenger flow at railway stations and an assessment of its adequacy were developed. The values of the determination coefficient vary from 0.66 to 0.95. Therefore, the models clarify from 66% to 95% of the source data variance, suggesting acceptable indicators of the model adequacy.
According to the regression models, regarding the expected launch of the Moscow Central Diameter (MCD) rail lines, the forecast for passenger flow at rail stations for the period from 2020 to 2022 was developed.
Regarding the estimated population of Moscow and the passenger flow at the airports, as well as the estimated increase in passenger flow in commuter trains due to MCD launch, the projected values of passenger flow at Moscow rail stations were obtained (
Figure 4 and
Figure 5).
Then, base indexes of annual growth were calculated based on the data of 2019 (
Table 2).
There are no long-distance trains at the Savyolovsky Station. According to the data from
Table 2 and the forecasts from
Figure 4 and
Figure 5, the projected passenger flow at rail station entrances (entry groups) were calculated at rush hours (average number of passengers per 1 min) from 2020 to 2022 as the product of the annual index by passenger flow in 2019 (
Table 3).
It is worth highlighting that the passenger flow at the station is seasonal and its maximum is usually in July and August, and what is more, the rush hours remain. While estimating the average passenger flow per minute for the average monthly flow and the maximum passenger flow per minute in the summer months, the data of seasonal fluctuations in passenger flow were used. These data were obtained from the annual report by Joint Stock Company (JSC) Russian Railways for 2013 [
34,
55].
In accordance with the report, it was possible to calculate the coefficients for passenger flow alignment and for the passenger flow load for the entry groups at rail stations (average annual and maximum, i.e., the summer months). Coefficients and calculation formulas are introduced below (Formulas (1) and (2)).
where:
is a calculated value of the average annual passenger flow at the train station;
—calculated value of passenger flow at the train station, persons per minute;
—a ratio between the monthly passenger flow in December and the average monthly passenger flow. It was calculated basing on the data of the JSC Russian Railways on passenger flow during the year and equaled 0.80486.
The formula for calculating the maximum traffic load in the summer months is presented below (Formula (2)).
where:
is a calculated value of the average annual passenger flow at the train station;
—a calculated value of passenger flow at the train station, persons per minute;
—a ratio between monthly passenger flow in December and the maximum passenger flow in summer (August). It was calculated using the data of the JSC Russian Railways on passenger flow during the year and equaled 0.46605.
The results of calculations of the average annual flow and maximum flow for commuter trains and long-distance trains are introduced in
Table 4.
The forecast results contributed to the calculation of throughput at rush hour regarding the disinfection gateway installation. The disinfection gateway is a sanitary–technological device installed between the “clean” and “dirty” areas. It is designed to apply disinfectants to people. In addition, it can be equipped with non-contact sensors for body temperature measuring and other devices. It is suggested to install a disinfection gateway in front of the entry groups at the stations and in front of the traffic document validators at the entrances if there are some.
The analysis of throughput of the entry groups was carried out by measuring the passenger flows at the station. Observation data at the entry groups at the stations allowed us to estimate the average throughput for turnstile gates, considering the necessity for traffic document validation. Overall, the passage of one person takes about from 15 to 18 s. Thus, the throughput of one turnstile gate is from three to four persons per minute. The evaluation results for maximum throughput for all stations in the city of Moscow are introduced in
Table 5.
Throughput calculation for a disinfection gateway is similar to Yatagan “Depo Max” [
56]. The processing time for one person ranges from 2 to 3 s. Gateway dimension is 2150 mm (H)*900 mm (D)*1500 mm (W) (This type of gateway has been used in the Botkin Infectious Diseases Hospital in Moscow since 2014. Currently, they are used to process the ambulances, including those transporting patients with COVID-19.).
The processing itself lasts for 3 s. It is also necessary to add time to enter and exit the gateway area. It probably takes at least 2 s. Thus, the processing time for one passenger increases considering 2 s tolerance and equals 5 s (calculated values presented by the authors of the study). The throughput of one gateway is 12 s per minute.
With regard to the calculated time for one-person passage through the turnstile line (15–18 s) and the calculated the time for disinfection in the gateway (5 s), the time required for one person’s entry into the station increases by 30%. If it is necessary to maintain the throughput of the turnstile lines, installation of disinfection gateways behind the turnstile lines at the rate of one gateway per no more than three turnstile gates is recommended. Calculated values of the throughput of the entry groups, equipped with turnstile gates, at the rail stations in the city of Moscow, regarding the use of disinfection gateways, are presented in
Table 5.
Considering the number of entrances at the Yaroslavsky Station, it is necessary to install 28 disinfection gateways to maintain the throughput of turnstile lines. If the reduction in throughput by 30% is acceptable, then 19 disinfection gateways is sufficient. Similar calculations were conducted on the number of disinfection gateways at other stations.
At the Kazansky Station, it is necessary to install 39 disinfection gateways to maintain the throughput of turnstile lines and 27 disinfection gateways in case of throughput reduction by 30%. At the Belorussky Station, it is necessary to install 16 disinfection gateways for throughput maintenance and about 12 disinfection gateways if the throughput reduction is possible. The calculations for the Kievsky Station are as follows: 11 disinfection gateways to maintain the throughput and about 8 disinfection gateways with the throughput reduction by 30%. According to the number of entrances at the Paveletsky Station, it is necessary to install eight disinfection gateways to maintain the throughput of turnstile lines or six disinfection gateways, if reduction in throughput by 30% is possible. For the Kursky Station, the number of gateways is 11 and 8, respectively.
Regarding the number of entrances at the Savyolovsky Station, 11 disinfection gateways are to be installed to maintain the throughput of turnstile lines. If a reduction in throughput by 30% is acceptable, it is necessary to install about eight disinfection gateways. For the Rizhsky Station, three disinfection gateways are satisfactory to maintain the throughput and two disinfection gateways, suggesting a 30% reduction in throughput. Taking into consideration the number of entrances at the Leningradsky Station, it is necessary to install 20 disinfection gateways to maintain the throughput of turnstile lines: a line of 32 turnstiles requires 11 gateways, a line of 16 turnstiles—6 gateways, and a line of 8 turnstiles—3 gateways. If the throughput reduction by 30% is acceptable, it is necessary to install about 14 disinfection gateways at the Leningradsky Station.
Entry groups at the station can be fitted with stationary screening equipment, which usually includes arched metal detector and introscopes. According to the observation results, the throughput of the entry group equipped with one arch and an introscope is about 20 persons per minute, i.e., 3 s per one person. This means that the installation of the disinfection gateway will almost double the entry time for one passenger, at the estimated time of 5 s for the passage through the disinfection gateway. The throughput of entry groups equipped with stationary screening equipment was adjusted to these reasoning (
Table 6).
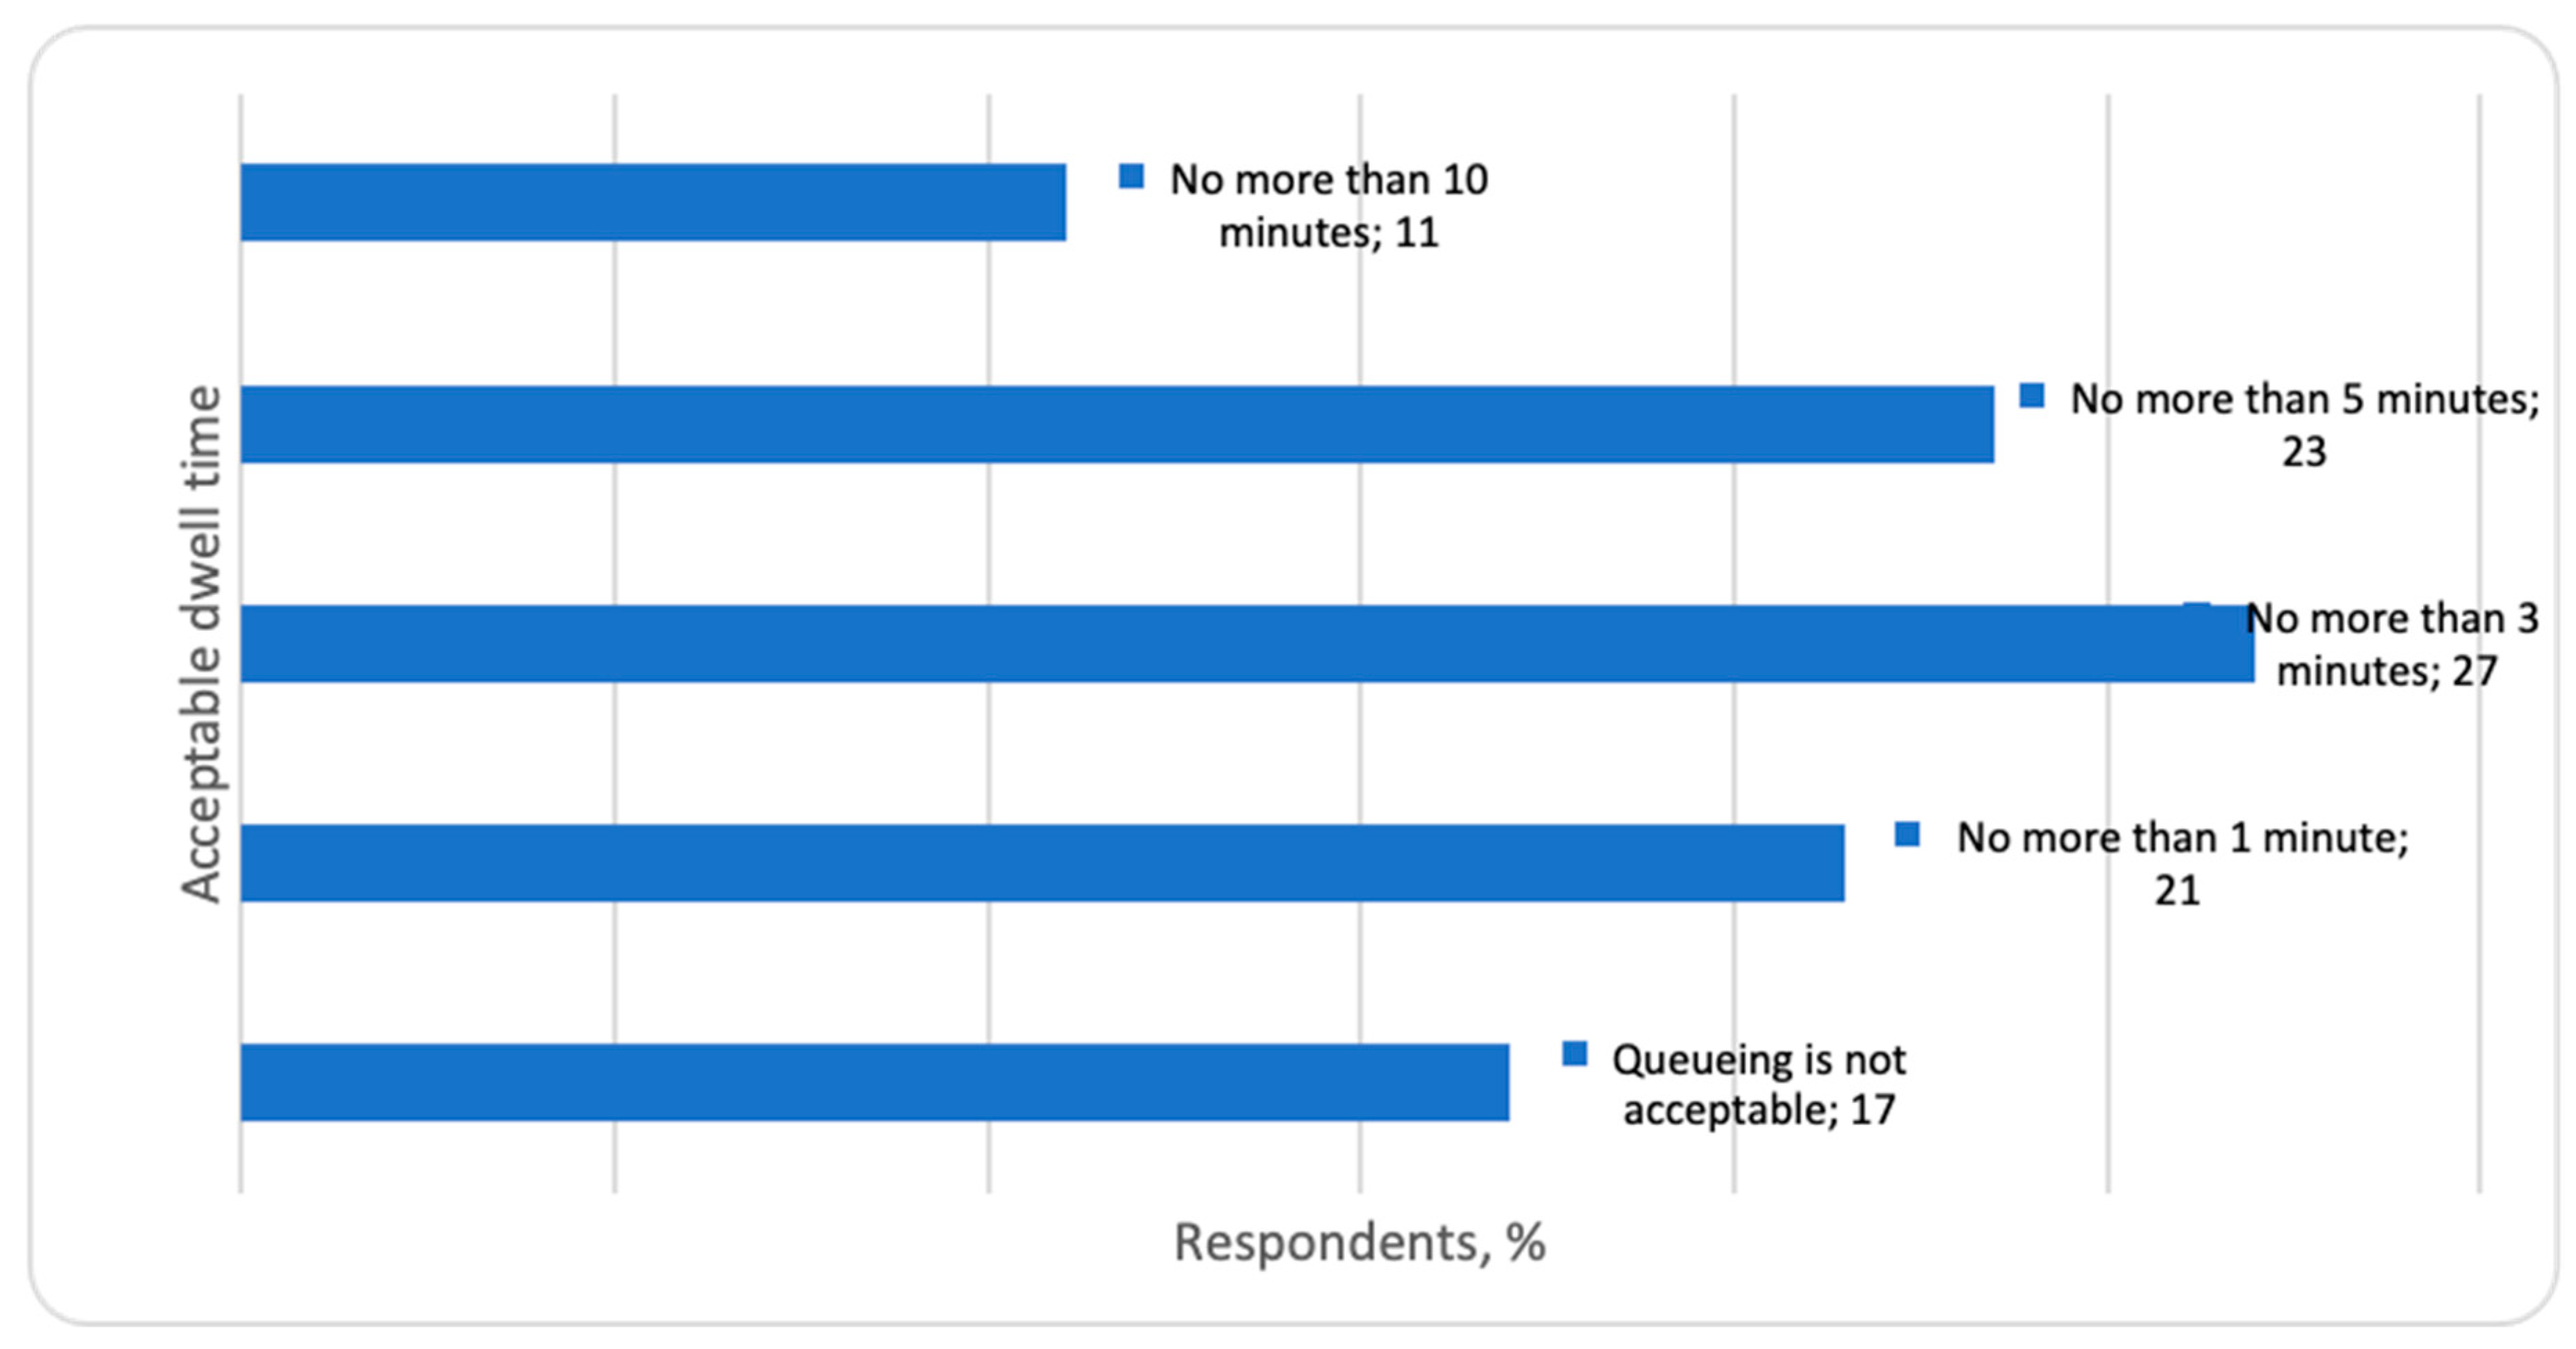
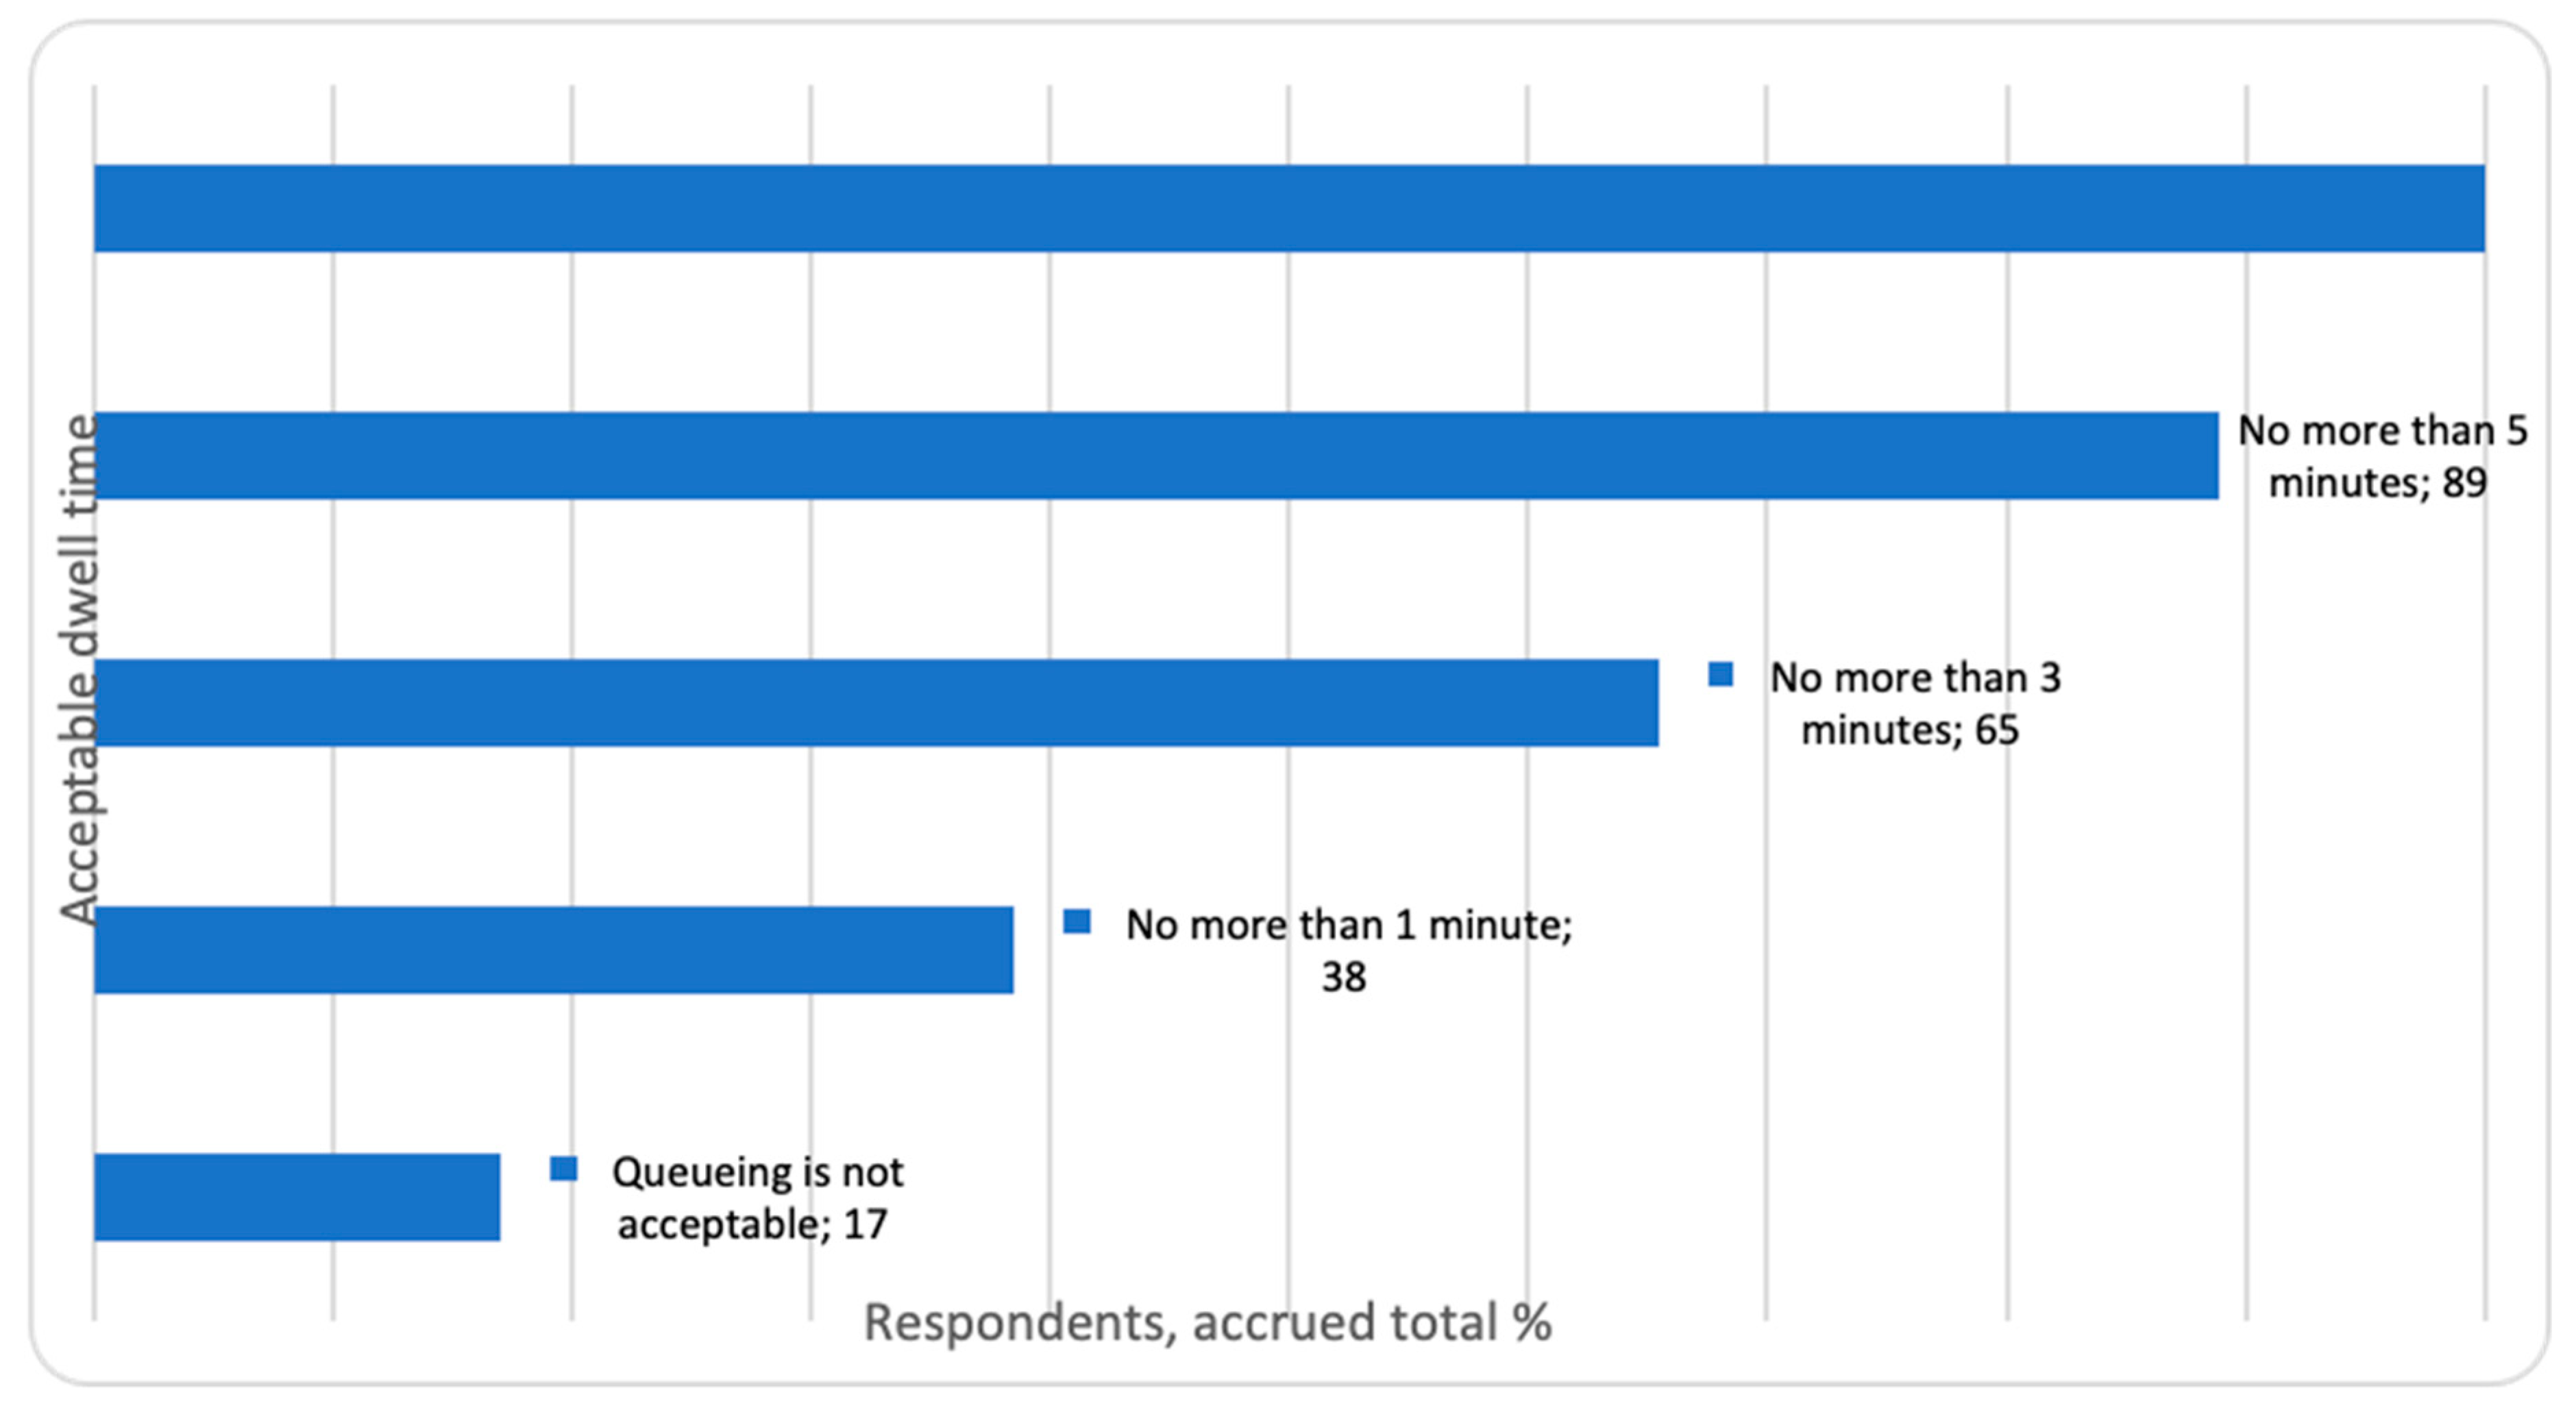
According to the obtained results, the authors analyzed the impact of the disinfection gateway installation on the passengers’ satisfaction with a transport service. Since the installation of a disinfection gateway extends the time of passage through the entry groups, the comparison of the time of the passage through the disinfection gateway and the time that passengers are ready to spend on entering/leaving the station is recommended. In the framework of an online survey, respondents were asked what period they considered acceptable at the station entrance/exit. The results were presented in
Figure 6 and
Figure 7 as a progressive total.
Almost 90% of respondents agree to wait for no more than 5 min in a queue at the rail station entrance, about 2/3—for no more than 3 min, and 38%—for no more than 1 min. The authors proceed with the analysis of the correspondence of the throughput of the station entry groups to the passenger flow during rush hours and the evaluation of the possible impact of the disinfection gateway installation on the throughput of the entry groups. Therefore, it would be possible to estimate the influence on the rail station passengers and visitors’ satisfaction if these measures contribute to the passage time increase. The results of the evaluation of the throughput of entry groups at the rail station and the forecast of the annual average passenger flow and for the months of maximum load are introduced in
Table 7 and
Table 8.
Table 7 shows that for the Yaroslavsky, Kursky, Kazansky, and Kievsky Stations, the installation of disinfection gateways after turnstile lines should not increase the time of passage to the commuter rail platforms, even if the installation of disinfection gateways leads to a 30% reduction in the throughput of turnstile lines. The throughput of the turnstile lines corresponds to the passenger flow to commuter rail.
For the Savyolovsky Station, the installation of disinfection gateways with a reduction in the throughput of the entry groups will correspond to the average annual passenger flow, although, during the summer months, in view of the growth in passenger flow, the throughput of the turnstile groups will no longer correspond to the load. However, a sufficient number of disinfection gateways to maintain the existing throughput of turnstile lines will fully match the passenger flow even during peak load months.
For the Leningradsky, Paveletsky and Belorussky Stations, taking into account the average annual passenger flow, the installation of disinfection gateways allows us to cope with the passenger flow; however, the throughput of turnstile lines during the summer months is not sufficient. Regarding the excess of the throughput of the turnstile lines, a queue will be formed after 10–20 min, leading to waiting times in excess of the acceptable dwell time (5 min) indicated by the passengers in the survey.
The situation with the passenger flow at the Rizhsky Station differs from other Moscow stations’, as the passenger flow here is extremely low and is characterized by a significant fluctuation. At this station, there is no increase in passenger flow during rush hours. Passenger flow at the Rizhsky Station is formed shortly before a train arrival or departure.
The analysis of the data on the forecast of passenger flow for long-distance trains and throughput of the entry groups, fitted with stationary screening equipment, shows that the installation of disinfection gateways will not cause queues at the entrances which exceed the acceptable dwell time at entrance/exit for most respondents. However, there is a significant excess of the throughput of the entry groups at the Kazansky and Leningradsky Stations during the months of peak load. At the Rizhsky Station, the throughput of the entry groups is also lower than the observed passenger flow. The passenger flow of this intensity is observed only at the time of train’s departure or arrival and does not depend on rush hour.
5. Discussion
As found in previous studies, most passengers consider the measures for ensuring transport safety insufficient (55% of respondents) [
48]. In the framework of investigation of the service component related to the sanitary–epidemiological situation, the influence of the travel companions in dirty clothes and drunken passengers’ presence on the perception of the transport service quality was analyzed. Most respondents noted that such companions and passengers significantly reduced the perception of the transport service quality, reducing trip comfort. This conclusion is in line with previous recommendations by Eboli and Mazzulla [
15] and expands the understanding of components of perceived service quality especially components of trip comfort.
Mud in the station premises and territory, extraneous odors at the station and visitors in dirty clothes with an unpleasant odor have a serious impact on the visitors’ perceptions of the sanitary and epidemiological situation at the stations. An extremely low degree of satisfaction regarding all these factors (
Figure 3) creates a very negative impact on total perceived quality of the transport service. There are some potential explanations for this situation, however. The respondents with limited experience of the relevant public transport systems are able to express opinions about them in the survey; as a result the level of satisfaction might be even less related to the actual transport system. In addition, customers responding to questions about their current satisfaction might nonetheless take previous experience and their expectations of future improvements into consideration when answered [
16].
Currently, the sense of security has been compromised because of the increase in the customers’ requirements to predict the distribution of coronavirus and the need for social distancing, and requires the inclusion of service parameters that can ensure personal and public sanitary–epidemiological safety. For this purpose, the reorganization of the entry groups into rail stations is required.
The authors of the present study suggest that, in pandemic conditions, a negative attitude toward travel companions can be transmitted towards the passengers without masks. In this regard, disinfection measures at the stations entrance (gateway installation) can increase a sense of security. Moreover, the survey conducted by the authors of the present work contributes to the conclusion that, for visitors and passengers of Moscow rail stations, sanitary–epidemiological safety is an element of customer service value. It influences customer satisfaction, and must be taken into account when making management decisions on the development and improvement of the services at the stations. This conclusion is consistent with the reasoning introduced in numerous research works [
25].
Thus, the authors confirmed the hypothesis that security issues, including sanitary–epidemiological safety, significantly affect the perceived quality of rail station visitors’ servicing. It can be concluded that, in order to change the objective quality parameters of the transport service at rail stations in terms of security, it is necessary to handle not only the objective parameters (managerial, technological, sanitary–epidemiological standards), but also to analyze the impact of the subjective sense of the security of the station passengers and visitors. The findings also confirm previous research results of the relationship between the objective performance measures of public transport services and the satisfaction perceived by travelers (e.g., [
16,
35]). In this context, disinfection gateways can be used, as described in the literature [
10], although it is necessary to consider actual and subsequent medical and sanitary–epidemiological recommendations specified in the literature [
29,
30], but not investigated in the present study.
Flow simulation at stations, regarding the use of disinfection gateways, made it possible to forecast passenger flow until 2022. The applied method of statistical forecasting is one of the most comprehensive approaches to simulation of flows at the stations [
19,
20,
42]. The undoubted advantage of the method used in this work is the possibility of utilizing historical data to forecast passenger flows, in contrast to most methods of simulation modeling.
It should be said that researchers usually use different factors in order to forecast the passenger flow trend [
18,
41,
57]. Linear or nonlinear regression models have been developed that attempt to link passenger demands and other contributing factors such as demographics, economic features, transit attributes, and geographic information [
57]. Lu et al. [
41] offered the use of similarity of passenger flow trends in the stations and the historical passenger flow database. The authors used historical passenger flow data of Guangzhou Metro to verify the forecasting accuracy and calculation efficiency of their proposed method [
41].
These findings confirm the importance of further exploring factors that affect the dimension of passenger flow, such as population growth rate of the region and related regions, passenger flow dynamics at airports, or the impact of launching new lines, new metro stations and train stations on the passenger flow of studied train stations. In this article, the regression model was developed based on the assumed commissioning of the Moscow Central Diameter rail lines, evaluation of the statistical relationship between the variables characterizing passenger flows at train stations and airports, as well as the population size. This also confirms previous research results and extends the knowledge in passenger flow prediction for train stations.
The success of passenger railway stations depends on the population they serve and thus existing entrance and exit gates (the entry groups) to give pedestrians access from street network to boarding/alighting facilities and vice versa. Moreover, stations will be able to benefit more significantly by increasing accessibility and increasing the speed of walking through the gate [
18]. Of course, any time saving benefits should not be able to jeopardize the level of security of passengers that is required in rail stations.
On one hand, the concept of transportation security is expanding, including sanitary and epidemiological safety in the context of a virus pandemic. It means that new equipment such as the latest smart systems, for example disinfection gateways, should be installed. On the other hand, differentiated equipment is expressed in time to entry for passengers, passenger density on the entrance and platform, and passenger dissatisfaction [
21]. The dissatisfaction of the passengers due to discomfort at crowded stations was confirmed by earlier investigations [
20]. Thus, the estimation of the impact of the disinfection gateway installation on the forecast of passenger flows and study of negative affect on passengers’ satisfaction because of the increased time of the passengers’ entry into rail stations allow us to give some recommendations for pedestrian traffic management through the entry groups in rail stations.
Research limitations are determined by the research methodology that is described in detail in the corresponding section. It should be noted as a limitation of the study that the analysis of the passenger flows, obtained by means of simulation, cannot accurately reflect the situation at the entrances after installing the gateway. One of the major limitations is the inability to construct a model covering all aspects of passenger behavior at the station entrance.
6. Conclusions
As we already know there are no obligatory link between traveler satisfaction measures and objective performance measures in public transport. It means that an objectively “better” system does not necessarily indicate a high level of passengers’ satisfaction and vice versa [
16]. We welcome future studies to examine our findings and study the link between passenger satisfaction measures and objective performance measures in rail stations to find out more about passengers’ satisfaction and how it corresponds with objective performance measures. A relevant area of study would be to look at what part of the objective attributes of the rail station performance is responsible for how satisfied the visitor and passengers are with rail station services and public transport.
As we know little of the satisfaction of the people who lack any real alternatives, it would be interesting to conduct a study among these public transport users. In addition, our knowledge would benefit from further studies of satisfaction of the non-sustainable-users (e.g., car-users) for instance by looking at current satisfaction and their perceptions of service quality of railway transport.
Another important area for future study would be the adequate models for forecasting the passenger flow trend. These models are required in pedestrian simulation tools to optimize station design. The use of the video cameras in observation to measure the visitor flow at station entrances can improve the quality of collected data and explain the effects of the physical environment (stepping gap, height difference, and door width), population (age, gender), flow composition (direction, time pressure, luggage, the train station entrance/exit group size, queuing discipline), and prevailing traffic conditions (crowding at station entrances). From the video images, pedestrian trajectories could be derived, along with the effects of the presence of luggage on the door capacity [
14].
Currently, there are still very few practical data and theoretical studies that would allow the assessment of the impact of disinfection locks on the throughput of railway stations, as well as their impact on the satisfaction of passengers and visitors at the stations, and the impact on the perception of the quality of transport services. However, the importance of modeling passenger flow, as well as the dependence of the success of the transport system on the capacity of the entrance groups, is beyond doubt. Therefore, experiments in order to study the entrances after installing the gateway and the simulation of passenger flow for estimation of the impact on passengers’ satisfaction is also interesting to study.
The analysis of the passenger flows, obtained by means of the simulation, showed that in most cases, the equipment at the entry groups of the stations is sufficient to cope with the passenger flow during rush hours and even in the months with maximum load. The researchers introduced two scenarios for installing disinfection gateways, such as with the maintenance of the entry groups’ throughput and with its possible reduction. For some Moscow stations, even a decrease in the throughput of entry groups will not cause a significant increase in dwell time at the entrance.
It is necessary to evaluate the interdependence of various quality parameters of the transport service. Thus, the improvement of safety parameters at rail station services and especially the introduction of additional technology for ensuring socio-epidemiological safety (disinfection gateways) can increase the entry time into the station and consequently affect perceptions of the transport service quality. According to the online survey results, the acceptable dwell time to access the station was no more than five minutes for 90% of the respondents.
The results of the passenger flow simulation allow us to conclude that in the case of the Yaroslavsky, Kursky, Kazansky, and Kievsky Stations, the installation of disinfection gateways after turnstile lines will not delay passage toward the commuter rail platforms, even if the installation of disinfection gateways causes a 30% reduction in the throughput of the turnstile lines.
At the Savyolovsky Station, to prevent an excess of the entry dwell time, the number of disinfection gateways should be sufficient for the maintenance of the actual throughput of the turnstile lines (11 disinfection gateways as shown above).
For the Leningradsky, Paveletsky and Belorussky Stations, in view of the average annual passenger flow, the installation of disinfection gateways allows us to cope with the passenger flow; however, the throughput of turnstile lines during the summer months is not sufficient. Regarding the excess of the throughput of the turnstile lines, a queue will form after 10–20 min, leading to the waiting time becoming in excess of the acceptable dwell time (five minutes) indicated by the passengers in the survey.
Passenger flow at the Rizhsky Station is formed shortly before a train arrival or departure. At this station, there is no increase in flow in the morning and evening rush hours. Despite the significant fluctuation in passenger flow at the station, the authors of the study consider it necessary to increase the throughput of the entrance groups.
At the rail stations in the city of Moscow, throughput of the entrance groups fitted with stationary screening equipment, after installing disinfection gateways, will not cause queues at the entrances, which can lead to waiting times exceeding the acceptable dwell time at entrance/exit for most respondents. However, there is a significant excess of the throughput of the entry groups at the Kazansky and Leningradsky Stations during the peak load months. Therefore, the hypothesis that the installation of disinfection gateways will not significantly affect the accessibility of rail station entrances is partially confirmed.
At the Kazansky and Leningradsky Rail Stations, installation of disinfection gateways leads to a decrease in the objective parameters of the quality of services, since the formation of queues at the entrance leads to the social distance violation. The authors point out that the disinfection gateway installation at rail stations requires changing the flow parameters at the entrances. Therefore, it is necessary to extend the entry groups or use additional entrances into the stations. Finally, it is worth highlighting that the installation of the disinfection gateways at rail stations in other cities requires a similar analysis of the visitor flow forecast at the station entrances.


