Concept Model to Measure the Thriving at Work (TAW): Developing and Applying

 ,
, 
Abstract
1. Introduction
1.1. Why is Thriving at Work An Issue?
1.2. Research Objectives and Questions
2. Literature Review and Definitions of TAW
2.1. Measurement of TAW
2.2. Requirement for Sample Size in Exploratory and Confirmatory Factor Analyses
2.3. Development and Tests of the TAW Scale
3. Discussion: A TAW Instruments and Open Innovation
4. Conclusions
4.1. Theoretical Implications
4.2. Practical Implications
4.3. Research Limitations
Author Contributions
Funding
Conflicts of Interest
References
- Jiang, Z.; Jiang, Y.; Nielsen, I. Workplace thriving in China. Int. J. Manpow. 2019, 40, 979–993. [Google Scholar] [CrossRef]
- Spreitzer, G.; Sutcliffe, K.; Dutton, J.; Sonenshein, S.; Grant, A.M. A socially embedded model of thriving at work. Organ. Sci. 2005, 16, 537–549. [Google Scholar] [CrossRef]
- Zhai, Q.; Wang, S.; Weadon, H. Thriving at work as a mediator of the relationship between workplace support and life satisfaction. J. Manag. Organ. 2017, 1, 1–17. [Google Scholar] [CrossRef]
- Spreitzer, G.; Bacevice, P.; Garrett, L. Workplace design, the physical environment, and human thriving at work. In Organizational Behaviour and the Physical Environment; Ayoko, O.B., Neal, M.A., Eds.; Routledge: London, UK, 2019; pp. 235–250. [Google Scholar]
- Kleine, A.-K.; Rudolph, C.W.; Zacher, H. Thriving at work: A meta-analysis. J. Organ. Behav. 2019, 40, 973–999. [Google Scholar] [CrossRef]
- Chang, W.; Busser James, A. Hospitality career retention: The role of contextual factors and thriving at work. Int. J. Contemp. Hosp. Manag. 2020, 32, 193–211. [Google Scholar] [CrossRef]
- Chiamaka, O.J.-A.; Stephen, E.I.; Collins, I.N. Leader-member Exchange and Transformational Leadership Style: A Prediction to Thriving at Work. Asian J. Adv. Res. Rep. 2020, 12, 37–43. [Google Scholar] [CrossRef]
- Liu, Y.; Xu, S.; Zhang, B. Thriving at work: How a paradox mindset influences innovative work behavior. J. Appl. Behav. Sci. 2020, 56, 347–366. [Google Scholar] [CrossRef]
- Porath, C.; Spreitzer, G.; Gibson, C.; Garnett, F.G. Thriving at work: Toward its measurement, construct validation, and theoretical refinement. J. Organ. Behav. 2012, 33, 250–275. [Google Scholar] [CrossRef]
- Xu, A.J.; Loi, R.; Chow, C.W.C. What threatens retail employees’ thriving at work under leader-member exchange? The role of store spatial crowding and team negative affective tone. Hum. Resour. Manag. 2019, 58, 371–382. [Google Scholar] [CrossRef]
- Sun, Y.; Zhu, M.; Zhang, Z.J. How Newcomers’ Work-Related Use of Enterprise Social Media Affects Their Thriving at Work—The Swift Guanxi Perspective. Sustainability 2019, 11, 2794. [Google Scholar] [CrossRef]
- Abid, G.; Contreras, F.; Ahmed, S.; Qazi, T. Contextual factors and organizational commitment: Examining the mediating role of thriving at work. Sustainability 2019, 11, 4686. [Google Scholar] [CrossRef]
- Baréz-Brown, C. Shine: How to Survive and Thrive at Work; Penguin: New York, NY, USA, 2012. [Google Scholar]
- Luecha, T.; Yoongtomg, K. Concept and Measurement of Happiness at Work. Acad. J. Phetchaburi Rajabhat Univ. 2017, 19, 9–18. [Google Scholar]
- Chalermthanakijkosol, K. Acee Management International limited. Bangkok, Thailand. Personal Interview, 29 May 2020. [Google Scholar]
- Joungtrakul, J. Far East University, Eumseong-gun, Chungcheongbuk-do 27601, Korea. Personal Interview, 29 July 2019. [Google Scholar]
- Maslow, A.H. A theory of human motivation. Psychol. Rev. 1943, 50, 370–396. [Google Scholar] [CrossRef]
- Rogers, C. On Becoming a Person: A Therapist’s View of Psychotherapy; Constable: London, UK, 1961. [Google Scholar]
- Alderfer, C. Existence, Relatedness, and Growth; Human Needs in Organizational Settings; Free Press: New York, NY, USA, 1972. [Google Scholar]
- Saakvitne, K.W.; Tennen, H.; Affleck, G. Exploring thriving in the context of clinical trauma theory: Constructivist self development theory. J. Soc. Issues 1998, 54, 279–299. [Google Scholar] [CrossRef]
- Calhoun, L.G.; Tedeschi, R.G. Beyond recovery from trauma: Implications for clinical practice and research. J. Soc. Issues 1998, 54, 357–371. [Google Scholar] [CrossRef]
- Ickovics, J.R.; Park, C.L. Paradigm shift: Why a focus on health is important. J. Soc. Issues 1998, 54, 237–244. [Google Scholar] [CrossRef]
- Halbesleben, J.R.B.; Harvey, J.; Bolino, M.C. Too engaged? A conservation of resources view of the relationship between work engagement and work interference with family. J. Appl. Psychol. 2009, 94, 1452–1465. [Google Scholar] [CrossRef]
- Thomas, S.P.; Hall, J.M. Life trajectories of female child abuse survivors thriving in adulthood. Qual. Health Res. 2008, 18, 149–166. [Google Scholar] [CrossRef]
- Paterson, T.A.; Luthans, F.; Jeung, W. Thriving at work: Impact of psychological capital and supervisor support. J. Organ. Behav. 2014, 35, 434–446. [Google Scholar] [CrossRef]
- Niessen, C.; Sonnentag, S.; Sach, F. Thriving at work—A diary study. J. Organ. Behav. 2012, 33, 468–487. [Google Scholar] [CrossRef]
- Bensemmane, S.; Ohana, M.; Stinglhamber, F. Team justice and thriving: A dynamic approach. J. Manag. Psychol. 2018, 33, 229–242. [Google Scholar] [CrossRef]
- Li, M.; Liu, W.; Han, Y.; Zhang, P. Linking empowering leadership and change-oriented organizational citizenship behavior: The role of thriving at work and autonomy orientation. J. Organ. Chang. Manag. 2016, 29, 732–750. [Google Scholar] [CrossRef]
- Spreitzer, G.M.; Lam, C.F.; Fritz, C. Engagement and human thriving: Complementary perspectives on energy and connections to work. In Work Engagement: A Handbook of Essential Theory and Research; Bakker, A.B., Leiter, M.P., Eds.; Psychology Press: London, UK, 2010; pp. 132–146. [Google Scholar]
- Piniel, K.; Albert, Á. Motivation and flow. In The Palgrave Handbook of Motivation for Language Learning; Springer: Berlin, Germany, 2019; pp. 579–597. [Google Scholar]
- Yang, Y.; Li, Z.; Liang, L.; Zhang, X. Why and when paradoxical leader behavior impact employee creativity: Thriving at work and psychological safety. Curr. Psychol. 2019, 1–12. [Google Scholar] [CrossRef]
- Kibler, E.; Wincent, J.; Kautonen, T.; Cacciotti, G.; Obschonka, M. Can prosocial motivation harm entrepreneurs’ subjective well-being? J. Bus. Ventur. 2019, 34, 608–624. [Google Scholar] [CrossRef]
- Schaufeli, W.B.; Bakker, A.B. Defining and measuring work engagement: Bringing clarity to the concept. In Work Engagement: A Handbook of Essential Theory and Research, Bakker, A.B., Leiter, M.P., Eds.; Pshychology Press: New York, NY, USA, 2010; Volume 12, pp. 10–24. [Google Scholar]
- Jaiswal, N.; Dhar, R. The influence of servant leadership, trust in leader and thriving on employee creativity. Leadersh. Organ. Dev. J. 2017, 38, 2–21. [Google Scholar] [CrossRef]
- Sia, S.K.; Duari, P. Agentic work behaviour and thriving at work: Role of decision making authority. Benchmarking Int. J. 2018, 25, 3225–3237. [Google Scholar] [CrossRef]
- Hogarty, K.Y.; Hines, C.V.; Kromrey, J.D.; Ferron, J.M.; Mumford, K.R. The quality of factor solutions in exploratory factor analysis: The influence of sample size, communality, and overdetermination. Educ. Psychol. Meas. 2005, 65, 202–226. [Google Scholar] [CrossRef]
- MacCallum, R.C.; Widaman, K.F.; Preacher, K.J.; Hong, S. Sample size in factor analysis: The role of model error. Multivar. Behav. Res. 2001, 36, 611–637. [Google Scholar] [CrossRef]
- MacCallum, R.C.; Widaman, K.F.; Zhang, S.; Hong, S. Sample size in factor analysis. Psychol. Methods 1999, 4, 84–99. [Google Scholar] [CrossRef]
- Velicer, W.F.; Fava, J.L. Affects of variable and subject sampling on factor pattern recovery. Psychol. Methods 1998, 3, 231–251. [Google Scholar] [CrossRef]
- Abid, G.; Sajjad, I.; Elahi, N.S.; Farooqi, S.; Nisar, A. The influence of prosocial motivation and civility on work engagement: The mediating role of thriving at work. Cogent Bus. Manag. 2018, 5, 1–19. [Google Scholar] [CrossRef]
- Nawaz, M.; Abid, G.; Arya, B.; Bhatti, G.A.; Farooqi, S. Understanding employee thriving: The role of workplace context, personality and individual resources. Total Qual. Manag. Bus. Excell. 2018, 31, 1–18. [Google Scholar] [CrossRef]
- Rovinelli, R.J.; Hambleton, R.K. On the use of content specialists in the assessment of criterion-referenced test item validity. In Proceedings of the 60th Annual Meeting of the American Educational Research Association, San Francisco, CA, USA, 19–23 April 1976; pp. 2–37. [Google Scholar]
- Henrysson, S. Correction of item-total correlations in item analysis. Psychometrika 1963, 28, 211–218. [Google Scholar] [CrossRef]
- Bonett, D.G.; Wright, T.A. Cronbach’s alpha reliability: Interval estimation, hypothesis testing, and sample size planning. J. Organ. Behav. 2015, 36, 3–15. [Google Scholar] [CrossRef]
- Stevens, J.P. Applied Multivariate Statistics for the Social Sciences, 5th ed.; Routledge: London, UK, 2012. [Google Scholar]
- Gillespie, D.F.; Mileti, D.S. Heterogeneous Samples in Organizational Research. Sociol. Methods Res. 1981, 9, 375–388. [Google Scholar] [CrossRef]
- Anderson, T.R.; Warkov, S. Organizational Size and Functional Complexity: A Study of Administration in Hospitals. Am. Sociol. Rev. 1961, 26, 23–28. [Google Scholar] [CrossRef]
- Hinings, C.R.; Bryman, A. Size and the administrative component in churches. Hum. Relat. 1974, 27, 457–475. [Google Scholar] [CrossRef]
- Chan, L.L.; Idris, N. Validity and reliability of the instrument using exploratory factor analysis and Cronbach’s alpha. Int. J. Acad. Res. Bus. Soc. Sci. 2017, 7, 400–410. [Google Scholar]
- Watkins, M.W. Exploratory factor analysis: A guide to best practice. J. Black Psychol. 2018, 44, 219–246. [Google Scholar] [CrossRef]
- Kumar, R.; Kumar, V.; Sharma, V.; Legendre, P.; Legendre, L.; Cattell, R.B.; Szymanska, E.; Gerretzen, J.; Engel, J.; Geurts, B. Common Factor Analysis Versus Principal Component Analysis: Differential Bias in Representing Model Parameters. Appl. Spectrosc. 2016, 70, 1598–1601. [Google Scholar]
- Kyriazos, T.A. Applied psychometrics: Sample size and sample power considerations in factor analysis (EFA, CFA) and SEM in general. Psychology 2018, 9, 2207–2230. [Google Scholar] [CrossRef]
- Turner, R.C.; Carlson, L. Indexes of item-objective congruence for multidimensional items. Int. J. Test. 2003, 3, 163–171. [Google Scholar] [CrossRef]
- Hair, J.; Black, W.C.; Babin, B.J.; Anderson, R.E.; Tatham, R. Multivariate Data Analysis; Pearson Education: Upper Saddle River, NJ, USA, 2010. [Google Scholar]
- Kline, R.B. Principles and Practice of Structural Equation Modeling; Guilford publications: New York, NY, USA, 2015. [Google Scholar]
- Kim, J.; Mueller, C.W. Factor Analysis: Statistical Methods and Practical Issues; Sage: London, UK, 1978. [Google Scholar]
- Na-nan, K.; Saribut, S. Development and validation of an organisational commitment instrument for generation Y employees in small and medium-sized enterprises in Thailand. Ind. Commer. Train. 2019, 51, 244–255. [Google Scholar] [CrossRef]
- Zaiţ, A.; Bertea, P. Methods for testing discriminant validity. Manag. Mark. J. 2011, 9, 217–224. [Google Scholar]
- Fornell, C.; Larcker, D.F. Structural Equation Models with Unobservable Variables and Measurement Error: Algebra and Statistics; SAGE Publications: Los Angeles, CA, USA, 1981. [Google Scholar]
- Na-Nan, K.; Sanamthong, E. Self-efficacy and employee job performance: Mediating effects of perceived workplace support, motivation to transfer and transfer of training. Int. J. Qual. Reliab. Manag. 2019, 37, 1–17. [Google Scholar] [CrossRef]
- Na-Nan, K. Employee work adjustment scale for small and medium-sized enterprises in Thailand. Int. J. Qual. Reliab. Manag. 2019, 36, 1284–1300. [Google Scholar] [CrossRef]
- Riaz, S.; Xu, Y.; Hussain, S. Understanding employee innovative behavior and thriving at work: A Chinese perspective. Adm. Sci. 2018, 8, 46. [Google Scholar] [CrossRef]
- Wang, Z.; Meng, L.; Cai, S. Servant leadership and innovative behavior: A moderated mediation. J. Manag. Psychol. 2019, 34, 505–518. [Google Scholar] [CrossRef]
- van de Vrande, V.; de Jong, J.P.J.; Vanhaverbeke, W.; de Rochemont, M. Open innovation in SMEs: Trends, motives and management challenges. Technovation 2009, 29, 423–437. [Google Scholar] [CrossRef]
- Yun, J.J.; Zhao, X.; Wu, J.; Yi, J.C.; Park, K.; Jung, W. Business Model, Open Innovation, and Sustainability in Car Sharing Industry—Comparing Three Economies. Sustainability 2020, 12, 1883. [Google Scholar] [CrossRef]
- Yun, J.J.; Won, D.; Park, K. Entrepreneurial cyclical dynamics of open innovation. J. Evol. Econ. 2018, 28, 1151–1174. [Google Scholar] [CrossRef]
- Chiaroni, D.; Chiesa, V.; Frattini, F. Unravelling the process from Closed to Open Innovation: Evidence from mature, asset-intensive industries. R d Manag. 2010, 40, 222–245. [Google Scholar] [CrossRef]
- Yun, J.J.; Liu, Z. Micro-and macro-dynamics of open innovation with a quadruple-helix model. Sustainability 2019, 11, 3301. [Google Scholar] [CrossRef]
- Pukkeeree, P.; Na-Nan, K.; Wongsuwan, N. Effect of attainment value and positive thinking as moderators of employee engagement and innovative work behaviour. J. Open Innov. Technol. Mark. Complex. 2020, 6, 69. [Google Scholar] [CrossRef]
- Schaufeli, W.B.; Bakker, A.B.; Salanova, M. The measurement of work engagement with a short questionnaire: A cross-national study. Educ. Psychol. Meas. 2006, 66, 701–716. [Google Scholar] [CrossRef]
- Aguinis, H.; Henle, C.A.; Ostroff, C. Measurement in work and organizational psychology. In Handbook of Industrial, Work and Organizational Psychology; Anderson, N., Ones, D., Sinangil, H.K., Viswesvaran, C., Eds.; SAGE: London, UK, 2001; pp. 27–50. [Google Scholar]
- Na-Nan, K.; Chaiprasit, K.; Pukkeeree, P. A validation of the performance management scale. Int. J. Qual. Reliab. Manag. 2018, 35, 1253–1267. [Google Scholar] [CrossRef]


| Definition | Important Issue | Notation | Item | IOC | ITC | Alpha |
|---|---|---|---|---|---|---|
| Vitality dimension refers to people’s working behaviours which are full of vitality to release energy through self-spirit for working successfully. These people work actively through their physical and mental energy. | - be vital | TAW 1 | - I feel that my work is vital. | 1 | 0.772 | 0.914 |
| - want to release energy | TAW 2 | - I am ready to put my physical energy to work. | 1 | 0.691 | ||
| - have self-spirit | TAW 3 | - I am ready to put my mental energy to work. | 1 | 0.837 | ||
| - want to work | TAW 4 | - I wait for the next day to work. | 1 | 0.665 | ||
| - be alert and ready to work | TAW 5 | - I am alert and ready to work. | 1 | 0.837 | ||
| - be active | TAW 6 | - I feel active when working. | 0.80 | 0.852 | ||
| - have physical and mental energy | * | - I am physically energetic and mentally ready to work. | - | - | ||
| Learning dimension refers to people’s behaviours which are ready to learn new things by seeking new ways or procedures to develop their potentials. They want to continuously embrace new ideas to upgrade their potentials. | - learn things around themselves | TAW 7 | - I usually learn things around me. | 1 | 0.527 | 0.853 |
| - ready to learn new things | TAW 8 | - I am always ready to learn new things. | 0.80 | 0.676 | ||
| - seek ways to develop | TAW 9 | - I like seeking new ways or procedures to develop myself. | 1 | 0.615 | ||
| - develop oneself | TAW 10 | - I want to develop myself as much as possible. | 1 | 0.550 | ||
| - want to learn | TAW 11 | - I want to learn how to solve emerging problems and obstacles. | 1 | 0.742 | ||
| - want to improve | TAW 12 | - I want to continuously improve myself. | 1 | 0.782 |
| Question | Factor Weight | |
|---|---|---|
| I | II | |
| TAW 1 | 0.824 | |
| TAW 2 | 0.849 | |
| TAW 3 | 0.855 | |
| TAW 4 | 0.755 | |
| TAW 5 | 0.686 | |
| TAW 6 | 0.697 | |
| TAW 7 | 0.783 | |
| TAW 8 | 0.795 | |
| TAW 9 | 0.804 | |
| TAW 10 | 0.845 | |
| TAW 11 | 0.798 | |
| TAW 12 | 0.822 | |
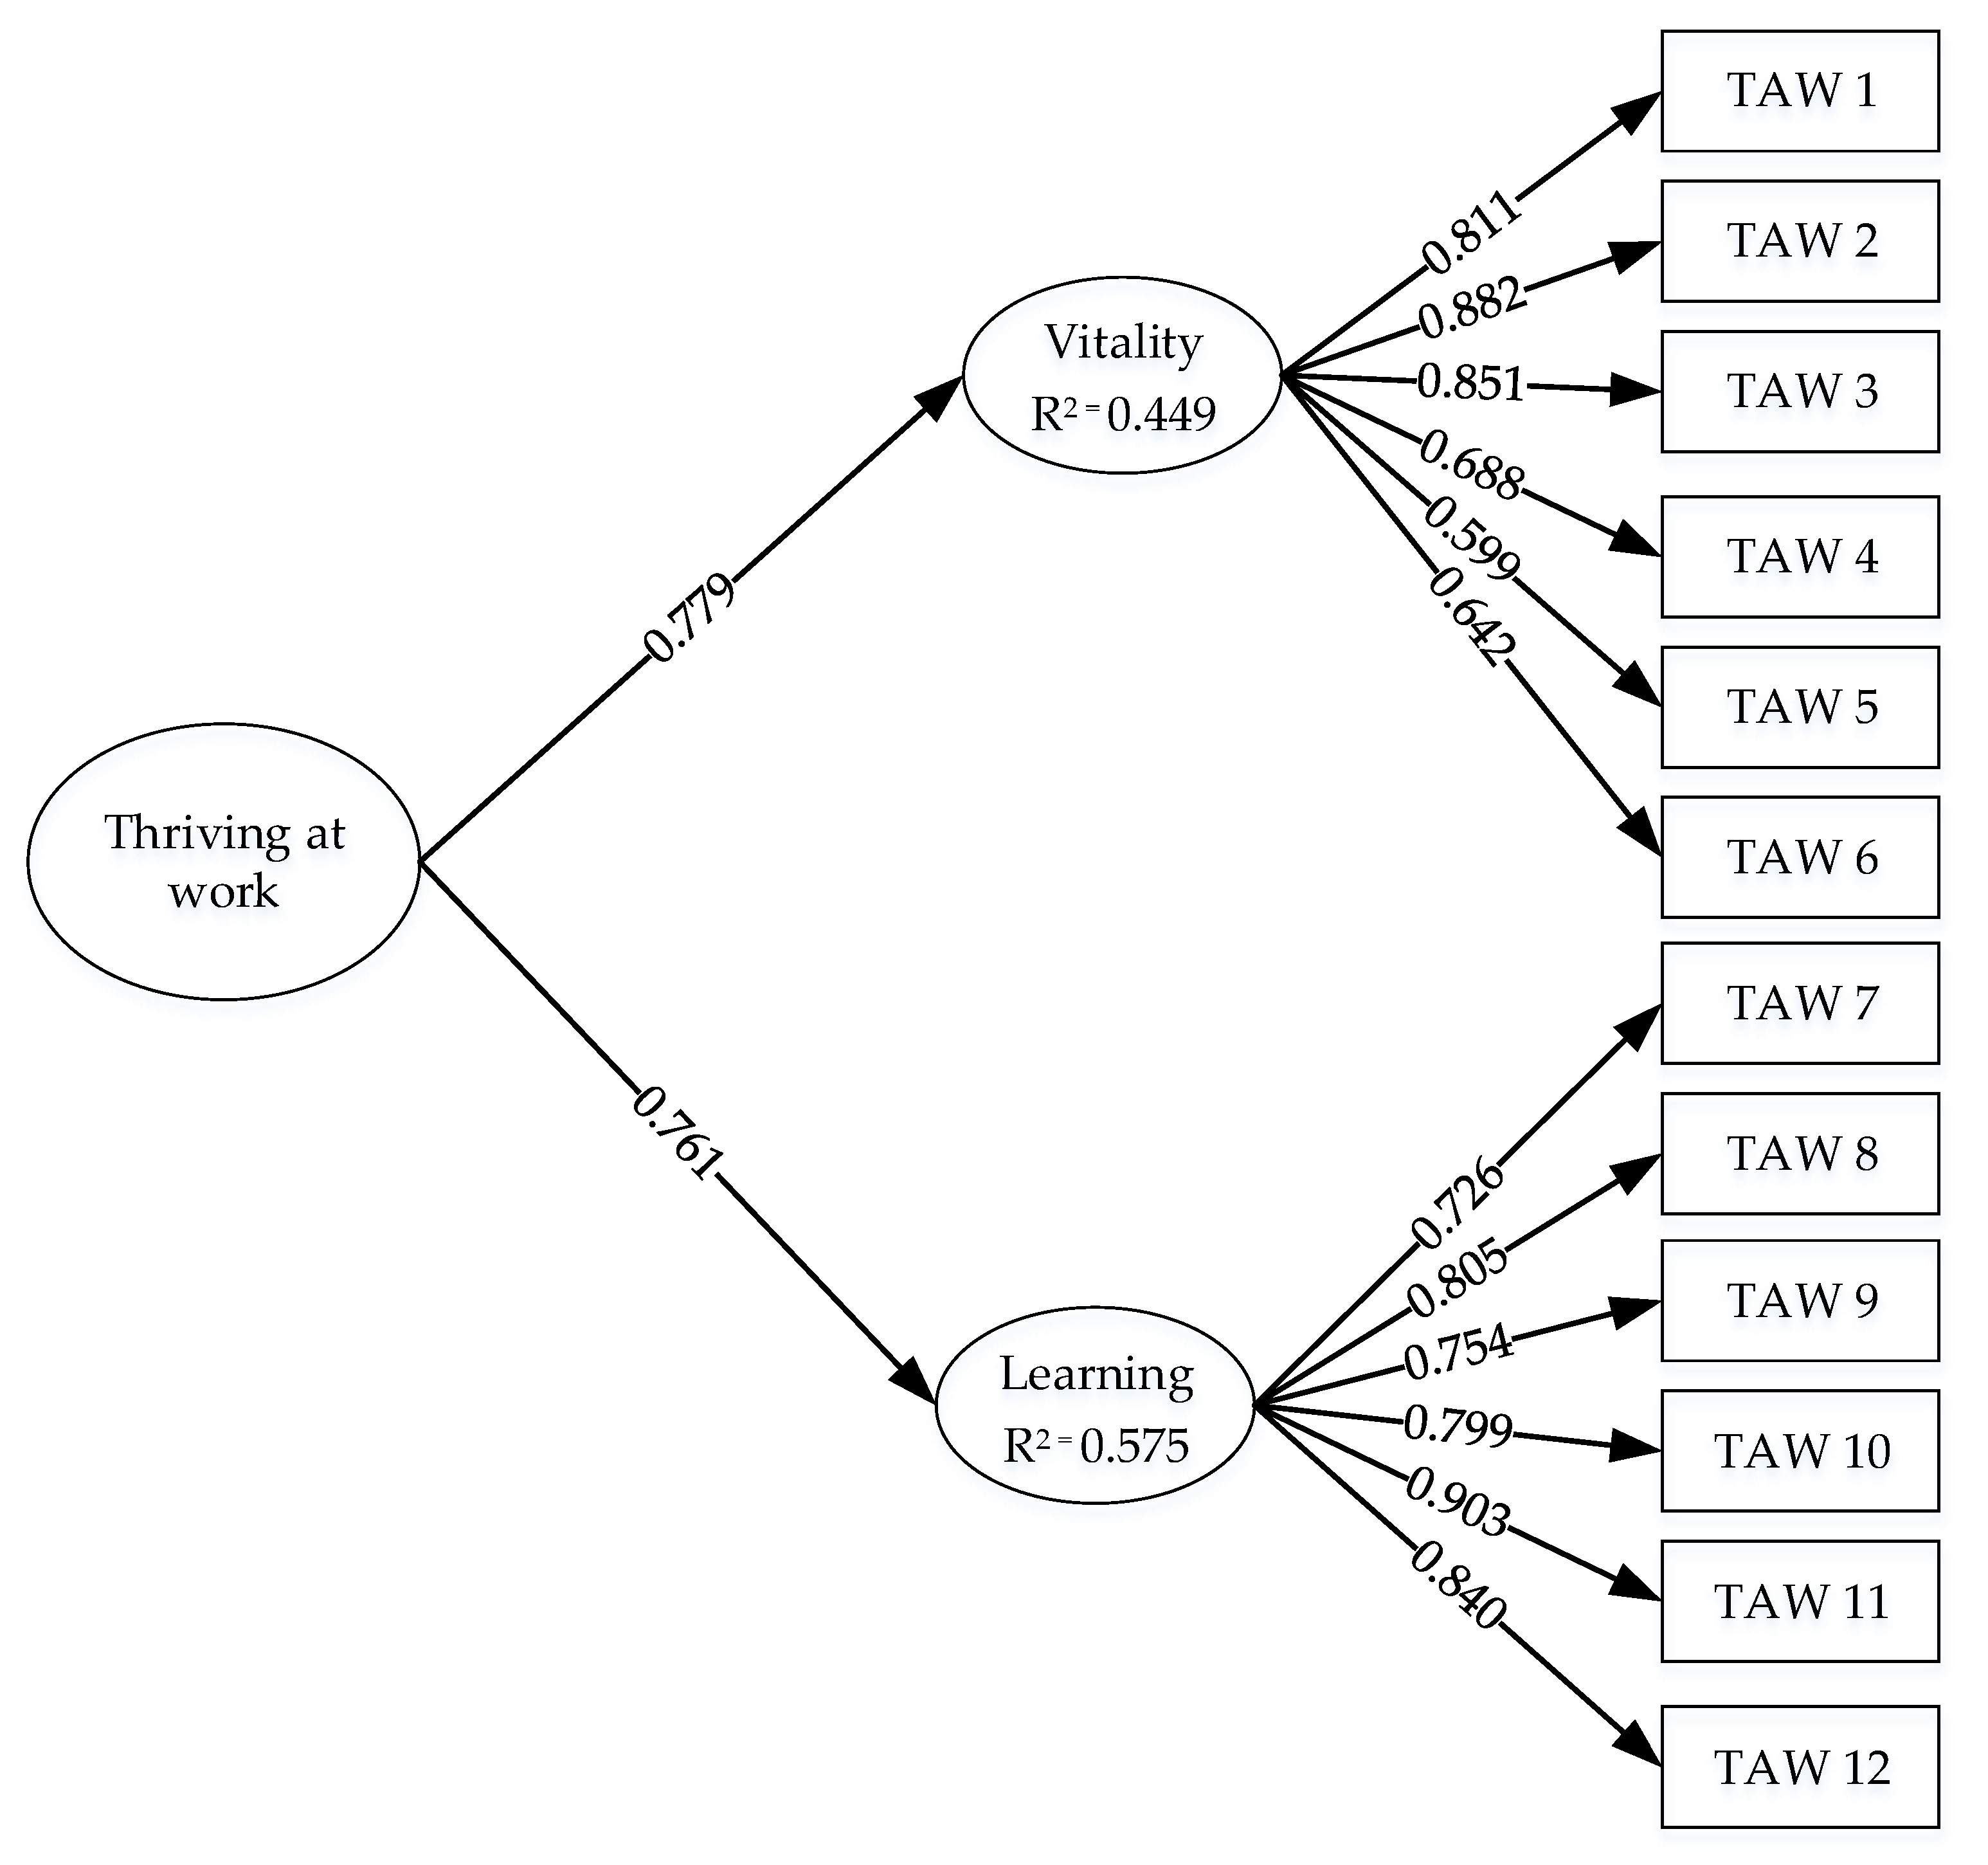
| Latent Factors/Questions | First Order CFA Construct Validity | Second-Order CFA Construct Validity | |||||||
|---|---|---|---|---|---|---|---|---|---|
| Factor Loading | R2 | CR | AVE | Factor Loading | R2 | CR | AVE | ||
| Factor I Vitality | TAW 1 | 0.811 *** | 0.657 | 0.888 | 0.576 | 0.670 *** | 0.449 | 0.676 | 0.511 |
| TAW 2 | 0.882 *** | 0.779 | |||||||
| TAW 3 | 0.851 *** | 0.724 | |||||||
| TAW 4 | 0.688 *** | 0.473 | |||||||
| TAW 5 | 0.599 *** | 0.359 | |||||||
| TAW 6 | 0.642 *** | 0.412 | |||||||
| Factor II Learning | TAW 7 | 0.726 *** | 0.527 | 0.915 | 0.645 | 0.758 *** | 0.575 | ||
| TAW 8 | 0.805 *** | 0.648 | |||||||
| TAW 9 | 0.754 *** | 0.568 | |||||||
| TAW 10 | 0.779 *** | 0.607 | |||||||
| TAW 11 | 0.903 *** | 0.816 | |||||||
| TAW 12 | 0.840 *** | 0.705 | |||||||
| Variable | Mean | SD | Vitality | Learning |
|---|---|---|---|---|
| Vitality | 3.611 | 0.690 | (0.758) | |
| Learning | 4.233 | 0.637 | 0.551 ** | (0.803) |
| The alpha coefficient after questionnaire validity was 0.950 | ||||
© 2020 by the authors. Licensee MDPI, Basel, Switzerland. This article is an open access article distributed under the terms and conditions of the Creative Commons Attribution (CC BY) license (http://creativecommons.org/licenses/by/4.0/).
Share and Cite
Na-Nan, K.; Kanthong, S.; Wongsuwan, N.; Pukkeeree, P.; Sa-ngasilp, T. Concept Model to Measure the Thriving at Work (TAW): Developing and Applying. J. Open Innov. Technol. Mark. Complex. 2020, 6, 72. https://doi.org/10.3390/joitmc6030072
Na-Nan K, Kanthong S, Wongsuwan N, Pukkeeree P, Sa-ngasilp T. Concept Model to Measure the Thriving at Work (TAW): Developing and Applying. Journal of Open Innovation: Technology, Market, and Complexity. 2020; 6(3):72. https://doi.org/10.3390/joitmc6030072
Chicago/Turabian StyleNa-Nan, Khahan, Suteeluck Kanthong, Natthaya Wongsuwan, Peerapong Pukkeeree, and Thitikul Sa-ngasilp. 2020. "Concept Model to Measure the Thriving at Work (TAW): Developing and Applying" Journal of Open Innovation: Technology, Market, and Complexity 6, no. 3: 72. https://doi.org/10.3390/joitmc6030072
APA StyleNa-Nan, K., Kanthong, S., Wongsuwan, N., Pukkeeree, P., & Sa-ngasilp, T. (2020). Concept Model to Measure the Thriving at Work (TAW): Developing and Applying. Journal of Open Innovation: Technology, Market, and Complexity, 6(3), 72. https://doi.org/10.3390/joitmc6030072