User Preferences on Cloud Computing and Open Innovation: A Case Study for University Employees in Greece


 ,
,  and
and 
Abstract
1. Introduction
2. Literature Review
2.1. Cloud Computing and Open Innovation
2.2. User Adoption of Cloud Computing
3. Materials and Methods
3.1. Data Collection
3.2. Experimental Setup Dataset Structuring
3.3. Adopted Classifiers
3.4. Evaluation Method and Metrics
4. Results
4.1. Description
4.2. Experimented Classifiers Prediction Accuracy
4.3. Experimented Classifiers Confusion Matrix
4.4. Experimented Classifiers Time to Build Model
4.5. Weka Classifiers Parameter Tuning
5. Discussion
6. Conclusions
6.1. Implications
6.2. Limits and Future Research Topics
Author Contributions
Funding
Conflicts of Interest
References
- Kaminska, M.; Smihily, M. Cloud Computing Statistics on the Use by Enterprises, EUROSTAT. Available online: https://ec.europa.eu/eurostat/statistics-explained/index.php/Cloud_computing_-_statistics_on_the_use_by_enterprises (accessed on 20 December 2019).
- Sharma, S.K.; Al-Badi, A.H.; Govindaluri, S.M.; Al-Kharusi, M.H. Predicting motivators of cloud computing adoption: A developing country perspective. Comput. Hum. Behav. 2016, 62, 61–69. [Google Scholar] [CrossRef]
- Zhang, K. Research of remote access system to the digital resources based on cloud computing. Appl. Mech. Mater. 2014, 543–547, 3606–3609. [Google Scholar] [CrossRef]
- Cascio, W.; Montealegre, R. How Technology Is Changing Work and Organizations. Annu. Rev. Organ. Psychol. Organ. Behav. 2016, 3, 349–375. [Google Scholar] [CrossRef]
- Tornatzky, L.G.; Fleischer, M. The Processes of Technological Innovation; Lexington Books: Lexington, MA, USA, 1990. [Google Scholar]
- Alshamaila, Y.; Papagiannidis, S.; Li, F. Cloud computing adoption by SMEs in the north east of England: A multi-perspective framework. J. Enterp. Inf. Manag. 2013, 26, 250–275. [Google Scholar] [CrossRef]
- Low, C.; Chen, Y.; Wu, M. Understanding the determinants of cloud computing adoption. Ind. Manag. Data Syst. 2011, 111, 1006–1023. [Google Scholar] [CrossRef]
- Morgan, L.; Conboy, K. Key factors impacting cloud computing adoption. Computer 2013, 10, 97–99. [Google Scholar] [CrossRef][Green Version]
- Yang, Z.; Sun, J.; Zhang, Y.; Wang, Y. Understanding SaaS adoption from the perspective of organizational users: A tripod readiness model. Comput. Hum. Behav. 2015, 45, 254–264. [Google Scholar] [CrossRef]
- Al-Somali, S.A.; Gholami, R.; Clegg, B. An investigation into the acceptance of online banking in Saudi Arabia. Technovation 2009, 292, 130–141. [Google Scholar] [CrossRef]
- Davis, F.D. Perceived usefulness, perceived ease of use, and user acceptance of information technology. MIS Q. 1989, 13, 319–340. [Google Scholar] [CrossRef]
- Sharma, S.K.; Govindaluri, S.M. Internet banking adoption in India: Structural equation modeling approach. J. Indian Bus. Res. 2014, 62, 155–169. [Google Scholar] [CrossRef]
- Chong, A.Y.L. Predicting m-commerce adoption determinants: A neural network approach. Expert Syst. Appl. 2013, 402, 523–530. [Google Scholar] [CrossRef]
- Shmueli, G.; Koppius, O. Predictive analytics in information systems research. MIS Q. 2011, 35, 553–572. [Google Scholar] [CrossRef]
- Sharma, S.K.; Joshi, A.; Sharma, H. A multi-analytical approach to predict the Facebook usage in higher education. Comput. Hum. Behav. 2016, 55, 340–353. [Google Scholar] [CrossRef]
- Mell, P.; Grance, T. Effectively and securely using the cloud computing paradigm. NIST Inf. Technol. Lab. 2009, 2, 304–311. [Google Scholar]
- Yeo, S.-S.; Jeong, H.-Y.; Choi, H.-G. Management of cloud computing resources for business, industry, and manufacturing system. Appl. Mech. Mater. 2012, 224, 174–177. [Google Scholar] [CrossRef]
- Eurostat, Data for Cloud Computing Services (Online Data Code: Isoc_cicce_use). Available online: http://appsso.eurostat.ec.europa.eu/nui/show.do?dataset=isoc_cicce_use (accessed on 12 January 2020).
- Hellenic Statistical Authority, Methodology, Quality Management and International Relations Division, Statistical Program Section, Statistical Business Register/2017. Available online: https://www.statistics.gr/en/statistics/-/publication/SBR01/- (accessed on 21 April 2020).
- Sultan, N. Cloud computing for education: A new dawn? Int. J. Inf. Manag. 2010, 30, 109–116. [Google Scholar] [CrossRef]
- Erdogmus, H. Cloud computing: Does Nirvana hide behind the Nebula? IEEE Softw. 2009, 262, 4–6. [Google Scholar] [CrossRef]
- Gupta, P.; Seetharaman, A.; Raj, R.J. The usage and adoption of cloud computing by small and medium businesses. Int. J. Inf. Manag. 2013, 33, 861–874. [Google Scholar] [CrossRef]
- Endo, P.T.; Rodrigues, M.; Gonçalves, G.E. High availability in clouds: Systematic review and research challenges. J. Cloud Comput. 2016, 5. [Google Scholar] [CrossRef]
- DeCoufle, B. The impact of cloud computing on schools. Data Cent. J 2009. Available online: http://datacenterjournal.com/content/view/3032/40 (accessed on 31 July 2009).
- Chinta, R.; Culpan, R. The role of open innovation in business-university R&D collaborations. In Open Innovation Through Strategic Alliances: Approaches for Product, Technology, and Business Model Creation; Palgrave Macmillan: New York, NY, USA, 2014; pp. 146–166. [Google Scholar] [CrossRef]
- Birudavolu, S.; Nag, B.; Wali, O. Open innovation in ICT services for quadruple helix model: The cloud proposition. ACM Int. Conf. Proceeding Ser. 2016. [Google Scholar] [CrossRef]
- Mell, P.; Grance, T. The NIST Definition of Cloud Computing. Available online: https://nvlpubs.nist.gov/nistpubs/Legacy/SP/nistspecialpublication800-145.pdf (accessed on 8 June 2020).
- Ashtari, S.; Eydgahi, A. Student perceptions of cloud applications effectiveness in higher education. J. Comput. Sci. 2017, 23, 173–180. [Google Scholar] [CrossRef]
- Sohaib, O.; Naderpour, M.; Hussain, W.; Martinez, L. Cloud computing model selection for e-commerce enterprises using a new 2-tuple fuzzy linguistic decision-making method. Comput. Ind. Eng. 2019, 132, 47–58. [Google Scholar] [CrossRef]
- Poniszewska-Maranda, A.; Matusiak, R.; Kryvinska, N. A real-time service system in the cloud. J. Ambient Intell. Hum. Comput. 2020, 11, 961–977. [Google Scholar] [CrossRef]
- Chou, D.C. Cloud computing risk and audit issues. Comput. Stand. Interfaces 2015, 42, 137–142. [Google Scholar] [CrossRef]
- Lacity, M.C.; Hirschheim, R. Information Systems Outsourcing; John Wiley & Son: New York, NY, USA, 1993. [Google Scholar]
- Jugend, D.; Fiorini, P.D.C.; Armellini, F.; Ferrari, A.G. Public support for innovation: A systematic review of the literature and implications for open innovation. Technol. Forecast. Soc. Chang. 2020, 156, 119985. [Google Scholar] [CrossRef]
- General Data Protection Regulation (GDPR). Regulation EU 2016/679 of the European Parliament and of the Council of 27 April 2016. Available online: https://eur-lex.europa.eu/eli/reg/2016/679/oj (accessed on 6 June 2020).
- Somlo, K.; Sziebig, G. Future role of application of new technologies in small-and medium scale manufacturing systems: Regarding Intelligent and advanced manufacturing systems in northern peripheral area. IEEE Int. Symp. Ind. Electron. 2017, 8001510, 1735–1740. [Google Scholar] [CrossRef]
- Behrend, S.T.; Wiebe, N.E.; Jennifer, E.; London, E.J.; Johnson, E.C. Cloud computing adoption and usage in community colleges. Behav. Inf. Technol. 2011, 30, 231–240. [Google Scholar] [CrossRef]
- Rauniar, R.; Rawski, G.; Yang, J.; Johnson, B. Technology acceptance model TAM and social media usage: An empirical study on Facebook. J. Enterp. Inf. Manag. 2014, 27, 6–30. [Google Scholar] [CrossRef]
- Fishbein, M.; Ajzen, I. Belief, attitude, intention and behavior: An introduction to theory and research. Available online: https://www.researchgate.net/publication/233897090_Belief_attitude_intention_and_behaviour_An_introduction_to_theory_and_research (accessed on 6 June 2020).
- Ajzen, I.; Fishbein, M. Understanding Attitudes and Predicting Social Behavior; Prentice-Hall: Englewood Cliffs, NJ, USA, 1980. [Google Scholar]
- Al-Fraihat, D.; Joy, M.; Masa’deh, R.; Sinclair, J. Evaluating E-learning systems success: An empirical study. Comput. Hum. Behav. 2020, 102, 67–86. [Google Scholar] [CrossRef]
- Abdullah, F.; Ward, R. Developing a general extended technology acceptance model for e-learning GETAMEL by analyzing commonly used external factors. Comput. Hum. Behav. 2016, 56, 238–256. [Google Scholar] [CrossRef]
- Namahoot Kanokkarn, S.; Laohavichien, T. Assessing the intentions to use internet banking: The role of perceived risk and trust as mediating factors. Int. J. Bank Mark. 2018, 362, 256–276. [Google Scholar] [CrossRef]
- Muñoz-Leiva, F.; Climent-Climent, S.; Liébana-Cabanillas, F. Determinants of intention to use the mobile banking apps: An extension of the classic TAM model. Span. J. Mark. ESIC 2017, 211, 25–38. [Google Scholar] [CrossRef]
- Gkika, E.C.; Giovanis, A.N. Factors affecting the adoption of new technologies: Empirical investigation in the banking system of a Balkan country. In Proceedings of the 4th International Conference: The Economies of the Balkan and the Eastern European Countries in the Changing World EBEEC, Sofia, Boulgaria, 11–13 May 2012. [Google Scholar]
- Al-Emran, M.; Arpaci, I.; Salloum, S.A. An empirical examination of continuous intention to use m-learning: An integrated model. Educ. Inf. Technol. 2020. [Google Scholar] [CrossRef]
- Kumar, B.A.; Chand, S.S. Mobile learning adoption: A systematic review. Educ. Inf. Technol. 2019, 241, 471–487. [Google Scholar] [CrossRef]
- Sarrab, M.; Al-Shihi, H.; Al-Manthari, B.; Bourdoucen, H. Toward educational requirements model for Mobile learning development and adoption in higher education. TechTrends 2018, 62, 635–646. [Google Scholar] [CrossRef]
- Park, S.Y.; Lee, H.D.; Kim, S.Y. South Korean university students’ mobile learning acceptance and experience based on the perceived attributes, system quality and resistance. Innov. Educ. Teach. Int. 2018. [Google Scholar] [CrossRef]
- Makmor, N.; Aziz Abd, N.; Alam Shah, S. Social Commerce an Extended Technology Acceptance Model: The Mediating Effect of Perceived Ease of Use and Perceived Usefulness. Malays. J. Consum. Fam. Econ. 2019, 22, 119–136. [Google Scholar]
- Davis, F.D.; Bagozzi, R.P.; Warshaw, P.R. User acceptance of computer technology: A comparison of two. Manag. Sci. 1989, 35, 982–1002. [Google Scholar] [CrossRef]
- Agarwal, R.; Prasad, J. Are individual differences germane to the acceptance of new information technologies? Decis. Sci. 1999, 30, 361–391. [Google Scholar] [CrossRef]
- Robey, D. User Attitudes and Management Information System Use. Acad. Manag. J. 1979, 22, 527–538. [Google Scholar]
- Venkatesh, V.; Davis, F. A Theoretical Extension of the Technology Acceptance Model: Four Longitudinal Field Studies. Manag. Sci. 2000, 46, 186–204. [Google Scholar] [CrossRef]
- Kim, K.J.; Sundar, S.S. Does screen size matter for smartphones? Utilitarian and hedonic effects of screen size on smartphone adoption. Cyberphychology Behav. Soc. Netw. 2014, 17, 466–473. [Google Scholar] [CrossRef]
- Kim, H.-W.; Chan, H.-C.; Gupta, S. Value-Based Adoption of Mobile Internet: An Empirical Investigation. Decis. Support Syst. 2007, 43, 111–126. [Google Scholar] [CrossRef]
- Almazroi, A.A.; Shen, H.; Mohammed, F. The Impact of Trust on the Adoption of Cloud Computing Services by University Students. In Recent Trends in Data Science and Soft Computing; Saeed, F., Gazem, N., Mohammed, F., Busalim, A., Eds.; Advances in Intelligent Systems and Computing; IRICT; Springer: Cham, Switzerland, 2018; Volume 843. [Google Scholar]
- Sharma, M.; Gupta, R.; Acharya, P. Prioritizing the Critical Factors of Cloud Computing Adoption Using Multi-Criteria Decision-making Techniques. Glob. Bus. Rev. 2017, 211, 142–161. [Google Scholar] [CrossRef]
- Venkatesh, V. Determinants of perceived ease of use: Integrating control, intrinsic motivation, and emotion into the technology acceptance model. Inf. Syst. Res. 2000, 11, 342–365. [Google Scholar] [CrossRef]
- Lai, P.C. Perceived risk an extension to TAM model: Consumers’ intention to use a single platform e-payment. Aust. J. Basic Appl. Sci. 2015, 9, 323–331. [Google Scholar]
- Tsamis, A.; Tassopoulos, A.; Gkika, E. Financial institutions as main contributors to society’s technology familiarization and adoption of technological trends. In Proceedings of the HSSS 1st International Conference, Tripoli, Greece, 12–14 May 2005. [Google Scholar]
- Gangwar, H.; Date, H.; Ramaswamy, R. Understanding determinants of cloud computing adoption using an integrated TAM-TOE model. J. Enterp. Inf. Manag. 2016, 28, 107–130. [Google Scholar] [CrossRef]
- Venkatesh, V.; Bala, H. Technology Acceptance Model 3 and a research agenda on interventions. Decis. Sci. 2008, 392, 273–315. [Google Scholar] [CrossRef]
- Bandura, A. Self-Efficacy Mechanism in Human Agency. Am. Psychol. 1982, 37, 122–147. [Google Scholar] [CrossRef]
- Compeau, D.R.; Higgins, C.A. Computer self-efficacy: Development of a measure and initial test. MIS Q. 1995, 189–211. [Google Scholar] [CrossRef]
- Heinssen, R.K.; Glass, C.R.; Knight, L.A. Assessing computer anxiety: Development and validation of the computer anxiety rating scale. Comput. Hum. Behav. 1987, 3, 49–59. [Google Scholar] [CrossRef]
- Liao, Z.; Cheung, M.T. Internet-based e-banking and consumer attitudes: An empirical study. Inf. Manag. 2002, 39, 283–295. [Google Scholar] [CrossRef]
- Lu, H.-P.; Hsu, H.-P.; Hsu, C.-L. An empirical study of the effect of perceived risk upon intention to use. Inf. Manag. Comput. Secur. 2005, 13, 106–120. [Google Scholar] [CrossRef]
- Ma, H.; Hu, Z.; Yang, L.; Song, T. User feature-aware trustworthiness measurement of cloud services via evidence synthesis for potential users. J. Vis. Lang. Comput. 2014, 256, 791–799. [Google Scholar] [CrossRef]
- Gkika, E. Tourists’ perceptions on satisfaction and sustainable development of tourists’ destinations. J. Sustain. Dev. Cult. Tradit. 2017, 1b, 71–82. [Google Scholar]
- Goldstein, P. Alternative IT Sourcing Strategies: From the Campus to the Cloud. Available online: https://library.educause.edu/resources/2009/8/alternative-it-sourcing-strategies-from-the-campus-to-the-cloud (accessed on 6 June 2020).
- Rogers, E.M. Diffusion of Innovations, 5th ed.; Free Press: New York, NY, USA, 2003. [Google Scholar]
- Davis, F.; Venkatesh, V. A Critical Assessment of Potential Measurement Biases in the Technology Acceptance Model: Three Experiments. Int. J. Hum. Comput. Stud. 1996, 45, 19–45. [Google Scholar] [CrossRef]
- Jarvenpaa, S.L.; Tractinsky, N.; Vitale, M. Consumer trust in an internet store. Inf. Technol. Manag. 2000, 1, 45–71. [Google Scholar] [CrossRef]
- Tan, M.; Teo, T. Factors Influencing the Adoption of Internet Banking. Int. J. Electron. Commer. 2000, 1. [Google Scholar] [CrossRef]
- Nawir, M.; Amir, A.; Lynn, O.B.; Yaakob, N.; Badlishah Ahmad, R. Performances of Machine Learning Algorithms for Binary Classification of Network Anomaly Detection System. J. Phys. Conf. Ser. 2018, 1018, 012015. [Google Scholar] [CrossRef]
- Mendez, K.M.; Reinke, S.N.; Broadhurst, D.I. A comparative evaluation of the generalised predictive ability of eight machine learning algorithms across ten clinical metabolomics data sets for binary classification. Metabolomics 2019, 15, 150. [Google Scholar] [CrossRef] [PubMed]
- Murugan, N.S.; Devi, G.U. Feature extraction using LR-PCA hybridization on twitter data and classification accuracy using machine learning algorithms. Clust. Comput. 2019, 22, 13965–13974. [Google Scholar] [CrossRef]
- Inani, A.; Verma, C.; Jain, S. A machine learning algorithm TSF k-Nn based on automated data classification for securing mobile cloud computing model. In Proceedings of the IEEE 4th International Conference on Computer and Communication Systems, ICCCS 2019, Singapore, 23–25 February 2019; Volume 8821756, pp. 9–13. [Google Scholar] [CrossRef]
- Frank, E.; Hall, M.A.; Witten, I.H. The Weka Workbench. Online Appendix for “Data Mining: Practical Machine Learning Tools and Techniques”, 4th ed.; Morgan Kaufmann: Burlington, MA, USA, 2016. [Google Scholar]
- Seifu, S.D.; Dahiru, A.A.; Bass, J.M.; Allison, I.K. Cloud-computing: Adoption issues for ethiopian public and private enterprises. Electron. J. Inf. Syst. Dev. Ctries. 2017, 78, 7. [Google Scholar] [CrossRef]
- Danchev, S.; Tsakanikas, A.; Ventouris, N. Cloud Computing: A Driver for Greek Economy Competitiveness; Foundation for Economic & Industrial Research, IOBE: Athens, Greece, 2011. [Google Scholar]
- Chesbrough, H. Open Innovation Results: Going Beyond the Hype and Getting Down to Business; Oxford Scholarship: Oxford, UK, 2020; p. 201. ISBN 9780198841906. [Google Scholar] [CrossRef]
- Yun, J.J.; Zhao, X.; Wu, J.; Yi, J.C.; Park, K.; Jung, W. Business Model, Open Innovation, and Sustainability in Car Sharing Industry—Comparing Three Economies. Sustainability 2020, 12, 1883. [Google Scholar] [CrossRef]
- Yun, J.J.; Won, D.; Park, K. Entrepreneurial cyclical dynamics of open innovation. J. Evol. Econ. 2018, 28, 1151–1174. [Google Scholar] [CrossRef]
- Yun, J.J.; Liu, Z. Micro- and Macro-Dynamics of Open Innovation with a Quadruple-Helix Model. Sustainability 2019, 11, 3301. [Google Scholar] [CrossRef]
- Yun, J.J.; Zhao, X.; Park, K.; Shi, L. Sustainability Condition of Open Innovation: Dynamic Growth of Alibaba from SME to Large Enterprise. Sustainability 2020, 12, 4379. [Google Scholar] [CrossRef]
- Curley, M. Twelve principles for open innovation 2.0: Evolve governance structures, practices and metrics to accelerate innovation in an era of digital connectivity. Nature 2016, 533, 314–316. [Google Scholar] [CrossRef]
- Alonso, J.; Escalante, M.; Orue-Echevarria, L. Transformational Cloud Government TCG: Transforming Public Administrations with a Cloud of public services. Procedia Comput. Sci. 2016, 97, 43–52. [Google Scholar] [CrossRef]
- Lytras, M.D.; Visvizi, A.; Torres-Ruiz, M.; Damiani, E.; Jin, P. Urban computing and well-being in smart cities: Services, applications, policymaking considerations. IEEE Access Spec. Sect. Editor. 2020, 8, 72340–72346. [Google Scholar] [CrossRef]
- Visvizi, A.; Lytras, M.D. Rescaling and refocusing smart cities research: From mega cities to smart villages. Journal of Science and Technology Policy Management. J. Sci. Technol. Policy Manag. 2018, 9, 134–145. [Google Scholar] [CrossRef]
- Cândido, A.C.; Sousa, C. Open innovation practices in strategic partnerships of cloud computing providers. J. Technol. Manag. Innov. 2017, 12, 59–67. [Google Scholar] [CrossRef]
- Shih, H.-P. An empirical study on predicting user acceptance of e-shopping on the Web. Inf. Manag. 2004, 41, 351–368. [Google Scholar] [CrossRef]
- Hackbarth, G.; Groverb, V.; Yic, M.Y. Computer Playfulness and Anxiety: Positive and Negative Mediators of the System Experience Effect on Perceived Ease of Use. Inf. Manag. 2003, 40, 221–232. [Google Scholar] [CrossRef]
- Carr, N. The Big Switch: Re-Wiring the World, from Edison to Google; W.W. Norton: New York, NY, USA; London, UK, 2009. [Google Scholar]
- Alharthi, A.; Yahya, F.; Walters, R.; Wills, G. An Overview of Cloud Services Adoption Challenges in Higher Education Institutions. Available online: https://www.researchgate.net/publication/299365475_An_Overview_of_Cloud_Services_Adoption_Challenges_in_Higher_Education_Institutions (accessed on 7 June 2020).


| Attribute | Type | Value |
|---|---|---|
| Adoption | Predictive | {0,1,2,3,4} |
| Use | Predictive | {0,1,2,3,4} |
| Satisfaction | Predictive | {0,1,2,3,4} |
| Job performance | Predictive | {0,1,2,3,4} |
| Work more quickly | Predictive | {0,1,2,3,4} |
| Increase productivity | Predictive | {0,1,2} |
| Make job easier | Predictive | {0,1,2} |
| Effectiveness | Predictive | {0,1,2} |
| Perceived information quality | Predictive | {0,1,2} |
| Perceived system quality | Predictive | {0,1,2} |
| Efficiency | Predictive | {0,1,2} |
| Access costs | Predictive | {0,1,2} |
| Ease to use | Predictive | {0,1,2,3,4} |
| Ease to become skillful | Predictive | {0,1,2,3,4} |
| Ease to learn | Predictive | {0,1,2,3,4} |
| Predisposition | Predictive | {0,1} |
| Security | Predictive | {0,1} |
| Informational technology anxiety | Predictive | {0,1} |
| Work experience | Predictive | {0,1,2,3,4} |
| Education | Predictive | {0,1,2} |
| Gender | Predictive | {0,1} |
| Age | Predictive | {0,1,2,3} |
| Preference to Adopt cloud computing | Class | {0,1} |
| Parameter | Value |
|---|---|
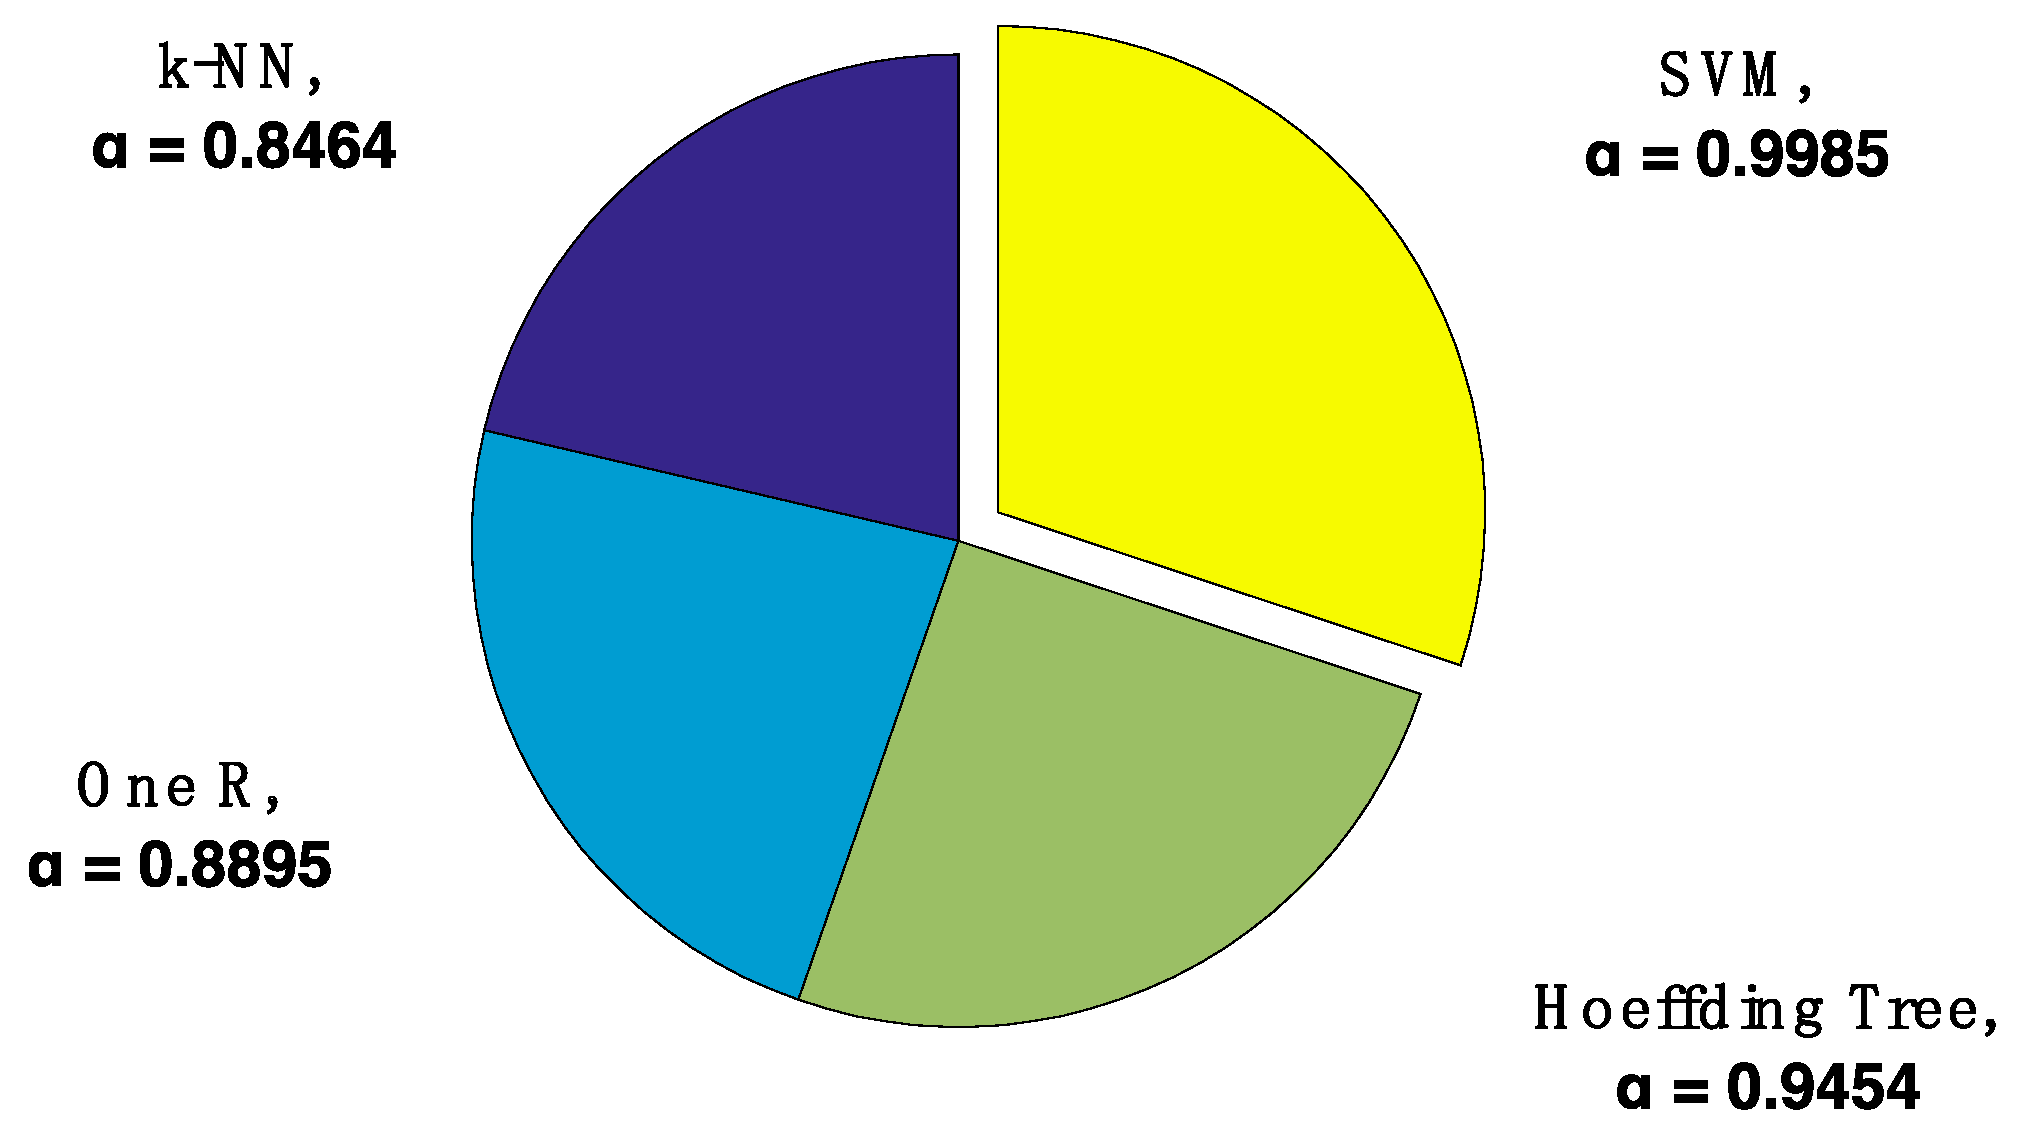
| 1st Experimented classifier | k-NN |
| 2nd Experimented classifier | One R |
| 3rd Experimented classifier | Hoeffding tree |
| 4th Experimented classifier | SVM |
| Evaluation method | 10-fold cross-validation |
| Evaluation metrics | a, Confusion matrix |
| Class 0 | Class 1 | ←Classified as |
|---|---|---|
| A | B | class 0 (not prefer cloud computing) |
| C | D | class 1 (prefer cloud computing) |
| k-NN | One R | ||||
| Class 0 | Class 1 | ← Classified as | Class 0 | Class 1 | ← Classified as |
| 158 | 73 | class 0 | 164 | 67 | class 0 |
| 34 | 432 | class 1 | 10 | 456 | class 1 |
| Hoeffding tree | SVM | ||||
| Class 0 | Class 1 | ← Classified as | Class 0 | Class 1 | ← Classified as |
| 205 | 26 | class 0 | 231 | 0 | class 0 |
| 12 | 454 | class 1 | 1 | 465 | class 1 |
| k-NN | One R |
| 0.01 s | 0.02 s |
| Hoeffding tree | SVM |
| 0.17 s | 0.49 s |
© 2020 by the authors. Licensee MDPI, Basel, Switzerland. This article is an open access article distributed under the terms and conditions of the Creative Commons Attribution (CC BY) license (http://creativecommons.org/licenses/by/4.0/).
Share and Cite
Gkika, E.C.; Anagnostopoulos, T.; Ntanos, S.; Kyriakopoulos, G.L. User Preferences on Cloud Computing and Open Innovation: A Case Study for University Employees in Greece. J. Open Innov. Technol. Mark. Complex. 2020, 6, 41. https://doi.org/10.3390/joitmc6020041
Gkika EC, Anagnostopoulos T, Ntanos S, Kyriakopoulos GL. User Preferences on Cloud Computing and Open Innovation: A Case Study for University Employees in Greece. Journal of Open Innovation: Technology, Market, and Complexity. 2020; 6(2):41. https://doi.org/10.3390/joitmc6020041
Chicago/Turabian StyleGkika, Eleni C., Theodoros Anagnostopoulos, Stamatios Ntanos, and Grigorios L. Kyriakopoulos. 2020. "User Preferences on Cloud Computing and Open Innovation: A Case Study for University Employees in Greece" Journal of Open Innovation: Technology, Market, and Complexity 6, no. 2: 41. https://doi.org/10.3390/joitmc6020041
APA StyleGkika, E. C., Anagnostopoulos, T., Ntanos, S., & Kyriakopoulos, G. L. (2020). User Preferences on Cloud Computing and Open Innovation: A Case Study for University Employees in Greece. Journal of Open Innovation: Technology, Market, and Complexity, 6(2), 41. https://doi.org/10.3390/joitmc6020041