Article

Open Innovation with Fuzzy Cognitive Mapping for Modeling the Barriers of University Technology Transfer: A Philippine Scenario

1
Technology Research Center, Cebu Technological University, Cebu City 6000, Philippines
2
Department of Industrial Engineering, Cebu Technological University, Cebu City 6000, Philippines
3
Department of Computer Science, University of the Philippines Cebu, Cebu City 6000, Philippines
4
Graduate School, Cebu Technological University, Cebu City 6000, Philippines
*
Author to whom correspondence should be addressed.
J. Open Innov. Technol. Mark. Complex. 2019, 5(4), 94; https://doi.org/10.3390/joitmc5040094
Submission received: 19 September 2019 / Revised: 13 November 2019 / Accepted: 14 November 2019 / Published: 19 November 2019

Abstract

:
The University technology transfer (UTT) process is hindered by various barriers to achieving a successful translation of innovative technologies from universities to industries and other partners. Identifying these various barriers and understanding their interrelationships would provide a better understanding of the complex nature of the UTT process, which may be considered as inputs to crucial decision-making initiatives. This paper addresses this gap by holistically determining UTT barriers and their intertwined relationships. Using the Delphi method and fuzzy cognitive mapping, a case study in a state university in the Philippines was conducted to carry out this objective. The Delphi process extracts 24 relevant barriers of UTT, out of 46 barriers obtained from a comprehensive review of the extant literature. The results show that misalignment between research and commercialization objectives is the barrier that was influenced most by the other barriers. In contrast, high costs of managing joint research projects in terms of time and money and institutional bureaucracy have the highest out-degree measures or are the barriers that influence other barriers the most. These findings provide guidelines to various stakeholders and decision-makers in understanding the existence of barriers in the formulation of strategies and initiatives for a successful UTT process.

1. Introduction

The United Nations Department of Economic and Social Affairs [1] espoused that the primary driver of economic and social development has been technology development and innovation. Advancements of economic activities worldwide were significantly due to technology transfer [2,3]. The United Nations Industrial Development Organization (UNIDO) [4] defined technology transfer as the process by which a collected entity (i.e., an act of manufacturing a product, application of a process, execution of service) is conveyed, partially or wholly, from one party to another. Generally, technology transfer is used as a tool to disseminate and commercialize intellectual properties, converting it to products for public use [5,6]. While their usual medium is commercialization, community extension services are becoming increasingly popular platforms. Furthermore, they are also used as a tool in various policy agendas. For instance, technology transfer has been at the forefront of the international development agenda for climate change mitigation, as well as in global climate negotiations, since technological capabilities are crucial in dealing with climate change issues [1,7]. With the implementation of the Bayh-Dole Act of 1980, there is an increased interest from universities in participating collaboration processes, such as technology transfer, to pursue its entrepreneurship and commercialization intentions [8,9,10,11]. This participation draws strengthened collaboration between firms with expertise in market relations and universities’ scientific knowledge to create valuable technologies and innovations [12].
In addition to the traditional goals of teaching and research, universities have increasingly added their interactions both with industry and society, along with the continuum of technology transfer [13,14]. Battaglia et al. [15] pointed out that university technology transfer (UTT) plays an essential role in bringing innovative technologies to a higher level of economic advancement due to the large amount of knowledge creation by universities. Universities can create positive impacts, while at the same time, pursuing their commercialization intentions through UTT [10]. Moreover, scientific knowledge, as the result of the collaboration between university and industry, also creates and maintains positive effects on the innovation performance of industry–science relations [16]. Case findings in various geographic locations have been reported in the current literature. For instance, Fischer et al. [17] indicated that the increased participation of universities in Brazil to technology development substantially boosted the intensity and breadth of technology upgrading and innovation activity in the Brazilian national innovation system. In the case of Andalusia, Spain, university spin-off companies, as one of the contributions of universities for economic growth, generate entrepreneurial university ecosystems, which resulted in increasing investments in universities to facilitate economic growth [17]. In addition, Dagiliute and Liobikiene [18] highlighted that higher educational institutions highly contribute to environmental sustainability in Lithuania by playing an essential role in shaping an ecologically sound society. Furthermore, the role of university, industry, and government collaborations, also known as the “triple helix” framework, in advancing innovation and economic development has highly raised interests over the last three decades [19]. Li et al. [19] highlighted that the “triple helix” collaboration framework potentially enhances innovation and economic development at macro-levels of the firm. As pointed out by Zhang et al. [20], the “Triple Helix” model was introduced to address the dynamics of university, industry, and government relations. Moreover, Leydesdorff and Sun [21] indicated that science–technology relations and entrepreneurial science are generated more across the sectors of economy (university, industry and government collaboration).
While technology transfer is critical to economic growth [9], recent findings suggest that it occurs as a highly contextual phenomenon that is dependent on various external factors (e.g., economic structure, technological and research capacities, among others) [22]. Despite being viewed as a complex process, technology transfer is still viewed as an essential initiative by industries, institutions, and universities [23]. Inherent with the complexity of the process, universities are hindered by various barriers of UTT [24,25,26]. Some of these barriers are lack of resources [25,27,28], insufficient rewards for university researchers [25,29,30], the lack of appropriate partners [23,27,30,31], and the risk of information leakage [25,27,32,33]. Note that this list is not intended to be comprehensive. Identifying these barriers is crucial for the successful implementation of the UTT process. For instance, Eleftheriadis and Anagnostopoulou [34] pointed out that identifying barriers and blocking mechanisms enables the successful diffusion of wind and solar power in the electricity sector. In addition, Schwarcz et al. [35] identified barriers to conduct successful HIV testing. On the other hand, by recognizing and understanding the existence of these numerous barriers, potential issues and problems arising in the UTT process that will aid in the relevant decision-making process can be exposed and subsequently addressed [26,32]. Identifying these barriers and eventually overcoming them can significantly benefit universities and industries for a successful collaboration process [36].
Different methods were used in the literature in determining the various barriers of UTT. Jones-Evans et al. [37] used face-to-face semi-structured interviews with different industrial liaison in Sweden and Ireland and qualitative data analysis to identify the barriers of UTT. Similarly, O’Reilly and Cunningham [38] also used a qualitative approach in examining the challenges faced by university-SME partnerships in the United Kingdom but with principal investigators and identified a total of three (3) barriers. Furthermore, Mazurkiewicz and Poteralska [26] used an in-depth analysis supported by their own practical experience and understanding and identified a total of 36 barriers, which were classified into three (3) classifications: technical, organizational-economic and system barriers. Despite these results, the use of qualitative analysis and understanding is greatly influenced by personal judgments and interpretations. The validity of these results and data may be of concern due to selection biases and inaccuracies in the data extraction process. With this, Jasinski [24] proposed the use of quantitative analysis and interpretation. Delphi method and statistical data were used in identifying the barriers of UTT. From a total of 55 constructed barriers, the barriers were reduced to five (5). However, the barriers that Jasinski [24] identified are from the collaborations between industry and R&D industrial firms. The participation of universities in the technology transfer process was not considered despite their crucial role in the technology transfer ecosystem. Shen [25], on the other hand, used the different perspectives of the stakeholders to identify the barriers and their interrelationships using a decision-making trial and an evaluation laboratory (DEMATEL) approach.
Despite the significant efforts in understanding university–industry collaborations on technology transfer, limited effort has been reported in the current literature of identifying and establishing the various barriers of UTT along with their interrelationships. Determining and understanding such relationships provides a better understanding of how to address the complexity of the UTT process and formulate strategies to overcome them. Thus, this paper attempts to fill in such gaps. In this work, barriers of UTT and their relationships in the Philippine setting were examined. Despite the support that the Philippine government afforded technology transfer in matters of policy making, the efficacy of such policies raises some concerns. A case of one of the state universities prominent in technology innovation and development is reported in this work. The case state university is active in developing technologies; however, most of these developed technologies were not transferred. To identify the barriers of UTT, a comprehensive review of the literature is conducted regarding the barriers of technology transfer. A Delphi process is implemented with the group participants streamlining their relevance to UTT and having the opportunity to add more barriers based on the participants’ practical experiences. The Delphi method applications were successfully used in an interspersed consensus among group experts while having controlled opinion feedback in an uncertain environment in the data gathering process [39,40,41]. After, a fuzzy cognitive mapping (FCM) technique was used to capture the complex interrelationships among the barriers. The FCM has been successfully applied in understanding interrelationships between hazy elements, wherein subjective perceptions on the elements and causal links in a given system are depicted [42,43,44,45]. Fuzzy cognitive maps have been successfully applied in various contexts, such as in climate vulnerability [46], agricultural policy design [47], medical errors [48], discovery of HIV-1 drug resistance [49], the wind energy sector [50] and integrated ecosystem assessments [51]. Note again that this list is not intended to be comprehensive. This paper contributes by establishing an extensive list of the barriers of UTT and their corresponding relationships to provide a better comprehension of the complexity of the UTT process. Such a contribution intends to help university policy makers formulate strategies, as well as in the decision-making process of domain issues. This paper is constructed as follows: Section 2 explains the various barriers of UTT. Section 3 presents the methodology used in the study. The results and their interpretations are shown in Section 4, while Section 5 ends the paper with a conclusion and a brief discussion of future work.

2. Barriers of University Technology Transfer (UTT)

As widely acknowledged in the economics literature, an economy’s performance, with regards to innovation and productivity, is heavily influenced by the nature and intensity of the interactions and learning process between producers, users, suppliers, and public authorities [16]. Shen [25] implied that universities are entitled to play the significant role of generating and disseminating knowledge in innovation systems to contribute to economic growth. The implementation of the Bayh-Dole Act of 1980 enabled the promotion of inventions and technologies developed from universities towards commercialization in pursuing their entrepreneurial intentions [8,9,10,11]. Consequently, today, the university’s focus is not only on traditional goals (i.e., teaching, research) but also on technology transfer [13,14]. The collaboration between universities and industries created many opportunities, particularly in promoting graduate skills to employers in industries [52]. Battaglia et al. [15] indicated that university technology transfer (UTT) brought innovative technologies to a higher economic advantage since a large number of created technologies come from universities. However, university–industry collaboration is viewed as a sophisticated form of the multi-layered environment and consists of interconnected perspectives from individuals and organizations [53,54]. Additionally, the UTT process involves human interactions, new technologies, and bureaucracy, which potentially raises barriers to a successful transfer [55]. Recognizing the presence of these barriers would assist in the decision-making process by uncovering probable problems and issues during the UTT process [26,32].
Belkhodja and Landry [30] highlighted that strategic collaboration among stakeholders enhances the practical potential of technologies. Collaboration is seen as both a personal choice driven by the attributes of the domain field of the technology developers (e.g., university scholars) and a choice enforced by economic demands [30]. Engaging with industrial partners is perceived to be difficult for academics, especially in linking with potential industrial network actors [31]. With the lack of external connections or the lack of appropriate partners, it is challenging for technology developers to contribute to the UTT process [25]. Another critical barrier of UTT is the time constraints experienced during the UTT process [25,31]. Sa et al. [56] suggested that UTT collaboration is risky for academics who are seeking promotion and tenure as it consumes their time away from research works. In addition, research has been given a higher priority in universities than commercialization activities [31]. Performing activities such as scientific research, academic coursework, and UTT, at the same time, would be challenging for them [25].
Domain scholars illustrated that insufficient resources or lack of resources withheld the success of the UTT process [56]. If they were to provide a potential benefit to commercialization, universities must have access to essential resources [31]. Conversely, most universities are subsidized by public financial resources [25]. Moreover, recent papers on science, technology, and innovation indicated that the government agrees to participate in the technology transfer process but is not willing to allocate resources to implement technologies developed from theories into practice [37]. Likewise, industries also have lack of resources to manage external collaborations and interactions [28]. On the other hand, the risk of information leakage is another concern in the conduct of UTT. There are issues regarding secrecy about the restrictions on the disclosure of research findings and on the dissemination of research results [33]. From the perspectives of industry, knowledge spill-overs to universities are higher than with other firms [27]. Gilsing et al. [27] highlighted that universities are required to disperse new technological knowledge as widely as possible, hence, amplifying the risk of information leakage. Nonetheless, even firms still publish and divulge a considerable amount of academic and technical papers to raise their competency or hinder competitors’ attempts to control specific areas of technology [32].
Another barrier of UTT is that the knowledge developed by universities may be too theoretical for practical purposes [25,27,32,56]. Shen [25] pointed out that scholars admit that the research works they developed are not aligned with industries’ needs and interests. With this, university’ knowledge may be too theoretical for firms to be useful in their application-oriented knowledge needs [27]. Insufficient rewards for university researchers is also another major barrier of UTT [25,29,30,37]. Academics face the dilemma of either publishing their work for short-term revenue and academic recognition or withholding it until patented with the risk of the technology becoming obsolete [37]. In addition, most promotion and tenure decisions are still based exclusively on publications and federal research grants rather than academic involvements with UTT [29]. With insufficient rewards, academics may only publish their works in peer-reviewed journals and participate in research conferences rather than commercializing their innovations [25].
Moreover, UTT offices should be able to evaluate and understand what the industries need and what universities can develop to facilitate collaboration between universities and industries [25]. Further, universities are actively recruiting more individuals with expertise in patent laws and licensing than individuals with marketing skills [29]. With this, universities have poor marketing, negotiation, and technical skills, which is another considerable barrier of UTT [25,29]. Consequently, Shen [25] added that university scholars have an inadequate understanding of the market trends, which results in impracticable prospects for their technologies. Thus, university proponents have unrealistic expectations regarding the value of their technologies [25,29]. Moreover, most scholars and university professors have few connections from the external environments; hence, there is a lack of recognition for university–industry linkages [25,29,57]. Another barrier of UTT is the inconsistency of the rules and regulations imposed by universities in the UTT process [25,32]. Both SMEs and large firms perceive these inconsistent rules and regulations as an important barrier of UTT that needs to be surmounted [32].
Belkhodja and Landry [30] introduced venture capitalists as an evaluator of the capabilities of the research results and enable universities to develop commercialization opportunities in various markets. However, Shen [25] pointed out that universities lack access to venture capital. Furthermore, academics pursuing commercialization may be challenging due to the costs and time effort needed to obtain UTT [31]. Gilsing et al. [27] indicated that industries participate in UTT to create and maintain a leading edge against competitors. However, to have a successful collaborative process and state-of-the-art knowledge, participants invest high costs and time [27]. In addition, implementing a collaborative project causes significant problems in terms of costly designs and re-work, which requires a considerable amount of time [58]. Hence, there are high costs of managing joint research projects in terms of time and money which are another barrier of UTT [27,31,58]. On the other hand, there are differences in the imperatives that drive university and industry strategies [59]. These cultural differences, such as motivation, timeframe, general attitudes, and communication modes, are inherent in universities and firms [25]. With this, the cultural differences between academia and enterprises are considered as another barrier of UTT [25,27,37,59].
Gilsing et al. [27] indicated that there are existing conflicting objectives between research and commercialization or misalignment between research and commercialization objectives, which is another barrier of UTT. For instance, universities prioritize the dissemination of newly acquired knowledge while enterprises aim to gain economic benefits from the UTT process [27]. Mazurkiewicz and Poteralska [26] described technology transfer as a process composed of a complex organizational structure, which, for this reason, has a complex flow of information system. The imperfection and intricacy of the transmission of information are evident among R&D organizations and technology users, which hinders the technology transfer process [26]. Furthermore, firms show less interest in innovation and technologies developed by educational institutions since the university’s system responds slowly to the demands of industries [60]. State-owned universities are required to go over the lengthy bureaucratic procedure when it comes to decision making, including decisions on technology transfer [26]. University systems are structured using a bureaucratic form of functional groups composed of faculties, schools, departments, and research groups in a hierarchical order, including a series of executive tiers [25]. This institutional bureaucracy can impede the UTT process [25,26,60].
As previously mentioned, as promotion and tenure decisions are still based on publications and federal grants of a university professor rather than academic involvements to UTT [29], it is deemed relevant that domain scholars lack the personal motivation to participate in and pursue UTT. Lyu et al. [61] defined university–industry collaboration as a complex system that comprises several types of network structures. The process complexity present in UTT adds difficulty in a successful technology transfer collaboration [61]. As suggested by Woolcock [62], a direct communication channel, such as face-to-face interaction, is a prerequisite in transferring tacit knowledge. Continuous separation of decisions can result in logical contradictions, which may hamper knowledge creation [63]. In addition, technology is progressive and co-created; thus, UTT requires active involvement from the participants involved in the collaboration process [6]. Closer geography proximity or geographic distance, facilitated by face-to-face interactions and socialization, effectively support the transfer of tacit knowledge [38]. Van Norman and Eisonkot [64] pointed out that technology transfer offices’ licenses follow specific development benchmarks that should be met. For example, universities licensing a patented drug are required to complete the basic pharmacological and other corresponding requirements before proceeding to commercialization, or else, the license will be revoked [64]. However, Mazurkiewicz and Poteralska [26] highlighted that there is still a lack of accurate assessment and benchmarks or a lack of national benchmark to evaluate successful collaboration for technology transfer.
Another barrier of UTT is the predicament between achieving high technical parameters and achieving satisfactory economic parameters [26]. There are instances when a university’s prototype technology is not compatible with the demands of mass production; hence, industries do not pursue the UTT collaboration [26]. Stronger intellectual property rights reduce informal technology transfer (i.e., imitation), and at the same time, reduce the costs of achieving formal technology transfer [65]. However, Collier et al. [59] indicated that industries consider universities, in terms of intellectual property, to be a source of aggravation and delays in a collaborative relationship. Thus, this indicates that problems concerning intellectual property rights are another barrier of UTT [59,65]. Furthermore, the procurement process is another barrier to UTT. The technology developed in the UTT process is highly technical, which raises problems regarding the acquisition of its potential producer or on its procurement process [26]. Pennsylvania’ State System of Higher Education [66] indicated that in university–industry collaboration, industrial partners were the ones handling the marketing aspect in the UTT process. This results in the lack of sales distribution centers inside the university’s premises due to the academe’s concentration on the technical aspect of the technology in the collaboration.
Various research studies have attempted a careful identification and understanding of the different barriers of UTT, one of which is the use of a qualitative survey conducted by Muscio and Vallanti [67]. Muscio and Vallanti [67] surveyed 1047 directors of Italian academic departments engaged in research, but with only 197 returned survey questionnaires (18.8% response rate). There was a total of 16 obstacles identified in a university–industry collaboration, including the lack of government funding schemes, and the fact that industry research is short-term oriented, and collaboration is detrimental to career progression. Muscio and Vallanti [67] also conducted principal-component factoring to group these 16 obstacles, and they came up with four (4) groups: conflicts with companies, academic networking problems, conflicts with academic goals and nature of research. In the same manner, Jones-Evans et al. [37] also used a qualitative survey. Face-to-face semi-structured interviews were conducted with the different industrial liaison in Sweden and Ireland. Five (5) to six (6) people were interviewed from each university in Sweden and industrial liaison office representatives were interviewed in each university in Ireland. Data gathered from these universities were subjective to qualitative analysis. Some of the identified barriers were a lack of financial resources and a lack of defining cultural relationships.
Similarly, O’Reilly and Cunningham [38], in the United Kingdom, used a qualitative approach to analyze the different barriers related to university–SME collaboration. With the use of principal investigators in data gathering, a total of three (3) challenges were identified: personal relationship, asset scarcity, and proximity issues. Also conducting a qualitative approach, Mazurkiewicz and Poteralska [26] identified a total of 36 barriers with the use of in-depth analysis supported by the authors’ understanding and practical experiences. The identified barriers are classified into three (3) categories: technical, organizational-economic, and system barriers. Mazurkiewicz and Poteralska [26] also emphasized that these barriers may be observed at three different levels: strategic, tactical, and operational levels. Muscio and Vallanti [67], Jones-Evans, et al. [37], O’Reilly and Cunningham [38] and Mazurkiewicz and Poteralska [26] all used different types of qualitative approaches to identify and analyze the different barriers of UTT. However, the use of a qualitative approach and personal understanding is highly influenced by the authors’ judgments and interpretations. Thus, the results of these studies are inherent with uncertainties that may affect the decision-making process. Barriers were also limited to the perceived understanding and experiences of these domain scholars. Moreover, there might be selection biases and inaccuracies in the data extraction process.
Jasinski [24] proposed another method to identify the barriers of UTT. The identification of the barriers was made with the use of postal questionnaires, the Delphi method, and a statistical data analysis. Postal questionnaires were sent to 79 enterprises and were used by the 40 Polish experts gathered during the Delphi method. The 44 constructed barriers were reduced to five (5) repeated barriers after two rounds of questioning. Shen [25], on the other hand, used the viewpoints of different stakeholders to identify the barriers. Thirty (30) experts with more than 10 years of experience were gathered during the Delphi process to identify the barriers. The barriers identified were lack of appropriate partners, tenure or promotion criteria, cultural differences between academia and enterprises, time constraints, among others. They used the decision-making trial and evaluation laboratory (DEMATEL) approach to investigate the causal relationships of these barriers. However, Jasinski [24] focused on the industry to industry collaboration and resulted from Shen [25] was not drawn from any statistical validations. By identifying and eventually overcoming the various barriers of UTT, participants were aided in formulating strategies for a successful collaborative process [36].
In summary, technology transfer barriers are well understood in the current literature. However, two important gaps remain: (1) a comprehensive list of UTT barriers, and (2) the interrelationships of these UTT barriers, which have not yet been defined or examined. Filling these gaps would provide a crucial understanding of the success of the UTT process and aid in relevant decision-making issues. Thus, this work intended to close these gaps by demonstrating a case study of a state university in the Philippines prominent in technology innovation and development. From the comprehensive list of technology transfer barriers identified in this section from the current literature, the Delphi approach was used to identify the barriers of UTT relevant to the Philippine setting. In addition, fuzzy cognitive mapping (FCM) was used to understand the interrelationships between the identified barriers. FCM has been successfully used to analyze the interrelationships between hazy elements, which simulates real-life systems, where subjective perceptions on elements and causal links in a given system are depicted [42,43,44]. Moreover, FCM was used to investigate interrelations between the phenomena that are presented graphically in causal maps and influence diagrams [68].

3. Methodology and the Case Study

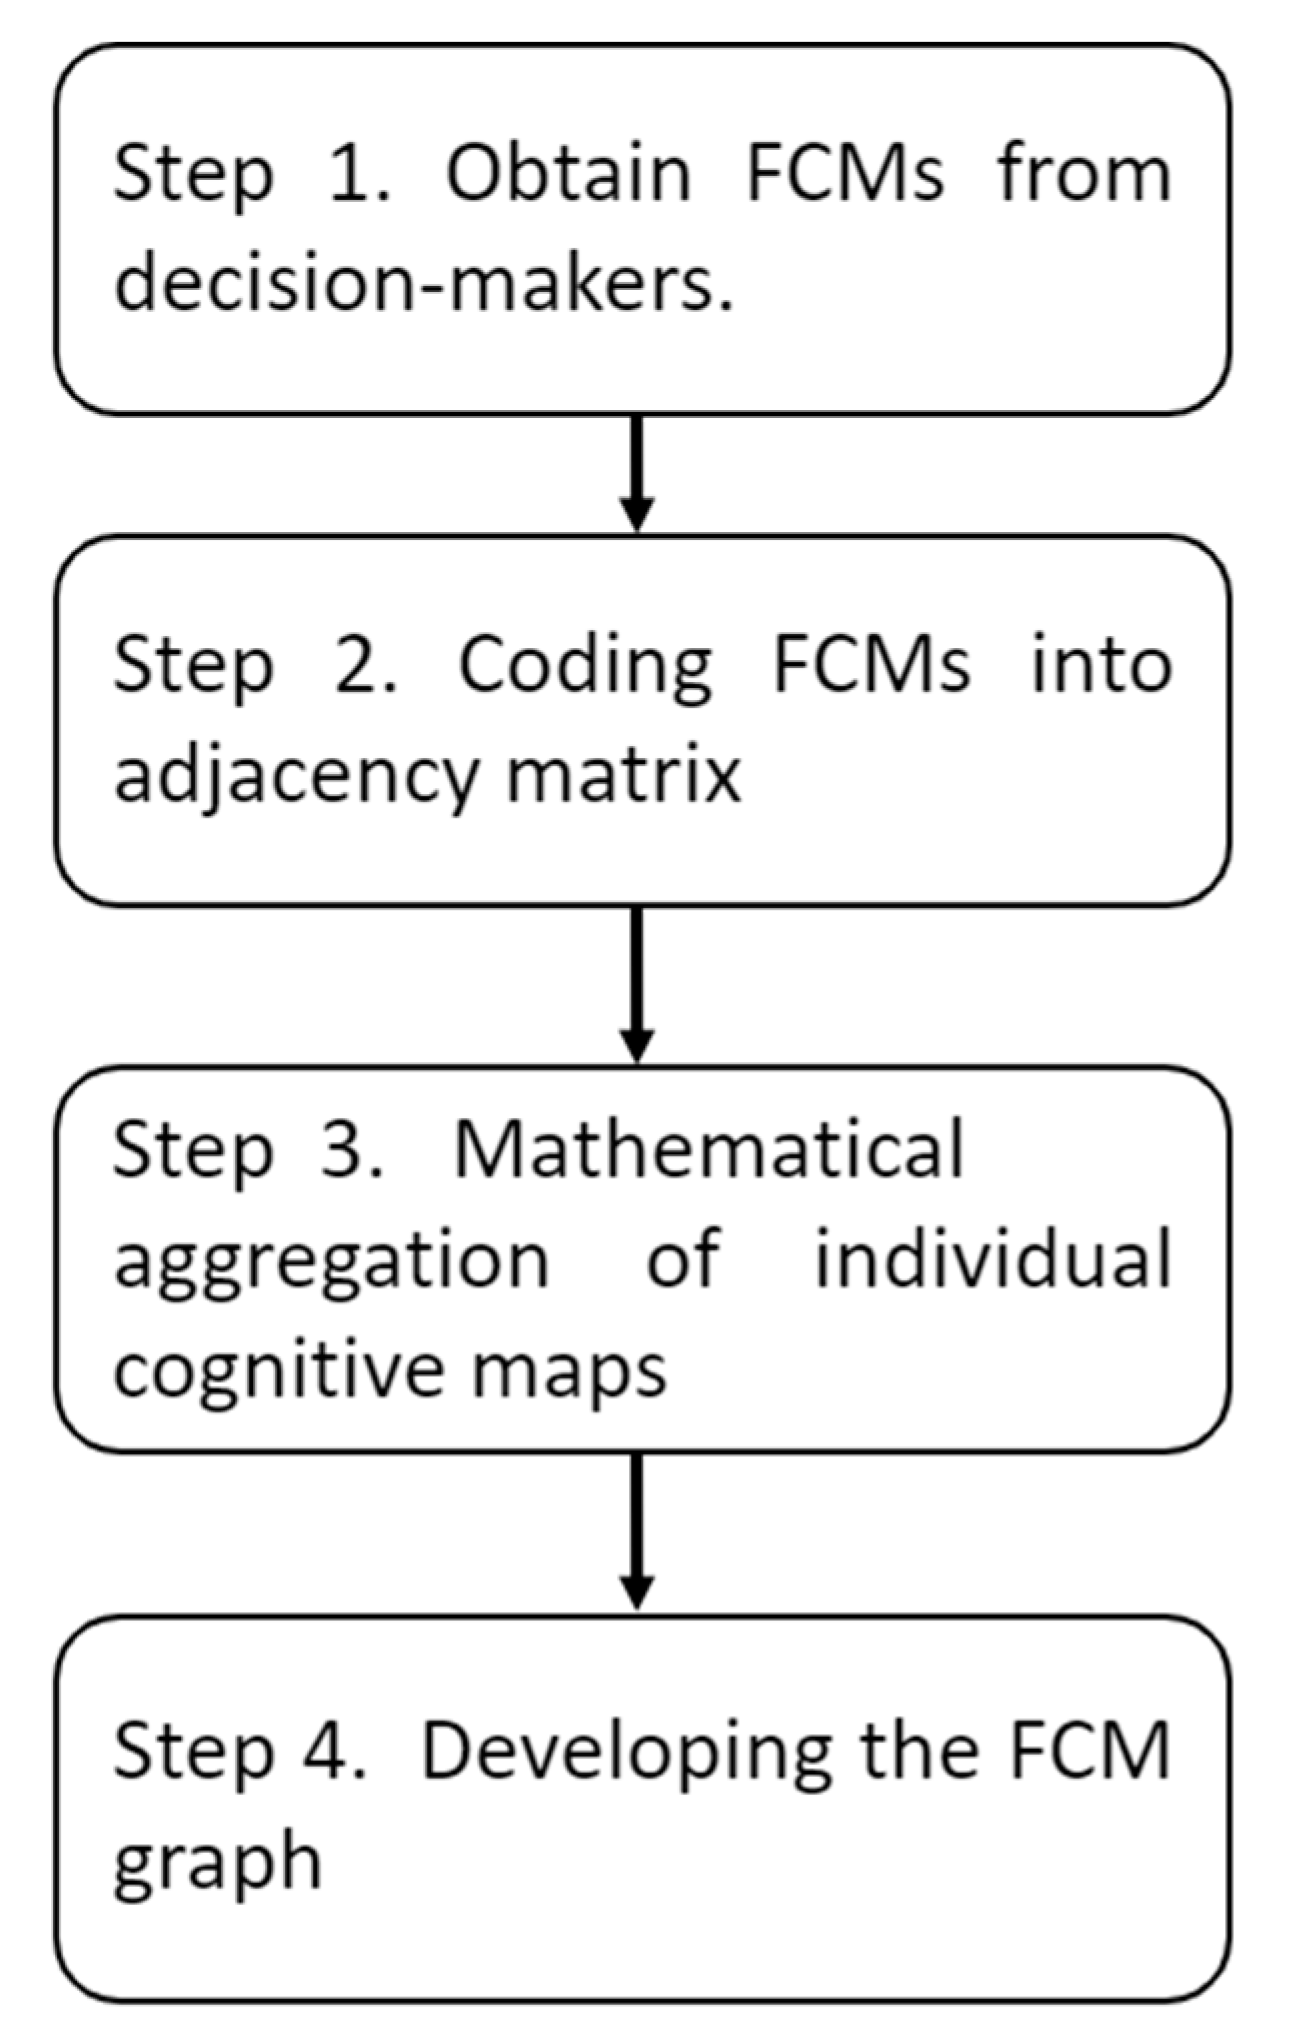
3.1. Fuzzy Cognitive Mapping

Cognitive maps are graphical representations of organized knowledge that visually illustrate the relationships between elements within a knowledge domain. They are widely adopted in several fields, particularly in political science, psychology, and disaster modeling, among others. Despite their broad applicability, scholars in the literature point out the inability of cognitive mapping to depict relationships between concepts. As such, the development of a more powerful cognitive mapping technique was widely discussed in the literature. The fuzzy cognitive map (FCM) is an extension of cognitive mapping developed by Kosko [42] that allows the modeling of causal relationships between concepts through fuzzy-graph structures under uncertain, imprecise, and ambiguous environments which result from the subjectivity of the human decision-making process. This capability of the FCM is enabled by its use of the fuzzy set theory, popularized by Zadeh [69], which treats ambiguity, imprecision, and uncertainty of sets using a mathematical process. FCM comprises concepts C = ( C 1 , C 2 , , C n ) connected through various links, where n is the number of concepts in a map [70]. A function W : ( C i , C j ) w i j ,   w h e r e   w i j [ 1 , 1 ] maps the two concepts to a fuzzy weight established using a linguistic scale. Table 1 presents an example of such a scale. Such mapping describes the fuzzy causal relationships that exist between concepts. These causal relationships are described as follows.
  • wij > 0 implies the existence of directly proportional relationships between concepts Ci and Cj
  • wij < 0 implies the existence of inversely proportional relationships between concepts Ci and Cj
  • wij = 0 implies the nonexistence of the relationship between concepts Ci and Cj
This paper adopted the FCM algorithm used by Singh and Chudasma [71], as presented in Figure 1.
Step 1. Obtain FCMs from decision-makers. A focus group discussion was formed comprising of the domain expert decision-makers to provide an avenue for decision-makers to thoroughly assess the status of the problem. Linguistic scales were used to extract the judgment of the expert decision-makers, as presented in Table 1.
Step 2. Coding FCMs into adjacency matrices. Individual FCMs independently created by the decision-makers were coded into a square adjacency matrix with the concepts in the row and column labels of the square matrix to mathematically represent the relationships depicted in the cognitive maps. The elements of the adjacency matrices contain the weights provided by the decision-makers. As such, these weights were obtained using the linguistic transformation in Table 1.
Step 3. Mathematical aggregation of individual cognitive maps. To obtain a collective representation of the system from the individual FCMs provided by the respondents, it is necessary to consolidate (or aggregate) the individual FCMs to form one aggregate FCM. The aggregation is performed by summing the individual adjacency matrices and dividing the sum by the total number of adjacency matrices, as shown in Table 2. Matrix algebra of the aggregate adjacency matrix provides indices crucial to analyzing the structure of the network. As such, the FCM network can be described using (1) density, (2) in-degree, (3) out-degree, and (4) centrality. The density (D) of a cognitive map is an index of connectivity described by the relationships of the number of links (W) and the number of concepts (C) in Equation (1). The in-degree is the column sum of the absolute values of a concept in the aggregate adjacency matrix as in Equation (2). The out-degree is the row sum of the absolute values of a concept in the aggregate adjacency matrix, as in Equation (3). The centrality of a concept is the sum of its in-degree and out-degree. As such, transmitter concepts are characterized as having positive out-degree and zero in-degree, whereas, receiver concepts have positive in-degree and zero out-degree. Ordinary concepts have both non-zero in-degree and out-degree.
D = W C ( C 1 )
I n d e g r e e = i = 1 n w i j
O u t d e g r e e = j = 1 n w i j
Step 4. Developing the FCM graph. From the weight matrix presented in Table 3, the FCM graph was constructed. The FCM is a graph G = ( V , E ) which is a set of vertices V = { v 1 , v 2 , } together with a set of edges E = { e 1 , e 2 , } that connect pairs of vertices. The concepts are represented by the vertices, while the interrelationships are represented by the edges.

3.2. Case in Point: A Philippine State University

The Philippines has been supporting the conduct of technology transfer since the implementation of the Philippine Technology Transfer Act of 2009. Through this law, the Philippines intends to facilitate the utilization of intellectual property by way of promoting it for public benefit. The Department of Science and Technology (DOST), Philippine government sector for science and technology has been reported to release Php 8.55 million (166,000 USD) for technology transfer assistance in Cebu, an industrial hub in the central Philippines. The Technology Application and Promotion Institute (TAPI) is specifically designed as the DOST arm for technology transfer. DOST, together with the Cebu Chamber of Commerce and Industry (CCCI), a non-profit organization, consists of business and professionals in Cebu—one of the progressive metropolitans has been revolutionizing science and technology to assist the promotion of technology transfer in the Philippines [72]. Furthermore, a total of Php 27 million (524,000 USD) worth of technology transfer assistance was given by 15 different companies. With DOST’s support, over 40 grants-in-aid (GIA) projects from private and state universities were accomplished in a collaborative process. Even with the massive support from the Philippine national government, UTT is still in its growing and development stage.
Hence, a case study was conducted in the Philippines, specifically in a state university (or HEI) in Cebu, Philippines. This case state university has continuously developed initiatives for technology innovation and licensing of research outputs from its stakeholders (i.e., students, faculty members, staff). As a result, it has been awarded locally with the highest number of filed, registered, and transferred utility models. For the past ten years, it obtained an estimated of over 15 million USD in external grants to support R&D activities, technology development, production and transfer, and community extension initiatives. Additionally, the case HEI has partnered with government and private institutions and NGOs in its technology transfer activities. Some of these partners include multi-purpose cooperatives, people’s organizations, MSMEs, banks and financial institutions, rural communities, and poor urban communities. Note that this list is not intended to be comprehensive. The university has also instituted a separate higher office that oversees production, techno-transfer, extension, and business affairs. However, the university management has observed that the transfer rates of these utility models are low and insights on how to pursue technology transfer are still inadequate, despite its efforts to boost technology transfer. Such insights may be created by identifying and extensively understanding the barriers involved in UTT. Thus, it is crucial to identify the different barriers of UTT, as well as their complex relationships, in the case of a state university.
In addressing the need for the case HEI, a comprehensive review of the domain technology transfer literature was conducted. This review was intended to list all the barriers of the general technology transfer as well as the UTT. Using keywords such as “barriers of university technology transfer”, “challenges of university technology transfer”, “barriers of technology transfer”, “challenges of technology transfer”, result documents from the SCOPUS database search were downloaded. A total of 41 documents were extracted. The initial list obtained from the current literature contains 46 barriers. To identify relevant UTT barriers for the case HEI, ten (10) expert decision-makers were gathered for the Delphi process. In the same manner as other relevant works, e.g., [73,74], this study adopted the purposive sampling technique, wherein qualifications of respondents are identified at the outset. The median number of years in the government service, as part of the state university, is 26 years, spanning from 8-40 years in service. The median numbers of years of the respondents are 5 years in technology transfer, and 3.5 years in production. Six of the respondents are authors of IP assets, and seven are makers. Most of the respondents are also patent owners, ranging from 1 to 2 patents, utility model (UM) owners, 2–25 UMs, six (6) industrial designs, and four (4) trademark owners. Two (2) of the respondents have the academic rank of Associate Professor IV, two (2) are Professor VI, and one (1) is an Assistant Professor IV. One respondent is the Chair of the Mathematics & Science Department, a Production Manager, an Extension Services Coordinator, and a Graduate School Director. These qualifications highlight the expertise of the respondents about the study.
The Delphi process started with the facilitator describing and explaining the context of each UTT barrier. It was followed by asking the Delphi group the possibility to add more barriers outside the list they deemed necessary. The group made a consensus that two barriers must be added in the initial list: (1) procurement process and the (2) lack of sales distribution centers within the university premises. With the additional two barriers, the initial list now contains 48 barriers. The first iteration of the Delphi process requires each member of the group to identify independently the relevant UTT barriers. With ten members of the group, the consensus follows a supermajority; that is, a barrier that has a minimum of 8 affirmative votes from the group qualifies the barrier for the next iteration of the Delphi process. The first iteration resulted in 26 UTT barriers. Using the same steps as in the first iteration, the second iteration resulted in 24 UTT barriers. Finally, the third iteration yielded 24 of the same UTT barriers. Since the convergence of group decisions was achieved, the Delphi process terminated after the third iteration. The final list of barriers is shown in Table 4. After obtaining the list of barriers presented in Table 4, another group of participants with the same qualifications was asked to answer a questionnaire patterned after the FCM. After the barriers were identified, the experts were asked to determine the extent of the relationships between the barriers based on their membership function, as shown in Table 1.

4. Results and Discussion

The FCM approach enables the determination of causal relationships between concepts elicited by expert decision-makers on UTT. The expert judgments were drawn using linguistic scales describing the association of two concepts, as presented in Table 2. Such scales were then transformed into their corresponding numerical fuzzy values to quantitatively evaluate the relationships exhibited by such concepts. The relationships identified by each decision-maker were encoded into a weight matrix. As such, these weight matrices were aggregated to obtain a matrix with arithmetic means as its element, as presented in Table 3, and are further clustered based on such relationships as shown in Figure 2. To ensure that only significant relationships were considered, a threshold was established by the decision-makers. The threshold was set at ± 0.3 so that values that fell within −0.3 to +0.3 were set to zero and were assumed to exhibit insignificant relationships. The final weight matrix was then obtained, as presented in Table 5. In the FCM, it is crucial to obtain the characteristics of the graph. These characteristics are the in-degree, out-degree, centrality, density, and hierarchical index. The in-degree measure, obtained as the sum of the column elements, describes the magnitude at which a concept is influenced by other concepts. As such, the FCM developed in this work has a total in-degree of 4.3, which is relatively small compared to its maximum in-degree possible (i.e., the sum of the column elements with every element set to 1). The out-degree measure, obtained as the sum of the row elements, describes the magnitude at which a concept influences other concepts. As such, the FCM arrived at this manuscript has a total out-degree of 3.8375, which is relatively small in comparison with its maximum out-degree possible. The centrality measure (i.e., the sum of the out-degree and in-degree) describes the role of a concept as an intermediate concept (i.e., being both a driving and a dependent concept). As such, this centrality attained by the FCM is 8.1375, which is very low compared to its maximum centrality possible. Moreover, the density which measures the connectedness of the FCM was found to be very low at approximately 0.0199.
The barrier with the highest in-degree measure is barrier 14 (misalignment between research and commercialization objectives) which appears to be the most influenced among all barriers, primarily by barrier 12 (high costs of managing joint research projects in terms of time and money) and barrier 6 (insufficient rewards for university researchers). One reason that the objective of the academics in the university is not coherent with the industry’s objective could be that industry partners have high expectations on the commercialization potentials of their university counterparts; however, the output generated by academics in Philippine state universities is lagged by the lack of incentives (barrier 6) provided by the university top management. Moreover, the research initiatives of most Philippine state universities are not primarily geared towards commercialization as university researchers and faculty members tend to engage more in scholarly publications and presentations than commercialization initiatives. This condition is driven by the existing institutional policies across the county concerning tenure and promotion, as well as rewards (e.g., ranking, promotion, incentives), which are highly inclined towards scholarly works compared to commercialization. In effect, the allocation of resources follows such policies and the university partners have no well-defined financial support to carry the high costs associated with managing joint projects leading to commercialization (barrier 12).
The barrier with the highest out-degree measure is barrier 12 (high costs of managing joint research projects in terms of time and money) influencing barrier 7 (poor marketing/technical/negotiation skills of technology transfer office), barrier 14 (misalignment between research and commercialization objectives), and barrier 19 (geographic distance). Consistently with several works in the literature, such as Gilsing et al. [27], Mosey et al. [31], and Sjodin et al. [58], cost is a significant driving variable influencing other barriers. The link between barrier 12 and barrier 14 has already been discussed. In the Philippine setting, state universities tend to avoid incurring additional costs in marketing, information systems, and significantly distant partners, among others, due to the high cost of joint research projects. With a lack of resources to support the costs of managing joint research projects, the necessary skills of the technology transfer office are compromised and reaching out to distant partners is often discouraged. Subsequently, it was found in this paper that several barriers do not interact with other barriers of UTT in Philippine state universities, e.g., lack of appropriate partners, lack of recognition for university–industry linkages, inconsistent rules and regulations, and lack of venture capital. Such a result may hold because, in the Philippine setting, these barriers are perceived to be barriers that hinder UTT on their own without affecting and being affected by other barriers of UTT.
After barrier 12 (high costs of managing joint research projects in terms of time and money), the barrier with the highest out-degree is barrier 16 (institutional bureaucracy), successively influencing barrier 4 (risk of information leakage), barrier 3 (lack of resources), and barrier 7 (poor marketing/technical/negotiation skills of technology transfer office), as well as influencing barrier 5 (knowledge being too theoretical for practical purposes) and barrier 13 (cultural differences between academia and enterprises). The link between institutional bureaucracy and information leakage can be better explained from the “more exposure, more risk” perspective. With an increased footprint brought about by institutional bureaucracy, the tendency for technical information about the technology to be disclosed would likely increase. Thus, partners in the UTT process are often discouraged from engaging in collaborative efforts with such information leakages and intellectual property infringement. With a decrease in the willingness to collaborate and sponsor research initiatives, resources become scarce, and without resources, it is challenging to capacitate the necessary skills of the technology transfer office. Institutional bureaucracy, on the other hand, leads to barriers to knowledge being too theoretical for practical purposes and cultural differences between academia and enterprises. These links are brought about by the condition whereby university researchers and industry partners are discouraged from collaborating due to an enormous amount of effort being required to overcome institutional bureaucratic requirements.
In this work, two crucial findings were observed. First, the relevant UTT barriers in the Philippine context were exposed. These barriers become inputs to university and government policy-makers, particularly in the context of open innovation. Secondly, the most crucial barriers (i.e., high costs of managing joint research projects in terms of time and money and institutional bureaucracy) were identified. To address the high costs of managing joint research projects, the Philippine government must take a facilitation position [75] and may course these actions (1) to provide subsidies to state universities for UTT projects, and (2) to establish policies that would ease out the industry-academe linkage and provide mechanisms for remunerations and rewards. These two courses of actions, which encourage an open innovation platform, are an important step to the promotion of sustainability in the current fourth industrial revolution [75]. Providing subsidies for UTT projects is a straightforward approach to increase resources in encouraging industry and academe partners to collaborate. Furthermore, when policies are in place to encourage industry-academe linkage, more collaborations may flourish and industry partners may increase their trust and confidence to share their resources to universities to support UTT projects. Such initiatives of easing out the industry-academe linkage involve reward systems in terms of tax incentives to industries having active collaboration with state universities. This approach attracts more industry partners to support more value-adding R&D, as well as commercialization, efforts of the universities. Addressing institutional bureaucracy is a complex and challenging task and requires systemic efforts. Such efforts may include Philippine charter change, the strong political will of policy-makers, the commitment of partners to streamline the UTT process, adopting strategic management among partners, and establishing effective fool-proof policies against corruption tendencies. The task is undeniably laborious, but the benefits when institutional bureaucracy is addressed are encompassing and wide-ranging for the entire UTT process.

5. Conclusions and Future Work

Technology transfer is viewed as an essential process by numerous organizations and stakeholders, despite the complexity of the process. Inherent within its complexity are the various barriers that hinder universities from achieving a successful UTT process. Hence, a plethora of studies in the literature have ventured to understand the existence of these barriers. However, the dynamics of UTT barriers are fragmented in the current literature, and limited effort has been made to establish a comprehensive list of UTT barriers and their possible interrelationships. Establishing a list of UTT challenges is crucial in streamlining the significant hindrances of UTT, which would aid in planning, resource allocation decisions, policy-making, and decision-making. Furthermore, understanding the interrelationships of these barriers provides essential insights to understand the complexity of the UTT process, which would be valuable in generating strategies to overcome these barriers.
The gaps in the current literature were addressed using a Delphi process and fuzzy cognitive mapping. The study conducted in the Philippines could provide vital results that are highly relevant to state universities in developing countries. First, 24 barriers were identified (e.g., lack of resources, geographic distance, among others) within the Delphi process. Then, the highly influential barrier was identified as the high costs of managing joint research projects in terms of time and money, which impacts the barrier on poor marketing/technical/negotiation skills of technology transfer office, the challenges on the misalignment between research and commercialization objectives, and the geographic distance barrier. Consequently, the institutional bureaucracy barrier was determined to influence the barrier of the risk of information leakage, the challenges on knowledge of being too theoretical for practical purposes, and the barrier about cultural differences between academia and enterprises. Moreover, the barrier to the misalignment between research and commercialization appears to be the most influencial among all barriers.
While challenges of UTT are inevitable, identification of these barriers and their interrelationships is crucial for the strategic development of attaining successful UTT. Thus, higher education institutions must provide priority in financial resource allocation for UTT. The allocation must be developed carefully to address primarily the improvement of marketing and technical skills for university technology transfer, significant involvement of relevant industries, and other stakeholders that would facilitate face-to-face interactions and socialization that expectedly would result in better alignment of research activities embracing both university priority and enterprises.
Moreover, the results of the work would be subject to a few contextual factors (e.g., cultural, social, and bureaucratic factors) owing to it being conducted in only one situation to some extent. For future works, several modeling approaches can be used to analyze the interrelationships between concepts. For instance, formal concept analyses can be undertaken to cluster concepts that share similar attributes and characteristics before developing a cognitive map, which would minimize redundant concepts. Moreover, empirical studies may be undertaken to investigate the relationships established in this work. Other modeling approaches may be adopted to extract further the underlying structure that exists in the UTT of Philippine state universities. Finally, empirical works may also be explored on how fuzzy cognitive mapping can be used to (1) understand the varying impact of open innovation on technology transfer, such as those espoused by Yun et al. [76], and (2) determine how dynamics of sub-economies of open innovation affect economic dynamics and economic growth [77].

Author Contributions

Conceptualization, R.Q., H.Q., C.H., L.O.; Writing—original draft, J.A.C., S.A.C., D.P.A., E.M.J.; Formal analysis, R.Q., J.A.C., H.Q., S.A.C., D.P.A., E.M.J., C.H., L.O.; Writing—review and editing, J.A.C., D.P.A., C.H., L.O.

Funding

This research was funded by the Cebu Technological University under the University technology development, transfer and commercialization research program.

Acknowledgments

The authors would like to acknowledge Cebu Technological University for the financial aid, as well as the expert respondents of this study.

Conflicts of Interest

The authors declare no conflict of interest.

References

  1. United Nations Department of Economic and Social Affairs, “United Nations”. 2008. Available online: https://sustainabledevelopment.un.org/content/documents/tec_technology_dev.pdf (accessed on 18 July 2019).
  2. Bozeman, B.; Rimes, H.; Youtie, J. The evolving state-of-the-art in technology transfer research: Revisiting the contingent effectiveness model. Res. Policy 2015, 44, 34–49. [Google Scholar] [CrossRef]
  3. Botchie, D.; Sarpong, D.; Bi, J. A comparative study of appropriateness and mechanisms of hard and soft technologies transfer. Technol. Forecast. Soc. Chang. 2018, 131, 214–226. [Google Scholar] [CrossRef]
  4. United Nations Industrial Development Organization. Technology Transfer and Trade: The Toy Industry in India; UNIDO—Industrial Promotion and Technology Branch: Viena, Austria, 2005. [Google Scholar]
  5. Lafuente, E.; Berbegal-Mirabent, J. Assessing the productivity of technology transfer offices: An analysis of the relevance of aspiration performance and portfolio complexity. J. Technol. Transf. 2019, 44, 778–801. [Google Scholar] [CrossRef]
  6. Min, J.-W.; Vonortas, N.S.; Kim, Y. Commercialization of transferred public technologies. Technol. Forecast. Soc. Chang. 2019, 138, 10–20. [Google Scholar] [CrossRef]
  7. Chen, W.; Li, L. Complexity evolution of capital and technology transfer in climate negotiation. Commun. Nonlinear Sci. Numer. Simul. 2018, 64, 20–34. [Google Scholar] [CrossRef]
  8. Mowery, D.C.; Nelson, R.R.; Sampat, B.N.; Ziedonis, A.A. The growth of patenting and licensing by U.S. universities: An assessment of the effects of the Bayh–Dole act of 1980. Res. Policy 2001, 30, 99–119. [Google Scholar] [CrossRef]
  9. Aldridge, T.T.; Audretsch, D. The Bayh-Dole Act and scientist entrepreneurship. Res. Policy 2011, 40, 1058–1067. [Google Scholar] [CrossRef]
  10. Baglieri, D.; Tucci, C.L.; Baldi, F. University technology transfer office business models: One size does not fit all. Technovation 2018, 76, 51–63. [Google Scholar] [CrossRef]
  11. Schrankler, J. The role of university technology transfer. In Medical Innovation; Behrns, K.E., Gingles, B., Sarr, M.G., Eds.; University of Minnesota: Minneapolis, MN, USA, 2018; pp. 31–41. [Google Scholar]
  12. Messeni Petruzzelli, A.; Murgia, G. University–Industry collaborations and international knowledge spillovers: A joint-patent investigation. J. Technol. Transf. 2019. [Google Scholar] [CrossRef]
  13. Kapetaniou, C.; Lee, S.H. A framework for assessing the performance of universities: The case of Cyprus. Technol. Forecast. Soc. Chang. 2017, 123, 169–180. [Google Scholar] [CrossRef]
  14. Guiri, P.; Munari, F.; Scandura, A.; Toschi, L. The strategic orientation of universities in knowledge transfer activities. Technol. Forecast. Soc. Chang. 2019, 138, 261–278. [Google Scholar] [CrossRef]
  15. Battaglia, D.; Landoni, P.; Rizzitelli, F. Organizational structures for external growth of University Technology Transfer Offices: An explorative analysis. Technol. Forecast. Soc. Chang. 2017, 123, 45–56. [Google Scholar] [CrossRef]
  16. Debackere, K.; Veugelers, R. The role of academic technology transfer organizations in improving industry science links. Res. Policy 2005, 34, 321–342. [Google Scholar] [CrossRef]
  17. Fischer, B.B.; Schaeffer, P.R.; Vonortas, N.S. Evolution of university-industry collaboration in Brazil from a technology upgrading perspective. Technol. Forecast. Soc. Chang. 2019, 145, 330–340. [Google Scholar] [CrossRef]
  18. Dagiliut, R.; Liobikiene, G. University contributions to environmental sustainability: Challenges and opportunities from the Lithuanian case. J. Clean. Prod. 2015, 108, 891–899. [Google Scholar] [CrossRef]
  19. Li, Y.; Arora, S.; Youtie, J.; Shapira, P. Using web mining to explore Triple Helix influences on growth in small and mid-size firms. Technovation 2018, 76, 3–14. [Google Scholar] [CrossRef]
  20. Zhang, Y.; Zhou, X.; Porter, A.L.; Vicente Gomila, J.M.; Yan, A. Triple Helix innovation in China’s dye-sensitized solar cell industry: Hybrid methods with semantic TRIZ and technology roadmapping. Scientometrics 2013, 99, 55–75. [Google Scholar] [CrossRef]
  21. Leydesdorff, L.; Sun, Y. National and International Dimensions of the Triple Helix in Japan: University–Industry–Government Versus International Coauthorship Relations. J. Am. Soc. Inf. Sci. Technol. 2009, 60, 778–788. [Google Scholar] [CrossRef]
  22. Svarc, J.; Dabic, M. The Croatian path from socialism to European membership through the lens of technology transfer policies. J. Technol. Transf. 2019, 44, 1476–1504. [Google Scholar] [CrossRef]
  23. Kumar, S.; Luthra, S.; Haleem, A.; Mangla, S.K.; Garg, D. Identification and evaluation of critical factors to technology transfer using AHP approach. Int. Strateg. Manag. Rev. 2015, 3, 24–42. [Google Scholar] [CrossRef]
  24. Jasinski, A.H. Barriers for technology transfer: The case of a country in transition. Technol. Manag. China 2009, 4, 119–131. [Google Scholar] [CrossRef]
  25. Shen, Y.C. Identifying the key barriers and their relationships impeding the university technology transfer in taiwan: A multi-stakeholder perspective. Qual. Quant. 2016, 51, 2865–2884. [Google Scholar] [CrossRef]
  26. Mazurkiewicz, A.; Poteralska, B. Technology transfer barriers and challenges faced by R&D organizations. Procedia Eng. 2017, 182, 457–465. [Google Scholar]
  27. Gilsing, V.; Bekkers, R.; Freitas, I.M.B.; van der Steen, M. Differences in technology transfer between science-based and development-based industries: Transfer mechanisms and barriers. Technovation 2011, 31, 638–647. [Google Scholar] [CrossRef]
  28. De Beer, C.; Secundo, G.; Passiante, G.; Schutte, C.S.L. A mechanism to share best practices between university technology transfer offices. Knowl. Manag. Res. Pract. 2017, 15, 523–532. [Google Scholar] [CrossRef]
  29. Siegel, D.S.; Waldman, D.A.; Atwater, L.E.; Link, A.N. Toward a model of effective transfer of scientific knowledge from academicians to practitioners: Qualitative evidence from the commercialization of university technologies. J. Eng. Technol. Manag. 2004, 21, 115–142. [Google Scholar] [CrossRef]
  30. Belkhodja, O.; Landry, R. The triple-helix collaboration: Why do researchers collaborate with industry and the government? What are the factors that influenced the perceived barriers? Scientometrics 2007, 70, 301–332. [Google Scholar] [CrossRef]
  31. Mosey, S.; Lockett, A.; Westhead, P. Creating network bridges for university technology transfer: The Medici fellowship programme. Technol. Anal. Strateg. Manag. 2006, 18, 71–91. [Google Scholar] [CrossRef]
  32. Bruneel, J.; D’Este, P.; Salter, A. Investigating the factors that diminish the barriers to university–industry collaboration. Res. Policy 2010, 39, 858–868. [Google Scholar] [CrossRef]
  33. Tartari, V.; Salter, A.; D’Este, P. Crossing the Rubicon: Exploring the factors that shape academics’ perceptions of the barriers to working with industry. Camb. J. Econ. 2012, 36, 655–677. [Google Scholar] [CrossRef]
  34. Eleftheriadis, I.M.; Anagnostopoulou, E.G. Identifying barriers in the diffusion of renewable energy sources. Energy Policy 2015, 80, 153–164. [Google Scholar] [CrossRef]
  35. Schwarcz, S.; Richards, T.A.; Frank, H.; Wenzel, C.; Chin Hsu, L.; Chi-Sheng, J.C.; Murphy, J.; Dilley, J. Identifying barriers to HIV testing: Personal and contextual factors associated with late HIV testing. AIDS Care 2011, 23, 892–900. [Google Scholar] [CrossRef] [PubMed]
  36. Baron, S. Overcoming Barriers to Technology Transfer. Res. Technol. Manag. 1990, 33, 38–43. [Google Scholar] [CrossRef]
  37. Jones-Evans, D.; Klofsten, M.; Andersson, E.; Pandya, D. Creating a bridge between university and industry in small European countries: The role of the industrial liaison office. R D Manag. 1999, 29, 47–56. [Google Scholar] [CrossRef]
  38. O’Reilly, P.; Cunningham, J.A. Enablers and barriers to university technology transfer engagements with small- and medium-sized enterprises: Perspectives of principal investigators. Small Enterp. Res. 2017, 24, 274–289. [Google Scholar] [CrossRef]
  39. Vidal, L.A.; Marle, F.; Bocquet, J.C. Using a Delphi process and the Analytic Hierarchy Process (AHP) to evaluate the complexity of projects. Expert Syst. Appl. 2011, 38, 5388–5405. [Google Scholar] [CrossRef]
  40. Kumar, A.; Kaviani, M.; Bottani, E.; Dash, M.; Zavadskas, E. Investigating the role of social media in polio prevention in India: A Delphi-DEMATEL approach. Kybernetes 2018, 47, 1053–1072. [Google Scholar] [CrossRef]
  41. Gardas, B.; Raut, R.; Narkhede, B. Modeling the challenges to sustainability in the textile and apparel (T&A) Sector: A Delphi-DEMATEL Approach. Sustain. Prod. Consum. 2018, 15, 96–108. [Google Scholar]
  42. Kosko, B. Fuzzy cognitive maps. Int. J. Man Mach. Stud. 1986, 24, 65–75. [Google Scholar] [CrossRef]
  43. Papageorgiou, E.I.; Aggelopoulou, K.D.; Gemtos, T.A.; Nanos, G.D. Yield prediction in apples using Fuzzy Cognitive Map learning approach. Comput. Electron. Agric. 2013, 91, 19–29. [Google Scholar] [CrossRef]
  44. Wang, L.; Liu, Q.; Dong, S.; Soares, C.G. Effectiveness assessment of ship navigation safety countermeasures using fuzzy cognitive maps. Saf. Sci. 2019, 117, 352–364. [Google Scholar] [CrossRef]
  45. Storto, C. Small group problem-solving and knowledge creation: A fuzzy coognitive maps investigation. Adv. Sci. Lett. 2016, 22, 1282–1286. [Google Scholar] [CrossRef]
  46. Gray, S.; Gagnon, A.; Gray, S.; O’Dwyer, B.; O’Mahony, C.; Muir, D.; Devoy, R.; Falaleeva, M.; Gault, J. Are coastal managers detecting the problem? Assessing stakeholder perception of climate vulnerability using Fuzzy Cognitive Mapping. Ocean Coast. Manag. 2014, 94, 74–89. [Google Scholar] [CrossRef]
  47. Christen, B.; Kjeldsen, C.; Dalgaard, T.; Martin-Ortega, J. Can fuzzy cognitive mapping help in agricultural policy design and communication? Land Use Policy 2015, 45, 64–75. [Google Scholar] [CrossRef] [Green Version]
  48. Amirkhani, A.; Papageorgiou, E.I.; Mohseni, A.; Mosavi, M.R. A Review of Fuzzy Cognitive Maps in Medicine: Taxonomy, Methods, and Applications. Comput. Methods Programs Med. 2017, 142, 129–145. [Google Scholar] [CrossRef] [PubMed]
  49. Nápoles, G.; Grau, I.; Bello, R.; Grau, R. Two-steps learning of Fuzzy Cognitive Maps for prediction and knowledge discovery on the HIV-1 drug resistance. Expert Syst. Appl. 2014, 41, 821–830. [Google Scholar] [CrossRef]
  50. Amer, M.; Daim, T.U.; Jetter, A. Technology roadmap through fuzzy cognitive map-based scenarios: The case of wind energy sector of a developing country. Technol. Anal. Strateg. Manag. 2015, 28, 131–155. [Google Scholar] [CrossRef]
  51. Vasslides, J.M.; Jensen, O.P. Fuzzy cognitive mapping in support of integrated ecosystem assessments: Developing a shared conceptual model among stakeholders. J. Environ. Manag. 2017, 166, 348–356. [Google Scholar] [CrossRef]
  52. Salleh, M.S.; Omar, M.Z. University-industry collaboration models in Malaysia. Procedia Soc. Behav. Sci. 2013, 102, 654–664. [Google Scholar] [CrossRef] [Green Version]
  53. Gibson, D.V.; Smilor, R.W. Key variables in technology transfer: A field-study based empirical analysis. J. Eng. Technol. Manag. 1991, 8, 287–312. [Google Scholar] [CrossRef]
  54. Agmon, T.; von Glinow, M.A. Technology Transfer in International Business; Oxford Universities Press: Oxford, UK, 1991; Volume 20, pp. 267–270. [Google Scholar]
  55. Greiner, M.A.; Franza, R.M. Barriers and bridges for successful environmental technology transfer. J. Technol. Transf. 2003, 28, 167–177. [Google Scholar] [CrossRef]
  56. Sa, C.M.; Li, S.X.; Faubert, B. Faculties of education and institutional strategies for knowledge mobilization: An exploratory study. High. Educ. 2010, 61, 501–512. [Google Scholar] [CrossRef]
  57. Galan-Muros, V.; Plewa, C. What drives and inhibits university-industry cooperation in Europe? A comprehensive assessment. R D Manag. 2016, 46, 369–382. [Google Scholar] [CrossRef]
  58. Sjodin, D.R.; Frishammar, J.; Eriksso, P.E. Managing uncertainty and equivocality in joint process development projects. J. Eng. Technol. Manag. 2016, 39, 13–25. [Google Scholar] [CrossRef]
  59. Collier, A.; Gray, B.J.; Ahn, M.J. Enablers and barriers to university and high technology SME partnerships. Small Enterp. Res. 2011, 18, 2–18. [Google Scholar] [CrossRef]
  60. Brimble, P.; Doner, R.F. University-industry linkages and economic development: The case of Thailand. World Dev. 2007, 35, 1021–1036. [Google Scholar] [CrossRef]
  61. Lyu, L.; Wu, W.; Hu, H.; Huang, R. An evolving regional innovation network: Collaboration among industry, university, and research institution in China’s first technology hub. J. Technol. Transf. 2019, 44, 659–680. [Google Scholar] [CrossRef]
  62. Woolcock, M. Social capital and economic development: Toward a theoretical synthesis and policy framework. Theory Soc. 1998, 27, 151–208. [Google Scholar] [CrossRef]
  63. Nonaka, I. A Dynamic Theory of Organizational Knowledge Creation. Organ. Sci. 1994, 5, 14–37. [Google Scholar] [CrossRef]
  64. Van Norman, G.A.; Eisonkot, R. Technology transfer: From the research bench to commercialization. JACC Basic Transl. Sci. 2017, 2, 85–97. [Google Scholar] [CrossRef]
  65. Shujing, Q. The analysis on barriers of low carbon technology transfer. Energy Procedia 2012, 14, 1398–1403. [Google Scholar] [CrossRef] [Green Version]
  66. Pennsylvania’s State System of Higher Education. 2018. Available online: http://www.passhe.edu/inside/policies/Policies_Procedures_Standards/Technology%20Transfer%20and%20Commercialization%20Services%202018-37.pdf (accessed on 18 June 2019).
  67. Muscio, A.; Vallanti, G. Perceived obstacles to university–industry collaboration: Results from a qualitative survey of Italian academic departments. Ind. Innov. 2014, 21, 410–429. [Google Scholar] [CrossRef] [Green Version]
  68. Schroder, H.-H.; Jetter, A.J. Integrating market and technological knowledge in the fuzzy front end: An FCM-based action support system. Int. J. Technol. Manag. 2003, 26, 517–539. [Google Scholar] [CrossRef]
  69. Zadeh, L.A. Fuzzy Sets. Inf. Control 1965, 8, 338–353. [Google Scholar] [CrossRef] [Green Version]
  70. Özesmi, U.; Özesmi, S.L. Ecological models based on people’s knowledge: A multi-step fuzzy cognitive mapping approach. Ecol. Model. 2004, 176, 43–64. [Google Scholar] [CrossRef] [Green Version]
  71. Singh, P.K.; Chudasama, H. Assessing impacts and community preparedness to cyclones: A fuzzy cognitive mapping approach. Clim. Chang. 2017, 143, 337–354. [Google Scholar] [CrossRef]
  72. Dagooc, E.M. The Freeman. 2017. Available online: https://www.philstar.com/the-freeman/cebu-business/2017/06/20/1711975/ccci-and-dost-support-technology-transfer-act (accessed on 21 June 2019).
  73. Tseng, M.L. Modeling sustainable production indicators with linguistic preferences. J. Clean. Prod. 2013, 40, 46–56. [Google Scholar] [CrossRef]
  74. Ocampo, L.A.; Promentilla, M.A.B. Development of a sustainable manufacturing strategy using analytic network process. Int. J. Bus. Syst. Res. 2016, 10, 262–290. [Google Scholar] [CrossRef]
  75. Yun, J.J.; Liu, Z. Micro-and macro-dynamics of open innovation with a quadruple-helix model. Sustainability 2019, 11, 3301. [Google Scholar] [CrossRef] [Green Version]
  76. Yun, J.J.; Jeong, E.; Lee, Y.; Kim, K. The effect of open innovation on technology value and technology transfer: A comparative analysis of the automotive, robotics, and aviation industries of Korea. Sustainability 2018, 10, 2459. [Google Scholar] [CrossRef] [Green Version]
  77. Yun, J.J.; Won, D.; Park, K. Entrepreneurial cyclical dynamics of open innovation. J. Evol. Econ. 2018, 28, 1151–1174. [Google Scholar] [CrossRef]
Figure 1. Fuzzy cognitive maps algorithm.
Joitmc 05 00094 g001
Figure 2. Fuzzy cognitive map.
Joitmc 05 00094 g002
Table 1. Membership functions for the fuzzy weights.
Linguistic VariableRatingCorresponding Crisp Value
Positively Very High5(1)
Positively High4(0.8)
Positively Medium3(0.6)
Positively Low2(0.4)
Positively Very Low1(0.2)
No relationship0(0)
Negatively Very Low−1(−0.2)
Negative Low−2(−0.4)
Negatively Medium−3(−0.6)
Negatively High−4(−0.8)
Negatively Very High−5(−1)
Table 2. Aggregated Rating for Barriers.
Barriers123456789101112131415161718192021222324
100.13750.28750.22500.23750.20000.20000.13750.25000.20000.16250.12500.10000.20000.27500.12500.13750.22500.18750.22500.18750.26250.21250.1875
20.162500.18750.07500.22500.06250.05000.11250.12500.01250.012500.16250.06250.08750.11250.18750.16250.10000.16250.10000.11250.16250.0250
30.17500.150000.11250.15000.10000.33750.21250.28750.10000.18750.30000.20000.25000.0625−0.01250.02500.12500.12500.17500.17500.25000.28750.2875
40.23750.25000.350000.21250.15000.23750.02500.08750.13750.06250.20000.27500.16250.02500.03750.05000.11250.08750.21250.11250.17500.06250.0500
50.16250.33750.20000.175000.03750.21250.11250.10000.16250.17500.18750.20000.18750.11250.12500.18750.22500.22500.21250.11250.17500.20000.2000
60.28750.22500.26250.25000.150000.18750.11250.20000.12500.11250.25000.21250.35000.28750.22500.26250.06250.12500.20000.26250.30000.15000.1125
70.21250.23750.17500.22500.15000.262500.15000.13750.16250.10000.13750.20000.16250.21250.20000.17500.20000.18750.12500.18750.18750.13750.1500
80.10000.15000.13750.23750.20000.22500.100000.22500.08750.16250.21250.23750.21250.16250.15000.21250.20000.13750.07500.16250.18750.13750.1875
90.08750.12500.20000.20000.11250.15000.08750.125000.11250.10000.12500.13750.21250.20000.20000.16250.12500.13750.18750.27500.15000.21250.1500
100.05000.11250.07500.12500.15000.18750.18750.21250.162500.13750.20000.21250.12500.18750.21250.18750.26250.07500.13750.15000.26250.17500.1750
110.18750.17500.20000.10000.11250.13750.22500.08750.20000.175000.06250.12500.25000.20000.13750.21250.12500.20000.17500.16250.17500.18750.2000
120.13750.23750.23750.21250.27500.15000.31250.30000.22500.28750.287500.30000.38750.30000.23750.23750.21250.46250.23750.30000.22500.26250.2500
1300.02500.12500.08750.13750.16250.10000.12500-0.05000.06250.125000.10000.06250.11250.10000.05000.03750.02500.05000.07500.06250.0875
140.13750.18750.06250.13750.11250.23750.22500.17500.13750.12500.17500.20000.300000.23750.21250.18750.11250.18750.15000.18750.18750.25000.1625
150.12500.15000.12500.22500.06250.18750.18750.12500.10000.08750.03750.15000.20000.212500.21250.17500.12500.15000.23750.28750.17500.21250.1500
160.13750.30000.16250.31250.32500.23750.20000.26250.22500.23750.26250.27500.35000.27500.287500.22500.20000.13750.17500.23750.30000.18750.2750
170.08750.08750.16250.02500.12500.20000.22500.15000.11250.21250.18750.17500.18750.21250.31250.237500.22500.26250.16250.23750.26250.25000.1500
180.10000.23750.08750.02500.17500.10000.07500.20000.10000.15000.10000.0250−0.01250.12500.11250.16250.200000.23750.18750.15000.17500.15000.1125
190.15000.21250.17500.16250.13750.18750.21250.22500.22500.25000.12500.13750.16250.20000.26250.23750.22500.237500.21250.27500.27500.21250.2250
200.17500.11250.05000.17500.17500.20000.13750.16250.15000.17500.16250.21250.30000.13750.18750.21250.26250.26250.275000.17500.27500.27500.2625
210.13750.0375−0.08750.11250.13750.26250.18750.12500.16250.15000.18750.12500.08750.08750.08750.05000.02500.07500.16250.087500.08750.17500.1500
220.03750.11250.01250.1500−0.0875−0.0250−0.0375−0.0500−0.0125−0.0250−0.0750−0.0625−0.0500−0.02500.0250−0.01250.0125−0.02500.11250.0500−0.037500.05000.0250
230.07500.16250.10000.08750.08750.15000.08750.08750.07500.21250.21250.22500.22500.27500.25000.23750.27500.22500.16250.18750.20000.212500.2375
240.06250.06250.07500.06250.07500.08750.13750.10000.08750.10000.11250.15000.20000.17500.16250.17500.12500.11250.30000.11250.11250.11250.10000
Table 3. Final FCM Result.
Barriers123456789101112131415161718192021222324
1000000000000000000000000
2000000000000000000000000
30000000.337500000000000000000
4000.3500000000000000000000000
500.33750000000000000000000000
600000000000000.35000000000000
7000000000000000000000000
8000000000000000000000000
9000000000000000000000000
10000000000000000000000000
11000000000000000000000000
120000000.31250000000.387500000.462500000
13000000000000000000000000
14000000000000000000000000
15000000000000000000000000
160000.31250.325000000000.350000000000000
17000000000000000.3125000000000
18000000000000000000000000
19000000000000000000000000
20000000000000000000000000
21000000000000000000000000
22000000000000000000000000
23000000000000000000000000
24000000000000000000000000
Table 4. List of barriers to university technology transfer.
NoBarriersDefinitionSource
1Lack of appropriate partnersUniversity engagements to industry perceived difficulties with industrial network actors due to unwilling industrial organizationsMosey et al. [31]; Belkhodja & Landry [30]; Gilsing et al. [27]; Shen [25]
2Time constraintsTechnology transfer for commercialization causes time pressures for research scholars, academic works (e.g., publications and research papers) and otherMosey et al. [31]; Sa et al. [56]; Shen [25]
3Lack of resourcesLack of financial resources to support the development of these industrial liaison activities, lack of R&D human resources that conduct research worksJones-Evans et al. [37]; Mosey et al. [31]; Belkhodja & Landry [30]; Gilsing et al. [27]; Sa et al. [56]; Shen [25]; De Beer et al. [28]
4Risk of information leakageUndesirable spill-over, to partners and/or competitorsGilsing et al. [27]; Bruneel et al. [32]; Tartari et al. [33]; Shen [25]
5Knowledge being too theoretical for practical purposesThe industry has a lower dependency on academic sources of knowledge because universities specialize in basic research than applied researchBruneel, et al. [32]; Gilsing et al. [27]; Sa et al. [56]; Shen [25]
6Insufficient rewards for university researchersDiscrepancies in the incentive and reward systems for faculty involvement and the commercialization goals for university technology transferJones-Evans et al. [37]; Siegel et al. [29]; Belkhodja & Landry [30]; Shen [25]
7Poor marketing/technical/negotiation skills of Technology Transfer Office (TTO)TTOs recruit more on individuals with expertise in patenting, licensing and technical areas than hiring individuals with marketing skillsSiegel et al. [29]; Shen [25]
8University proponents have unrealistic expectations regarding the value of their technologiesAcademics are sometimes too confident of the value of their product which, in result, may discourage firms in adopting their IP assetsSiegel et al. [29]; Shen [25]
9Lack of recognition for university–industry linkagesProfessors have few connections from the other environments, lack of recognition for university–industry linkages is also a challenge to create suitable partners and contact peopleGalan-Muros & Plewa [57]; Shen [25]
10Inconsistent rules and regulationsRules and regulations imposed by universities, industries, and even government funding agencies also hinders university technology transfer due to its inconsistenciesBruneel et al. [32]; Shen [25]
11Lack of venture capitalUniversities could not get access for funding and guidance due to the lack of access to venture capitalShen [25]; Belkhodja & Landry [30]
12High costs of managing joint research projects in terms of time and moneyTime pressure that the two organizations will experience
Technologies represent a unit character which means that production is costly
Sjodin et al. [58]; Gilsing et al. [27]; Mosey et al. [31]
13Cultural differences between academia and enterprisesUniversities and industries have differences in motivation, timeframe, communication modes and attitudesJones-Evans et al. [37]; Gilsing et al. [27]; Collier et al. [59]; Shen [25]
14Misalignment between research and commercialization objectivesThe objective of enterprises is to gain economic benefits from technology transfer while universities prioritize on disseminating new knowledgeGilsing et al. [27]
15Complex organizational structureThe complex flow of communication due to the imperfection of the transmission of information evident between R&D organizations and the technology userMazurkiewicz & Poteralska [26]
16Institutional bureaucracyKey decision-makers are in control of the decisions to be made in the university regarding the technology transferShen [25]; Mazurkiewicz & Poteralska [26]
17Lack of personal motivationUniversity is unwilling to commit time and resources to technology transfer since it will hinder faculty member and students from their academic workSa et al. [56]; Siegel et al. [29]
18Process complexityThe collaboration and innovation network is a complex system that contains multiple types of network structureLyu, et al. [61]
19Geographic distanceTechnology cannot move freely when participants who must learn together are geographically separated amongst each otherGibson & Smilor [53]; O’Reilly & Cunningham [38]; Min et al. [6]
20Lack of national benchmark to evaluate successful collaborationLack of accurate evaluation to assess the success of technology transfer. Further, for every growing technology transfer programMazurkiewicz & Poteralska [26]
21Prototype technology not compatible with the demands of mass productionDifficult or impossible to change to be suitable for the requesting production/market because technology is too sophisticatedMazurkiewicz & Poteralska [26]
22Problems concerning intellectual property rightsDifficulties-other than delays-in dealing with universities over intellectual propertyCollier et al. [59]; Shujing [65]
23Procurement processTechnologies developed are highly technical which raises problems concerning with the acquisition for its potential producerMazurkiewicz & Poteralska [26]
24Lack of sales distribution centers within university premisesIndustrial partners responsible for commercialization and marketing aspect in the university technology transfer Pennsylvania’ State System of Higher Education [66]
Table 5. FCM Measures Summary.
Barrier NoOutdegreeIndegreeCentralityX
10000.0256
200.33750.33750.0256
30.33750.35000.68750.0213
40.35000.31250.66250.0211
50.33750.32500.66250.0213
60.350000.35000.0211
700.65000.65000.0256
80000.0256
90000.0256
100000.0256
110000.0256
121.162501.16250.0124
1300.35000.35000.0256
1400.73750.73750.0256
1500.31250.31250.0256
160.987500.98750.0141
170.31250.46250.77500.0216
180000.0256
1900.46250.46250.0256
200000.0256
210000.0256
220000.0256
230000.0256
240000.0256
SUM3.83754.30008.13750.5675
Note: Hierarchical Index = 0.0005. Density = 0.0199.

