Article

Accelerating a Technology Commercialization; with a Discussion on the Relation between Technology Transfer Efficiency and Open Innovation

by
Wahyudi Sutopo
1,*,
Rina Wiji Astuti
2 and
Retno Tanding Suryandari
3
1
Research Group of Industrial Engineering and Techno-Economic, Department of Industrial Engineering, Universitas Sebelas Maret, Surakarta 57125, Indonesia
2
Teaching Factory of LFP Battery Universitas Sebelas Maret, Surakarta 57125, Indonesia
3
Department of Management, Universitas Sebelas Maret, Surakarta 57125, Indonesia
*
Author to whom correspondence should be addressed.
J. Open Innov. Technol. Mark. Complex. 2019, 5(4), 95; https://doi.org/10.3390/joitmc5040095
Submission received: 19 September 2019 / Revised: 18 November 2019 / Accepted: 19 November 2019 / Published: 22 November 2019

Abstract

:
Commercialization strategy is an all-encompassing plan that organizes technology transfer office goals to commercialize a university’s technologies. Measurement strategy requires feasible variables that make up those goals. This strategy also ensures that all variables that are important in measuring contribute to the larger goals. A useful way to assess and explain the effectiveness of the technology transfer office (TTO) of universities is to model this within a production function/frontier framework. Such a production function is typically estimated econometrically. This study presents evidence on the relative efficiency of research commercialization in the university through the data envelopment analysis (DEA) model. The implication of the DEA efficiency result is to derive the efficiency level of the TTO’s strategy from the observed performance. It also helps in identifying the benchmarking of other TTOs, which would be valuable information for improving their new technology commercialization strategy. In detail, a benchmark is provided to improve the weakness of strategy and resource allocation of a poorly performing TTO. The proposed matrix of indicators is an exploit of how performance could be measured within the decision-making units that have been chosen. By introducing the measure to commercialization strategy framework the development of technology transfer offices policies are considered.

1. Introduction

The shifting paradigm in university can be spotted from the difference between the goal achievement that should be taken then and now [1]. In the past, universities were aiming to achieve goals compiled in the Three Pillars of Higher Education, which are education and teaching, research and development, and public services. On the other hand, the university’s new paradigm is recently dynamically developing. In addition to obligating the Three Pillars of Higher Education, universities are also obligated to conduct some actions in autonomy status enhancement, economic development, and research output commercialization in order to improve the quality and competitiveness of a university in both national and international scope [2]. Every university has its vision, mission, and financial management in conducting an obligation to commercialize their research output. Universities are aiming to take a more active role in developing domestic economy power by participating in the development of science and technology-based business and industry to accelerate the commercialization of new technologies and promote economic development.
Technology commercialization is a means to exploit technology resulted from research in either production or consumption activity so that the researcher can gain profit from the activity [3,4]. In most cases, many technology products resulting from research happened to fail to be launched to the market due to the valley of death [5]. This obstacle usually occurs in the transition process between technology development and technology commercialization. Hence, critical action is needed to accelerate the technology commercialization in order to ensure the commercialization potency of research output does not fall into the valley of death. A university is expected to take part in this process in order to accelerate the transfer of new technology products to the market [6,7].
As a result of this legislation, almost all research universities in the world established technology transfer offices (TTOs) to manage new technology commercialization [8,9,10,11,12,13,14]. A technology transfer office (TTO) is a kind of organization to assist research organizations in managing their intellectual assets in ways that facilitate their transformation into a benefit for society [15]. The general roles of TTO include establishing relationship with firms and community actors, generating new funding support from sponsored research or consulting opportunities, providing assistance on all areas related to entrepreneurship and intellectual property (IP), facilitating the formation of university-connected companies utilizing university’s technology (start-up) and/or university resource (spin-off) to enhance prospect or further development and generating net royalties for the university’s technology and collaborating partner. Strategies for commercializing university technology are formulated by the technology transfer office (TTO). Strategies that can be done by the TTO in carrying out its role, among others, are to have the physical facilities to support technology commercialization, mentoring and coaching activities, marketing, and business networking, financial support, and internal university regulation itself. The efficiency of strategies that have been executed by the technology transfer office (TTO) in each university needs to be measured. As an attempt, a performance measurement method that can provide university efficiency information is required. The efficiency measurement result can be later used as a reference for other higher education institutions to formulate strategies regarding the commercialization strategy of research output.
Universitas Sebelas Maret (UNS) is one of the universities in Indonesia that has established a technology transfer office (TTO) to manage research products produced by academics from universities. One technology product that has been developed by the university is a lithium LiFePO4 (LFP battery). Some of the research that has been produced include References [16,17,18]. The university’s TTO has a business unit to produce and commercialize LFP batteries. The business unit has not been pioneered recently, therefore the TTO is still making continuous improvements to commercialize the product optimally so that it can compete in the market, and the technology product does not fall into the valley of death. In this study, we developed a framework to measure the efficiency of technology commercialization strategies from TTOs at four universities in Indonesia. The measurement results can be used as a benchmark to develop the best strategy for commercializing LFP batteries as a result of university research.
A measurement strategy is an all-encompassing plan that organizes technology transfer office goals to commercialize university’s technologies and how it will be measured (Figure 1).
Measurement strategy requires feasible variables that make up those goals. This strategy also ensures that all-important variables in measuring contribute to the larger goals. A useful way to assess and explain the effectiveness of a TTO is to model this within a production function/frontier framework. Such a production function is typically estimated econometrically. Production frontiers are also estimated using nonparametric models, which offer some advantages, relative to the parametric approach. For instance, these methods obviate the need to specify a functional form for the production frontier and also enable us to identify “best practice” technology transfer offices. Nonparametric techniques can also handle multiple outputs.
Performance measurement is a structured process through which a technology transfer office identifies, measures, and monitors essential programs, systems, and processes [19]. A commercialization strategy is the strategy revolving around the commercialization function of the technology transfer office and is connected to the overall university strategy. The performance measurement system for the commercialization strategy begins with the university strategy input and the grouping of roles. The roles grouping is based on the goals that exist for a unit within the university. Based on the grouping and the requirements of stakeholders, two types of objectives can be distinguished, namely business objectives and objectives regarding the key performance drivers [20]. Objectives regarding the key performance drivers address how the university objectives are to be met in more detail. These objectives can also address changes in the value creation process or the overall technology transfer office set-up. Once the objectives are defined, the actual definition of performance measures and performance measurement itself can begin [21].
Strategy, in general, is “a pattern in a stream of actions”. A strategy is understood as a statement and realization of pre-defined actions as well as involved consistencies in action [22]. A strategy needs to be deliberately implemented before it becomes a realized strategy. The research focus is the intended strategy and its translation is the realization. The development of performance measurement with its various sub-streams and aspects has grown to be increasingly complex. It will continue to grow in complexity as the scope of performance becomes increasingly diverse [23]. The result of performance measurement should be focused on learning and understanding rather than sole control and depends on an understanding of the own era of the university and its stakeholders [24]. Performance measurement gives recommendations about building blocks for commercialization strategy. They can be split up into recommendations for performance measures and recommendations for performance measurement framework and system design [25]. The development and implementation of measuring the efficiency of strategies for commercializing university technology have provided guidelines for efficiency judgment measurement; they are the commercialized product, technology-based start-up, joint venture, license, and increased employment.
Regarding commercialization strategy, goals for efficiency and the entire commercialization process are derived from the overall strategy and the commercialization function environment. Therefore, the performance measurement of commercialization strategy is defined as the degree of fulfillment of the commercialization strategy set for the technology transfer office in the university while considering the influence of contextual output measurement.
Methods dealing with the efficiency evaluation are generally based upon the estimation of a production frontier. They can be broadly classified into two primary groups as parametric and non-parametric approaches [26]. Parametric frontiers rely on specific functional form and can be either deterministic or stochastic [27]. Data envelopment analysis (DEA) is an example of a performance measurement method which can represent relative efficiency from several decision-making units (DMUs) based on multi-criteria (input and output). Decision-making units (DMUs) are a group of entities that will be analyzed. Due to the comparison principle, a DMU must have the same goal and target as well as universal input and output [28]. This method works by determining an efficient DMU according to input and output criteria, then calculating relative efficiency from a respective DMU towards an efficient DMU.
Several research models have been developed for performance measurement by using data envelopment analysis (DEA) as used by Jyoti, Banwet and Deshmukh [29] to measure relative efficiency from a public research organization. A similar study has been conducted by An-Yuan et al. [30] discussing the approach of production flexibility measurement. A study has been performed about the utilization of DEA in the electronic industry performance measurement in Taiwan [31]. The data envelopment analysis (DEA) method is also used in a study conducted by Joseph, Sandra, and Haiyan [32] related to bank merger efficiency in the national scope. While Chen-Ta et al. [33] conduct performance measurement research using DEA application to measure stock performance, Jelena and Alemka [34] have another study discussing government performance measurement in the Republic of Croatia by using data envelopment analysis.
Meanwhile, Tanase and Morar [35] use DEA to analyze performance in the machinery industry. A study regarding DEA utilization in efficiency and effectiveness measurement of supplier selection was also conducted by Tavassoli, Faramarzi and Saen [36]. Another study is efficiency measurement using time-series by Silva et al. [37]. Research by Jian and Dai [38] use the DEA method to measure the efficiency with output uncertainty. A comparison study was conducted by Sahney [39], which talks about the performance measurement of a university in India while Huang, Nin Ho, and Chen [40] measure the efficiency of marketing strategy in Taiwan. Thore [41] study the use of DEA analysis methods in the process of innovation and commercialization in the scope of industry, universities, and countries. Eilat, Golani and Shtub [42] propose and demonstrate an efficient, effective, and balanced methodology for the development and analysis of R&D projects. Wang and Huang [43] evaluated the relative efficiency of R&D activities in several countries. Sueyoshi and Goto [44] integrate DEA and discriminant analysis to test whether R&D expenditures affect industry financial performance, and years later, they assess the importance of R&D expenditures in the information technology industry in Japan [45]. Liu and Lu [46] introduce a network-based approach, which is a new method to increase discriminants in DEA. Zhong et al. [47] evaluate the relative efficiency of 30 regional R&D investments, and Shirouyehzad et al. [48] employ the DEA method to measure labor efficiency while Chun et al. [49] analyze the productivity of R&D and commercialization activities at the company level.
This paper presents a framework for measuring the efficiency of strategy for commercializing a university’s technology. We linked strategy to commercialize the university’s new technology and strategic conditions facing a university. The framework gives a contribution to how commercialization strategy in a university that is supported by the technology transfer office must be measured. Our analysis has suggested how to choose an efficient strategy for the technology transfer office to commercialize a university’s technology.

2. Literature Review

In Section 1, we have discussed the background of this study and the factors that might affect commercializing research outputs in university. In Section 2, we give a literature review. In Section 3, we discuss an approach to develop, and then in Section 4 results and in Section 5 discussion. In the final section, we describe the Conclusions and Implications.

2.1. University Paradigm

Three aspects indicate the changing paradigm of the university. The first aspect is the evolution of the university itself, then a comparison between the current and past higher education roles, and the last indication is the definition of innovation and research. The evolution of higher education can be divided into five categories, which are Middle Ages European and Chinese Imperial Era, where classically university can be seen either elitist, royal, aristocrats, or bureaucrats [50]. In the 1890s, university took a role as a studying place for the public, then shifted in the 1930s, and eventually, after World War II became a research center [1]. In the 1990s–2000s universities added entrepreneurial value inside, and nowadays, higher education in Korea, India, and China call themselves agents of change [2].
The new university paradigm is seen from three roles of a university, which are education—teaching and learning activity which produce educated human resources, research, and public service-transfer of science and technology from university to community interest [51]. Meanwhile, the future paradigm in a university that is dynamically shifting possesses not only the Three Pillars of University but also autonomy status, economic development, and commercialization of research output in a university. By fulfilling those aspects, universities are expected to increase cooperation with industry, technology transfer as a university revenue source, and development of entrepreneurs, which is purposing to the downstream research output of the university.

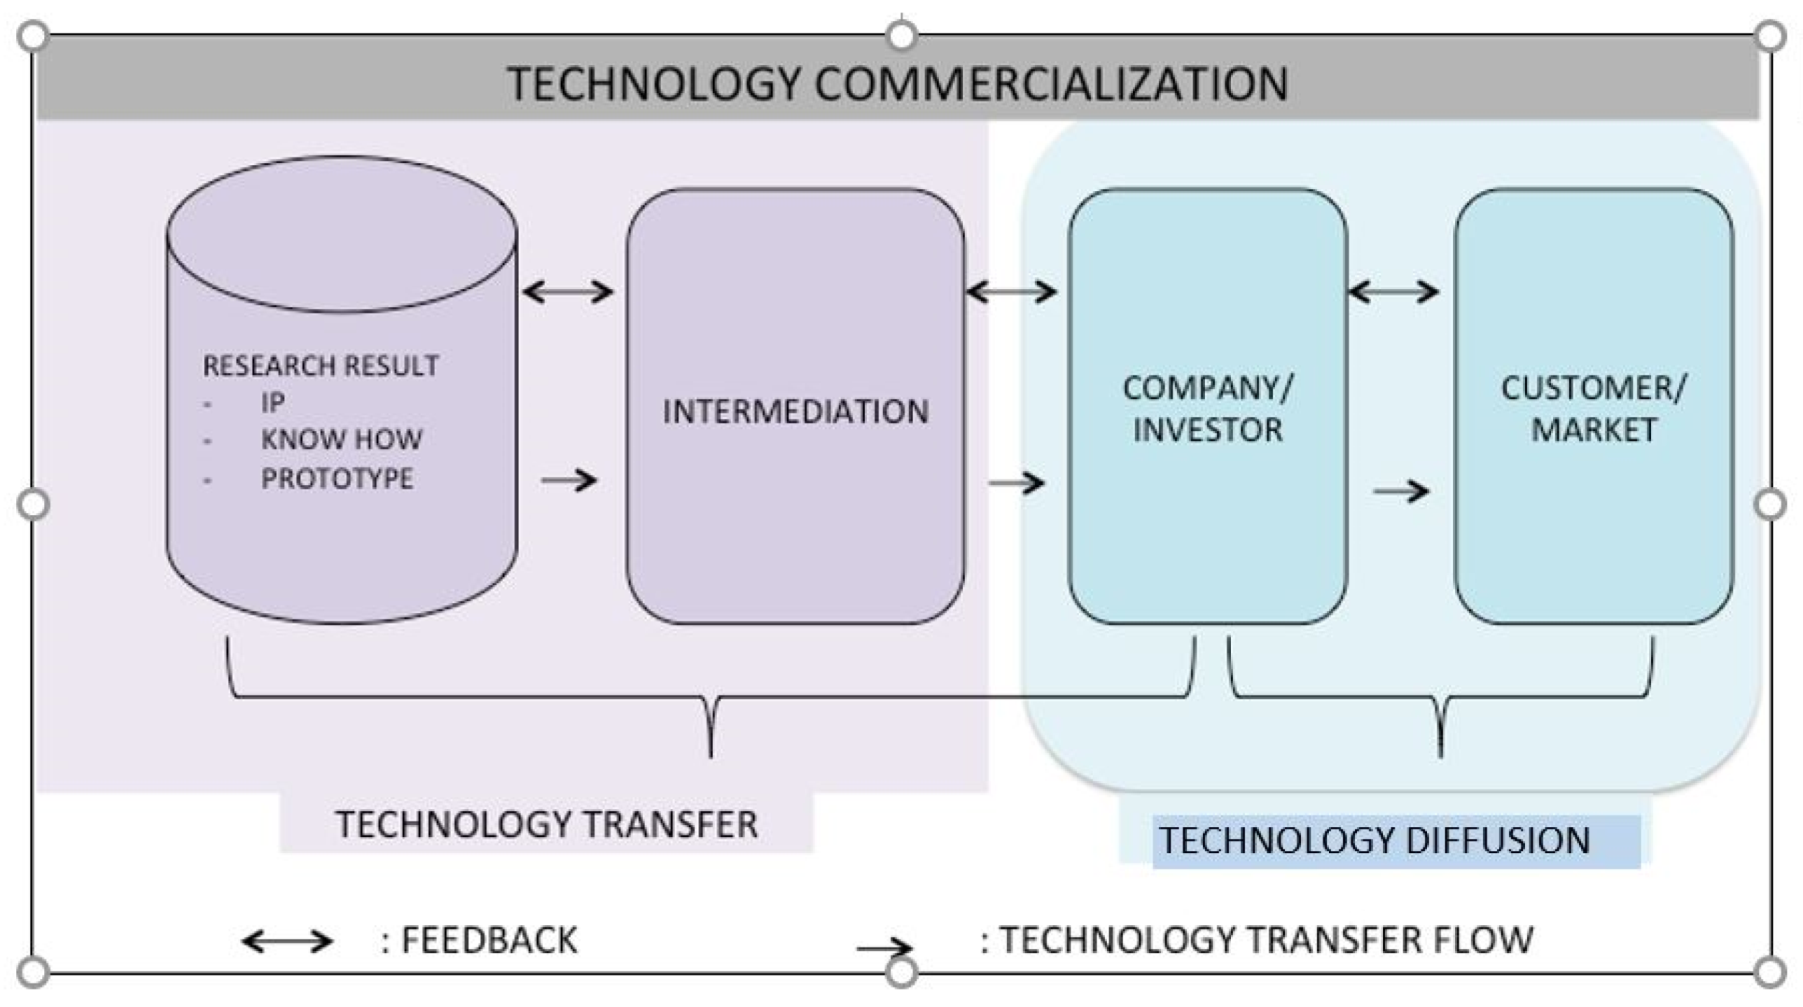
2.2. Technology Commercialization

Nlemvo [52] stated that commercialization consists of design, development, manufacturing, startup marketing phase, and everything regarding product development. While Siegel and Marconi [53] argued that commercialization is an activity to transform and set technology to the beneficial or profitable point. Shane and Stuart [54] also define that commercialization involves identification of consumer need, product concept design, product design, and prototyping process until the manufacturing process in the end. Parker and Mainelli [55] mention two points where the technology may generate profit. The first commercialization encounter is when technology invented from scientific research succeeds in creating a license. The second phase happens when technology is transformed or applied in a particular product through product development activity in a company so that it can be used in advanced production or consumption activity.

2.3. How Does Research Output Commercialization Become So Urgent?

Commercialization of technology or research output can be described as an activity to bring new technology from the inventor’s institution to market (in product or service form). New technology commercialization is defined as “change the idea to money”. The transfer of new technology to market can be executed by the institution/company itself or other party or the inventor’s institution cooperating with another party. Money earned from technology commercialization is intended to ensure the sustainability of the product and service production, which exploit the technology. In other words, the utilization of a particular technology that is not beneficial will not be able to produce a sustainable product and service. As a result, various subsidy programs provided for a particular program or activity will not be sustainable.
However, new technology commercialization aims are much broader than to generate money or profit; instead, it leverages industry competitiveness, which ends in an increase in public wealth. This new technology commercialization brings positive impact through the creation of several aspects such as job opportunity, economic development, global and national competitiveness enhancement, increasing of company revenue and profit, tax for the country, and development funds for public wealth.
Commercialization of research output is a form of technology transfer from universities to markets. Technology transfer has become a pillar of open innovation with the acceleration in the economic and the digital industrial era as a result of the current industry 4.0. There have been several studies regarding open innovation in the current fourth industrial revolution. Yun et al. [56] propose a sustainable open innovation strategy and an approach to sustainable serial entrepreneurship. Besides, Yun et al. [57] examine the relationship between collective intelligence crowd innovation and open innovation. Yun and Liu [58] identify micro- and macro-dynamics of open innovation in addition to the dynamic roles of industry, government, university, and society. Yun et al. [59] analyze the difference between the role of a business model in the converted industry and the emerging industry. Yun, Won and Park [60] address entrepreneurial cyclical dynamics of open innovation. Yun et al. [61] study the effect of open innovation of technology value and technology transfer in the automotive, robotics, and aviation industries.

2.4. Technology Transfer Office (TTO) Role in Commercialization

Understanding of technology commercialization route can be beneficial for an organization with the primary function of commercializing new technology, also known as a technology transfer office (TTO). For instance, that scheme can be a planned financial power source and human resource in the future strategy. The intellectual properties (IP) commercialization process of R&D institutions, as illustrated in Figure 2, shows the presence of an institutionalized commercialization process or activity scheme. Through these TTOs, IP can be given a commercialization facility by receiving complete help from the institution. This commercialization process also necessitates researchers to reveal their potential research output so that its IP will be protected and will leverage the institution’s IP portfolio. The portfolio will be evaluated afterward by a team in a technology transfer or commercialization office in order to program the commercialization plan and required budget or investment allocation. The commercialization route indicates that the establishment of a new commercialized technology-based startup can be one of the commercialization targets itself besides the number of licenses.
There is a need for intermediation between a technology owner and user or other parties that tend to produce a product and service from the technology, as seen in Figure 2. The role of a TTO in the technology transfer process is very determining. The TTO must audit the new technology as an attempt to spot the commercial prospect. Whenever a technology requires proof of concept activity so that the product can be accepted in the market, the TTO provides accompaniment and mentoring suited to the TTO and experts specializing in the scope of its network.

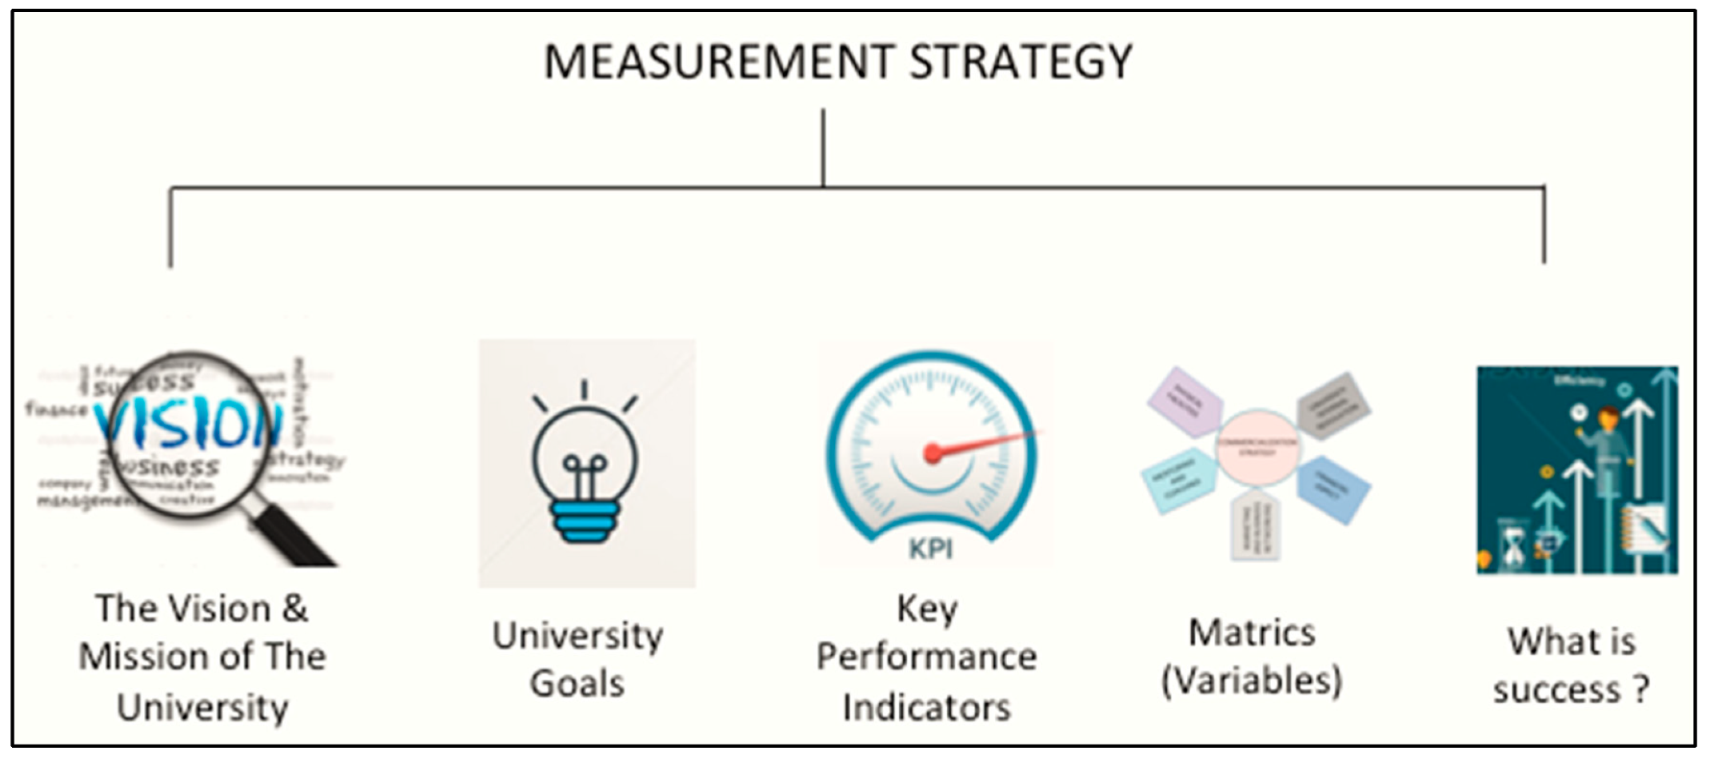
2.5. Performance Measurement

Performance measurement is a quantifying process of efficiency and effectiveness of a particular action [62]. Effectiveness represents how much the targeted goals have been achieved. Meanwhile, efficiency refers to the speed of doing a task or how a budget can adequately cover the task. Poister [63] defines performance measurement as a process to define, monitor, and use an objective indicator of organization performance. Following the definition, the performance measurement process involves activity in determining, defining, and using indicators to monitor an organization’s performance. Monitoring is used to figure out how effective and efficient an organization is in achieving its goals.
Performance measurement is a medium to improve organization performance. An organization applying a performance measurement is likely to possess better performance rather than an organization which is not [64]. Due to performance measurement, organizations can monitor improvement and motivate themselves to obtain their goals. According to Moxham [65], performance measurement is seen as a tool to get improvement in the public service sector and an essential factor in the reformation of that sector.

2.6. Data Envelopment Analysis (DEA)

Data envelopment analysis (DEA) is a method of linear-based programming to evaluate the efficiency of organization unit performance, also known as decision-making units (DMUs) [66]. A DMU can be a group of firms, departments, divisions, or administrative units with a common goal and target as well as the input and output [28]. DEA aims to measures how efficient a DMU is using its resources in producing several outputs [67].
Data envelopment analysis (DEA) has two basic models, which are the Charnes, Cooper, and Rhodes (CCR) model and Banker, Charnes, and Cooper (BCC) model. By its name, the CCR model is developed by Charnes, Cooper, and Rhodes [67], while the BCC model is constructed by Banker, Charnes, and Cooper [68]. The two models differ in assumption. The CCR model assumes that increasing the input value will impact the output value proportionally, in other words: constant return to scale. Therefore, the output and input ratio will always be constant. Unlike the CCR model, the BCC model assumes that the increase of input value will impact in increasing an output value disproportionately or variably. Hence, increasing the input of “x” times does not always mean increasing output by the same amount but may be larger or smaller. This assumption called variable return to scale (VRS). Both the DEA model can be used for either input or output orientation.
Table 1 presents 20 studies that use the DEA method to measure relative efficiency. The study collation was carried out by author-based mapping. The object of the studies include manufacturing systems, manufacturing industries, government organizations, national (state), financial services systems, and universities. Then the mapping was based on the type of DMU used in the study, the DEA model and orientation used in the study, the number of inputs and outputs studied, and the type of data scale used in the study. Based on those studies, no research measured the efficiency of technology transfer service offices, and no research used ordinal data measurement scales in the form of a Likert scale. The Likert scale used in this study aimed to determine the perception of the efficiency of technology commercialization strategies in universities.

3. Approach to Develop Framework

Performance evaluation is a necessary part of management control. Not only can it be used as a reference in decision making but it also the basis of any improvement. Hence, how to measure performance becomes essential. Stakeholders and other researchers have tried to accurately measure the performance at the individual, organizational, and national levels for many decades. This paper illustrates how to use a data envelopment analysis (DEA) to give relative efficiency value for every commercialization strategy that was used by the university. These issues are discussed in this paper:
  • What is the framework of the university efficiency strategy measurement in new technology commercialization?
  • What is the relative strategic efficiency of new technology commercialization performance, and which technology transfer office has an improvement in strategic performance?
The criteria for measuring the university strategy efficiency in new technology commercialization have to be defined first to answer the questions mentioned earlier. Based on the literatures, indicators used include physical facilities and shared business service and equipment, monitoring and networking, funding and support, marketing assistance, professional business service, and business etiquette, management, and human resource assistance, and university regulation.

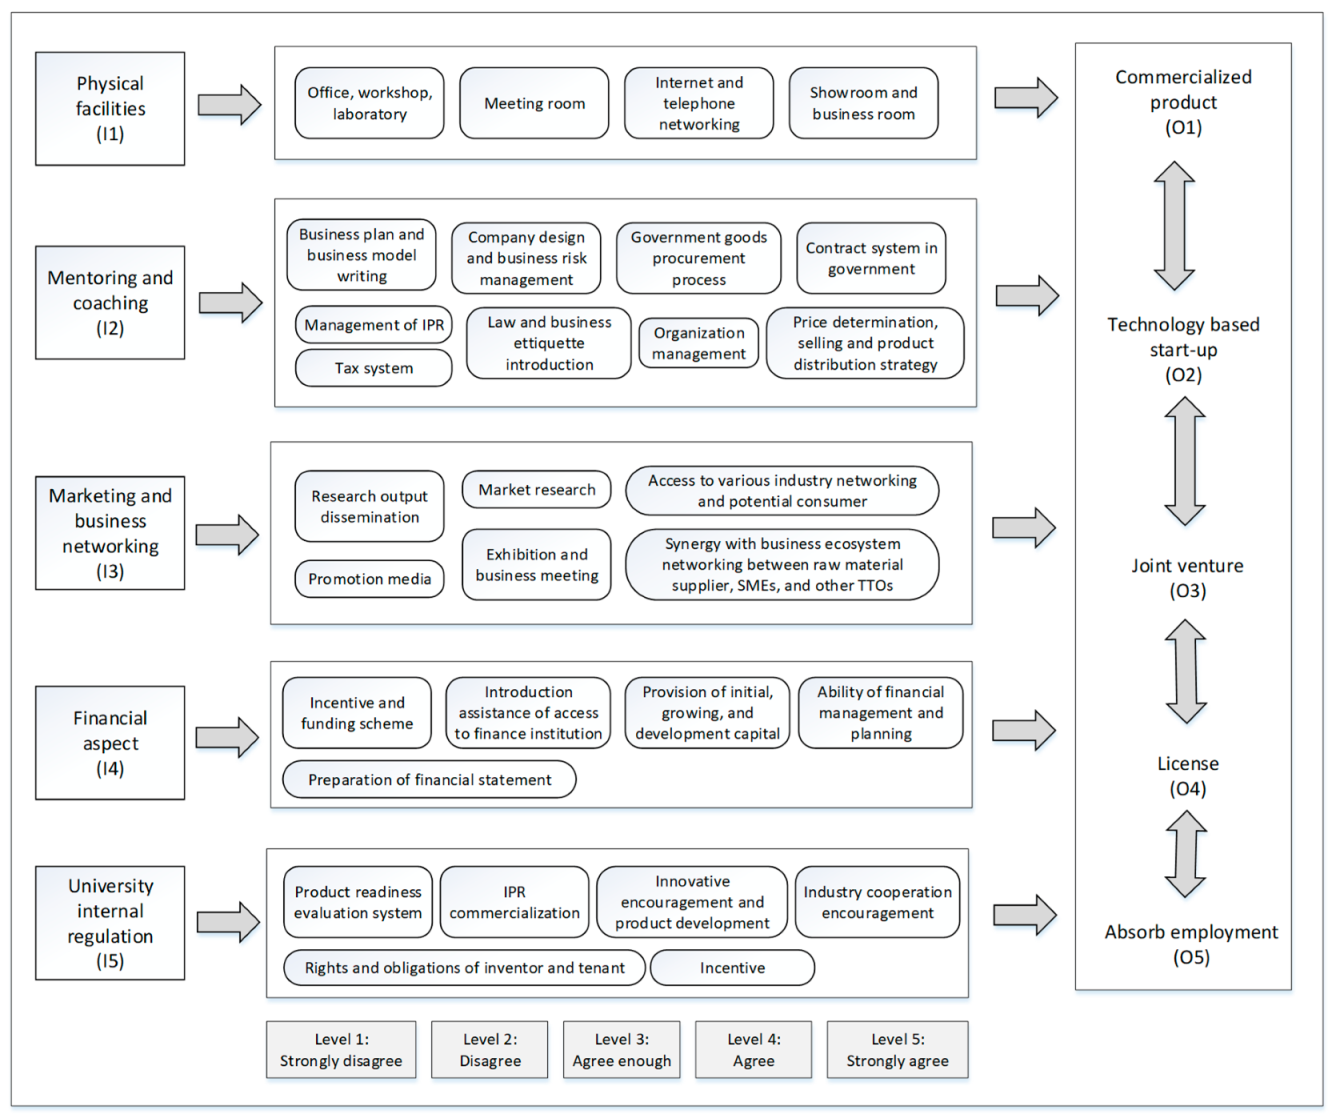
3.1. Defining the Structural Framework

Both previous findings as well as insights from the commercialization strategic efficiency variables, dimension, objectives, and target (output) are to be derived from strategy. Strategy measurement can be described as the degree to which a strategy has been fulfilled. Therefore, strategy measurement dimensions for commercialization strategy need to be derived from university strategy. The university strategy for commercialization strategy contains five main dimensions for input strategy and five main dimensions for output.
We developed the model using a questionnaire as a measurement instrument. The use of a Likert scale in the questionnaire could be applied using the DEA method in terms of the ability of DEA to calculate the value of relative efficiency. This questionnaire aimed to determine the relative efficiency value of a commercialization strategy of the results of the research carried out in each DMU and to test the correlation between variables used in this study. The preparation of the questionnaire in this study began with the operationalization of input variables, namely by identifying the strategies that influence the success of technology commercialization according to literature studies. Then, we proceeded with determining the indicators of each variable and translating the indicators into statement forms that were easy to understand respondent. It was vital to check statements form, language, and relevance, the order of statements, and the appearance of the questionnaire. Finally, we conducted a pre-test and made a final draft questionnaire.
The statements in the questionnaire were based on the variables used in the study. Then the indicators that affected each variable were identified. Indicators are measures, which are things that represent the value of a variable. The indicators in this study were collected based on literature studies and field studies that were conducted to see the similarity of the required inputs and outputs produced by all DMUs, then compiled into statements that were asked to respondents. The identification of variables and indicators for each strategy can be seen in Table 2 for the input strategy and Table 3 for the output strategy, and the overall system picture is explained in Figure 3.
Our research model is shown in Figure 3. Inputs included physical facilities, mentoring and coaching, marketing and business networking, financial aspect, and a university’s internal regulation. All these five inputs are vital components of technology commercialization activities. Although there are many possible indicators which can measure the technology commercialization, this study used license income as our primary indicator for evaluating technology commercialization according to the suggestion of Trune and Goslin [83], Jensen and Thursby [84], and Thursby and Thursby [85].
Commercialization activity of university research output has return to scale, which is variable. It means that additional input in commercialization activity will impact in additional output disproportionately. For instance, if mentoring and coaching strategy is managed to become more routine, it does not mean more output will be gained. Therefore, the input and output variable in this research remained unclear or could be seen as a black-box circumstance. Due to this condition, the DEA model chosen in this study was the BCC model, which uses a variable return to scale assumption.
Meanwhile, the DEA model orientation was chosen by considering DMU control ability toward the input and output variable of research output commercialization activity. In the commercialization activity, DMU possesses a larger control of input than output. Hence, this paper used input orientation (input minimization) where efficiency was seen as the subtraction of input number to create the same amount of output.

3.2. Questionnaire Testing

A valid and reliable questionnaire is a necessary condition to obtain valid and reliable results. In this study, we conducted a reliability test and validity test to check the validity and reliability of the questionnaire. We tested the questionnaire with 30 respondents from which the population was the same class as the actual population by using a purposive sampling method.
Questionnaires are considered valid if they can present or measure what they want to measure (research variables). To measure the validity test the SPSS statistical application was used. A question item was considered valid if it had a critical R-value ≥ 0.3 and was considered invalid if the critical R < 0.3. All questions on this questionnaire had a critical R-value > 0.3. Thus, the questionnaire was declared valid.
Reliability involves the problem of the accuracy of the measuring instrument. An instrument is considered reliable if the instrument can be trusted as a measurement of research data. This reliability test also used SPSS software, where all question items were considered reliable if the value of the test results was ≥0.6 and considered unreliable if the value was <0.6. The reliability value on each questionnaire variable was >0.6, so the questionnaire was reliable.

3.3. Decision-Making Unit Selection

In this research, we chose four universities in Indonesia as a case study, which have established TTOs for at least three years where the university has the flexibility of financial management and broader use of assets in commercializing research results. This is supported by findings from the 2016 Ministry of Technology Research and Higher Education report [86] that those universities have been declared capable of commercializing research results.
The DMU was the unit whose efficiency would be measured. With due regard to homogeneity requirements, it was determined that the DMU in this study was the work units of the legal entity university, which was responsible for carrying out the commercialization of research results, from now on, referred to as the technology transfer service office. The said legal entity university, which was at least three years, had the status of a legal entity so that it was expected to have identified the outcome of the commercialization process that had been carried out.
Each university did not necessarily only have one TTO unit. Based on field studies and literature studies, a list of total 25 technology transfer service offices have been obtained at some universities, from now on, referred to as the decision-making unit (DMU). Table 4 shows the list of technology transfer service offices in each university, which were coded as U1, U2, U3, and U4.
Input and output variable data were collected from 2012 to 2016. The selection of this period was based on the concept of incubation, which starts from the results of research that has a value of technology readiness level (TKT) ≥ 7 to being commercially ready and takes 2–3 years to start scaling up research [87].
Input and output variable data were collected from questionnaires that had been designed for the managers of each technology transfer service office. The number of DMUs fulfilled the requirements of the number of DMUs submitted by Darrat et al. [88] and Avkiran [89], where the number of DMUs is at least equal to the multiplication of the number of inputs and outputs. In this study, using five inputs and five outputs so that the multiplication obtained gets a value of 25 DMUs. Table 5 presents the list of DMU codes of each technology transfer service office in each university in the respective period.

3.4. DEA Model Selection

The DEA model selected in this study was a model of BCC, in which this model holds the assumption of variable returns to scale. The DEA model selected orientation concerning the control capabilities of DMU input and output variables of the commercialization of research activities. In this activity, the commercialization of research results, DMU has control over a more massive output. Therefore, this study used the output orientation (maximize input) where efficiency was seen as increasing the number of outputs while the user input number remained the same.
The BCC model also can be used to either maximize output or minimize input. The primal equation of the DEA BCC model to maximize output is shown by Formula (1).
Max   Z   =   j = 1 i v j m   y j m   +   v m
subject to:
i = 1 I u i m   x i m = 1 j = 1 J v j m   y j n i = 1 I u i m   x i n +   v m 0 v j m ,   u i m     ε ,   v m   ( i n d e p e n d e n t )   i n f i n i t e .
Meanwhile, the primal DEA BCC model to minimize input is:
Min   Z   =   i = 1 I u i m   x i m   +   u m
subject to:
j = 1 J v j m   y j m = 1 i = 1 I u i m   x i n j = 1 J v j m   y j n +   u m 0 v j m ,   u i m     ε ,   u m   ( i n d e p e n d e n t )   i n f i n i t e .
The equation in dual form from the primal model to maximize output is shown by Formula (3).
Min   θ m
subject to:
n = 1 N λ n   y j n y j m n = 1 N λ n   x i n   θ m x i m n = 1 N λ n   = 1 λ n 0 θ m   ( i n d e p e n d e n t )   i n f i n i t e .
Meanwhile, the dual equation from the primal model to minimize input is shown in Formula (4).
Max   ϕ m
subject to:
n = 1 N μ n   y j n ϕ m y j m n = 1 N μ n   x i n   x i m n = 1 N μ n   = 1 μ n   0 ϕ m   ( i n d e p e n d e n t )   i n f i n i t e .
where n: DMU, n = 1, 2, …, N
i: Input, i = 1, 2, …, I
j: Output, j = 1, 2, …, J
y j n : output value of j from DMU of n
x i n : output value of i from DMU of n
v j m : input weight j from DMU of n
y j n : input weight i from DMU of n
ε : small positive number.
In a linear program, each equation (called primal) has a linear equation in binary form. Formulae (1,2) are examples of the primal equation. The number of constraint equations (subject to) in the primal equation depends on the DMU number. However, in the dual equation, the constraint equation (subject to) number depends on the variable number [49]. In the dual equation, variable θ is a constraint equation (equality constraint), which is a result of normalization of the total weight from the input, while variable λ is a dual variable, which is an inequality constraint from the primal. The dual equation from the primal to maximize output is shown in Formula (3).

3.5. DEA with Likert Scale Data

The DEA basic model assumes that all input and output variables can be moved/changed freely. In the case of performance evaluation of new product launching as discussed here, all the input and output variables contained the survey data that used a scale of 1–5. This brought the consequence that the recommendation value of improvements both for input and output variables cannot exceed the range of values 1–5. If we wanted to evaluate the performance/efficiency data-limited scale of the questionnaire, the standard model of DEA above should have been transformed into an exclusive model with some differences in character compared to the general model. The mathematical expressions include the additional constraints of Formulae (2,4), which limits the scale value that may be acquired by a DMU. Hence, it will limit the movement of input and output as mathematical processing will be restricted from the smallest value of a certain number with the highest possible value.
The data used in this study was obtained through a questionnaire. Respondents were asked to assess the research results in the commercialization strategy where respondents worked. The maximum scale value of the questionnaire, which was five, was treated as the upper limit, and the minimum one, which was one, was be treated as a lower limit for the input variable (xij) and output variables (yrj) of each DMU. The DMU in this research was the units from the university who were responsible for implementing the commercialization of research results, from now on referred to as the technology transfer offices (TTO) at universities.

4. Results

4.1. Commercialization Strategy Measurement

After a framework was prepared, then an identification of the business process or workflow of the commercialization process in the university was carried out. Starting from the results of research that had the potential to be commercialized, then the technology transfer service office had a role in carrying out incubation to successfully commercialize research products.
Figure 4 illustrates the efficiency measurement framework of the strategy commercialization technology in higher education through the process after the characterization of the process of technology commercialization at each university was carried out by the unit transfer service technology. The advanced technology transfer office is a unit of the university which is responsible for the technology commercialization process at each college. The research results of universities are selected by the unit’s technology transfer office services to proceed to the stage of commercialization (Technology Readiness Level (TRL) and Demand Readiness Level (DRL) ≥ 10). Each office of technology transfer services has specific strategies to target output of which are the product that is sold in the market, the establishment of technology-based startup companies, joint ventures, licensing, and employment. Those dimensions were considered to be the input and output of the unit service technology transfer. Then, we calculated the relative efficiency of each technology transfer service unit to be able to determine an efficient strategy. An efficient TTO was the one which relative efficiency value was equal to one. The relative efficiency was calculated using a mathematical model based on the DEA variable returns to scale (VRS) output-oriented to properly evaluate the efficiency of the production scales of the unit’s best technology transfer services. The VRS primal was used to determine which technology transfer services unit was efficient (=1) and inefficient (<1) and to investigate the value of variable weights whereas the dual VRS was used to find the value scale efficiency (SE). SE grades indicated whether the technology transfer services unit operates optimally or not. It operated in optimal condition if the value of the VRS > SE and did not operate in optimal condition when the value of the VRS < SE.

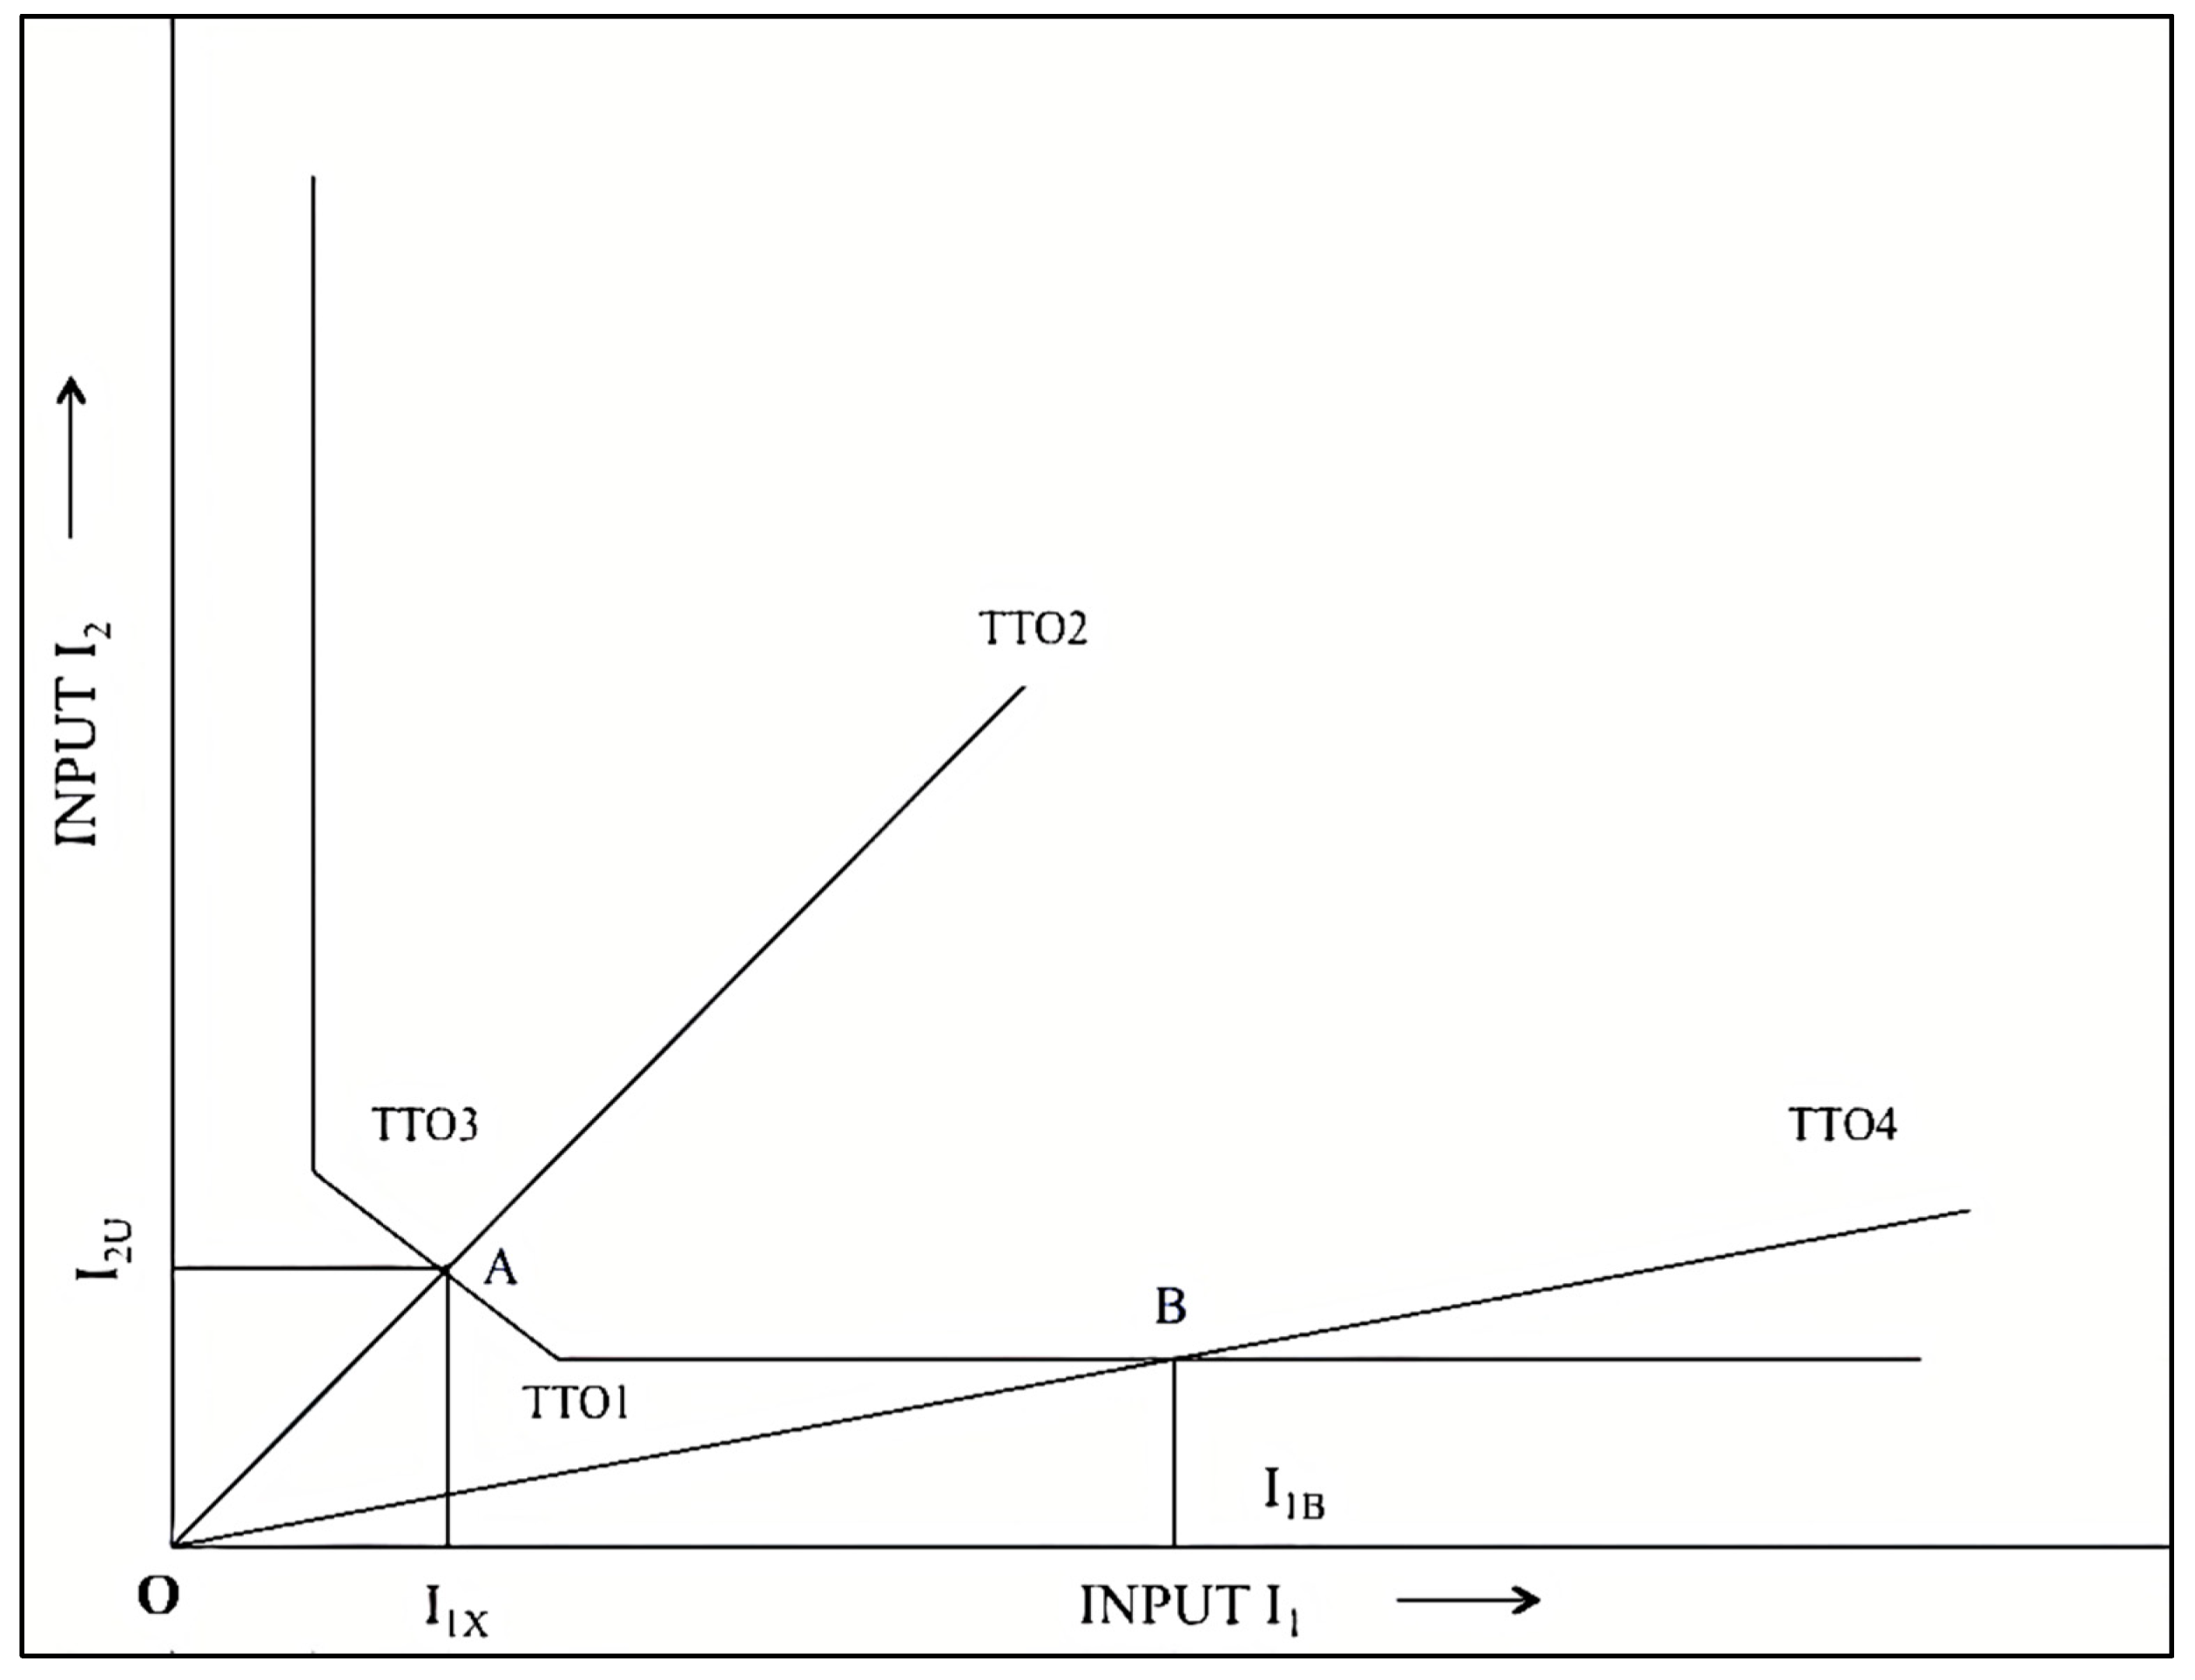
4.2. Relative Efficiency Value

We processed the collected data using Max DEA in order to figure out the value of relative efficiency for each respective DMU. Before the data was processed by Max DEA software, data recapitulation was created first to arrange them with the format required by Max DEA. Table 6 presents the recapitulation result by finding the average value of every indicator data from the questionnaire.
The mathematical model below is an example of a mathematic model of BCC with input orientation (BCC-O) for DMU1. The model was constructed by using Formula (3) and data from Table 6.
Max   θ m
subject to:
5λ1 + 4.75λ2 + 5λ3 + 4.75λ4 + 4λ5 ≥ 5
4.89λ1 + 4.33λ2 + 4.56λ3 + 3.33λ4 + 3.11λ5 ≥ 4.89
4.67λ1 + 4.17λ2 + 4.17λ3 + 4.17λ4 + 3.5λ5 ≥ 4.67
4.6λ1 + 4.4λ2 + 4.2λ3 + 4.2λ4 + 3.6λ5 ≥ 4.6
3.83λ1 + 3.67λ2 + 4.83λ3 + 4.33λ4 + 4.67λ5 ≥ 3.83
5λ1 + 4λ2 + 4λ3 + 3λ4 + 3λ5 ≤ 5θ1
5λ1 + 4λ2 + 4λ3 + 4λ4 + 4λ5 ≤ 5θ2
3λ1 + 4λ2 + 4λ3 + 4λ4 + 3λ5 ≤ 3θ3
4λ1 + 3λ2 + 5λ3 + 4λ4 + 4λ5 ≤ 4θ4
4λ1 + 4λ2 + 4λ3 + 4λ4 + 5λ5 ≤ 4θ5
λ1 + λ2 + λ3 + λ4 + λ5 = 1
λ1, λ2, λ3, λ4, λ5 ≥ 0
θm (independent) infinite.
Then, the model was solved with help from Max DEA to discover the DMU relative efficiency value. The other DMU relative efficiency values were calculated using a similar formula. Table 7 presents the results of DMU relative efficiency calculation in commercializing university research products. The score column represents DMU relative efficiency value, and the rank column shows DMU rank based on relative efficiency value. Meanwhile, the reference set (lambda) column provides information about efficient DMUs, which could be used as a benchmark reference for inefficient DMU along with the intensity.
Data processing using Max DEA produced efficiency values that indicated the relative efficiency values of DMU. This value is relative, so if there was a change in a DMU, the efficiency score may have changed. Efficiency scores range from 0 to 1 (0 to 100%). DMU with an efficiency score equal to 1 was classified into an efficient DMU. This meant that there was no other DMU that could use input with a smaller amount than the DMU based on the same amount of output. An efficient DMU was a DMU that could optimize the strategies used in achieving technology commercialization output by predetermined targets.
The performance of DMUs was assessed in DEA using the concept of efficiency or productivity, which was the ratio of virtual outputs to virtual inputs. Therefore, all outcomes generated from the strategy, which were the profits from the results of DMU operations, were expressed as virtual outputs. In contrast, all resources used by DMU or conditions that affected DMU performance were expressed as virtual inputs. If the ratio value between virtual output and virtual input = 1, the DMU was declared efficient. Conversely, if the ratio value was less than 1, the DMU was declared inefficient.
Based on Table 7, we determined which DMUs were classified as efficient and inefficient. There were 20 DMUs that were classified as efficient, namely TTO1, TTO2, TTO3, TTO6, TTO7, TTO8, TTO10, TTO11, TTO12, TTO13, TTO15, TTO16, TTO17, TTO18, TTO20, TTO21, TTO22, TTO23, TTO24, and TTO25, whereas five DMUs, namely TTO4, TTO5, TTO9, TTO14, and TTO19, had efficiency values less than one, so they were classified as inefficient DMUs.

5. Discussion

5.1. Strategy Analysis for Improving Research Commercialization in University

We considered five technology transfer offices TTO1, TTO2, TTO3, TTO4, TTO5 that produce the same level of a single output O, from two inputs I1 and I2, shown in Figure 5. TTO1 and TTO3 were efficient. They represented the best practice. This implied that no other firm nor linear combination of technology transfer offices could be identified, which produced the same level of output for less than either or both the inputs. Figure 5 represents the efficiency frontier of five TTOs consuming two inputs. TTO1 held an efficient practice for input I1, whereas TTO3 held the efficient practice input I2. The straight-line representing TTO2 represents the best achievable target performance (corresponding to point A), which was actually a linear combination of the best practice TTO1 and TTO3. TTO4 was an inefficient DMU. The value of input I1 on TTO4 was higher than the value of input I2. Thus, TTO4 referred to TTO1, which was the best practice in input I1. This is illustrated through a straight line that intersects TTO1 at point B. Therefore, to achieve an increase in commercialized output, TTO4 must be able to increase the input values of I1 and I2 by point B.
The correlation test between variables for 20 efficient DMUs was conducted to see the value of the correlation between input variables and output variables, which would later be used to help determine the strategy formulation. Correlation test was done using SPSS software and using the Kendall Tau correlation test. Table 8 shows the correlation values between variables for 20 efficient DMUs from the Max DEA processing results. It could be derived from the table that all input variables to the output variable had a positive correlation. These results could later be used to design a commercialization strategy based on the output the technology transfer service office at the university focuses on achieving.
For universities, this model could be used as a model to measure the efficiency of a strategy that has been carried out then determine the alternative improvement that must be chosen among the five input strategies that exist to achieve the target five outputs that have been determined. This model is also able to provide recommendations for technology transfer service offices in strengthening the strategies that must be taken.
Based on Table 8, we could underline which input variables needed to be improved by the university to increase output, for example, if the university wants to focus on improving commercial products what needs to be done is to increase marketing assistance strategies and expand business networks including increasing research dissemination, conducting market research on products to be commercialized, adding to promotional media, holding business meetings and exhibitions, expanding access to various industrial networks and potential consumers, and strengthening synergies with the business ecosystem network. In addition to improving marketing strategies and business networks, it is also necessary to prepare internal college regulations, including regulations on product readiness evaluation systems, commercialization of intellectual property rights, policies, and rules regarding the encouragement of innovation and product development, policies, and or incentive rules. The strategy to increase physical facilities also needs to be improved, including the availability of office space, workshops, meeting rooms, telephone and internet networks as well as available business and showroom spaces.
Whereas if it is more focused on increasing joint ventures, it is necessary to improve the university’s internal regulatory strategy, mentoring and coaching including the preparation of business plans and business models, coaching on management of company design and business risk, contracting systems in government, management of intellectual property rights, introduction to law and business ethics, organizational management, tax systems and mentoring regarding pricing strategies, sales systems and product distribution, and improvement of physical facilities. Likewise, if they want to increase licenses, it is necessary to improve the physical facilities strategy, mentoring and coaching as well as marketing and business networking assistance. In order to increase employment, it is necessary to improve mentoring and coaching strategies, marketing assistance, and business networks as well as formulating internal regulations of the university.
This model is also able to be used for evaluating strategy feedback for the development of technology-based startup companies, including how to improve the university’s internal regulatory strategy which significantly affects the success of technology-based startups in the future, namely the need for support from universities in the formulation of policies on the commercialization of intellectual property rights. In full, the drive for innovation and intensive product development as well as the encouragement of industrial cooperation, then it also needs policy regarding the rules of incentives, as well as an evaluation system for product readiness to be commercialized. Mentoring and coaching strategies also need to be improved in the development of technology-based startup companies, including mentoring and coaching activities in the preparation of business plans and business models, management of company design and business risk, procurement processes, the introduction of legal and business ethics, and tax systems. The state of physical facilities is also very influential in the development of technology-based startup companies, at least available office space, workshops, laboratories, meeting rooms, telephone, and internet networks, as well as available business space and showrooms of research results to be commercialized.

5.2. The Relation between Technology Transfer Efficiency and Open Innovation

The relationship between technology transfer efficiency and open innovation can be illustrated through the open innovation paradigm in Figure 6. Many new technologies resulted from university research. However, not all of these technology products can develop in the market. Therefore, technology insourcing is needed to accelerate the commercialization of technology, both through internal and external technology bases. In this case, the university plays a role as a technology spinoff, in which there is a TTO in charge of carrying out technology incubation. An efficient DMU will increase the probability of the success of a technology product. Therefore, in our model, we used the DEA model to find efficient DMUs in transferring technology to synthesize effective strategies. Thus, we could generate a variety of decisions that could be used for technological interventions in terms of physical facilities, mentoring and coaching, marketing and business networking, financial aspects, and university’s internal regulation. The more efficient DMUs, the more best practices we could implement in commercializing new technologies.

6. Conclusions and Implications

This paper constructed a framework of university efficiency strategy measurement in new technology commercialization. This framework employed DEA analysis to assess and examine the efficiency of a direct and precise method for relative strategical efficiency of new technology commercialization performance. The efficiency evaluation technique employed in this paper could provide another insight to analyze the performance of new technology commercialization in universities.
The implication of the DEA efficiency result was to drive the efficiency level of the university’s strategy from the observed performance. It also helped to identify the benchmarking of other universities, which would be valuable information for improving their new technology commercialization strategy performance. In detail, a benchmark was provided to improve their weakness of strategy and resource allocation of poorly performing universities.
As TTOs can evaluate the commercialization strategy, TTOs can accelerate commercialization by using policy choices that have high-efficiency frontier value. In line with down streaming and commercialization of new technologies, the role of TTOs in the commercialization of new technologies is deemed necessary to be developed at the university. ATTO is expected to be the main actor for the bridging system of technology commercialization to ensure that the potential product does not fall into the valley of death-scourge in the technology commercialization process.
This model could be used as a benchmark by UNS to develop a strategy for commercializing LFP battery products. To accelerate LFP battery commercialization, UNS needs to determine its strategic focus in which output needs to be improved. Thus, the university can determine which input performance should be improved. Thus, the university can formulate strategies to improve the commercialization of LFP batteries. The three main priorities to focus on improving commercial products that need to be done are improving marketing assistance strategies and expanding business networks, internal university regulations, and improving physical facilities whereas the three priorities for improving technology-based startup companies can be making improvements to the internal university strategy, mentoring and coaching as well as physical facilities. Meanwhile, to focus on increasing the joint venture it is necessary to improve the internal regulation strategy of universities, mentoring and coaching as well as improving physical facilities, likewise, if the university wants to increase licenses it is necessary to improve the physical facilities strategy, mentoring and coaching as well as marketing and business networking assistance. In order to increase employment, it is necessary to improve mentoring and coaching strategies, marketing assistance, and business networks as well as internal regulations of the university.
Theoretically, this research has supplemented literature in performance measurement of commercialization of research output from higher education in Indonesia. While practically, this study provided information about the relative efficiency value of university strategy to commercialize their research output, which could be used in formulating the strategy of performance enhancement.

Author Contributions

Conceptualization, W.S., R.W.A., and R.T.S.; methodology, W.S. and R.W.A.; software, R.W.A.; validation, W.S., R.W.A., and R.T.S.; formal analysis, W.S.; resources, W.S. and R.T.S.; data curation, W.S.; writing—original draft preparation, W.S. and R.W.A.; writing—review and editing, W.S. and R.W.A.; supervision, W.S.; project administration, W.S.

Funding

Ministry of Research, Technology, and Higher Education, Indonesia.

Acknowledgments

This research was partially funded by the Indonesian Ministry of Research, Technology and Higher Education under WCU Program managed by Institut Teknologi Bandung.

Conflicts of Interest

The authors declare no conflict of interest.

References

  1. Govender, V.; Rampersad, R. Change management in the higher education landscape: A case of the transition process at a South African University. J. Risk Gov. Control Financ. Mark. Inst. 2016, 6, 43–51. [Google Scholar] [CrossRef]
  2. Bramwell, A.; Wolfe, D.A. Universities and regional economic development: The entrepreneurial University of Waterloo. Res. Policy 2008, 37, 1175–1187. [Google Scholar] [CrossRef]
  3. Siegel, D.S.; Waldman, D.; Link, A. Assessing the impact of organizational practices on the relative productivity of university technology transfer offices: An exploratory study. Res. Policy 2003, 32, 27–48. [Google Scholar] [CrossRef]
  4. Wicaksana, D.E.P.; Yunaristanto, Y.; Sutopo, W. Identification of Incubation Scheme by Incubator in University Innovation Center to Develop Indonesian Economy. In Proceedings of the Joint International Conference on Electric Vehicular Technology and Industrial, Mechanical, Electrical and Chemical Engineering (ICEVT & IMECE), Surakarta, Indonesia, 4–5 November 2015. [Google Scholar]
  5. Kusuma, C.; Sutopo, W.; Yuniaristanto, Y.; Hadiyono, S.; Nizam, M. Incubation Scheme of the University Spin Off to Commercialize the Invention in Sebelas Maret University. In Proceedings of the International MultiConference of Engineer and Computer Scientist, Hong Kong, China, 18–20 March 2015. [Google Scholar]
  6. Sutopo, W. Book Review: Technopreneurship, unpublished; Surakarta, Indonesia, 2015.
  7. Sutopo, W. The Roles of Industrial Engineering Education for Promoting Innovations and Technology Commercialization in the Digital Era; IOP Conference Series: Materials Science and Engineering; IOP Publishing Ltd.: Bristol, UK, 2019. [Google Scholar] [CrossRef]
  8. Siegel, D.S.; Veugelers, R.; Wright, M. Technology transfer offices and commercialization of university intellectual property: Performance and policy implications. Oxf. Rev. Econ. Policy 2007, 23, 640–660. [Google Scholar] [CrossRef]
  9. Dalmarco, G.; Dewes, M.D.F.; Zawislak, P.A.; Padula, A.D. Universities’ Intellectual Property: Path for Innovation or Patent Competition? J. Technol. Manag. Innov. 2011, 6, 159–170. [Google Scholar] [CrossRef]
  10. Vinig, T.; Lips, D. Measuring the performance of university technology transfer using meta data approach: The case of Dutch universities. J. Technol. Transf. 2015, 40, 1034–1049. [Google Scholar] [CrossRef]
  11. Rogers, E.M.; Yin, J.; Hoffmann, J. Assessing the effectiveness of technology transfer offices at US research universities. J. Assoc. Univ. Technol. Manag. 2000, 12, 47–80. [Google Scholar]
  12. Phan, P.H.; Siegel, D.S. The effectiveness of university technology transfer. Found. Trends® Entrep. 2006, 2, 77–144. [Google Scholar] [CrossRef]
  13. Harlow, D. Knowledge transfer to industry at selected R1 research universities in North Carolina. Electron. J. Knowl. Manag. 2017, 15, 3–16. [Google Scholar]
  14. DeVol, R.; Lee, J.; Ratnatunga, M. Concept to Commercialization: The Best Universities for Technology Transfer; Milken Institute: Santa Monica, CA, USA, 2017. [Google Scholar]
  15. Carlsson, B.; Fridh, A. Technology Transfer in United States Universities: A Survey and Statistical Analysis. J. Evol. Econ. 2002, 12, 199–232. [Google Scholar] [CrossRef]
  16. Sutopo, W.; Nizam, M.; Purwanto, A.; Atikah, N.; Putri, A.S. A Cost Estimation Application for Determining Feasib i lity Assessment of Li - Ion Battery in Mini Plant Scale. Int. J. Electr. Eng. Inform. 2016, 8, 189–199. [Google Scholar] [CrossRef]
  17. Sutopo, W.; Kadir, E.A. An Indonesian Standard of Lithium-ion Battery Cell Ferro Phospate for Electric Vehicle Applications. Telkomnika 2017, 15, 584–589. [Google Scholar] [CrossRef]
  18. Sutopo, W.; Kadir, E.A. Designing Framework for Standardization Case Study: Lithium-Ion Battery Module in Electric Vehicle Application. Int. J. Electr. Comput. Eng. 2018, 8, 220–226. [Google Scholar] [CrossRef]
  19. Neely, A. The Evolution of Performance Measurement Research Development in the last Decade and a Research Agenda for The Next. Int. J. Oper. Prod. Manag. 2008, 25, 1264–1277. [Google Scholar] [CrossRef]
  20. Medori, D.; Steeple, D. A Framework for Auditing and Enhancing Performance Measurement Systems. Int. J. Oper. Prod. Manag. 2000, 20, 520–533. [Google Scholar] [CrossRef]
  21. Lohman, C.; Fortuin, L.; Wouters, M. Designing a Performance Measurement System. A Case Study. Eur. J. Oper. Res. 2004, 156, 267–286. [Google Scholar] [CrossRef]
  22. Mintzberg, H. Patterns in Strategy Formation. Manag. Sci. 1978, 24, 934–948. [Google Scholar] [CrossRef]
  23. Hill, T. Teaching Manufacturing Strategy. Int. J. Oper. Prod. Manag. 1986, 6, 10–20. [Google Scholar] [CrossRef]
  24. Bititci, U.; Garengo, P.; Dofler, V.; Nudurupati, S. Performance Measurement Chalenges for Tomorrow. Int. J. Manag. Rev. 2012, 14, 305–327. [Google Scholar] [CrossRef]
  25. Folan, P.; Browne, J. A Review of Performance Measurement Towards Performance Management. Comput. Ind. 2005, 56, 663–680. [Google Scholar] [CrossRef]
  26. Word, P.; McCreery, J.; Ritzman, L. Competitive Priorities in Operating Management. Decis. Sci. 1998, 29, 1035–1046. [Google Scholar] [CrossRef]
  27. Thiam, A.; Bravo-Ureta, B.E.; Rivas, T. Technical Efficiency in Developing Country Agriculture: A meta-analysis. Agric. Econ. 2001, 25, 235–243. [Google Scholar] [CrossRef]
  28. Al-Shammari, M. A Multi-Criteria data Envelopment Analysis Model for Measuring The productive Efficiency of hospitals. Int. J. Oper. Prod. Manag. 1999, 19, 879–891. [Google Scholar] [CrossRef]
  29. Yoti, J.; Banwet, D.K.; Deshmukh, S.G. Evaluating performance of national R&D organizations using integrated DEA-AHP technique. Int. J. Product. Perform. Manag. 2008, 58, 370–388. [Google Scholar]
  30. Chang, A.Y.; Whitehouse, D.J.; Chang, S.L.; Hsieh, Y.C. An Approach to The Measurement of Single-Machine Flexibility. Int. J. Prod. Res. 2001, 39, 24. [Google Scholar] [CrossRef]
  31. Hwang, S.N. An Application of Data Envelopment Analysis to Measure the Managerial Performance of Electronics Industry in taiwan. Int. J. Technol. Manag. 2007, 40, 215–221. [Google Scholar] [CrossRef]
  32. Joseph, C.; Sandra, A.; Haiyan, Z. Adjusting for Cultural Differences, a New DEA Model Applied to A Merged bank. J. Prod. Anal. 2010, 33, 109–123. [Google Scholar]
  33. Chen-Ta, B.; Desheng, D.; Chris, C.; David, L. A Risk Scoring Model and Application to Measuring Internet Stock Performance. Int. J. Inf. Technol. Decis. Mak. 2009, 8, 133–149. [Google Scholar]
  34. Jelena, J.; Alemka, S. Measuring the Performance of Local E-Goverment in The Republic of Croatia Using Data Envelopment Analysis. Probl. Perspect. Manag. 2012, 10, 35–44. [Google Scholar]
  35. Tanase, L.; Morar, L. Productive Performance Analysis in Machinery Industry Using mamquist Index. Appl. Mec. Mater. 2012, 245, 220–226. [Google Scholar] [CrossRef]
  36. Tavassoli, M.; Faramarzi, G.R.; Saen, R.F. Efficiency and effectiveness in airline performance using a SBM-NDEA model in the presence of shared input. J. Air Transp. Manag. 2014, 34, 146–153. [Google Scholar] [CrossRef]
  37. Silva, D.; Alves, G.; Neto, P.; Ferreira, T. Measurement of Fitness Function Efficiency Using Data Envelopment Analysis. J. Expert Syst. Appl. 2014, 41, 7147–7160. [Google Scholar] [CrossRef]
  38. Jian, Y.; Dai, L. Statistical Inference of DEA Model of Environtmental Efficiency Considering Undesirable Outputs. In Proceedings of the 2014 Tenth International Conference on Computational Intelligence and Security, Kunming, China, 15–16 November 2014. [Google Scholar]
  39. Sahney, S.; Thakkar, J. A comparative assessment of the performance of select higher education institutes in India. Qual. Assur. Educ. 2016, 24, 278–302. [Google Scholar] [CrossRef]
  40. Huang, C.W.; Nin Ho, F.; Chen, Y.C. Assessing the Effectiveness of Marketing Strategies in Tourist Hotels: An Illustration Using a Multi-Method Approach in Taiwan. J. Travel Tour. Mark. 2015, 32, 1–15. [Google Scholar] [CrossRef]
  41. Thore, S.A.O. DEA and Related Analytical Methods for Evaluating the Use and Implementation of Technical Innovation; Springer: Berlin/Heidelberg, Germany, 2002. [Google Scholar]
  42. Eilat, H.; Golany, B.; Shtub, A. Constructing and Evaluating Balanced Portfolios of RD Projects with Interactions: A DEA Based Methodology. Eur. J. Oper. Res. 2006, 172, 1018–1039. [Google Scholar] [CrossRef]
  43. Wang, E.; Huang, W. Relative Efficiency Of R&D Activities: A Cross-Country Study Accounting for Environmental Factors In The DEA Approach. Res. Policy 2007, 36, 260–273. [Google Scholar]
  44. Sueyoshi, T.; Goto, M. Can R&D expenditure avoid corporate bankruptcy?: Comparison between Japanese machinery and electric equipment industries using DEA–discriminant analysis. Eur. J. Oper. Res. 2009, 196, 289–311. [Google Scholar]
  45. Sueyoshi, T.; Goto, M. A use of DEA–DA to measure importance of R&D expenditure in Japanese information technology industry. Decis. Support Syst. 2013, 54, 941–952. [Google Scholar]
  46. Liu, J.S.; Lu, W.-M. DEA and Ranking with the Network-Based Approach: A Case of R&D performance. Omega 2011, 38, 453–464. [Google Scholar]
  47. Zhong, W.; Yuan, W.; Li, S.; Huang, Z. The Performance Evaluation of Regional R&D Investments in China: An Application of DEA Based on The First Official China Economic Census Data. Omega 2011, 39, 447–455. [Google Scholar]
  48. Shirouyehzad, H.; Lotfi, F.H.; Aryanezhad, M.; Dabestani, R. A data envelopment analysis approach for measuring the efficiency of employees: A case study. S. Afr. J. Ind. Eng. 2012, 23, 191–201. [Google Scholar] [CrossRef]
  49. Chun, D.; Chung, Y.; Woo, C.; Seo, H.; Ko, H. Labor Union Effects on Innovation and Commercialization Productivity: An Integrated Propensity Score Matching and Two-Stage Data Envelopment Analyis. Sustainability 2015, 7, 5120–5138. [Google Scholar] [CrossRef] [Green Version]
  50. Carayannis, E.G.; Rogers, E.M.; Kurihara, K.; Albritton, M. High-Technology Spin-Offs from Goverment R&D Laboratories and Research Universitries. Technovation 1998, 18, 1–11. [Google Scholar]
  51. Baldini, N.; Grimaldi, R.; Sobrero, M. Instutional Changes and The Commercialization of Academic Knowledge: A Study of Italian Universities Patenting Activities. Res. Policy 2006, 35, 518–532. [Google Scholar] [CrossRef]
  52. Nlemvo, N.; Pirnay, F.; Surlemont, B. A Stage Model of Academic Spin Off Creation. Technovation 2002, 5, 281–289. [Google Scholar]
  53. Siegel, G.; Marconi, H.R. Behavioral Accounting; Thomson South-Western: Mason, OH, USA, 1989. [Google Scholar]
  54. Shane, S.; Stuart, T. Organizational Endowments and The Performance of University Start-Ups. Manag. Sci. 2002, 48, 154–170. [Google Scholar] [CrossRef] [Green Version]
  55. Mainelli, P. Managing Innovation and Entrepreneurship in Technology Based Firm; John Wiley&Sons Inc.: New York, NY, USA, 2001. [Google Scholar]
  56. Yun, J.J.; Lee, M.; Park, K.; Zhao, X. Open Innovation and Serial Entrepreneurs. Sustainability 2019, 11, 5055. [Google Scholar] [CrossRef] [Green Version]
  57. Yun, J.J.; Jeong, E.; Zhao, X.; Hahm, S.D.; Kim, K. Collective Intelligence: An Emerging World in Open Innovation. Sustainability 2019, 11, 4495. [Google Scholar] [CrossRef] [Green Version]
  58. Yun, J.J.; Liu, Z. Micro- and Macro-Dynamics of Open Innovation with a Quadruple-Helix Model. Sustainability 2019, 11, 3301. [Google Scholar] [CrossRef] [Green Version]
  59. Yun, J.J.; Won, D.; Park, K.; Jeong, E.; Zhao, X. The role of a business model in market growth: The difference between the converted industry and the emerging industry. Technol. Forecast. Soc. Chang. 2019, 146, 534–562. [Google Scholar] [CrossRef]
  60. Yun, J.J.; Won, D.; Park, K. Entrepreneurial cyclical dynamics of open innovation. J. Evol. Econ. 2018, 28, 1151–1174. [Google Scholar] [CrossRef]
  61. Yun, J.J.; Jeong, E.; Lee, Y.; Kim, K. The Effect of Open Innovation on Technology Value and Technology Transfer: A Comparative Analysis of the Automotive, Robotics, and Aviation Industries of Korea. Sustainability 2018, 10, 2459. [Google Scholar] [CrossRef] [Green Version]
  62. Neely, A.; Gregory, M.; Platts, K. Performance Measurement System Design: A Literature Review and Research Agenda. Int. J. Oper. Prod. Manag. 2005, 25, 1228–1263. [Google Scholar] [CrossRef]
  63. Poister, T. Measuring Performance in Public and Nonprofit Organization; Jossey-Bass: San Francisco, CA, USA, 2003. [Google Scholar]
  64. De Waal, A.; Geodegebuure, R.; Geradts, P. The Impact of performance Management on the Result of a Non-Profit Organization. Int. J. Product. Perform. Manag. 2011, 60, 778–796. [Google Scholar] [CrossRef] [Green Version]
  65. Moxham, C. Performance Measurement; Examining the Applicability of the Existing Body of Knowledge to Nonprofit Organizations. Int. J. Oper. Prod. Manag. 2009, 29, 740–763. [Google Scholar] [CrossRef]
  66. Ramanathan, R. An Introduction to Data Envelopment Analysis: A Tool for Performance Measurement; Sage Publication Pvt Ltd.: New Delhi, India, 2003. [Google Scholar]
  67. Charnes, A.; Cooper, W.; Rhodes, E. Measuring the Efficiency of Decision Making Units. Eur. J. Oper. Res. 1978, 2, 429–444. [Google Scholar] [CrossRef]
  68. Banker, R.; Charnes, A.; Cooper, W. Models for Estimating technical and Scale Inefficiencies in data Envelopment Analysis. Manag. Sci. 1984, 30, 1078–1092. [Google Scholar] [CrossRef] [Green Version]
  69. Scholten, V.E.; Elfring, T.; Omta, S.W.F. The Parent Connection: The Effect of the Parent–Spin-Off Relationship on the Spin-Off’s Successes. In Proceedings of the Babson Kauffman Entrepreneurship Research Conference, Strathclyde, Scotland, 3 June 2004. [Google Scholar]
  70. Egeln, J.; Gottschalk, S.; Rammer, C.; Spielkamp, A. Public Research Spin-Offs in Germany, Summary Report, ZEW Documentation 03-04; Centre for European Economic Research: Manheim, Germany, 2003. [Google Scholar]
  71. Scholten, E. The Early Growth of Academic Spin-Offs. Ph.D. Thesis, Wageningen University, Wageningen, The Netherlands, 2006. [Google Scholar]
  72. Kriegesmann, B. Unternehmensgründungen aus der Wissenschaft. Eine empirische Analyse zu Stand, Entwicklungen und institutionellen Rahmenbedingungen in außeruniversitären Forschung-seinrichtungen. Z Betr. 2000, 70, 397–414. [Google Scholar]
  73. Vohara, A.; Wright, M.; Lockett, A. Critical Junctures in The Development of University High-Tech Spinout Companies. Res. Policy 2004, 33, 147–175. [Google Scholar] [CrossRef]
  74. Cooper, S.; Hetherington, L. Facilitating Academic Entrepreneurship: Encouraging Technology Commercialisation through the Development of Entrepreneurial Capability; Babson College: Wellesley, MA, USA, 2003. [Google Scholar]
  75. Lockett, A.; Wright, M. Resources, Capabilities, Risk Capital and The Creation of University Spin-Out Companies. Res. Policy 2005, 34, 1043–1057. [Google Scholar] [CrossRef]
  76. Markman, G.D.; Phan, P.H.; Balkin, D.B.; Gianiodis, P.T. Innovation speed: Transferring University Technology to Market. Res. Policy 2005, 34, 1058–1075. [Google Scholar] [CrossRef]
  77. Smilor, W.; Matthews, J. University Venturing: Technology Transfer and Commercialisation in Higher Education. Int. J. Technol. Transf. Commer. 2004, 3, 111–128. [Google Scholar] [CrossRef]
  78. Lockett, A.; Wright, M.; Franklin, S. Technology Transfer and Universities’spin-out Atrategies. Small Bus. Econ. 2003, 20, 185–200. [Google Scholar] [CrossRef]
  79. Schmelter, A. Entwicklungsverläufe forschungsnaher Unternehmensgru ndungen und deren Determinanten. Die Betr. 2004, 64, 471–486. [Google Scholar]
  80. Grandi, A.; Grimaldi, R. Exploring the networking characteristics of new venture founding teams. Small Bus. Econ. 2003, 21, 329–341. [Google Scholar] [CrossRef]
  81. Lendner, C. How University Business Incubators Help Start-Ups to Succeed: An International Study. In Babson Kauffmann Entrepreneurship Research Conference; Babson College: Wellesley, MA, USA, 2003. [Google Scholar]
  82. O’Shea, R.; Allen, T.; Chevalier, A. Entrepreneurial Orientation, Technology Transfer, and Spin-Off Performance of U.S. Universities. Res. Policy 2005, 34, 994–1009. [Google Scholar] [CrossRef]
  83. Trune, D.R.; Goslin, L.N. University Technology Transfer Programs: A Profit/Loss Analysis. Technol. Forecast. Soc. Chang. 1998, 57, 197–204. [Google Scholar] [CrossRef]
  84. Jensen, R.A.; Thursby, M.C. Patent Licensing and the Research University. NBER Working Paper No. w10758. Available online: https://ssrn.com/abstract=590773 (accessed on 15 August 2019).
  85. Thursby, J.G.; Thursby, M.C. University Licensing (Winter 2007). Oxf. Rev. Econ. Policy 2007, 23, 620–639. [Google Scholar] [CrossRef]
  86. Ministry of Technology Research and Higher Education Report. Available online: https://ristekdikti.go.id/wp-content/uploads/2017/07/Buku-Laporan-Tahunan-2016.pdf (accessed on 15 August 2019).
  87. Albadvi, A.; Saremi, H. Business Incubation Process Framework: The Case of Iranian High-Tech Innovations. In Proceedings of the 2006 IEEE International Conference on Management of Innovation and Technology, Singapore, 21–23 June 2006. [Google Scholar]
  88. Darrat, A.; Topuz, C.; Yousef, T. Assessing Cost and Technical Efficiency of Banks in Kuwait. In Proceedings of the ERF’s 8th Annual Conference in Cairo, Cairo, Egypt, 15–17 January 2002. [Google Scholar]
  89. Avkiran, N.K. Investigating Technical and Scale Efficiencies of Australian Universities Trough Data Envelopment Analysis. Socio Econ. Plan. Ser. 2001, 35, 57–80. [Google Scholar] [CrossRef]
  90. Chesbrough, H.; Anhaverbeke, W. Open Innovation: Researching A New Paradigm; West, J., Ed.; Oxford University Press: Oxford, UK, 2006. [Google Scholar]
Figure 1. Measurement strategy.
Joitmc 05 00095 g001
Figure 2. Science–technology transfer and innovation diffusion process.
Joitmc 05 00095 g002
Figure 3. Commercialization strategy framework.
Joitmc 05 00095 g003
Figure 4. Performance measurement framework of commercialization strategy.
Joitmc 05 00095 g004
Figure 5. Efficiency frontier of five technology transfer offices consuming two inputs.
Joitmc 05 00095 g005
Figure 6. The open innovation paradigm (sources from Reference [90]).
Joitmc 05 00095 g006
Table 1. State of the art of this research.
AuthorObject of StudyDecision-Making Unit (DMU)DEA ModelOrientationNumber of InputsNumber of OutputsMeasurement Scale
CCRBCCInputOutput
An-Yuan et al. [30]Manufacturing SystemProduction machine 42Ratio
Thore [41]University, Industry, Country
Eilat, Golani, and Shtub [42]Government OrganizationNational R&D organization 66Ratio
Shiuh-Nan [31]Manufacturing SystemCompanies in the electronics industry 73Ratio
Wang and Huang [43]National (State)National R&D organization 44Ratio
Jyoti, Banwet, and Deshmukh [29]Government OrganizationNational R&D organization 64Ratio
Joseph, Sandra, and Haiyan [32]Financial Services SystemFinancial companies in Canada 55Ratio
Chen Ta et al. [33]Manufacturing IndustryUS companies registered online 22Ratio
Sueyoshi and Goto [44]Financial Services SystemRegional industrial finance 33Ratio
Liu and Lu [46]Government OrganizationNational R&D organization 43Ratio
Zhong et al. [47]Government OrganizationNational R&D organization 75Ratio
Jelena and Alemka [34]Government Organizatione-Business governance 83Ratio
Shirouyehzad et al. [48]Manufacturing IndustryLabor 44Ordinal (Likert)
Tanase and Morar [35]Manufacturing IndustryConstruction machinery 44Ratio
Sueyoshi and Goto [45]Manufacturing IndustryNational R&D organization 42Ratio
Tavassoli, Faramarzi, and Saen [36]Manufacturing SystemCompany suppliers 33Ratio
Chun et al. [49]Manufacturing SystemA manufacturing company in Korea 32Ratio
Huang, Nin Ho, and Chen [40]Service CompanyHotel business 43Ratio
Sahney [39]UniversityHigher education institutions 55Ratio
This researchUniversityTechnology Transfer Services Office 55Ordinal (Likert)
Table 2. Operationalization of input variables and identification of indicators.
StrategyOperational DefinitionIndicatorReference
Physical Facilities (I1)Physical facilities are all things that are in the form of objects, or that can be constrained, which have the role of being able to facilitate and provide fluency in the commercialization process of university research results.Available space office, space workshop (workshop) and laboratoryScholten et al. [69], Egeln et al. [70], Scholten [71], Kriegesmann [72]
Meeting room available
Available network telephone and internet
Available business space and showroom
Mentoring and Coaching (I2)Mentoring is a process carried out by a technology transfer service tenant’s office by a mentor who teaches tips and tricks, successful experiences, and successful methods, based on the mentor’s experience in the process of commercializing research results.
Coaching is a process carried out by managers or staff of the technology transfer service office to train and provide orientation to tenants regarding matters related to the commercialization process of research results to achieve maximum results.
Preparation of business plans and business modelsVohara et al. [73],
Cooper and Hetherington [74], Egeln et al. [70]
Corporate design management and business risk
Government goods procurement process
System contract in government
Management of intellectual property rights
Introduction to business law and ethics
Organizational management
Tax system
Strategy determination of price, system sales, and product distribution
Marketing and Business Networking (I3)The marketing assistance and business network expansion in question is an activity that supports the access of products to the commercial market and the expansion of networks with industries and potential consumers of research to be commercialized.Disseminate research resultsLockett and Wright [75], Markman et al. [76], Smilor and Matthews [77], Lockett et al. [78]
Market research
Promotion media
Held meeting of business and exhibitions
Access to network industry and consumer potential
Synergy with business ecosystem networks between suppliers of raw materials, government, technology
suppliers, between SMEs, and between offices of other technology transfer services.
Financial Aspect (I4)Financial access support is a series of processes in supporting the commercialization of university research results from the financial aspect.Incentives and scheme fundingScholten [71], Smilor and Matthews [77], Lockett et al. [78], Shane and Stuart [54]
Introduction and assistance of access to financial institutions
Provision of initial capital, growth capital, and development capital
Financial planning and management capabilities
Preparation of financial statements
University Internal Regulation (I5)The intended university regulations are regulations in the form of policies and regulations, which are decided by the university’s Rector relating to the commercialization process of university research results.Product readiness evaluation systemSchmelter [79], Scholten [71], Grandi and Grimaldi [80], Lockett et al. [78], Lendner [81], O’Shea et al. [82]
Policies and/or rules for commercialization of intellectual property rights (IPR)
Policies and/or rules encouragement of innovation and development of products
Policies and/or regulations encourage cooperation with industry.
Incentive policies and/or rules
Policies and/or rules for the rights and obligations of inventors and tenants
Table 3. Operationalization of output variables and identification of indicators.
StrategyOperational DefinitionIndicatorReference
Commercialization Process Output of University Research ResultsThe output of the commercialization process is an output of the commercialization process, which is used as a reference in evaluating the effectiveness of the commercialization strategy used.Marketable products with institutional brandsSchmelter [79], Lendner [81]
Technology-based startupShane and Stuart [54]
Joint ventureShane and Stuart [54]
LicenseShane and Stuart [54]
Absorb employmentSchmelter [79], Egeln et al. [70]
Table 4. List of technology transfer service offices.
No.UniversityTechnology Transfer Service Office
1U1Business Incubator and Entrepreneurship Development Centre (Incubie)
2U2Business Incubator
3U3Institute for Innovation and Entrepreneurship Development (LPIK)
4U4Directorate of Business Development and Incubation
PT. GKR
Table 5. List of DMU Codes.
No.Decision-Making Unit (DMU)DMU Code
1U1—Incubie 2016TTO1
2U1—Incubie 2015TTO2
3U1—Incubie 2014TTO3
4U1—Incubie 2013TTO4
5U1—Incubie 2012TTO5
6U2—Business Incubator 2016TTO6
7U2—Business Incubator 2015TTO7
8U2—Business Incubator 2014TTO8
9U2—Business Incubator 2013TTO9
10U2—Business Incubator 2012TTO10
11U3—LPIK 2016TTO11
12U3—LPIK 2015TTO12
13U3—LPIK 2014TTO13
14U3—LPIK 2013TTO14
15U3—LPIK 2012TTO15
16U4—Directorate of Business Development and Incubation 2016TTO16
17U4—Directorate of Business Development and Incubation 2015TTO17
18U4—Directorate of Business Development and Incubation 2014TTO18
19U4—Directorate of Business Development and Incubation 2013TTO19
20U4—Directorate of Business Development and Incubation 2012TTO20
21U4—PT. GKR 2016TTO21
22U4—PT. GKR 2015TTO22
23U4—PT. GKR 2014TTO23
24U4—PT. GKR 2013TTO24
25U4—PT. GKR 2012TTO25
Table 6. Strategy assessment data for respective variable.
DMUI1I2I3I4I5O1O2O3O4O5
TTO15.004.894.674.603.8355344
TTO25.004.894.504.603.8354344
TTO34.504.004.334.404.5042343
TTO44.003.783.833.804.1731333
TTO53.253.563.333.604.1731233
TTO64.754.334.174.404.6744434
TTO74.504.114.174.404.6733433
TTO84.003.783.674.004.3333433
TTO93.503.443.503.804.0033333
TTO103.503.223.003.604.0033333
TTO115.004.564.174.204.8344454
TTO124.254.564.174.204.8343443
TTO133.754.333.834.004.3333433
TTO143.503.783.673.404.0033333
TTO153.003.673.503.204.0033333
TTO164.754.334.174.204.3334444
TTO174.754.224.004.004.3333443
TTO184.004.003.673.803.8333443
TTO193.753.673.333.403.6733333
TTO203.753.673.333.403.5033333
TTO214.004.113.503.604.6734345
TTO224.004.003.503.604.6733444
TTO233.503.783.333.604.1733444
TTO243.253.563.173.203.8333333
TTO253.253.443.173.003.5033333
Table 7. Decision-making units (DMU) relative efficiency value.
DMUScoreRankReference Set Benchmark (Lambda)
TTO111TTO11
TTO211TTO21
TTO311TTO31
TTO40.8764366TTO20.057896TTO60.182529TTO100.387987TTO110.124633TTO230.115791TTO250.131164
TTO50.9784372TTO20.033058TTO150.264463TTO230.033058TTO250.669421
TTO611TTO61
TTO711TTO71
TTO811TTO81
TTO90.9655443TTO10.053528TTO100.518248TTO230.107056TTO250.321168
TTO1011TTO101
TTO1111TTO111
TTO1211TTO121
TTO1311TTO170.200000TTO230.800000
TTO140.925TTO10.130435TTO150.173913TTO230.260870TTO250.434783
TTO1511TTO151
TTO1611TTO161
TTO1711TTO120.242424TTO230.757576
TTO1811TTO181
TTO190.9426774TTO10.091214TTO100.035346TTO230.182427TTO250.691013
TTO2011TTO251
TTO2111TTO211
TTO2211TTO221
TTO2311TTO231
TTO2411TTO241
TTO2511TTO251
Table 8. Correlation value between efficient DMU variables.
StrategyThe Commercial Product (O1)PPBT (O2)Joint Venture (O3)License (O4)Employment (O5)
Physical Facilities (I1)0.6090.4800.2510.5230.260
Mentoring and Coaching (I2)0.6080.5250.3000.4870.412
Marketing and Business Networking (I3)0.6800.3600.1980.3990.347
Financial Aspect (I4)0.6060.3540.2370.3350.255
University Internal Regulation (I5)0.6710.6900.5030.3020.343

