Article

Improved Differential Evolution Algorithm to Solve the Advertising Method Selection Problem

by
Malichan Thongkham
1 and
Tassin Srivarapongse
2,*
1
Department of Marketing, Mahasarakham Business School, Mahasarakham University, Mahasarakham 44000, Thailand
2
Department of Economics, Faculty of Business Administration, Rajamangala University of Technology Thanyaburi, Patumthani 10900, Thailand
*
Author to whom correspondence should be addressed.
J. Open Innov. Technol. Mark. Complex. 2019, 5(3), 61; https://doi.org/10.3390/joitmc5030061
Submission received: 1 July 2019 / Revised: 19 August 2019 / Accepted: 20 August 2019 / Published: 22 August 2019

Abstract

:
This article proposes a methodology to resolve the advertising method selection problem (AdSP). The use of different advertising methods for the same product can generate different responses in terms of the product’s sales volume. Companies selling products have limited resources for advertising, with challenges such as budget and time constraints. It is necessary that the correct advertising method is selected in order to increase the maximum profit, given these limited resources. In the present study, a mathematical model was developed to represent the AdSP, and optimization software (OS) was utilized to optimally resolve it. However, a larger problem can prevent OS from optimally resolving the problem within a reasonable timeframe. To overcome this challenge, the authors developed a metaheuristic called the improved differential evolution algorithm (IDE), which combines three metaheuristics: (1) The differential evolution algorithm (DE); (2) the iterated local search (ILS); and (3) the adaptive large neighborhood search (ALNS). The performance of IDE reflects the best elements of these three methods. The computational results show that IDE can generate solutions that are similar to the optimal solutions obtained by OS while using 69.25% less computational time than OS. IDE improved the efficiency compared with the three original component methods. Moreover, IDE also found better solutions than those found by the original DE, ILS, and ALNS.

1. Introduction

A product’s quality is a crucial issue in the production system. Meanwhile, the choice of advertising methods to advertise the product is an important marketing issue. Advertising can increase a product’s sales volume and introduce new products to the market by making it known and familiar to customers. This is the primary objective of advertising. There are a variety of approaches used by companies to select the appropriate advertising method to reach the product’s target customers. Advertising choices are diverse, and include television programs, newspapers, bus-stop posters, magazine posters, magazine news, in-store displays, internet banner adverts, flyers, Facebook adverts, and other forms of social media advertising. It can be difficult to select a medium or an advertising method that is suitable for individual products, particularly for companies selling a range of product types that require numerous advertising methods.
Manik, Gupta, and Jha [1] presented a mathematical model to find a solution for advertisement planning in web news media and maximize a company’s income. An optimal position for an advertisement of a particular product has been revealed to web providers. Advertising space on a webpage can vary in cost depending on its position: The top of the webpage is a prime location for advertising, although this space is sold at a higher cost since it can easily reach more potential customers compared with lower web page positions. It is important for web providers to use website designs that provide good advertising positions to advertisers who are willing to pay for them (Drèze and Zufryden [2]).
Advertisement selection on multimedia platforms has been widely studied from diverse perspectives, such as the use of Facebook to recruit workers (Thornton, Batterham, Fassnacht, Kay-Lambkin, Calear, and Hunt [3]; Lane, Armin, and Gordon [4]; Batterham [5]). It has been revealed that adverts with different wordings on Facebook vary in their ability to reach target customers (Nelson, Hughes, Oakes, Pankow, and Kulasingam [6]; Fenner, Garland, Moore, Jayasinghe, Fletcher, Tabrizi, Gunasekaran, and Wark [7]; Ramo and Prochaska [8]). For example, different images and message types on Facebook have been shown to affect click generation (Ramo, Rodriguez, Chavez, Sommer, and Prochaska [9]).
Besides online advertisement, there are range of other advertising choices, such as print advertising (Toncar, and Munch [10]; Mehta [11]; Latour and Henthorne [12]), periodical advertising (newspapers, magazines) (Kassarjian [13]), brochures, leaflets, flyers, handouts, point-of-sale advertising, and television programs (Moschis and Moore [14]; Emmanuel and Perrien [15]). Different advertising methods vary in their effects on customer behavior. The type or the lifetime of a product can also affect the selection of advertising methods. Moreover, individual products applying the same advertising method may consume different resources while developing the advertisement.
The aforementioned literature indicates that most of the previous advertisement researches have been concerned with how each advertising method reaches target customers. There is a lack of research discussing how a company can select the optimal type of advertising when they have a large number of finished goods. The company must determine the optimal advertisement plan to ensure that they have the most suitable sales volume when faced with limited resources and constraints that could potentially affect the selection of advertising methods. This research aims to resolve this issue and makes the following contributions:
(1)
Formulation of a mathematical model of the advertisement selection problem;
(2)
Proposal of a differential evolution algorithm (DE) to solve the problem; and
(3)
Formulation of the problem with the following attributes:
(3.1)
Individual products respond differently when different advertising methods are used (different efficiencies);
(3.2)
The possibility of a particular advertisement increasing the sales volume is uncertain;
(3.3)
There are budget limitations for advertising methods; and
(3.4)
There are resource limitations for all advertising methods.
Mixed-integer programming was formulated to represent the problem. Because of the complexity of the problem, the optimization software was unable to optimally resolve it within a reasonable computational time. Therefore, metaheuristics were developed to solve the proposed problem. The proposed approach uses the DE method, one of the most popular heuristics in current research.
A heuristic is a methodology that can solve difficult problems with reasonable computational time. A heuristic does not guarantee that it will find the optimal solution, but many published articles have shown that effective heuristics can generate an acceptable solution with trade-offs between the computational time and the solution quality.
Many different types of heuristics and metaheuristics have been developed, including the genetic algorithm (GA) (Holland [16], Kampelis, Sifakis, Kolokotsa, Gobakis, Kalaitzakis, Isidori and Cristalli [17]; Lara-Ramirez, Garcia-Capulin, Estudillo-Ayala, Avina-Cervantes, Sanchez-Yanez, and Rostro-Gonzalez [18]), the memetic algorithm (Zhang, Li, Qiao, and Wang [19]; Cheng and Lai [20]), ant colony optimization (Ebadinezhad, Dereboylu, and Ever [21]; Jiang, Xu, and Chen [22], iterated local search (Gao, Zhu, Liu, Meng, and Zhang [23]; Hu, Liu, Wu, Li, Zhou, and Wang [24]), adaptive large neighborhood search (Liu, Du, Zhang, Li, and Shi [25]; Praseeratasang, Pitakaso, Sethanan, and Kaewman [26]; Theeraviriya, Pitakaso, Sillapasa, and Kaewman [27]), particle swam optimization (PSO) (Kennedy, Eberhart, and Shi [28], Xu and Ren [29]), and DE (Zhang, Feng, and Lin [30]; Dechampai, Tanwanichkul, Sethanan, and Pitakaso, [31]).
DE was first proposed by Storn and Price [32]. Since then, many researchers have used DE to solve various problems, such as the traveling salesman problem (Akararungruangkul, Chokanat, Pitakaso, Supakdee, and Sethanan [33]; Sethanan and Pitakaso [34]), the generalized assignment problem (Srivarapongse, and Pijitbanjong [35]; Sethanan and Pitakaso [36]), the assembly line balancing problem (Pitakaso [37]; Pitakaso and Sethanan [38]), the location problem (Chomchalao, Kaewman, Pitakaso, and Sethanan [39]; Thongdee, and Pitakaso [40]), and the crop planning problem (Ketsripongsa, Pitakaso, Sethanan, and Srivarapongse [41]; Pijitbanjong, Akararungruangkul, Pitakaso, and Sethanan [42]).
The efficiency of DE depends on several factors: (1) The decoding method; (2) the exploitation search behavior; and (3) the exploration search behavior. Many studies have attempted to improve the efficiency of DE using different decoding methods, while others have used alternative methods. The exploitation search focuses on intensively searching in a specific area. Most studies that have focused on improving the exploitation search have added local searches to the general DE procedure (Srivarapongse, and Pijitbanjong [35]; Akararungruangkul et al. [33]; Thongdee, and Pitakaso [40]). The local search that is added to improve the exploitation behavior of DE mostly consists of simple heuristics, such as exchange heuristics and 2-opt heuristics. The exploration behavior of DE allows it to broaden the search space to many different areas. Random walk behavior has been frequently added to the general DE mechanism in order to improve the algorithm’s efficiency. Some studies have generated new random numbers in the mature stage while searching with DE (Sethanan and Pitakaso [34]; Sethanan and Pitakaso [36]), and some have also guided the search into different problem areas (Chomchalao et al. [39]). In the present study, in order to enhance DE, the authors improved the exploitation and exploration search behavior by combining DE with two other metaheuristics: Adaptive large neighborhood search (ALNS) and iterated local search (ILS). The combination of DE with other metaheuristics has been previously successfully applied, such as DE with PSO (Xin et al. [43], Epitropakis et al. [44], Miranda and Alves [45]), DE with GA (Elsayed et. al. [46] Trivedi et al. [47]), and DE with simulated annealing (Olensek et al. [48]. In addition to the increased effectiveness of DE due to hybridization with other metaheuristics, DE combined with simple local search can also improve the algorithm’s efficiency (Reynoso-Meza et al. [49], Jia et al. [50], Neri et al. [51], and Zhan and Zhang [52]). An outstanding review article on DE was presented by Das et al. [53]. The addressed method has excellent search capability in both exploration and exploitation searches; thus, the combination of DE and ILS in the proposed approach could possibly enhance these behaviors as well.
This article is organized as follows: Section 2 presents and defines the problem and the mathematical formulation, and the advertising method selection problem (AdSP) is clearly described. Section 3 explains the proposed method, and Section 4 shows the computational results. Finally, Section 5 concludes the article.

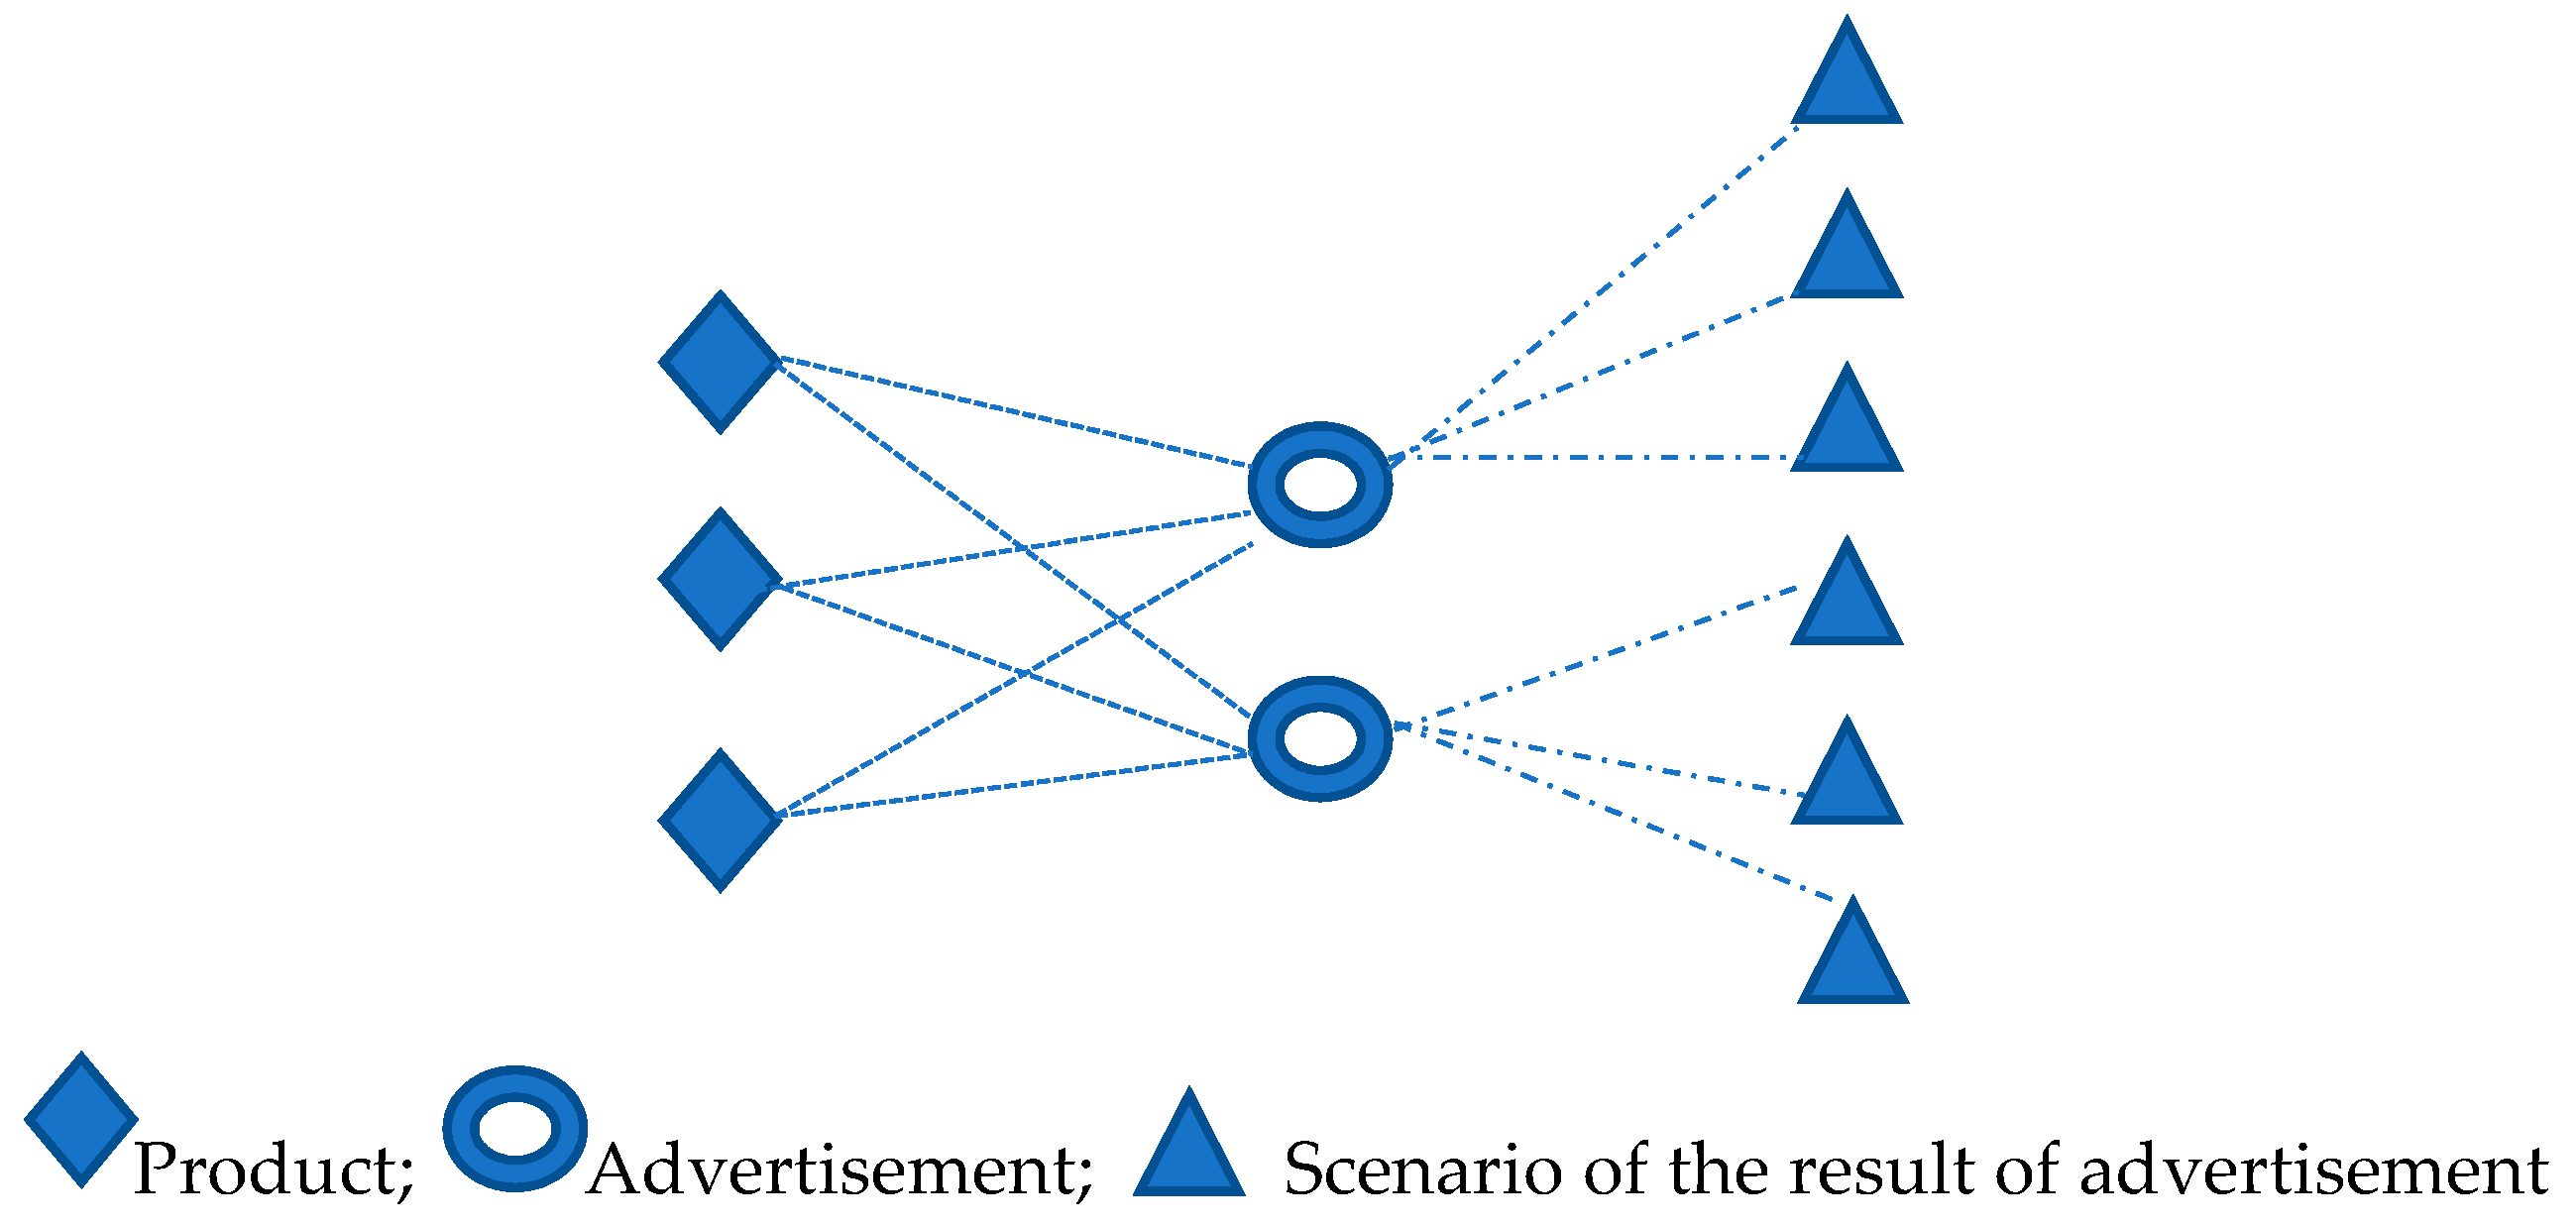
2. Problem Definition and Mathematical Formulation

This section explains the advertising method selection problem (AdSP). Many products require advertising, with advertising examples such as the Internet, television, magazines, and local show advertisements. Each advertising method meets different market goals and affects the end customers differently. Different advertising methods can generate variable sales volumes for the same product, and different products using different advertising methods can also change the sales volume. Moreover, different methods can result in different advertising costs, production times, and other factors. Assigning a suitable advertising method to a particular product can ensure that the company generates maximal profit. Figure 1 illustrates an unsolved problem, while Figure 2 shows an example of a solved problem.
Figure 2 shows that products can only be assigned to a single advertising method. The advertising method can take on more than one product, but it must be below its maximum capacity. The capacity can be defined by people, machines, or time. The objective function is to maximize the expected value of profit, which can be calculated from the possibility of each scenario multiplied by the pre-finalized sales volume of the product, which is determined by the basic sales volume multiplied by the stimulation level of the product. For example, Product A has a basic sales volume of 500 units. If Product A is assigned to Advertising Method 1, it can increase its sales volume by 20%, 25%, and 30% with a probability of 0.1, 0.2, and 0.7, respectively. The stimulation level of Product A is 1.3 (the difficulty level of the advertisement’s ability to stimulate product sales). Therefore, the expected sales volume is 500 + [0.1 × 0.2 × 500 × 1.3] + [0.2 × 0.25 × 500 × 1.3] + [0.7 × 0.3 × 500 × 1.3] = 682 units. If Product A has a sale price of 378 baht per unit, then assigning Product A to Advertising Method A is 100,000 baht; therefore, the profit from the assignment is 682 × 378 − 100,000 = 157,796 baht. The same method can be executed for all the products until they have all been assigned to exactly one advertising method. The mathematical representation is shown in the following section.

Mathematical Model Formulation

Indices
IMaximum number of products
JMaximum number of advertising methods
KMaximum number of scenarios
iNumber of products i = 1 … I
jNumber of advertising methods j = 1 … J
kNumber of products k = 1 … K
Parameters
MjMaximum available time for advertisement j (server)
ViMinimum sales volume of product i
PiPrice of product i per unit
NMaximum budget of the company for the advertisement
RjkProbability of the occurrence of scenario k while using advertisement j
TijTime that is used to create the advertisement of product i using advertisement j
EijEffective factor of product i using advertisement j mean percent to increase/decrease sales volume of product i using advertisement j; if the value is 1, then using
advertisement j to advertise product i does not affect the sales volume.
LkFactor to increase the sales volume using scenario k
CijAdvertisement cost of product i using advertisement j
OiTotal cost of producing product i
Variables
Xij { 1   i f   p r o d u c t   i   i s   a s s i g n e d   t o   a d v e r t i s e m e n t   j   0                           o t h e r w i s e
WiExpected sales volume of product i
Objective function
The   objective   function   is   M a x   Z =   i = 1 I ( P i O i ) W i i = 1 I j = 1 J C i j X i j
Subject to
W i = V i + j = 1 J k = 1 K R i k E i j V i L k X i j                     I   = 1 ,   ,   I
j = 1 J X i j   1                     I   = 1 ,   ,   I
i = 1 I X i j T i j   M j                     j   = 1 ,   ,   J
j = 1 J X i j C i j   N                     I   = 1 ,   ,   I
The mathematical model shown above represents the proposed problem. Equation (1) represents the objective function, which is to maximize the maximum profit generated by all products. The profit is determined by the total sales revenue subtracted by the cost of producing the product. The sales margin is then subtracted from the advertisement cost. Four constraints are added to the model: Equation (2) calculates the expected sales volume, which is the function of the standard sales volume and the volume that is affected by the assignment of a product to the advertisement; Equation (3) controls the product so that it can only be assigned to one advertising method; and Equations (4) and (5) are constraints that are applied to the maximum time and budget used in the assignment, respectively.

3. The Improved Differential Evolution Algorithm (IDE)

The DE is used in the proposed approach. This algorithm has four general steps: (1) Generate the initial solutions; (2) perform the mutation formula; (3) perform the recombination formula; and (4) perform the selection process. In this study, the selection process was modified to enhance the search performance of the original DE, especially in terms of its ability to escape from the local optimal when it is trapped in the local optimum.
Typically, in DE, only a good solution is accepted to iteratively perform the DE algorithm. In our selection process, it is possible that poor solutions are accepted. The use of a new selection process or the original selection process using a probability function is dependent on different solutions that are selected. All details are shown during the selection process. The researchers used two local search strategies as the search engine in the original algorithm. The two local search techniques used here were the ILS and the ALNS. The methods were set to be used iteratively, and some information about their current solution was uprated. Details of the proposed method are explained below.

3.1. Generating the Initial Solution

The DE was originally developed to solve the continuous function. Therefore, all the steps of DE use continuous numbers to execute the algorithm. The DE solution is called a target vector. The target vector of the first iteration is randomly generated. The vector that represents the solution is shown in Table 1.
Table 1 shows five vectors that are represented in the product label. There are twelve products that must be assigned to advertising methods. Therefore, an additional five vectors must be randomly generated for the advertisement types. Table 2 shows the advertising method, with seven advertising methods shown.
DE was originally designed to solve continuous optimization. Applying DE to combinatorial optimization requires an effective decoding method to extract the solution of the proposed problem from the vectors represented in Table 1 and Table 2.
There are four steps in the decoding method:
Step 1:
Sort the products and advertising methods according to increasing value.
Step 2:
Assign the product to the advertising method according to the orders in Step 1. The following conditions are applied:
(a)
For each advertising method, the total time used to develop the advertisement must be less than or equal to its limited time.
(b)
The assignment of products to advertising methods must remain within a budget that is less than or equal to the firm’s limited budget.
Step 3:
Calculate the expected sales volume.
Step 4:
Calculate the total profit.
The following example illustrates the implementation of the decoding method. Advertising Methods 1–7 have time limits of 180, 180, 240, 120, 240, 360, and 360 min, respectively. Advertising Methods 1–7 (in this example, for ease of understanding, it is assumed that it takes the same time) require 120, 80, 80, 60, 120, 180, 60, 60, 80, 80, 60, and 40 min to produce an advertisement for Products 1–12, respectively. When Product 1 is assigned to Advertising Methods 1–7, it uses a budget of 2000, 4500, 4500, 3000, 3500, 4000, and 3200 baht, respectively, while the company’s total budget assigned to all the advertised products is 25,000 baht. Vector 1 is used to demonstrate the decoding method. Table 3 and Table 4 show Vector 1 (before and after the vector is sorted) of the product and advertising methods.
Table 3 and Table 4 indicate that Product 6 will be first assigned to Advertising Method 1. The advertisement for Product 6 using Method 1 is created in 180 min, which is the full capacity of Advertising Method 1. Therefore, Products 2, 1, 8, and 7 must be assigned to Advertising Method 7, and it will take 340 min to create the advertisements for those products. The same procedure is continued until all the products are assigned to exactly one advertising method. In case of having at least one product that cannot be assigned to the last advertising method, those set of products must re-insert themselves into the method that has enough remaining capacity. In case of failing to find a feasible solution, then the last feasible solution will be used to replace the former solution.

3.2. Performing the Mutation Process

The mutation process is used to evolve a value that is in a certain position of a vector. Vector evolution comprises two steps: (1) The mutation process and (2) the recombination process. The mutation process can be executed using Formula (6).
V i , j , G = X r 1 , j , G + F ( X r 2 , j , G X r 3 , j , G )
The mutant vector V i , j , G is the product of three random target vectors, while r 1 ,   r 2 , and r 3 are the labels of the selected vectors. F represents the predefined parameters and is called the scaling factor (F).

3.3. Performing the Recombination Process

Equation (7) is used to build up the trial vector ( U i , j , G ) using the information from the mutant vector ( V i , j , G ) and target vector ( X i , j , G ), and CR is the predefined parameter with a value between 0 and 1.
U i , j , G = { V i , j , G i f r a n d i , j C R X i , j , G i f r a n d i , j > C R

3.4. Performing the Local Search

The proposed approach uses two local search techniques: (1) ILS and (2) ALNS. These two techniques are among the most popular metaheuristics used to solve various types of combinatorial optimization. The ILS and ALNS methodologies are explained below.

3.4.1. Iterated Local Search (ILS)

An ILS is a very simple but powerful metaheuristic. The advantage of ILS is that it uses a small number of parameters, making it a fast and effective algorithm. ILS is generally composed of three general steps: (1) Generate the initial solution; (2) apply the local search; and (3) perturb the current solution. ILS must be slightly modified for its use as the local search for the DE. The algorithm is shown in Algorithm 1.
Algorithm 1. Iterated Local Search (ILS)
Input: String of Vectors from DE ( U i , j , G ) , Maximum Number of Iterations required (Tmax), Number of Positions of vector i (J), i = selected vector, G = current iteration, Z( U i , j , G ) = current solution
Output: Expected Profit
Begin
Set T = 1;
 While (TT max)
   Set j = 1;
     While (jJ)
l = j + 1;
      while (lL)
 perform the exchange method:
temp1 = U i , j , G ;
temp2 = U i , l , G ;
U i , j , G = temp2;
U i , l , G = temp1;
Calculate new solution (Z’( U i , j , G )) using decoding method
If (Z’( U i , j , G ) ≥ Z( U i , j , G ))
 update Z( U i , j , G )) = Z’( U i , j , G )
else
 set  U i , j , G = temp1;
U i , l , G = temp2;
        l = l + 1;
     end (while l)
      j = j + 1;
   end (while j)
perform the perturbation method.
  T = T + 1;
End Begin

Exchange Method

The exchange method is a simple exchange of values between positions in a vector. Table 5 shows an example of the exchange method.
In Table 5, it can be assumed that j = 4 and l = 10. The values in positions 4 and 10 are exchanged, after which the new values in positions 4 and 10 are 0.54 and 0.75, respectively.
After the exchange method, the decoding method is applied, and the solution is updated if the solution is improved.

The Perturbation Method

After the local search, the perturbation method is applied to allow the search to move from the local optimum. The perturbation method used in the proposed approach entails a three-variable move in two steps:
(1)
Randomly select three positions in a selected vector and set them as positions a–c.
(2)
Cyclically exchange the values in the positions as follows:
U i , a , G   = U i , c , G U i , b , G   = U i , a , G U i , c , G   = U i , b , G
Table 6 shows an example of the three-cyclic move.
From Table 6, positions 6, 3, and 11 are selected as a, b, and c, respectively. The values in positions 6, 3, and 11 after moving are 0.59, 0.01, and 0.69, respectively.
The ILS is iteratively executed as the local search of the DE until the stopping criterion is met. The stopping criterion in this research is that no new best solution is found within 50 iterations. Another local search method used in the present study is the ALNS.

3.4.2. Adaptive Large Neighborhood Search (ALNS)

ALNS is used as the local search procedure for DE. This method comprises four steps after obtaining the selected vector: (1) Perform the destroy method; (2) perform the repair method; (3) update all the required information; and (4) repeat steps (1)–(3) until the termination condition is met. The destroy and repair methods are used to generate a new candidate solution; the methods are applied to determine whether the new solution will survive or be removed from the procedure. The destroy and repair methods can be explained as follows.

The Destroy Method

With the destroy method, the completed solution becomes an incomplete solution. The repair method is later used to restore the completed solution. Four destroy methods were used in the present research: (1) d-random removal (d-RR); (2) d-highest value removal (d-HR); (3) d-lowest value removal (d-LR); and d-highest-lowest removal (d-HLR). These destroy methods are explained below.
-
d-random removal (d-RR): d-RR comprises two steps:
Step 1:
Randomly select the value of d, d 1 to D/2, where D is the number of positions in a vector.
Step 2:
Randomly select the d position from D positions, and name it list Ed.
-
d-Highest removal (d-HR): d-HR comprises two steps:
Step 1:
Randomly select the value of d, d 1 to D/2, where D is the number of positions in a vector.
Step 2:
Sort the values of all positions in the vector; the d highest values will be removed and added to the list Ed.
-
d-Lowest removal (d-LR): d-LR comprises two steps:
Step 1:
Randomly select the value of d, d 1 to D/2, where D is the number of positions in a vector.
Step 2:
Sort the values of all positions in the vector; the d lowest values will be removed and added to the list Ed.
-
d-highest-lowest removal (d-HLR): d-HLR comprises three steps:
Step 1:
Randomly select the value of d, d 1 to D/2, where D is the number of positions in a vector.
Step 2:
Sort the values of all positions in the vector. The first removal will be from position that has the highest value, the next removal will be from position that has the lowest value. The removal continues to alternate between positions that have the highest and the lowest values until the number of removals is equal to d. The positions in the vectors that are removed are then added to the list Ed.

The Repair Method

In this study, three repair methods were applied: (1) Random insertion (RI); (2) cyclic insertion (CI); and (3) reverse insertion (RVI).
-
Random insertion (RI) has the following steps:
Step 1:
Obtain list Ed from the destroy method.
Step 2:
Randomly select a pair of positions in list Ed and perform the exchange method.
Step 3:
Repeat step 2 d times.
Step 4:
Insert the value obtained from step 3 to the free position.
Step 5:
Perform the decoding method.
Step 6:
Update the required information.
-
Cyclic insertion (CI) has the following steps:
Step 1:
Obtain list Ed from the destroy method.
Step 2:
Insert the value in the position according to the order of Ed. For example, the second free position in the vector (after the destroy method) receives the value that is first in list Ed.
Step 3:
Perform the decoding method.
Step 4:
Update the required information.
-
Reverse insertion (RVI): The reverse insertion has the following steps:
Step 1:
Obtain list Ed from the destroy method.
Step 2:
Insert the value in the position according to the reverse order of Ed. For example, the second free position in the vector (after the destroy method) receives the value that is the third in list Ed.
Step 3:
Perform the decoding method.
Step 4:
Update the required information.

Acceptance of the New Generated Solution

In ALNS, a new solution (Z(S’)) that is worse than the current solution (Z(S)) can be accepted to perform the destroy and repair operation in the next iteration using Formula (8).
p = e Z ( S t ) Z ( S t ) B T
where Z ( S t ) is the new generated solution, and Z ( S t ) is the current solution. B and T are predefined parameters: B is set to 3, and T is the function of the current iteration number, which is calculated from Formula (9).
T = 100 C u r r e n t   i t e r a t i o n M a x i m u m   n u m b e r   o f   i t e r a t i o n s

The Destroy and Repair Methods Weight Updating

The destroy and repair methods were randomly selected using the probability function in Formula (10).
P d = W d t d = 1 D W d t
where P d is the probability of selecting destroy and repair methods d, and W d t is the weight of the destroy and repair methods d for iteration t.
The weight of each destroy and repair methods is updated using Formula (11).
W q t = W q t 1 + ρ q
The value of ρ q is in Table 7, where q is the destroy and repair methods.
The ALNS process is summarized in Algorithm 2.
Algorithm 2. Procedure of the Adaptive Large Neighborhood Search
Input: String of Vectors from DE (Ui,j,G), Maximum Number of Iterations required (Tmax), Number of Positions of vector i, i = selected vector, G = current iteration, Z(Ui,j,G) = current solution
Output: Expected Profit
Begins: Obtain the Vector String from DE ( U i , j , G )
While termination condition is not met.
Do Select and perform the destroy method
Select the repair method.
Update heuristics information.
End do
End.

3.5. Performing the Selection Process

The new target vector is obtained by using Formula (12).
X i , j , G + 1 = { U i , j , G   i f   f ( U i , j , G ) f ( X i , j , G ) X i , j , G   o t h e r w i s e
where f ( U m , n , G ) is the objective function of the trial vector;, and f ( X m , n , G )   is the objective function of the current target vector.
The process for combining the DE algorithm, the ALNS search, and the ILS is specified in Algorithm 3.
Algorithm 3. Procedure of the Improved Differential Evolution Algorithm
Input: Number of vectors (NP); Maximum Number of Iterations required (Tmax), Number of Positions of vector i, i = selected vector, G = current iteration, Z(Ui,j,G) = current solution
Output: Expected Profit
Begins: Randomly generate initial vector and solution X i , j , 1 and Z( X i , j , 1 )
While termination condition is not met (tTmax)
Do
       Perform the mutation process
       Perform the recombination process
         Set n = 1
         While (n ≤ NP)
            Randomly select local search heuristic (ALNS or ILS)
              with equal probability
            Perform the local search
            n = n + 1;
         end (while)
  Perform the selection process
Update heuristics information.
       t = t + 1;
End do
End while
End begin

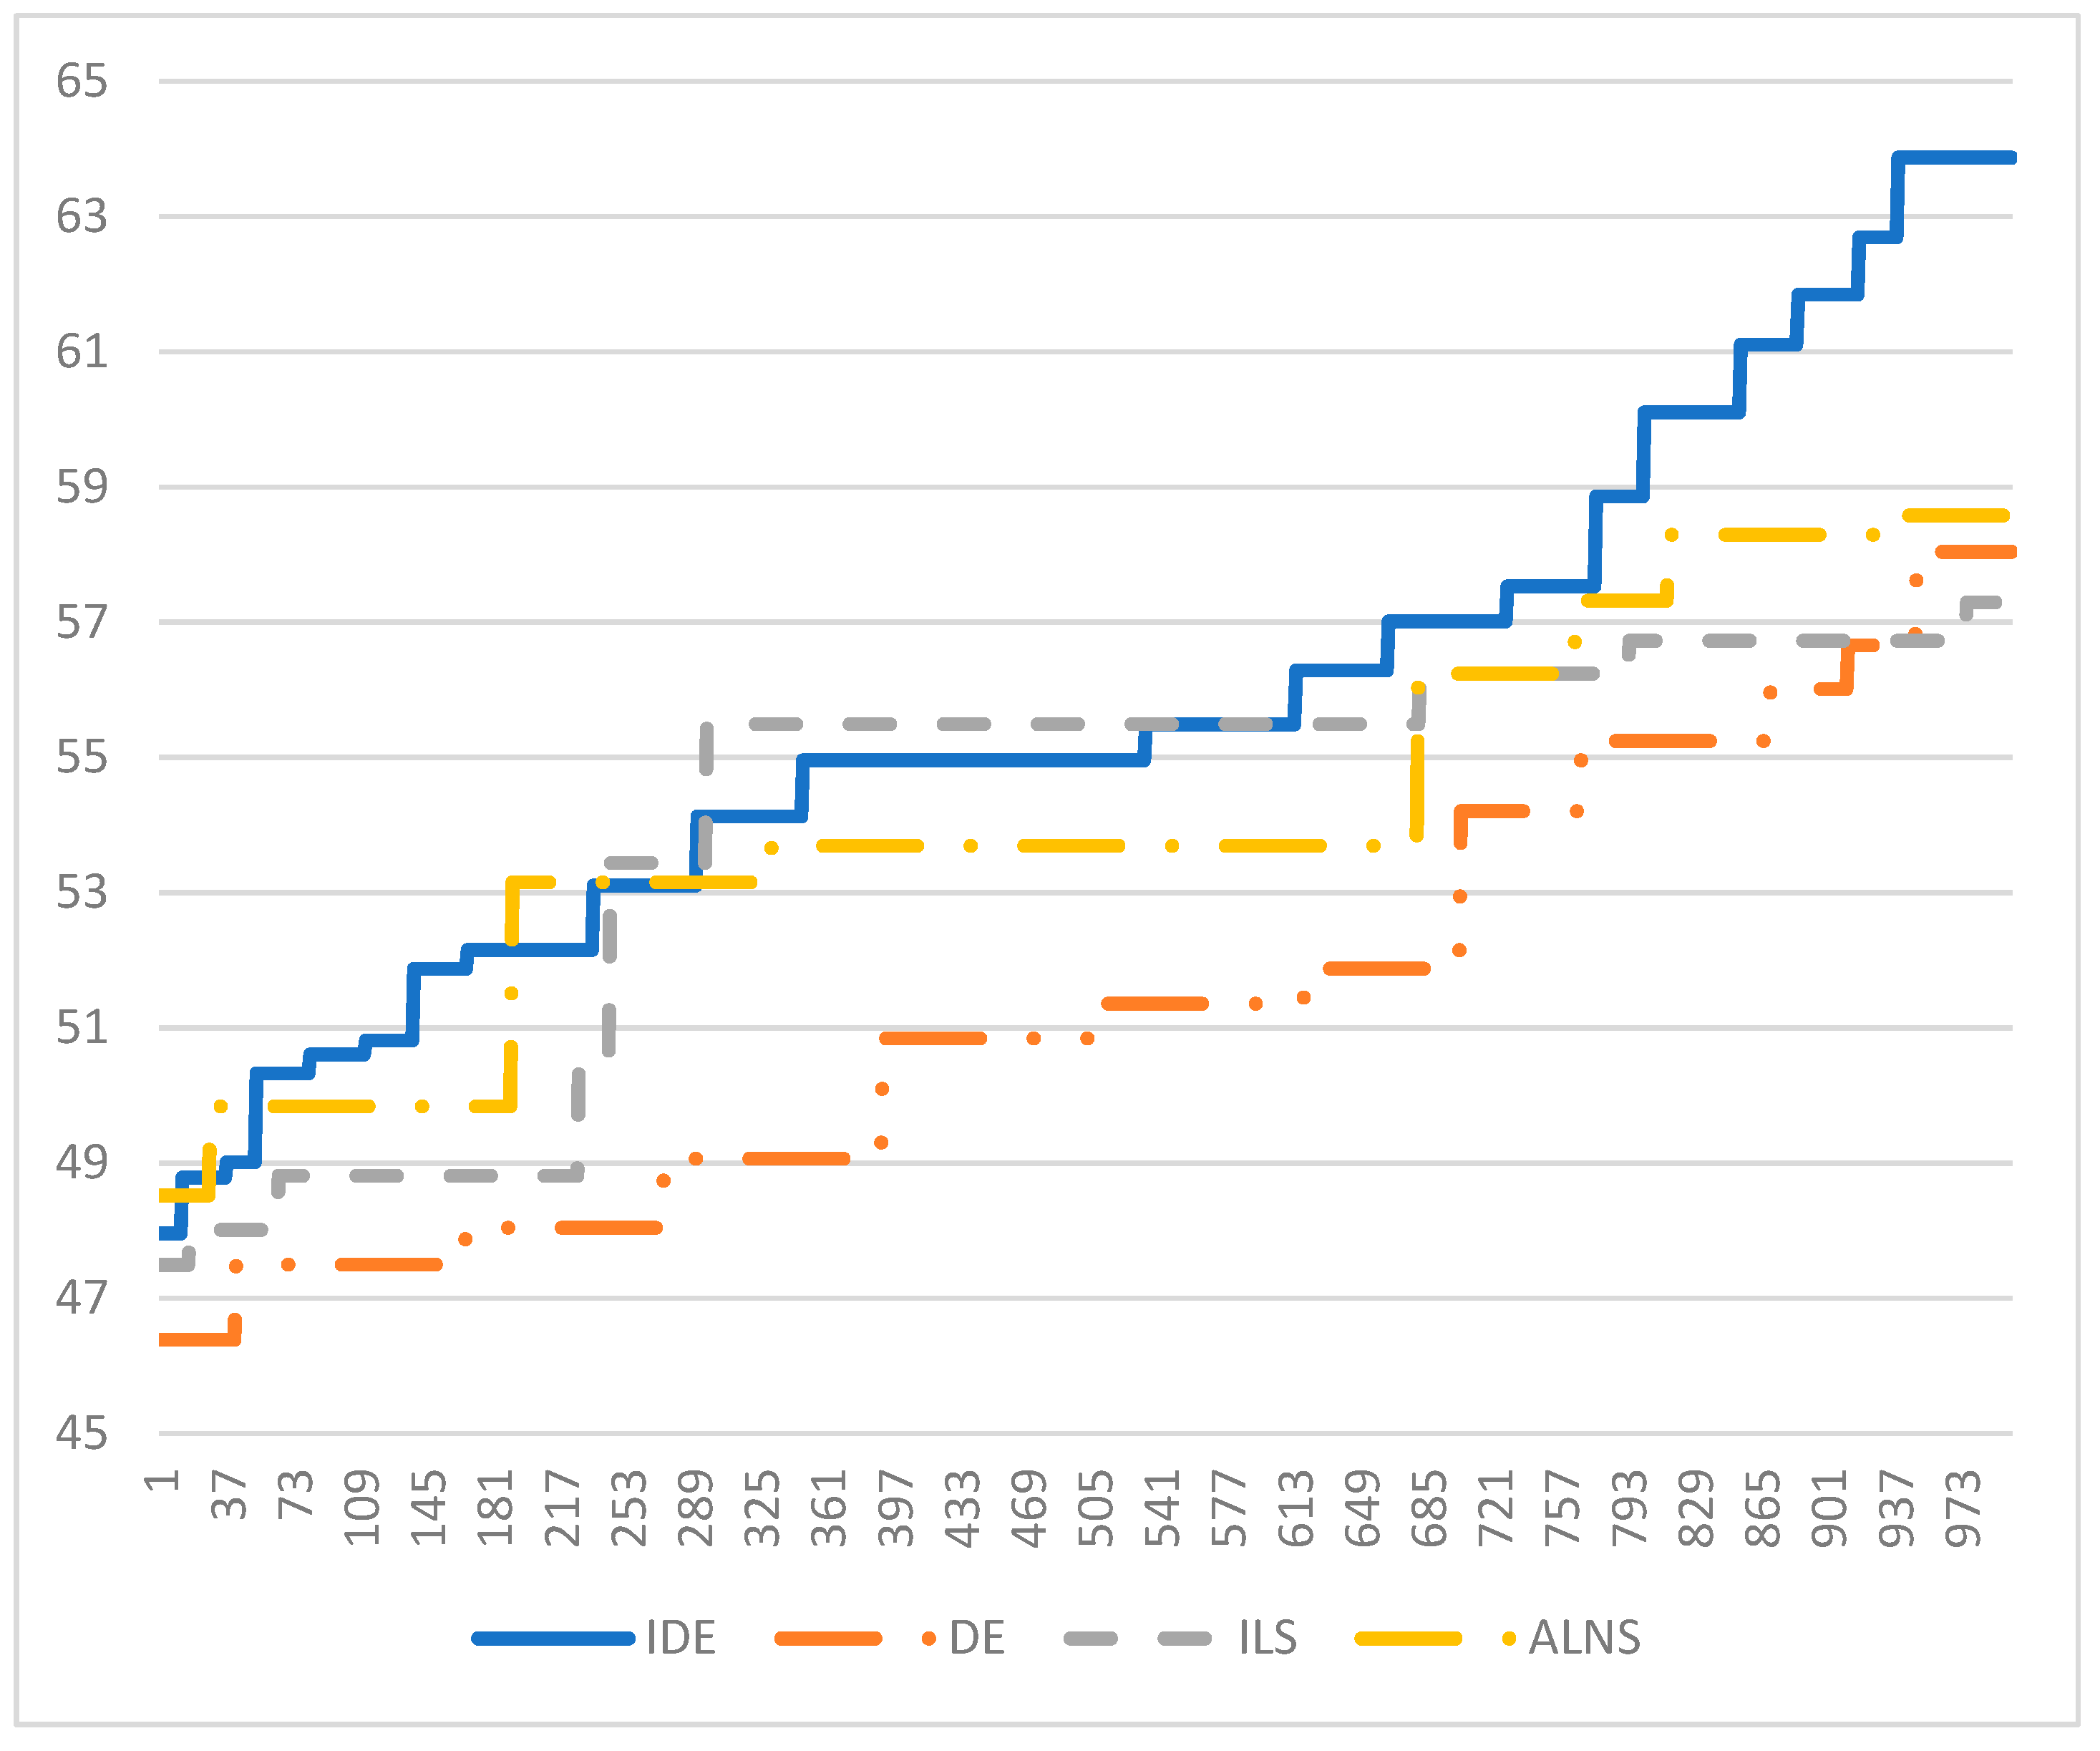
4. Computational Framework and Results

For the experiment described in this section, the proposed method was coded in C++ and tested on a PC (Intel® CoreTM i5-2467M CPU 1.6 GHz). The performance of the proposed method was compared with the optimal solution obtained using Lingo v.11. The algorithms were evaluated using two performance measures: (1) Limited computational time; and (2) limited maximum number of iterations of the simulation according to the aims of the present study. From the preliminary test, we set the number of the population equal to the number of available products, while F and CR were set to 0.8 and 0.6, respectively.
Fifteen test instances were randomly generated, including the case study, which comprises 204 products and 27 advertising methods. Details on the randomly generated data and the case study are shown in Table 8.
In Table 8, the test instances are divided into three groups according to the test instance size: (1) Small, (2) medium, and (3) large. The size of the test instance depends on the number of products and advertising methods that form the test instances.
The test instances have been randomly generated based on the case study values. Minimum and maximum value of parameters are given in Table 9.
The researchers propose using an improved differential evolution algorithm (IDE). The IDE was compared with the optimal solution/upper bound obtained from the optimization software Lingo v.11 and the original versions of the components of the proposed IDE method, namely, the DE, the ILS, and the ALNS. These methods were coded in C++ and simulated using the same PC as that used for the IDE.
The first simulation was run using the proposed methods with small-sized test instances. The optimal solution was obtained from Lingo v.11. The maximum number of iterations was fixed to 1000. For each proposed method, five simulations were executed, and the maximum profit and the required computational time are shown in Table 10.
Statistical testing was used to determine whether each method performed differently from the other methods. The Wilcoxon signed-rank test was used, and the results are shown in Table 11.
From the results reported in Table 11, the researchers found that the performance of the proposed heuristics was not different from the performance of Lingo v.11, except for ILS, which had a significantly different solution compared with the solution from Lingo v.11. The remaining methods generated solutions that were not different from the optimal solution. Comparing the percentage differences between the proposed methods and Lingo v.11 using Equation (13) reveals that the results of IDE, DE, ILS, and ALNS were 0.01%, 0.86%, 0.37%, and 0.28%, respectively, different from the solution derived from Lingo v.11, and they used 69.25%, 78.51%, 72.96%, and 72.69%, respectively, of the computational time that was used by Lingo v.11. This means that the proposed method was able to find the same solution while using significantly less computational time.
%   d i f f   =   S o l u t i o n   g e n e r a t e d   b y   L i n g o   v .11 S o l u t i o n   g e n e r a t e d   b y   t h e   p r o p o s e d   m e t h o d × 100 %
where %   d i f f is the percentage by which the proposed method differed from the solution obtained from Lingo v.11.
The next experiment was executed using medium- and large-sized test instances. The stopping criteria for the proposed method was the computational time used for each method. On the basis of the results of a preliminary run, the computational times for the medium- and large-sized test instances were set to 20 and 45 min, respectively, since these were the convergence times for the two test instance sizes. The computation times for Lingo v.11 were set to 48 and 72 h, for the medium and large test instance sizes, respectively. The computational results are shown in Table 12.
The statistical results of the Wilcoxon signed-rank test are shown in Table 13.
The results reported in Table 12 and Table 13 show that all the proposed methods generated significantly different solutions compared with the solution generated by Lingo v.11 (upper bound). IDE generated a solution that was 3.75% worse than the upper bound generated by Lingo v.11, and its computational time was lower than that of Lingo v.11 by 98.95%. DE, ILS, and ALNS had profits that were respectively 7.93%, 8.35%, and 7.63% lower than the profits generated by Lingo v.11.
All the computational results reveal that IDE was an improvement compared with all the original methods. Graph of the best objective found during the simulation run using 1000 iterations as the stopping criterion is plotted in Figure 3 to show the behavior of all methods.
Figure 3 shows that ALNS achieved the best solution among all the methods in the starting period of the first iteration. The solutions generated by ALNS continuously improved during the simulation; nonetheless, it ended as the second-best method, with IDE representing the best method. This means that ALNS performed an outstanding intensive search, since it was able to find best solutions at the beginning of the simulation, but the exploration may be worse compared with the other methods. The potentially poorer exploration of ALNS resulted in its performance being slightly worse than the performance of IDE at the end of the simulation. In the beginning, DE started with the worst solution, but later on through the process, its solution frequently changed, meaning that it was not good for intensive searches, but good for diverse searches. Additionally, ILS was good for intensive searches, but the change in the new solution was less than the change in the new solution with DE, meaning that the ILS method had poorer exploration compared with the other methods. IDE combines DE, ILS, and ALNS; thus, the advantages of all the methods were incorporated into the IDE search. As a result, IDE was among the best heuristics compared with the other heuristics used in the present study.

5. Conclusions and Outlooks

This study aimed to develop a solution approach to solve the AdSP. Each advertising method generates different responses when applied to different products. They can vary in customer reach and lead to an increase or decrease in product sales volumes. They also consume different amounts of resources when applied to different products. This makes the AdSP hard to resolve using optimization software; this challenge led to the development of metaheuristics to ensure that the problem is solved in a reasonably short time. The DE was modified for use with other metaheuristics, such as the local search, to enhance the efficiency of the original DE and find better solutions. The ILS and the ALNS were added to DE, resulting in the proposed method—the improved IDE—for solving the AdSP.
The computational results show that IDE was able to effectively resolve the AdSP. For small-sized test instances, IDE generated the same solution as the optimization software while using 69.25% less computational time. For medium- and large-sized test instances, IDE found solutions that were only 3.75% different from the upper-bound solution generated by Lingo v.11 while using 98.95% less computational time (however, this does not guarantee that the solution is feasible). IDE combines the original DE with two other metaheuristics (ILS and ALNS). The computational results show that this combination outperformed the original version of all the methods. Therefore, IDE effectively uses the best parts of each method to enhance the search capacity in the new proposed method.

Author Contributions

M.T. designed the algorithm and programming. T.S. performed the experiment and collected the data to obtain the results and draw conclusions.

Funding

We would like to express our greatest thanks to Mahasarakham University for their funding of this project.

Conflicts of Interest

The authors declare no conflicts of interest.

References

  1. Manik, P.; Gupta, A.; Jha, P.C. A Goal Programming Model for Advertisement Selection on Online News Media. Adv. Intell. Syst. Comput. 2014, 236, 1401–1419. [Google Scholar]
  2. Drèze, X.; Zufryden, F. Testing web site design and promotional content. J. Advert. Res. 1997, 37, 77–91. [Google Scholar]
  3. Thornton, L.; Batterham, P.J.; Fassnacht, D.B.; Kay-Lambkin, F.; Calear, A.L.; Hunt, S. Recruiting for health, medical or psychosocial research using Facebook: Systematic review. Internet Interv. 2016, 4, 72–81. [Google Scholar] [CrossRef] [PubMed] [Green Version]
  4. Lane, T.S.; Armin, J.; Gordon, J.S. Online recruitment methods for web-based and mobile health studies: A review of the literature. J. Med. Internet Res. 2015, 17, e183. [Google Scholar] [CrossRef] [PubMed]
  5. Batterham, P.J. Recruitment of mental health survey participants using Internet advertising: Content, characteristics and cost effectiveness. Int. J. Methods Psychiatr. Res. 2014, 23, 184–191. [Google Scholar] [CrossRef] [PubMed]
  6. Nelson, E.J.; Hughes, J.; Oakes, J.M.; Pankow, J.S.; Kulasingam, S.L. Estimation of geographic variation in human Papillomavirus vaccine uptake in men and women: An online survey using Facebook recruitment. J. Med. Internet Res. 2014, 16, e198. [Google Scholar] [CrossRef] [PubMed]
  7. Fenner, Y.; Garland, S.M.; Moore, E.E.; Jayasinghe, Y.; Fletcher, A.; Tabrizi, S.N.; Gunasekaran, B.; Wark, J.D. Web-based recruiting for health research using a social networking site: An exploratory study. J. Med. Internet Res. 2012, 14, e20. [Google Scholar] [CrossRef] [PubMed]
  8. Ramo, D.E.; Prochaska, J.J. Broad reach and targeted recruitment using Facebook for an online survey of young adult substance use. J. Med. Internet Res. 2012, 14, e28. [Google Scholar] [CrossRef]
  9. Ramo, D.E.; Rodriguez, T.M.S.; Chavez, K.; Sommer, M.J.; Prochaska, J.J. Facebook recruitment of young adult smokers for a cessation trial: Methods, metrics, and lessons learned. Internet Interv. 2014, 1, 58–64. [Google Scholar] [CrossRef] [Green Version]
  10. Toncar, M.; Munch, J. Consumer Responses to Tropes in Print Advertising. J. Advert. 2001, 30, 55–65. [Google Scholar] [CrossRef]
  11. Mehta, A. Advertising attitudes and advertising effectives. J. Advert. Res. 2000, 40, 67–72. [Google Scholar] [CrossRef]
  12. Latour, M.S.; Henthorne, T.L. Ethical Judgments of Sexual Appeals in Print Advertising. J. Advert. 1994, 23, 81–90. [Google Scholar] [CrossRef]
  13. Kassarjian, H.H. Content Analysis in Consumer Research. J. Consum. Res. 1977, 4, 8–18. [Google Scholar] [CrossRef]
  14. Moschis, G.P.; Moore, R.L. A Longitudinal Study of Television Advertising Effects. J. Consum. Res. 1982, 9, 279–286. [Google Scholar] [CrossRef]
  15. Chéron, E.; Perrien, J. An experimental study of the effects of commercial tv advertising and pro-consumer product test results on tv. In NA—Advances in Consumer Research; Kent, B., Monroe, A.A., Eds.; Association for Consumer Research: Ann Harbor, MI, USA, 1981; Volume 8, pp. 423–427. [Google Scholar]
  16. Holland, J.H. Adaptation in Natural and Artificial Systems, 1st ed.; Cambridge University Press: London, UK, 1992. [Google Scholar]
  17. Kampelis, N.; Sifakis, N.; Kolokotsa, D.; Gobakis, K.; Kalaitzakis, K.; Isidori, D.; Cristalli, C. HVAC Optimization Genetic Algorithm for Industrial Near-Zero-Energy Building Demand Response. Energies 2019, 12, 2177. [Google Scholar] [CrossRef]
  18. Lara-Ramirez, J.E.; Garcia-Capulin, C.H.; Estudillo-Ayala, M.J.; Avina-Cervantes, J.G.; Sanchez-Yanez, R.E.; Rostro-Gonzalez, H. Parallel Hierarchical Genetic Algorithm for Scattered Data Fitting through B-Splines. Appl. Sci. 2019, 9, 2336. [Google Scholar] [CrossRef]
  19. Zhang, Z.; Li, Z.; Qiao, X.; Wang, W. An Efficient Memetic Algorithm for the Minimum Load Coloring Problem. Mathematics 2019, 7, 475. [Google Scholar] [CrossRef]
  20. Cheng, Y.H.; Lai, C.M. Control Strategy Optimization for Parallel Hybrid Electric Vehicles Using a Memetic Algorithm. Energies 2017, 10, 305. [Google Scholar] [CrossRef]
  21. Ebadinezhad, S.; Dereboylu, Z.; Ever, E. Clustering-Based Modified Ant Colony Optimizer for Internet of Vehicles (CACOIOV). Sustainability 2019, 11, 2624. [Google Scholar] [CrossRef]
  22. Jiang, H.; Xu, W.; Chen, Q. Monitoring of Cell Concentration during Saccharomyces cerevisiae Culture by a Color Sensor: Optimization of Feature Sensor Using ACO. Sensors 2019, 19, 2021. [Google Scholar] [CrossRef]
  23. Gao, J.; Zhu, X.; Liu, A.; Meng, Q.; Zhang, R. An Iterated Hybrid Local Search Algorithm for Pick-and-Place Sequence Optimization. Symmetry 2018, 10, 633. [Google Scholar] [CrossRef]
  24. Hu, S.; Liu, H.; Wu, X.; Li, R.; Zhou, J.; Wang, J. A Hybrid Framework Combining Genetic Algorithm with Iterated Local Search for the Dominating Tree Problem. Mathematics 2019, 7, 359. [Google Scholar] [CrossRef]
  25. Liu, L.; Du, C.; Zhang, X.; Li, J.; Shi, S. Adaptive Synchronization Strategy between Two Autonomous Dissipative Chaotic Systems Using Fractional-Order Mittag–Leffler Stability. Entropy 2019, 21, 383. [Google Scholar] [CrossRef]
  26. Praseeratasang, N.; Pitakaso, R.; Sethanan, K.; Kaewman, S.; Golinska-Dawson, P. Adaptive Large Neighborhood Search for a Production Planning Problem Arising in Pig Farming. J. Open Innov. Technol. Mark. Complex. 2019, 5, 26. [Google Scholar] [CrossRef]
  27. Theeraviriya, C.; Pitakaso, R.; Sillapasa, K.; Kaewman, S. Location Decision Making and Transportation Route Planning Considering Fuel Consumption. J. Open Innov. Technol. Mark. Complex. 2019, 5, 27. [Google Scholar] [CrossRef]
  28. Kennedy, J. Swarm intelligence. In Handbook of Nature-Inspired and Innovative Computing: Integrating Classical Models with Emerging Technologies; Zomaya, A.Y., Ed.; Springer US: Boston, MA, USA, 2006; pp. 187–219. [Google Scholar]
  29. Xu, X.; Ren, W. Application of a Hybrid Model Based on Echo State Network and Improved Particle Swarm Optimization in PM 2.5 Concentration Forecasting: A Case Study of Beijing, China. Sustainability 2019, 11, 3096. [Google Scholar] [CrossRef]
  30. Zhang, H.J.; Feng, Y.B.; Lin, K.P. Application of Multi-Species Differential Evolution Algorithm in Sustainable Microgrid Model. Sustainability 2018, 10, 2694. [Google Scholar] [CrossRef]
  31. Dechampai, D.; Tanwanichkul, L.; Sethanan, K.; Pitakaso, R. A differential evolution algorithm for the capacitated VRP with flexibility of mixing pickup and delivery services and the maximum duration of a route in poultry industry. J. Intell. Manuf. 2015, 28. [Google Scholar] [CrossRef]
  32. Storn, R.; Price, K. Differential Evolution—A Simple and Efficient Heuristic for global Optimization over Continuous Spaces. J. Glob. Optim. 1997, 11, 341–359. [Google Scholar] [CrossRef]
  33. Akararungruangkul, R.; Chokanat, P.; Pitakaso, R.; Supakdee, K.; Sethanan, K. Solving Vehicle Routing Problem for Maintaining and Repairing Medical Equipment Using Differential Evolution Algorithm: A Case Study in Ubon Ratchathani Public Health Office. Int. J. Appl. Eng. Res. 2018, 13, 8035–8045. [Google Scholar]
  34. Sethanan, K.; Pitakaso, R. Differential Evolution Algorithms for Scheduling Raw Milk Transportation. Comput. Electron. Agric. 2016, 121, 245–259. [Google Scholar] [CrossRef]
  35. Srivarapongse, T.; Pijitbanjong, P. Solving a Special Case of the Generalized Assignment Problem Using the Modified Differential Evolution Algorithms: A Case Study in Sugarcane Harvesting. J. Open Innov. Technol. Mark. Complex. 2019, 5, 5. [Google Scholar] [CrossRef]
  36. Sethanan, K.; Pitakaso, R. Improved Differential Evolution Algorithms for solving Generalized Assignment Problem. Expert Syst. Appl. 2016, 45, 450–459. [Google Scholar] [CrossRef]
  37. Pitakaso, R. Differential Evolution algorithm for Simple Assembly Line Balancing. J. Ind. Prod. Eng. 2015, 32, 104–114. [Google Scholar]
  38. Pitakaso, R.; Sethanan, K. Modified Differential Evolution algorithm for Simple Assembly Line Balancing with limit on number of machines types. Eng. Optim. 2015, 48, 1–19. [Google Scholar] [CrossRef]
  39. Chomchalao, C.; Kaewman, S.; Pitakaso, R.; Sethanan, K. An Algorithm to Manage Transportation Logistics That Considers Sabotage Risk. Adm. Sci. 2018, 8, 39. [Google Scholar] [CrossRef]
  40. Thongdee, T.; Pitakaso, R. Differential Evolution Algorithms Solving a Multi-Objective, Source and Stage Location-Allocation Problem. Ind. Eng. Manag. Syst. 2015, 14, 11–21. [Google Scholar] [CrossRef] [Green Version]
  41. Ketsripongsa, U.; Pitakaso, R.; Sethanan, K.; Srivarapongse, T. An Improved Differential Evolution Algorithm for Crop Planning in the Northeastern Region of Thailand. Math. Comput. Appl. 2018, 23, 40. [Google Scholar] [CrossRef]
  42. Pijitbanjong, P.; Akararungruangkul, R.; Pitakaso, R.; Sethanan, K. Improved Differential Evolution Algorithms for Solving Multi-stage Crop Planning Model in Southern Region of Thailand. Songklanakarin J. Sci. Technol. 2018, in press. [Google Scholar]
  43. Xin, B.; Chen, J.; Zhang, J.; Fang, H.; Peng, Z. Hybridizing Differential Evolution and Particle Swarm Optimization to Design Powerful Optimizers: A Review and Taxonomy. IEEE Trans. Syst. Man Cybern. C 2012, 42, 744–767. [Google Scholar] [CrossRef]
  44. Epitropakis, M.G.; Tasoulis, D.K.; Pavlidis, N.G.; Plagianakos, V.P.; Vrahatis, M.N. Enhancing Differential Evolution Utilizing Proximity-Based Mutation Operators. IEEE Trans Evol. Comput. 2011, 15, 99–119. [Google Scholar] [CrossRef]
  45. Miranda, V.; Alves, R. Differential Evolutionary Particle Swarm Optimization (DEEPSO): A successful hybrid. In Proceedings of the BRICS Congress on Computational Intelligence and 11th Brazilian Congress on Computational Intelligence, Recife, Brazil, 8–11 September 2013; pp. 368–374. [Google Scholar]
  46. Elsayed, S.M.; Sarker, R.A.; Essam, D.L. GA with a new multi-parent crossover for solving IEEE-CEC2011 competition problems. In Proceedings of the 2011 IEEE Congress of Evolutionary Computation (CEC), New Orleans, LA, USA, 5–8 June 2011; pp. 1034–1040. [Google Scholar]
  47. Trivedi, A.; Srinivasan, D.; Biswas, S.; Reindl, T. Hybridizing genetic algorithm with differential evolution for solving the unit commitment scheduling problem. Swarm Evol. Comput. 2015, 23, 50–64. [Google Scholar] [CrossRef]
  48. Olenšek, J.; Tuma, T.; Puhan, J.; Bűrmen, Á. A new asynchronous parallel global optimization method based on simulated annealing and differential evolution. Appl. Soft Comput. 2011, 11, 1481–1489. [Google Scholar] [CrossRef]
  49. Reynoso-Meza, G.; Sanchis, J.; Blasco, X.; Herrero, J.M. Hybrid DE algorithm with adaptive crossover operator for solving real-world numerical optimization problems. In Proceedings of the 2011 IEEE Congress of Evolutionary Computation (CEC), New Orleans, LA, USA, 5–8 June 2011; pp. 1551–1556. [Google Scholar]
  50. Jia, D.; Zheng, G.; Khurram Khan, M. An effective memetic differential evolution algorithm based on chaotic local search. Inf. Sci. 2011, 181, 3175–3187. [Google Scholar] [CrossRef]
  51. Neri, F.; Iacca, G.; Mininno, E. Disturbed Exploitation compact Differential Evolution for limited memory optimization problems. Inf. Sci. 2011, 181, 2469–2487. [Google Scholar] [CrossRef]
  52. Zhan, Z.-H.; Zhang, J. Enhance differential evolution with random walk. In Proceedings of the 14th annual conference companion on Genetic and evolutionary computation, Philadelphia, PA, USA, 7–11 July 2012; pp. 1513–1514. [Google Scholar]
  53. Das, S.; Mullick, S.S.; Suganthan, P.N. Recent advances in differential evolution—An updated survey. Swarm Evol. Comput. 2016, 27, 1–30. [Google Scholar] [CrossRef]
Figure 1. Unsolved problem.
Joitmc 05 00061 g001
Figure 2. Solved Problem.
Joitmc 05 00061 g002
Figure 3. Best objective plot for all methods.
Joitmc 05 00061 g003
Table 1. The vectors that represent the solution.
NPProduct Vectors
123456789101112
10.100.060.690.750.880.010.540.470.560.540.590.66
20.360.630.830.620.110.980.720.190.000.450.580.73
30.060.960.900.950.850.820.370.490.800.120.240.44
40.860.960.170.660.580.500.950.840.060.010.410.08
50.250.010.640.610.380.610.570.120.060.590.360.39
Table 2. Vectors representing the advertising methods.
NPAdvertising Method Vectors
1234567
10.100.370.940.960.820.240.22
20.580.540.120.980.450.440.89
30.610.540.010.910.900.600.92
40.100.660.020.130.960.920.43
50.910.730.050.740.220.980.84
Table 3. Product vectors before and after sorting.
Product Vectors
Before Sorting
123456789101112
0.100.060.690.750.880.010.540.470.560.540.590.66
After Sorting
621871091112345
0.010.060.10.470.540.540.560.590.660.690.750.88
Table 4. Advertising method vectors before and after sorting.
Advertising Method Vectors
Before Sorting
1234567
0.100.370.940.960.820.240.22
After Sorting
1762534
0.10.220.240.370.820.940.96
Table 5. Exchange method results.
Product Vectors
Before Exchange
123456789101112
0.100.060.690.750.880.010.540.470.560.540.590.66
After Exchange
123456789101112
0.100.060.690.540.880.010.540.470.560.750.590.66
Table 6. Three-cyclic move results.
Product Vectors
Before Three-Cyclic Move
123(b)456(a)7891011(c)12
0.100.060.690.750.880.010.540.470.560.540.590.66
After Three-Cyclic Move
123456789101112
0.100.060.010.540.880.590.540.470.560.750.690.66
Table 7. The value of ρ q is used to update the destroy and repair weight.
ρ q 5When the destroy and repair methods q can find the new best solution
ρ q 4When the destroy and repair methods q can find Z(S’) better than Z(S)
ρ q 3When the destroy and repair methods q can find Z(S’) but not better than Z(S), yet the solution is accepted by using the formula in Section (8)
ρ q 1When the destroy and repair methods q generates Z(S’) but it is not better than Z(S)
Table 8. Test instance details.
InstancesProductad.MethodInstancesProductad.MethodInstancesProductad.Method
s-1135m-14515l-113022
s-2155m-24514l-214023
s-3157m-34515l-314025
s-4177m-45514l-415020
s-5188m-55516l-515524
s-6198m-65518l-615528
s-7199m-76218l-716520
s-8209m-86218l-816924
s-9209m-96220l-918025
s-102010m-106220Case study2047
Table 9. Test instances detail.
ParametersMinimum Value Maximum Value
Price of product i per unit (Pi)50 Baht1000 Baht
Total cost of producing product (Oi)20 Baht250 Baht (cost at least 40% less than selling price)
Advertisement cost of product i using advertisement j (Cij)5000 Baht35,000 Baht
Minimum sales volume of product i (Vi)200 Units5000 Units
Maximum available time for advertisement j (Tij)150 min3000 min
Maximum budget of the company for the advertisement (N)500,000 Baht5,000,000 Baht
Table 10. Computational results for small-sized test instances (S group).
Test Instance s-1s-2s-3s-4s-5s-6s-7s-8s-9s-10
Lingo v.11Profit (baht)1,998,7612,119,8942,487,5392,981,7633,129,6383,484,6533,218,9423,441,5883,515,6864,117,642
Com.time (min)1.812.242.453.8710.4711.8515.9220.4324.8136.94
IDEProfit (baht)1,998,7612,119,8942,487,5392,981,7633,129,6383,484,6533,218,9423,441,5883,515,6864,114,715
Com.time (min)0.781.051.591.862.912.872.643.093.133.06
DEProfit (baht)1,998,7612,119,8942,487,5392,981,7633,008,9453,484,6533,138,8963,438,9413,488,4584,057,867
Com.time (min)0.550.981.040.911.781.651.872.712.762.85
ILSProfit (baht)1,998,7612,114,8912,487,5392,981,7633,104,5353,434,5563,218,9423,440,8713,487,8454,098,814
Com.time (min)0.670.871.891.541.981.672.042.982.612.48
ALNSProfit (baht)1,998,7612,119,8942,476,9472,981,7633,129,6383,435,4173,189,7673,438,8913,515,6864,117,642
Com.time (min)0.870.681.781.871.761.881.562.672.602.85
Table 11. p-value of Wilcoxon signed-rank test for the results obtained in Table 10.
IDEDEILSALNS
Lingo v.110.3430.0630.0440.119
IDE 0.0640.0470.134
DE 0.5230.216
ILS 0.523
Table 12. Computational results of the medium- and large-sized test instances.
Test InstanceLingo Upper Bound (Million Baht)IDE (Million Baht)DE (Million Baht)ILS (Million Baht)ALNS (Million Baht)
m-113.9413.1512.4612.3112.39
m-214.7514.5213.8713.3713.85
m-313.6712.6511.9311.5712.01
m-416.3815.8914.9315.0114.78
m-515.9815.1714.3114.6814.75
m-616.2315.3314.7514.8114.56
m-717.8116.1215.4715.8315.55
m-817.6417.2716.5116.4816.73
m-918.0716.8316.0915.9315.28
m-1017.8916.3814.8115.0715.41
l-132.4532.2930.5730.1730.84
l-233.4133.1731.6931.8731.15
l-334.7632.9831.7431.1732.76
l-447.8545.8744.4844.5944.64
l-546.8946.3145.2145.2745.75
l-647.4746.9445.1845.3145.24
l-746.8946.1145.8445.3845.76
l-849.3848.3547.9647.0248.37
l-952.7351.5449.8950.1850.38
Case study63.7663.1458.9157.1558.56
Table 13. p-value of Wilcoxon signed-rank test for the results obtained in Table 12.
IDEDEILSALNS
Lingo v.110.000080.000080.000080.00008
IDE 0.000080.000080.00008
DE 0.289410.22628
ILS 0.07346

