Article

Service Open Innovation; Design Elements for the Food and Beverage Service Business

1
Research and Development, Beesket Global, Seoul 07976, Korea
2
Seoul Business School, School of Science and Technologies (aSSIST), Seoul 03767, Korea
3
Department of Fashion and Textile, University of Huddersfield, Huddersfield HD1 3DH, UK
*
Author to whom correspondence should be addressed.
J. Open Innov. Technol. Mark. Complex. 2018, 4(4), 53; https://doi.org/10.3390/joitmc4040053
Submission received: 29 August 2018 / Revised: 28 October 2018 / Accepted: 30 October 2018 / Published: 1 November 2018

Abstract

:
Despite the well-recognised contribution of design to business, practitioners still find it challenging to manage design assets. Given that one cannot manage a business without measuring these assets, researchers and practitioners deem that the lack of a practical measuring tool for design is the cause of this unfavorable situation. Hence, establishing relevant criteria for measuring design effectiveness is essential for developing the tools. However, criteria must anticipate key business outcomes in order to demonstrate effectiveness, and to propose actionable items. Whether the outcome is sales figures or customer satisfaction survey results, the criteria should clearly link with business goals. Also, the technologies in the Fourth Industrial Revolution facilitate the quantification of customer behaviour related to business performance, such as lingering time on the website for shopping. In this context, statistical understanding of design elements is critical for determining appropriate strategies in the era of digitalised data. By utilising a Service Blueprint, this study also proposes a novel approach to tackle current challenges regarding the open innovation process. Since appropriately-developed design elements are the prerequisite of successful measurement, this study extracts the elements through in-depth interviews, and examines them quantitatively with existing business theory. As a result, design elements for the food and beverage service business are confirmed by using the Structural Equation Modeling.

1. Introduction

Today, creativity invigorates the manufacturing, service, retail, and entertainment industries beyond the deficient development of information and software [1]. Businesses implement creative techniques for improving service delivery, but how a specific element of service design impacts on the end-user is still under the development process [2,3,4]. Having considered the intangible nature of service businesses, the significance of developing a measuring tool for the service industry is unquestionable [5].
Service consists of visual elements at a place where the interaction of stakeholders occurs [2,6]. The interactions converge on a holistic evaluation of the experience, which is interpreted as the design value. In order to provide innovative services for customers, it is essential to understand how design contributes to enhancing the interaction between stakeholders [7,8]. Open innovation facilitates the innovative development of services by understanding the complex internal and external network of a business [9,10]. In other words, it is critical to view the service business with the Open innovation process for the superior value of the brand [8].
Contemporary consumption involves many different considerations besides the traditional trade-off concept of value. Customers’ evaluations of offerings is the result of a holistic experience with emotional interactions [11,12]. It is necessary to clarify the elements of the service design provision and identify the touch-points where design can contribute significantly. As design adds value to a business by enhancing the competitive advantage of the firm [13], how design adds value in service delivery can be useful for understanding the contributions of design [14].
In this context, design elements in the service business can be one of the pivots upon the interaction with stakeholders for creating unique service value [15,16]. Knowing design elements and their effective management are also essential for customer loyalty [13]. More specifically, it is necessary to identify the customer journey with individual touch-points in order to deliver effective services from the customer perspective [17]. However, it is not adequately addressed in the current literature how the touch-points are related to business outcomes [18] and what the determinants of effective service innovation are [19]. Thus, it is critical to understand design elements for service and their relationship with business outcomes. To understand how the interaction is affected by design elements of a service firm, this research will empirically examine the design elements in the service delivery process, and investigate how design elements enhance customer loyalty in the food and beverage service industry.

2. Materials and Methods

2.1. Design Value in Service Business

The role of design in contemporary management does not pertain to the simple aesthetic meanings of an offering. Design emotionally and functionally interacts with the customer and adds value to products and services [13]. Also, the broad range of products and services triggers a new way of perceiving design in the contemporary market [12]. Design in contemporary management contributes to enhancing the functionality of products, pleasurable experience, and self-fulfilment of consuming offerings [17,20]. These contributions are fundamental to the holistic concept of customer value [21]. Thus, design in corporate management has the goal of aiming for greater customer value [22].
Recently, much effort has been made to address the practical outcomes of design, such as the ongoing project in the Design Management Institute (DMI) called “Design Value Index”. According to the DMI report 2015, the return on investment for design-centric companies is two times larger than those for S&P 500 companies [23]. It can be interpreted that the profitability of a firm in contemporary business is derived from its design competency. However, design value has several dimensions besides economic value. Table 1 explains design value in the business processes and performance. As Krippendorff proposes [24], design is making sense of things. Design activities support the strategic and sustainable development of a business [25,26]. It is also useful for this study to provide clarity to the definition of design in contemporary businesses as applied to this study; please see Table 1.
In particular, design value connects with emotional perception. Recently, customer value in the market has been explored by multi-dimensional approaches sought for multiple relevant items of determining customer perceived value (see Table 2). Extending on from Table 2, it can be added that the dimensions are interactive [29], and include holistic aspects of consumption such as the prepurchase experience [30]. Contemporary consumption involves many different considerations besides the traditional trade-off concept of value [23,31]. Furthermore, service characteristics of businesses have become essential for marketing due to their interactive nature [32] and novel contributions to branding and systemic design [33,34].
Nam and Carnie argued that customer-perceived design value can be classified into four discrete dimensions, as Holbrook’s original typology indicates [38]; Self-oriented—Extrinsic, Self-oriented—Intrinsic, Other-oriented—Extrinsic and Other-oriented—Intrinsic. Service consists of physical and systemic elements of communication and interaction [5,6]. From the service perspective, the consumption event between customers and a service provider is a service-based exchange [27]. In this context, what remains in a customer’s mind is arguably the aggregated experience of emotional interactions with the service provider [27]. As design adds value to a business by enhancing the competitive advantage of a firm [13], knowledge of the means by which design adds value to service delivery can be useful for understanding the contributions of design. Therefore, it is necessary to classify the design’s emotional contributions to customers regarding the value-adding role in the service industry [27,38].

2.2. Design Value Type and Approaches

Given that design emotionally interacts with customers [27], the added value through design activities should pertain to emotional responses from customers. From the value perspective, the single dimensional approach of value is problematic for encompassing the complex emotions of customers at the point of sale [31]. The multidimensional value is particularly relevant to service businesses in anticipating consumer behaviour [39].
Table 3 summarises the criteria of design value in the key literature. The criteria from Kotler and Rath are arguably the pioneering research for addressing design as a holistic concept [25]. They defined design as “the process of seeking optimised customer satisfaction”. Gorb identified four discrete dimensions of design value in a business [40]. Alben listed eight considerations of design and categorised the list into two domains [41]; the direct contributions for user experience and the development process of designers. The list of considerations can be useful for developing questions for the exploratory factor analysis in future research. Moultrie et al. identified five factors for auditing the role of design [42]; desirability, novelty/differentiation, usability, technical quality, and profitability. The developed tool in Moultrie et al. covers the range from the narrow scope of tangible and intangible attributes of products to the broader scope of attributes [42].
This research aims to investigate relevant design elements in a service delivery process, and categorise them for managerial purposes. Hence, the availability of interpreting the criteria with design aspects is essential for the scope of this study. This study employs Gorb’s view of design contributions, and the rationale for Gorb’s view will be addressed in the variable definition section.

2.3. The Categories of Perceiving Design Value and Open Innovation

Regarding the dimensions of perceived value, this study adopts Holbrook’s view of consumer value. Holbrook [37] determines three criteria for classifying value dimension: self-oriented or other-oriented, extrinsic or intrinsic, and active and reactive. Given that active and reactive value are difficult to distinguish in the current literature [31,37,39], Nam [27] argued that classifying design value needs to consider only two criteria: self-oriented or other-oriented, and extrinsic or intrinsic. As a result, the design value contains four discrete dimensions [27]. The emotions related to each dimension are derived from Holbrook’s original category, and are summarised in Table 4.
The self-oriented emotions are related to how design elements appeal to the consumer. However, the interaction between extrinsic value and intrinsic value in food service is more complicated than a product-oriented business [20]. One can easily distinguish the functionality and aesthetic of a product. Since a service is delivered as a holistic experience [43], what remains in customers’ minds is the service as a whole [27]. In other words, the output of service seems to be a single offering, but contains intricate internal processes like a code in programming [44]. Therefore, a clear distinction between extrinsic and intrinsic value is difficult to achieve in a service business [45].
On the other hand, the extrinsic and intrinsic categories for other-oriented value have discrete characteristics. The other-oriented and extrinsic value contains emotions related to self-fulfilment. The other-oriented and intrinsic value accommodates the more broad range of emotions than any other value dimensions. By adopting findings from the preliminary study [27], this study limits the other-oriented and intrinsic value to the ethical/moral value. The ethical/moral aspects of value are still challenging to anticipate consumer behaviour [46,47], but relatively more straightforward to investigate design aspects observed by customers. As a result, this study defines three value dimensions through design elements as follows: Appealing value for self-oriented and intrinsic value, Reflective value for other-oriented and extrinsic value, and Social responsibility value for other-oriented and intrinsic (ethical/moral) value.
The holistic concept of value is particularly relevant for understanding the co-creation of value [15]. Given that the process of co-creating value is at the core of the Open innovation process [8], Holbrook’s holistic perception of value is suitable for investigating the Open innovation process in the service business sector. Additionally, the holistic value typology can be applied to other stakeholders in the service business [27]. In doing so, the relationship between the perceived value of various stakeholders can be revealed. However, knowing the consequences of stakeholder interaction is arguably not sufficient for proposing practical solutions. It is necessary to identify the touch-points where strategically-focused interactions occur from a systemic approach. This study utilises the Service Blueprint [5] for understanding the service system of the targeted business. The results of blueprinting will be addressed in the next section.

2.4. Systemic Understanding of Food and Beverage Service Businesses

In the relationship marketing context, the value of a service business is co-created by the interaction between customers and service providers [48]. The interaction becomes the customers’ holistic experience consumed in the event of service provision [49]. In addition, the abundance of products and services allows consumers to consider emotional compensation of consumption beyond the traditional trade-off concept of compensation [50]. Design of tangible elements is critically related to the outcome of the service provision [51]. By influencing the customer experience, design in the service industry enriches the customer perception of a brand and its process. In order to understand the process of service delivery, this study utilises the Service blueprint [5,52]. By developing from the original Service blueprint [53], Bitner et al. propose additional domains (physical evidence and support process) within the blueprint for practical purposes [5]. The Service blueprint facilitates the identification of relevant design elements in the food and beverage service process.
Figure 1 above summarises the activities of a food and beverage service business through customer behaviour. Each step is linked with actions in other domains if any visible or invisible interaction occurs. Physical evidence is mainly associated with aesthetic elements of design, while other interactions and domains are related to managerial aspects of design. The specific elements are listed in each step in the Physical evidence domain.
In summary, the design’s positive impacts on business are undisputable. However, the notion of design’s contributions needs to be redefined due to the broadened role of design in the contemporary business. This study adopts Holbrook’s holistic view of value by considering design’s emotional interaction with customers. For defining variable groups of design elements, researchers categorised design elements according to Gorb’s four contributions of design (Product, Environment, Information, and Corporate Identity). The customer journey will be mapped by using the Service blueprint in order to identify specific design elements for each touch-point where the customer-service provider interaction exists.

3. Research Method

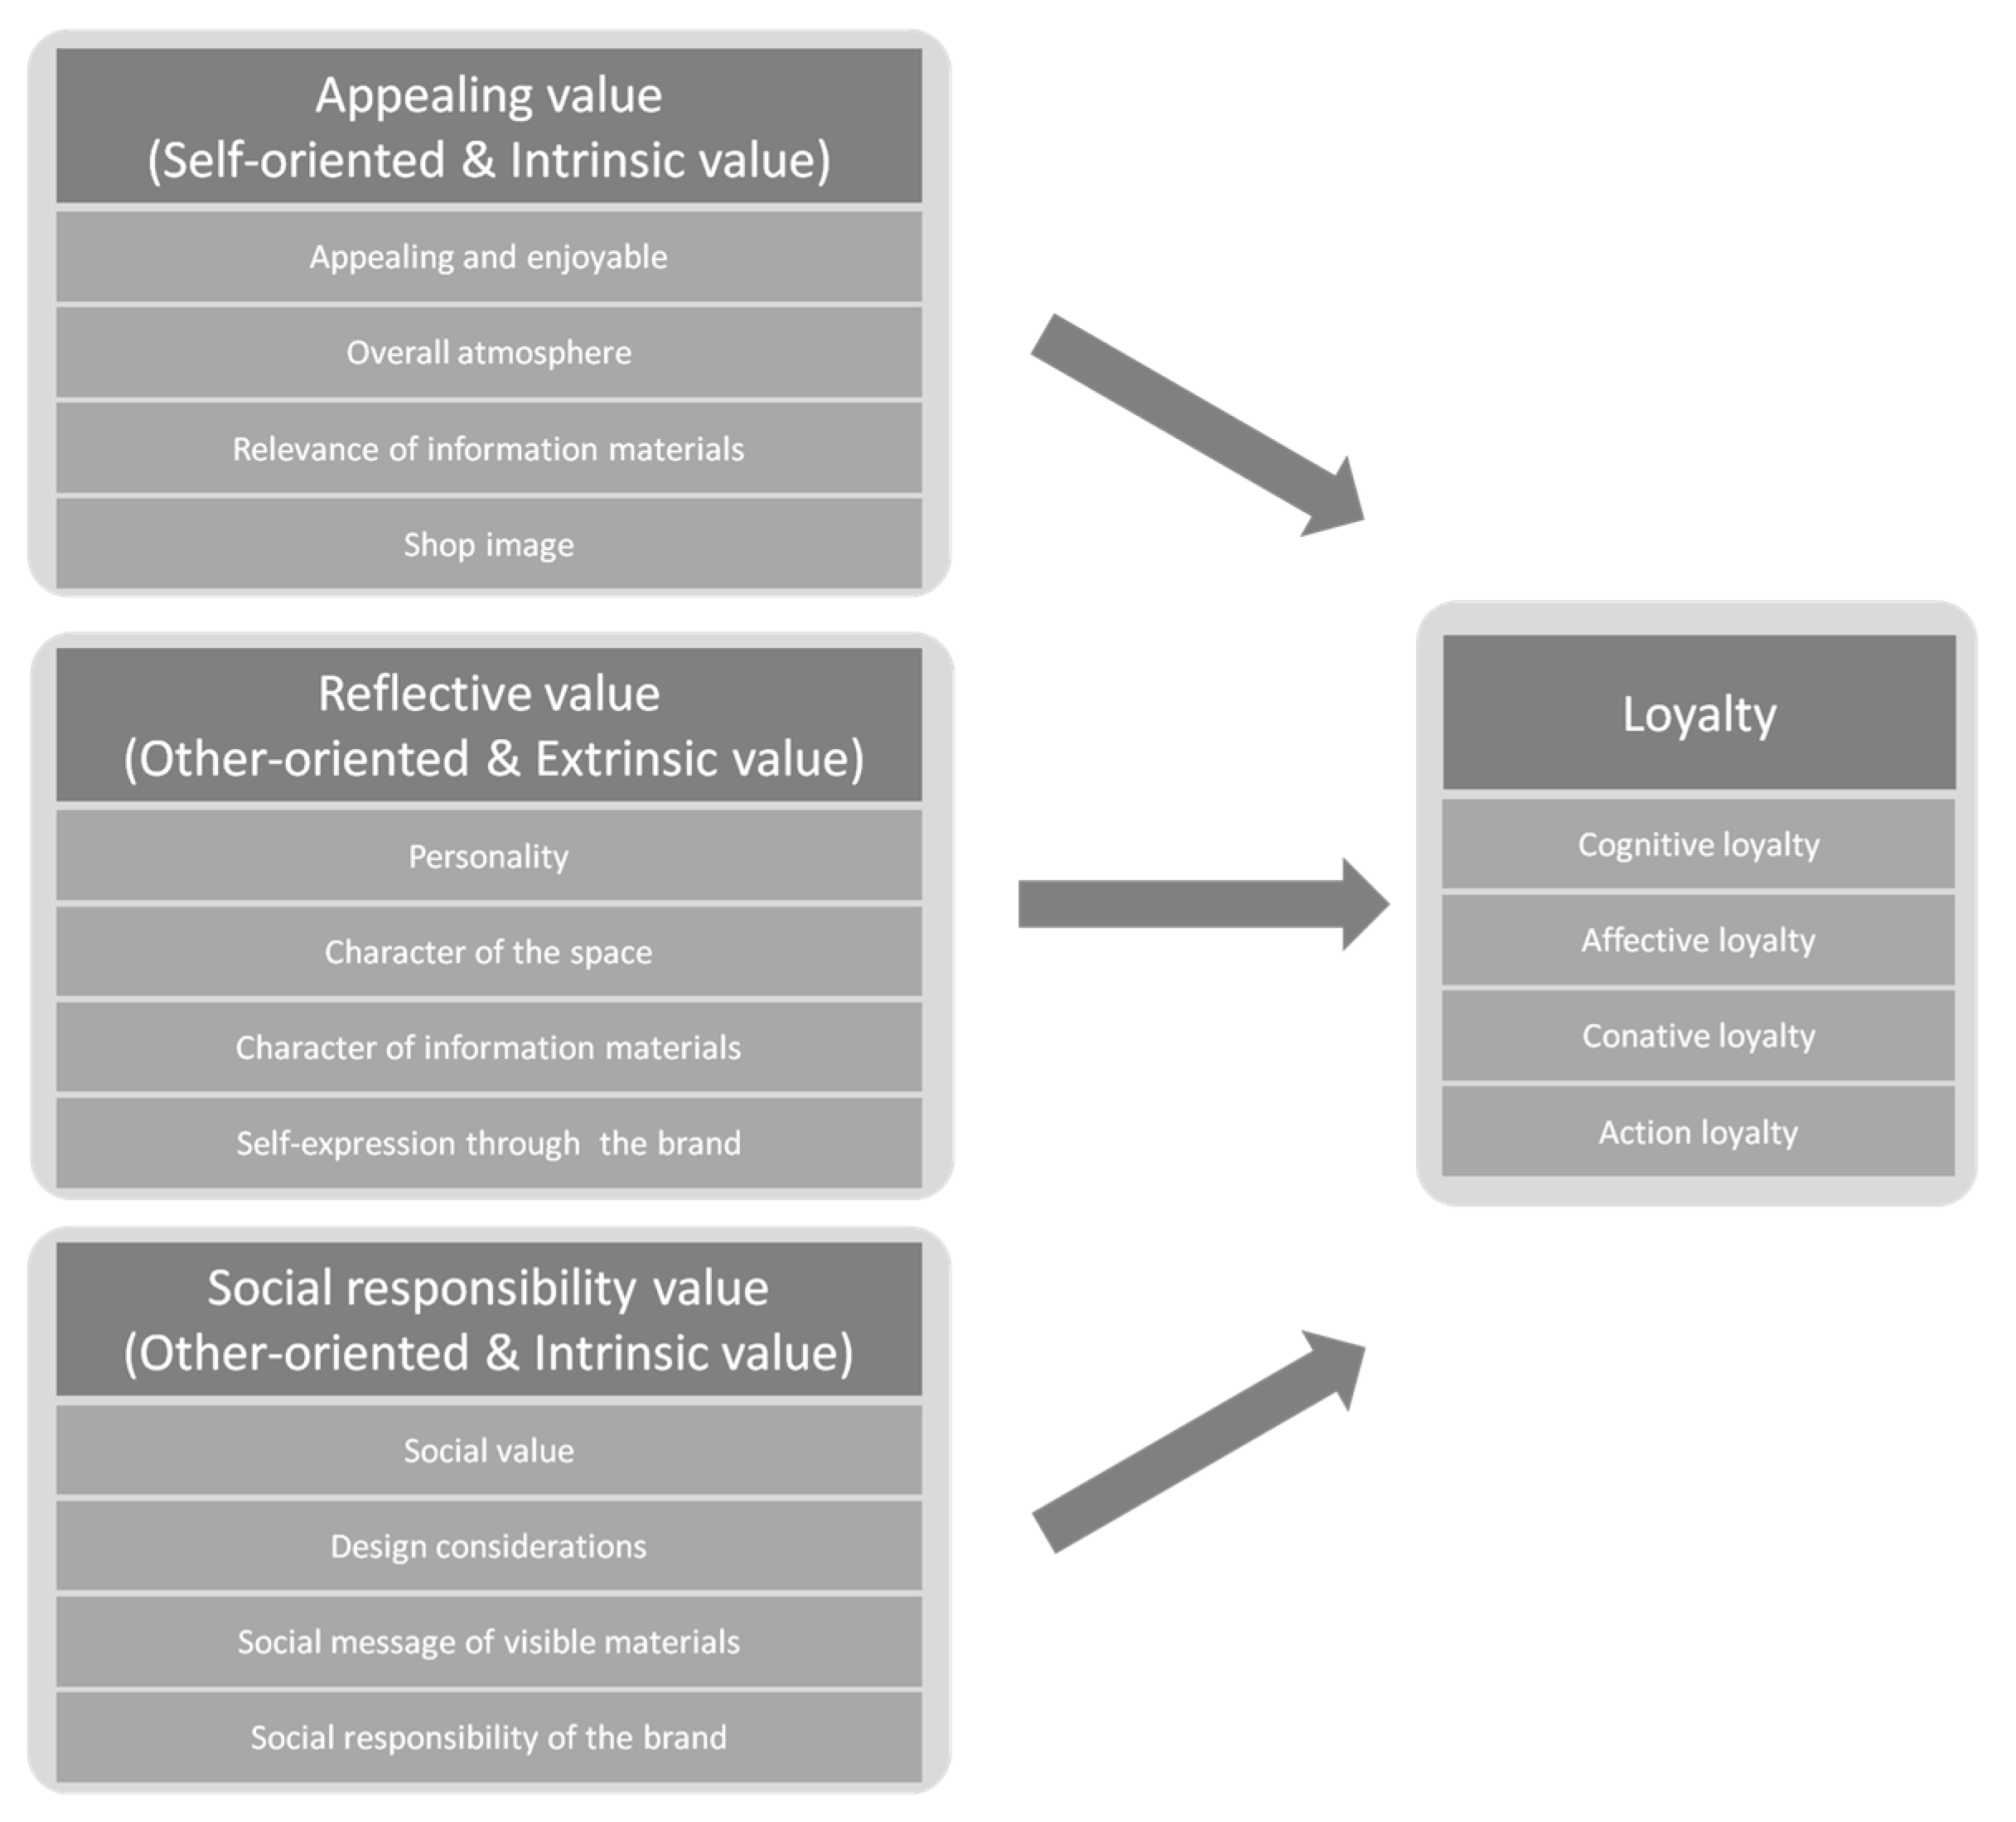
3.1. Defining Variables from Literature

In order to define the independent variable, this study employs the view from Gorb and value dimensions from Holbrook in order to determine independent variables. Given that Gorb’s classification is derived from designers’ activities and contribution [40], it enables the investigation of a firm’s activities to meet specific customer needs. In addition, since service businesses heavily rely on the physical and visual aspects of design [37], the link between the emotions of perceiving value with specific design elements can be addressed [27]. Thus, Gorb’s classification becomes the grouping of variables. Following on from this, the three emotions (enjoyment—Self-oriented & Intrinsic, self-reflective—Other-oriented & Extrinsic, and ethical/moral—Other-oriented & Intrinsic) from value dimensions are attached to the grouping variables.
To determine the dependent variables, this study employs customer loyalty. When a customer continuously purchases products and services, it can be explained that the person is loyal to the brand. However, customers may repatronise a brand due to simple factors which can be easily imitated. In this case, the relationship is vulnerable, without deeper customer engagement [54]. Thus, understanding the degree of customer engagement regarding the chances of re-visiting and re-purchasing is necessary. Oliver proposed that the customer engagement to a brand is diverse and composed of four different levels: Cognitive, Affective, Conative, and Action [55]. A lower level of loyalty is a prerequisite for a higher level of loyalty, and interacts positively with other levels of loyalty [55]. Hence, this study examines each level of loyalty as a single item for the dependent variable, customer loyalty. The operational definitions of these variables are described in Table 5.

3.2. Confirming Variables through Interviews

Interviews were conducted to determine operational definitions for independent variables in Table 5. To check variables for the food and beverage service sector, this study extracts the variables by analysing interview data both from the panel of experts and design students at the university. The interview was conducted in two steps. Firstly, the interview question (which design element do you consider most when choosing a food and beverage service?) was given to design students (15 participants) at the University of Leeds an through e-mail conversation. Secondly, although adequate responses were collected in the first stage interview, it was necessary to review the item from a professional perspective [56]. Researchers asked the same question to 18 service design experts (design, marketing and service experts, who have more ten years experiences in the service sectors). At this time, the experts helped to designate each design element to Gorb’s design contribution categories and Holbrook’s typology of consumer value. The purpose of the two-stage interview is to confirm the relevance of design students’ list from the professional perspective, and eliminate non-design related elements. In doing so, the researchers finalised the design elements and categorised them into the list (Product & Service, Environment, Information and Corporate Identity). As a result, items are appointed to each independent variable (value dimensions). For the dependent variable (customer loyalty), this study adopts the loyalty description by Oliver [55]. The structure of the model is demonstrated in Figure 2. All variables were in the 90–95% agreement rate, thus procuring a reliability factor.

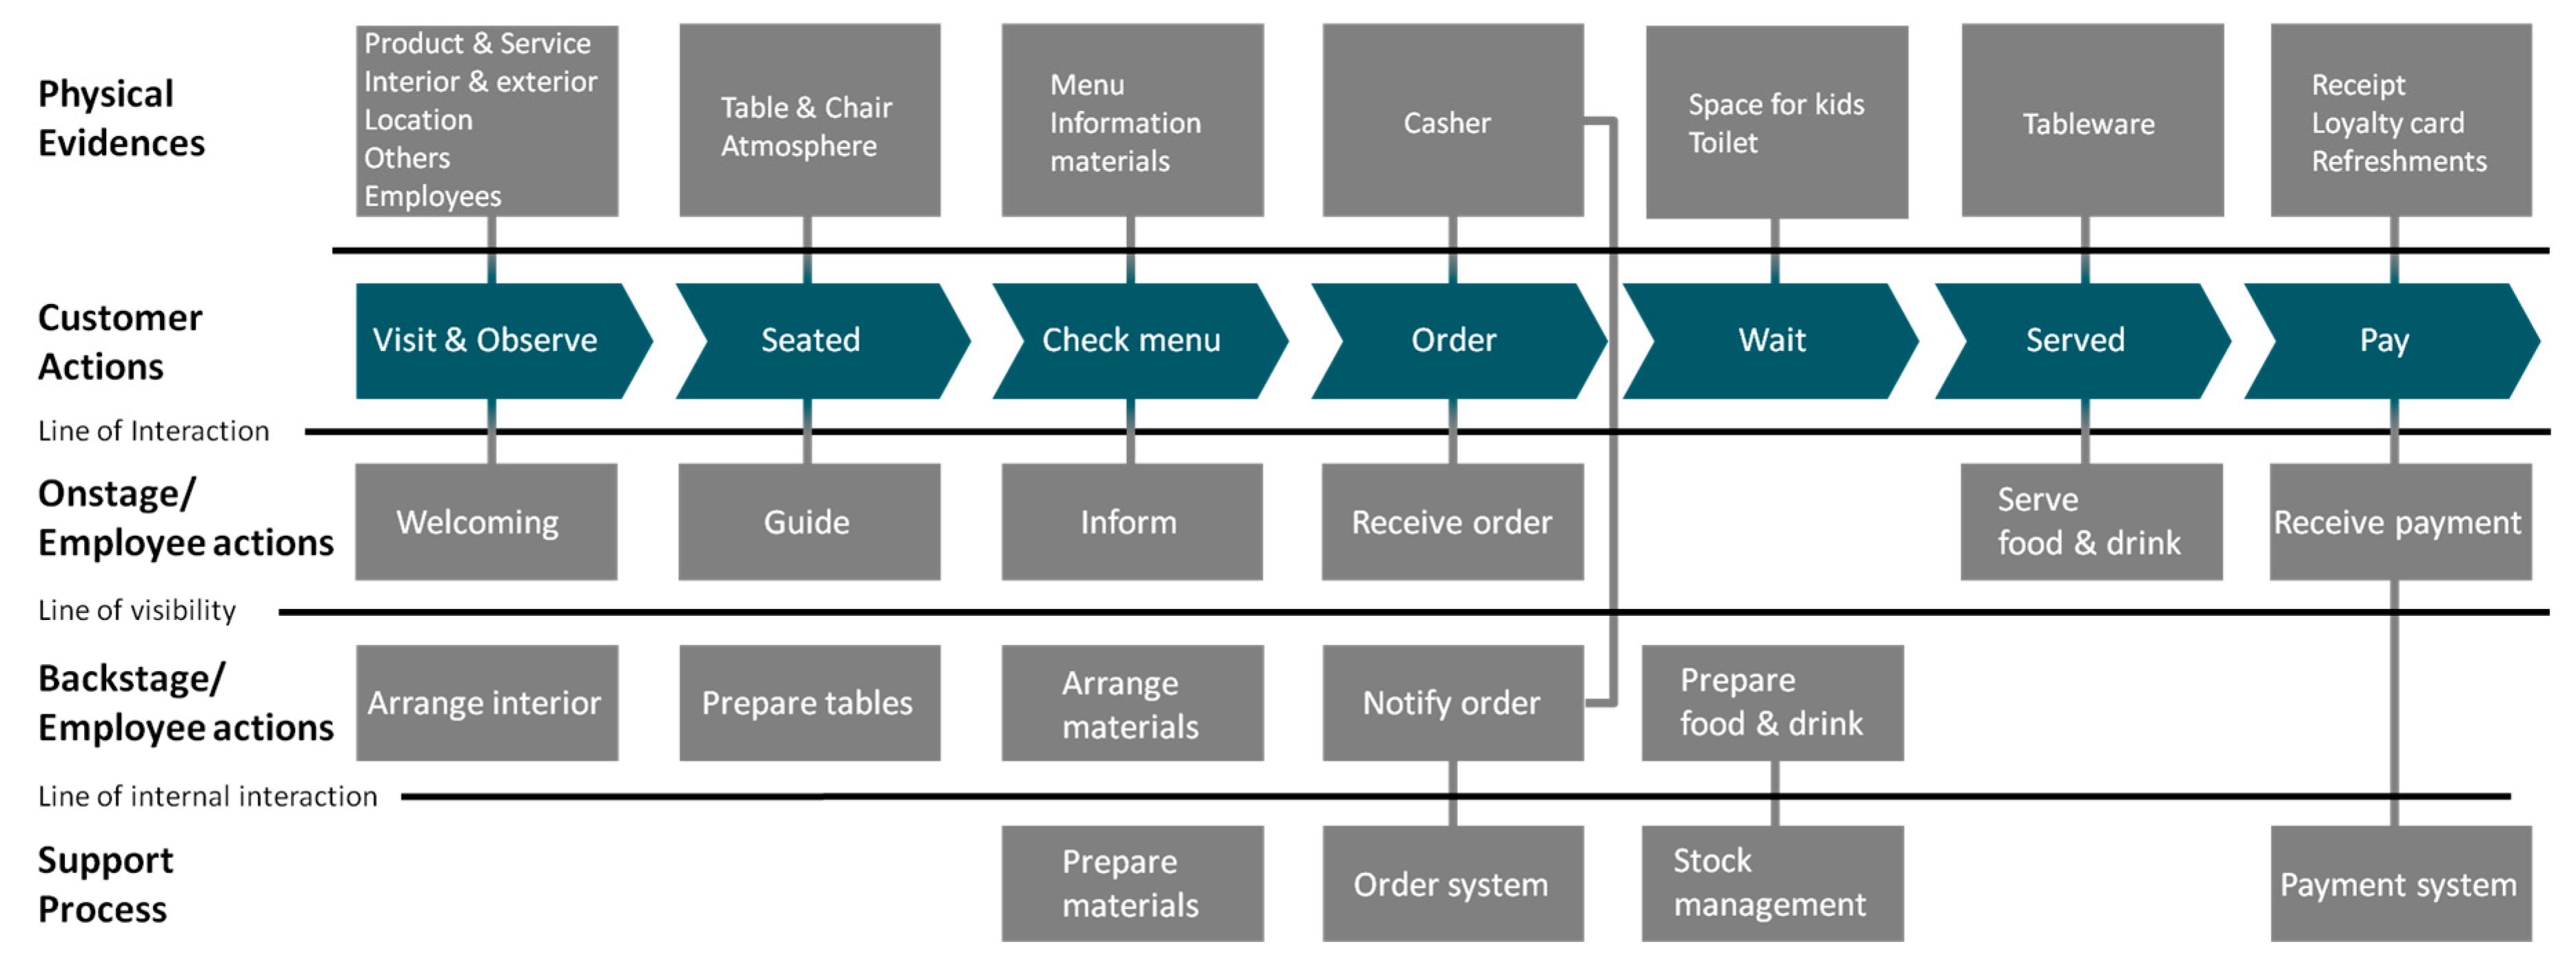
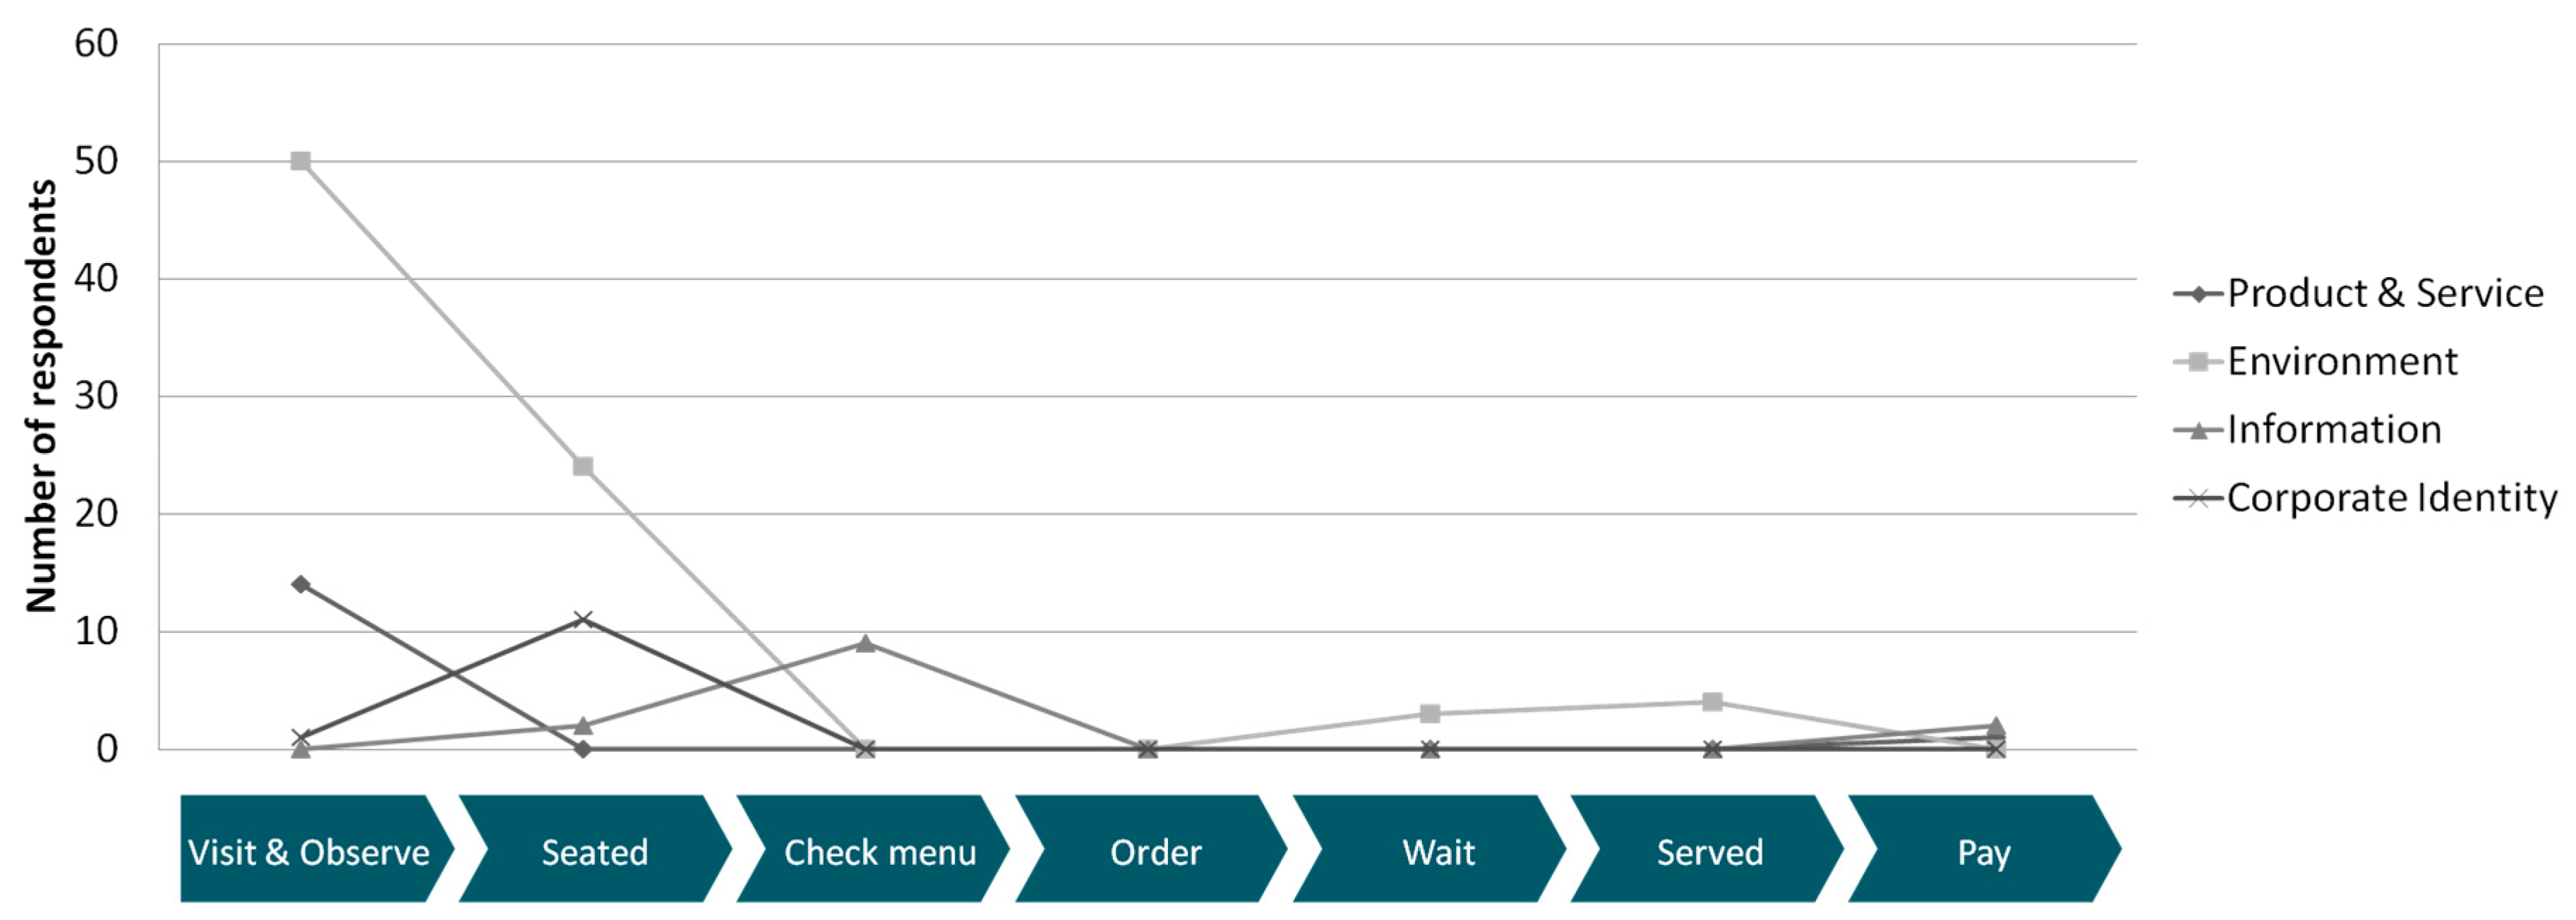
3.3. Service Blueprint with Design Elements and the Survey Structure

By establishing the relevance and inclusion of the Service blueprint, this study designates the various design elements extrapolated from the interviews against the blueprint, as shown in Figure 3. Each design element is placed on the steps expressed in the Service blueprint, thus identifying alignment to the different design elements in consumers’ minds, and subsequent frequency levels across the interviewed participants in this study.
Figure 3 is a summary of interview results of design elements for a food and beverage service business. The result indicates that customers’ considerations mostly belong to the first two steps (Visit & Observe and Seated). A total of 102 responses (84% of 121 responses) converged on the first two steps: Mainly, environmental design elements (81 responses, 67%) are dominant throughout the service provision. The result demonstrates the number of design elements noted by the customer, regardless of the impact on the business. Thus, it can be interpreted that design elements in the first two steps attract and resonate with customers, while the other elements in later steps strengthen the perceived value of the service.
The Variables in Table 5 above need to be rearranged with value dimensions to understand design’s contribution to customers’ emotional dimensions, as described in Figure 3. Each value dimension contains four contributions (product, environment, information, and corporate identity) of design. The survey consists of three sections: general information of the participants, independent variables, and dependent variable. In doing so, the influence of a specific design contribution to each value dimension can be revealed. Furthermore, the regression analysis of value dimensions and loyalty can be performed to identify the relative importance of each dimension to customer loyalty.
In summary, interviews (qualitative approach) were utilised to generate criteria for design elements in the food and beverage service businesses. The created survey was distributed through on-line agencies for collecting quantitative data for performing statistical analyses.

3.4. Data Collection and Analysis Methods

Sixteen questions were asked of the participants in the study that covered the topics of design elements and customer loyalty. The survey question contains four design elements for each value dimension and four levels of customer loyalty, as shown in Figure 2. For the demographic information, four questions were asked. Having considered the potential influence of overseas experience, nationality and the visited shops were questioned, along with age and gender. Only local consumption was considered for this study. The survey set was distributed by local survey agencies (Embrain.co.kr) with local languages. Participants were paid as they finish the survey with the guided compensation from each survey agency.
A total of 110 samples were collected from the South Korean (KR) market. The questionnaire collection progressed thanks to an online survey system from June to August in 2017. The data was filtered in order to remove disengaged samples (choosing single numbers for all questions, illogical patterns of answers such as 1-2-3-4-1-2-3-4). Thus, the final dataset contains 100 respondents. Subsequently, EFA (Exploratory Factor Analysis) was performed for confirming factors by using SPSS. Having considered the potential significance of the relationship between design value dimensions [27], the correlation matrix is calculated and reported. Regression coefficients are reported to confirm the validity of the independent variables (Appealing value, Reflective value and Social responsibility value) for the dependent variable (Customer Loyalty).

4. Analyse Results

4.1. Demographic Information of the Data

The demographic information for the participants has been summarised in Table 6. The number of both male and female participants is 50. This study asked the time elapse of consumption experience in five categories; within a week, within a month, within three months, within six months, and more than six months. Given that the researchers did not restrict the number of participants for each time category, the survey participants recalled their most recent and relevant experience for the survey.

4.2. Component Matrix Result

First of all, the component matrix is calculated by SPSS. The result is described in Table 7.
The loaded factors above 0.4 in Table 7 are grouped in predetermined categories. Appealing value, Overall atmosphere, the relevance of information materials, and shop image are grouped in factor 2 (Appealing value). Personality, the character of the space, the character of information materials, and self-expression through the brand are categorised in factor 1 (Reflective value). For factor 4 (Social responsibility value), given that the Design consideration item is cross-loaded for two factors, the item is eliminated and the other three items are grouped. Lastly, the hierarchies of loyalty are grouped in Loyalty. Since major cross-loading issue occurs when the difference between primary and secondary loading is less than 0.2 [57], other loaded values greater than 0.3 will not be considered as the cross-loaded issue in this research. The potential cause of a cross-loaded item will be discussed in the limitations and Further Study section at the end of this paper. The percentages of variance explained for each factor are 38.347, 12.000, 11.578, and 8.427. The Eigenvalues are 6.135, 1.920, 1.853, and 1.348 respectively. Cronbach’s alpha for each grouped factor is all above 0.7 (threshold reference, [58]).

4.3. The Confirmation of Homogeneity for the Sample

In order to confirm the homogeneity of the sample between genders, this study performed Chi-square difference test for each variable by using Crosstab analysis in SPSS. By setting the row for gender and columns for each question, a Chi-square test was conducted as shown in Table 8. It is confirmed that there is no difference between genders. In other words, the homogeneity of gender for the collected sample is confirmed.

4.4. The Validity Test Results

The validity test result is conducted by utilising SPSS Amos and Excel macro developed by Gaskin [59]. The results are described in Table 9. Chi-square value is 308.893. The degree of freedom is 84. The significance is less than 0.001. Composite reliability values are all greater than 0.7, and convergent validity (AVE) is also confirmed (greater than 0.5). All Maximum Shared Variance (MSV) is smaller than AVE (thresholds referred to Hair et al. [50]).
Due to the high correlation between the same independent variables, Variance Inflation Factors (VIF) was investigated as shown in Table 10. By setting each item as a dependent variable, the multicollinearity was calculated with the linear regression function (collinearity diagnostics) in SPSS. The variables meet the threshold of multicollinearity (VIF less than 5.0, [60]). Although variables are within the threshold, Appealing value dimension (AV_4 in Table 10) and Reflective value dimension (RV_2 in Table 10) have slightly high VIF values, which may be corrected in future studies. The causes and potential solutions to this issue will be discussed in the Limitations and Further Study section at the end of this paper.

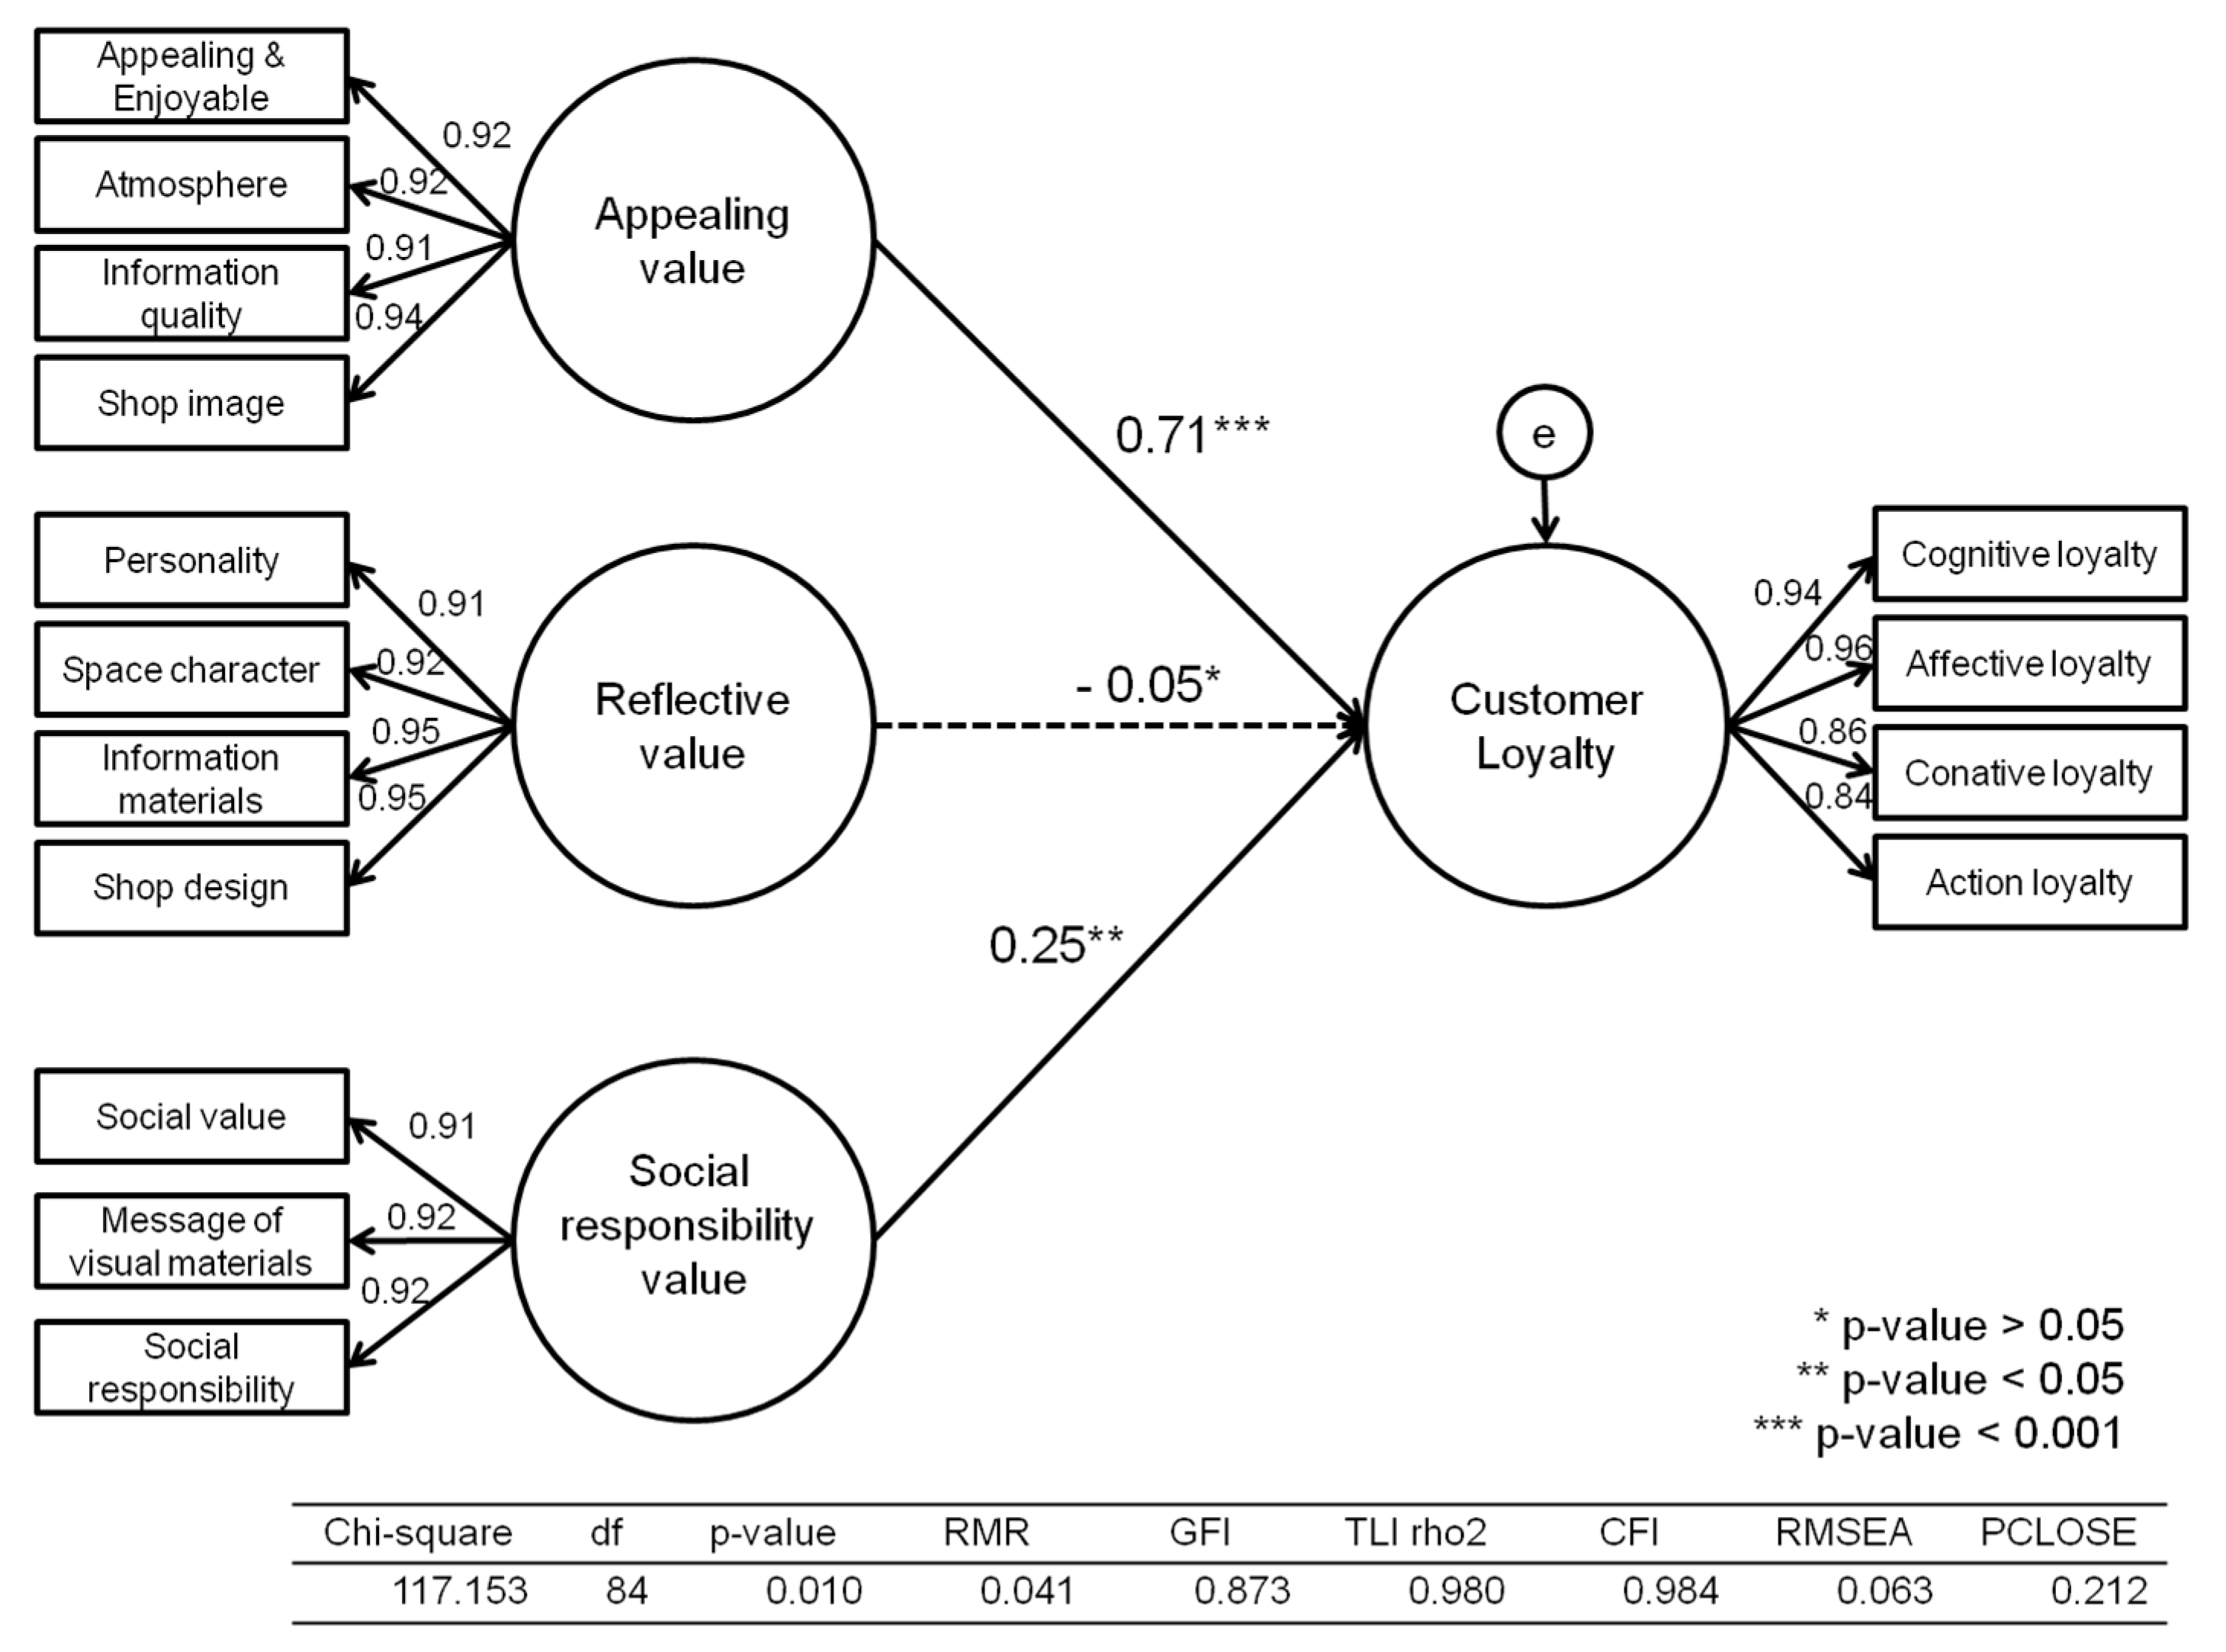
4.5. Analysis Results of the Relationship between the Perceived Design Value and Loyalty

Multiple linear regression was calculated to predict Customer loyalty based on three dimensions of design value (Appealing, Reflective and Social responsibility value) using SPSS AMOS. Having considered the cultural conflict of the model, this study analyses CFA and path analysis for each country. R squared value of the model is 0.856 by setting Customer loyalty as the dependent variable (Figure 4). The standardised regression coefficients of each design value to Customer loyalty are 0.71 (p-value less than 0.001), −0.05 (p-value = 0.755) and 0.25 (p-value = 0.006) respectively.

5. Conclusions

This study examined design elements in the food and beverage business and categorised the elements into the customers’ emotional dimensions. The Service blueprint technique was employed to identify design elements in each step of service provision. The identified design elements are critical to understanding the interaction between stakeholders, which facilitates the Open innovation process in the service business. The SEM (Structural Equation Modelling) was conducted to build a model and examine meaningful differences between cultural groups. The model is built and analysed to confirm the relevance of categorised design elements. The results reconfirm the argument in the existing literature; however, they have important managerial implications and offer directions for future studies.

5.1. Discussion

Firstly, design elements with emotional categories are confirmed. The preliminary research of present study [27,38] proposed four discrete dimensions of design value. However, the studies focused on investigating the relationship between dimensions, and failed to build an appropriate model for suggesting specific design elements for a service business. It is also critical to know which design elements need to be measured in the specific case [61]. By eliminating design elements at Self-oriented & Extrinsic dimension, this study clarifies the design value dimensions of the food and beverage service through EFA. The utilisation of the confirmed design elements for every food and beverage services can be still over-generalised. However, by combining with the Service blueprint, the design value dimensions allow a practitioner to develop and determine an effective way of evaluating design outcomes.
Secondly, the impact of each design value dimension for customer loyalty is revealed. Despite cultural differences in perceiving design value and loyalty, this study identifies the positive impacts of Appealing value and Social responsibility value for customer loyalty. Whether it is a local café or an international family restaurant, this finding implies that an aesthetically-appealing design strategy and the appropriate demonstration of social responsibility activities can increase customer loyalty. The ethical/moral value does not always impact positively for customer behaviour; however, for this study it indicates increased customer loyalty. The ethical value of a brand strengthens brand equity [62], and the positive brand equity leads to greater customer loyalty [63]. Given that designers need baseline criteria to statistically evaluate projects [64], this result proposes an objective method for assessing design outcomes.
Thirdly, this study proposes a useful quantitative approach for the conceptualization of design value. This study investigates design value and customer evaluation outcomes such as satisfaction and loyalty. The relationship between value and customer evaluation outcomes has been discussed for several decades. Even though design adds value to products and services [13], there is a lack of research addressing design value and its measurement in the literature. Conceptualising design value from the value perspective facilitates the demonstration of design outcomes objectively [27]. Modern technology enables the gathering of various types of quantified data. Knowing and interpreting the available data into the actionable areas of design is critical in determining the right strategies [65]. Additionally, the quantitative analysis of a business allows service practitioners to anticipate robust and practical solutions for innovative businesses [66]. Thus, if design aims to be a critical strategic asset, design should be measured [64]. In this context, this study takes the first step for the quantitative design research.
Lastly, the proposed typology facilitates the strategic use of design regarding emotional responses of customers for the Open innovation process. The proposed design value dimensions are derived from understanding the holistic (external and internal) network of the service provision by utilising the Service Blueprint. Although the scope of this study is limited to customers, other key stakeholders were identified and included during the blueprinting process. Given that the brand value is created by the interaction between customers and related stakeholders, it is necessary to enable the open interface [67]. For example, word of mouth is the most effective way to market restaurants [68,69]. Providing and managing platforms (such as review section at the store’s website, an interactive offline poll for the favourite menu) where customers share their experience of the brand is essential for Open innovation in the food and beverage services. The proposed typology is useful for conceptualising the value of relevant stakeholders. In doing so, a firm can analyse the emotional relationship between stakeholders and execute effective strategies to enhance its brand value.

5.2. Limitations and Future Studies

Firstly, the developed model is overly simple and disregards the mediating role of satisfaction to customer loyalty. Satisfaction is currently considered key to understanding business performance [70]. In addition, satisfaction plays the mediating role between perceived value and behavioural intentions [71]. In other words, there are many other factors for modelling the perceived value and customer loyalty. Those factors are critical in building the suitable models for conceptualising customer psychology [72]. A thorough investigation of other behavioural factors can make the developed model more sophisticated in terms of scope and application.
Secondly, there is a chance of improvement regarding the multicollinearity problem in the survey question. Questions about Shop image (AV_4) and the Character of the space (RV_2) show high VIF values (VIF > 3.0). The design of the questionnaire can cause this multicollinearity problem. Given that this study focuses on emotional reactions for the same design element, some participants may have found it difficult to distinguish discrete emotions. For example, the relevance of information materials and the character of those materials may be confusing for some participants. Given that the positive attitude toward the brand was asked for the Shop image, the response can overlap with other questions. In short, more precise modification of the survey is necessary. The recent work by Gallarza et al. demonstrates good practice for developing questions for perceiving value [39]. Therefore, it is critical for conducting the survey scale refinement in this studies’ next phase.
Lastly, the relationship between Reflective value and customer loyalty is not significant due to the broadness of the sample. This finding is opposite to the well-known quote, “You are what you eat”. The quote implies that the food consumption reflects not only genetic health conditions, but also the cultural and personal aspects of the individual [17,73]. This is arguably caused by not specifying the business within the food and beverage industry. The responded businesses are too broad regarding conceptualising Reflective value. They include businesses such as fast-food restaurants, cafes, up-market restaurants, family restaurant, and so on. Additionally, given that this study included questions about a recent experience in participating in the survey, participants may not consider the most favourable brand. Instead, brands that were most conveniently-available for the participants may have affected the results of the survey. The preference of food and beverage service in the contemporary market is complex and diversified [63,64]. The brands in the collected survey do not necessarily align with an individual’s personality. Also, the emotion related to owning a product or consuming of a service has only been studied recently, and requires further practical research [74]. Therefore, it is critical to investigate Reflective value by specifying the target business in future studies.
In conclusion, customer value should be measured with a discrete approach [75]. Given that value is considered as a holistic emotional evaluation of customers’ preference [23,31,39], design value, which emotionally interacts with customers, needs to be considered as essential for the measuring tool. This study attempted to establish the measurement of design value in the service industry by categorising design elements in the emotional value dimensions. The data is the core of the Fourth Industrial Revolution. Rigorous studies should be followed to interpret design in the era of easily-accessible data. In doing so, developing a measuring tool and building sophisticated models with business performance indicators can be viable. The objective measurement of design value is significant, and can be used by businesses to become more sustainable and successful through their design activities. The short-term evaluation is particularly critical for Small and Medium Enterprises (SMEs), in which design effectiveness needs to be monitored in order for these businesses to lead and be responsive to new market trends. The sound operation of SMEs is fundamental for the Open Innovation Economic System (OIES), which interacts with the Closed Innovation Economy [76]. Design supports a strategic decision for a brand [77], and the measured outcomes provide consumer insights [11]. Thus, managing design cannot be intuitive any more. Design should adopt data-driven transformation in order to be an innovative asset in contemporary business.

Author Contributions

Conceptualization, K.W.N. and B.Y.K.; Methodology, K.W.N. and B.Y.K.; Validation, K.W.N., B.Y.K. and B.W.C.; Formal analysis, K.W.N.; Data curation, K.W.N.; Writing—original draft preparation, K.W.N.; Writing—review and editing, K.W.N., B.Y.K. and B.W.C.; Funding acquisition, K.W.N. and B.W.C.

Funding

This research was funded by Design Research Society, Student bursary scheme 2016. The fund was utilised for employing online survey participants.

Conflicts of Interest

The authors declare no conflict of interest.

References

  1. Howkins, J. The Creative Economy: How People Make Money from Ideas; Penguin: London, UK, 2002. [Google Scholar]
  2. Bitner, M.J. Servicescapes: The impact of physical surroundings on customers and employees. J. Mark. 1992, 56, 57–71. [Google Scholar] [CrossRef]
  3. Gallouj, F.; Djellal, F. (Eds.) The Handbook of Innovation and Services: A Multi-Disciplinary Perspective; Edward Elgar Publishing: Cheltenham, UK, 2011. [Google Scholar]
  4. Buswell, J.; Williams, C.; Donne, K.; Sutton, C. Service Quality in Leisure, Events, Tourism and Sport; CABI: Wallingford, UK, 2016. [Google Scholar]
  5. Bitner, M.J.; Ostrom, A.L.; Morgan, F.N. Service blueprinting: A practical technique for service innovation. Calif. Manag. Rev. 2008, 50, 66–94. [Google Scholar] [CrossRef]
  6. Meroni, A.; Sangiorgi, D. Design for Services; Routledge: Abingdon, UK, 2016. [Google Scholar]
  7. Sangiorgi, D. Building a framework for service design research. In Proceedings of the 8th European Academy of Design Conference, Aberdeen, UK, 1–3 April 2009; pp. 415–420. [Google Scholar]
  8. Carroll, N.; Helfert, M. Service capabilities within open innovation: Revisiting the applicability of capability maturity models. J. Enterp. Inf. Manag. 2015, 28, 275–303. [Google Scholar] [CrossRef]
  9. West, J.; Gallagher, S. Challenges of open innovation: The paradox of firm investment in open-source software. R&D Manag. 2006, 36, 319–331. [Google Scholar]
  10. Fredberg, T.; Elmquist, M.; Ollila, S. Managing Open Innovation Present Findings and Future Directions; VINNOVA: Stockholm, Sweden, 2008.
  11. Malhotra, N.K. Review of marketing research. In Review of Marketing Research; Emerald Group Publishing Limited: Bingley, UK, 2007. [Google Scholar]
  12. Hultén, B.; Broweus, N.; Van Dijk, M. What is Sensory Marketing? In Sensory Marketing; Palgrave Macmillan: London, UK, 2009; pp. 1–23. [Google Scholar]
  13. De Mozota, B.B. The four powers of design: A value model in design management. Des. Manag. Rev. 2006, 17, 44–53. [Google Scholar] [CrossRef]
  14. Kaplan, R.S.; Kaplan, R.E.; Norton, D.P.; Davenport, T.H. Strategy Maps: Converting Intangible Assets into Tangible Outcomes; Harvard Business Press: Brighton, UK, 2004. [Google Scholar]
  15. Grönroos, C. Service logic revisited: Who creates value? And who co-creates? Eur. Bus. Rev. 2008, 20, 298–314. [Google Scholar] [CrossRef]
  16. Reddy, T.A. Applied Data Analysis and Modeling for Energy Engineers and Scientists; Springer Science & Business Media: Berlin, Germany, 2011. [Google Scholar]
  17. Wirtz, J. Essentials of Services Marketing; FT Press: Upper Saddle River, NJ, USA, 2012. [Google Scholar]
  18. Lemon, K.N.; Verhoef, P.C. Understanding customer experience throughout the customer journey. J. Mark. 2016, 80, 69–96. [Google Scholar] [CrossRef]
  19. Ordanini, A.; Parasuraman, A.; Rubera, G. When the recipe is more important than the ingredients: A qualitative comparative analysis (QCA) of service innovation configurations. J. Serv. Res. 2014, 17, 134–149. [Google Scholar] [CrossRef]
  20. MacFie, H. (Ed.) Consumer-Led Food Product Development; Elsevier: Amsterdam, The Netherlands, 2007. [Google Scholar]
  21. Lancaster, G.; Massingham, L. Essentials of Marketing Management; Routledge: Abingdon, UK, 2010. [Google Scholar]
  22. De Mozota, B.B. Design Management: Using Design to Build Brand Value and Corporate Innovation; Skyhorse Publishing Inc.: New York, NY, USA, 2003. [Google Scholar]
  23. Design Management Institutes. 2015 DMI: Design Value Index Results and Commentary. Available online: https://www.dmi.org/page/2015DVIandOTW (accessed on 4 June 2018).
  24. Krippendorff, K. On the essential contexts of artifacts or on the proposition that “design is making sense (of things)”. Des. Issues 1989, 5, 9–39. [Google Scholar] [CrossRef]
  25. Kotler, P.; Rath, G.A. Design: A powerful but neglected strategic tool. J. Bus. Strategy 1984, 5, 16–21. [Google Scholar] [CrossRef]
  26. Hands, D. Vision and Values in Design Management; Bloomsbury Publishing: London, UK, 2009. [Google Scholar]
  27. Nam, K.W. The Impact of Design for Consumers in the Food and Beverage Industry: Design Value and Measurement. Ph.D. Thesis, University of Leeds, Leeds, UK, 2016. [Google Scholar]
  28. Gorb, P.; Dumas, A. Silent design. Des. Stud. 1987, 8, 150–156. [Google Scholar] [CrossRef]
  29. Danaher, P.J.; Mattsson, J. A comparison of service delivery processes of different complexity. Int. J. Serv. Ind. Manag. 1998, 9, 48–63. [Google Scholar] [CrossRef]
  30. Sweeney, J.C.; Soutar, G.N. Consumer perceived value: The development of a multiple item scale. J. Retail. 2001, 77, 203–220. [Google Scholar] [CrossRef]
  31. Sánchez-Fernández, R.; Iniesta-Bonillo, M.Á. The concept of perceived value: A systematic review of the research. Mark. Theory 2007, 7, 427–451. [Google Scholar] [CrossRef]
  32. Grönroos, C. Service marketing comes of age. In Handbook of Services Marketing Management; SAGE Publications: London, UK, 2000; p. 13. [Google Scholar]
  33. Gebauer, H.; Gustafsson, A.; Witell, L. Competitive advantage through service differentiation by manufacturing companies. J. Bus. Res. 2011, 64, 1270–1280. [Google Scholar] [CrossRef] [Green Version]
  34. Chesbrough, H. Open Services Innovation: Rethinking Your Business to Grow and Compete in a New Era; John Wiley & Sons: Hoboken, NJ, USA, 2010. [Google Scholar]
  35. Woodruff, R.B. Customer value: The next source for competitive advantage. J. Acad. Mark. Sci. 1997, 25, 139. [Google Scholar] [CrossRef]
  36. Wagner, J. Aesthetic value: Beauty in art and fashion. In Consumer Value: A Framework for Analysis and Research; Routledge: Abingdon, UK, 1999; pp. 126–146. [Google Scholar]
  37. Holbrook, M.B. (Ed.) Consumer Value: A Framework for Analysis and Research; Routledge: Abingdon, UK, 1999. [Google Scholar]
  38. Nam, K.W.; Carnie, B.W. The value of design for customers in the service industry: Contributions and measurements. In Design Management in an Era of Disruption, Proceedings of the 19th DMI, London, UK, 2–4 September 2014; Design Management Institute: Boston, MA, USA, 2014; pp. 1365–1399. [Google Scholar]
  39. Gallarza, M.G.; Arteaga, F.; Del Chiappa, G.; Gil-Saura, I.; Holbrook, M.B. A multidimensional service-value scale based on Holbrook’s typology of customer value: Bridging the gap between the concept and its measurement. J. Serv. Manag. 2017, 28, 724–762. [Google Scholar] [CrossRef]
  40. Cooper, R.; Press, M. The Design Agenda: A Guide to Successful Design Management; John Wiley & Sons: Hoboken, NJ, USA, 1995. [Google Scholar]
  41. Alben, L. Defining the criteria for effective interaction design. Interactions 1996, 3, 11–15. [Google Scholar] [CrossRef]
  42. Moultrie, J.; Clarkson, P.J.; Probert, D. A tool to evaluate design performance in SMEs. Int. J. Prod. Perform. Manag. 2006, 55, 184–216. [Google Scholar] [CrossRef]
  43. Gerritsen, D.; van Olderen, R. Events as a Strategic Marketing Tool; CABI: Wallingford, UK, 2014. [Google Scholar]
  44. Van Der Lans, R. Data Virtualization for Business Intelligence Systems: Revolutionizing Data Integration for Data Warehouses; Elsevier: Amsterdam, The Netherlands, 2012. [Google Scholar]
  45. Chandrasekar, K.S. Marketing Management: Text and Cases; Tata McGraw-Hill: New York, NY, USA, 2010. [Google Scholar]
  46. Eckhardt, G.M.; Belk, R.; Devinney, T.M. Why don’t consumers consume ethically? J. Consum. Behav. 2010, 9, 426–436. [Google Scholar] [CrossRef]
  47. Bray, J.; Johns, N.; Kilburn, D. An exploratory study into the factors impeding ethical consumption. J. Bus. Ethics 2011, 98, 597–608. [Google Scholar] [CrossRef]
  48. Grönroos, C.; Voima, P. Making Sense of Value and Value Co-Creation in Service Logic; Hanken School of Economics: Helsinki, Finland, 2012. [Google Scholar]
  49. Tynan, C.; McKechnie, S. Experience marketing: A review and reassessment. J. Mark. Manag. 2009, 25, 501–517. [Google Scholar] [CrossRef]
  50. Koc, E. (Ed.) Service Failures and Recovery in Tourism and Hospitality: A Practical Manual; CABI: Wallingford, UK, 2017. [Google Scholar]
  51. De Chernatony, L. Creating Powerful Brands; Routledge: Abingdon, UK, 2010. [Google Scholar]
  52. Bitner, M.J.; Ostrom, A.L.; Burkhard, K.A. Service blueprinting: Transforming the student experience. Educ. Rev. 2012, 47, 38–40. [Google Scholar]
  53. Shostack, L. Designing services that deliver. Harv. Bus. Rev. 1984, 62, 133–139. [Google Scholar]
  54. Cudworth, C. Brand Appreciation versus Brand Loyalty. 2015. Available online: https://www.linkedin.com/pulse/brand-appreciation-versus-loyalty-christopher-cudworth (accessed on 10 July 2018).
  55. Oliver, R.L. Satisfaction: A Behavioral Perspective on the Consumer: A Behavioral Perspective on the Consumer; Routledge: Abingdon, UK, 2014. [Google Scholar]
  56. Robins, R.W.; Fraley, R.C.; Krueger, R.F. (Eds.) Handbook of Research Methods in Personality Psychology; Guilford Press: New York, NY, USA, 2009. [Google Scholar]
  57. Gaskin, J. EFA—Factor Structure. Gaskination’s StatWiki. 2016. Available online: http://statwiki.kolobkreations.com (accessed on 14 October 2018).
  58. DeVellis, R.F. Scale Development: Theory and Applications; SAGE Publications: London, UK, 2016; Volume 26. [Google Scholar]
  59. Gaskin, J. Validity Mater. Stats Tools Package. 2015. Available online: http://statwiki.kolobkreations.com (accessed on 14 October 2018).
  60. Hair, J.F.; Ringle, C.M.; Sarstedt, M. PLS-SEM: Indeed a silver bullet. J. Mark. Theory Pract. 2011, 19, 139–152. [Google Scholar] [CrossRef]
  61. Beasley, M. Practical Web Analytics for User Experience: How Analytics Can Help You Understand Your Users; Newnes: Boston, MA, USA, 2013. [Google Scholar]
  62. Zeithaml, V.A.; Lemon, K.N.; Rust, R.T. Driving Customer Equity: How Customer Lifetime Value Is Reshaping Corporate Strategy; Simon and Schuster: New York, NY, USA, 2001. [Google Scholar]
  63. Aaker, D.A. Building Strong Brands; Simon and Schuster: New York, NY, USA, 2012. [Google Scholar]
  64. Saffer, D. Designing for Interaction: Creating Innovative Applications and Devices; New Riders: Berkeley, CA, USA, 2010. [Google Scholar]
  65. Wilkinson, T.J.; Kannan, V.R. (Eds.) Strategic Management in the 21st Century [3 Volumes]; ABC-CLIO: Santa Barbara, CA, USA, 2013. [Google Scholar]
  66. Maglio, P.P.; Kieliszewski, C.A.; Spohrer, J.C. Handbook of Service Science; Springer: Berlin, Germany, 2010. [Google Scholar]
  67. Hamel, G. What Matters Now: How to Win in a World of Relentless Change, Ferocious Competition, and Unstoppable Innovation; John Wiley & Sons: Hoboken, NJ, USA, 2012. [Google Scholar]
  68. Brown, D.R. The Restaurant Manager’s Handbook: How to Set Up, Operate, and Manage a Financially Successful Food Service Operation; Atlantic Publishing Company: Ocala, FL, USA, 2003; Volume 1. [Google Scholar]
  69. Fuggetta, R. Brand Advocates: Turning Enthusiastic Customers into a Powerful Marketing Force; John Wiley & Sons: Hoboken, NJ, USA, 2012. [Google Scholar]
  70. Fečiková, I. An index method for measurement of customer satisfaction. TQM Mag. 2004, 16, 57–66. [Google Scholar] [CrossRef]
  71. Cronin, J.J., Jr.; Brady, M.K.; Hult, G.T.M. Assessing the effects of quality, value, and customer satisfaction on consumer behavioral intentions in service environments. J. Retail. 2000, 76, 193–218. [Google Scholar] [CrossRef] [Green Version]
  72. Manfred, K. Retailing in the 21st Century: Current and Future Trends; Krafft, M., Mantrala, M.K., Eds.; Springer: New York, NY, USA, 2006. [Google Scholar]
  73. Preedy, V.R.; Watson, R.R.; Martin, C.R. (Eds.) Handbook of Behavior, Food and Nutrition; Springer Science & Business Media: Berlin, Germany, 2011. [Google Scholar]
  74. Bagnara, S.; Tartaglia, R.; Albolino, S.; Alexander, T.; Fujita, Y. (Eds.) Proceedings of the 20th Congress of the International Ergonomics Association (IEA 2018): Volume VI: Transport Ergonomics and Human Factors (TEHF), Aerospace Human Factors and Ergonomics; Springer: Berlin, Germany, 2018; Volume 823. [Google Scholar]
  75. Glynn, M.S.; Woodside, A.G. (Eds.) Business-to-Business Brand Management: Theory, Research and Executivecase Study Exercises; Emerald Group Publishing Limited: Bingley, UK, 2009. [Google Scholar]
  76. Yun, J.J. Business Model Design Compass: Open Innovation Funnel to Schumpeterian New Combination Business Model Developing Circle; Springer: Berlin, Germany, 2017. [Google Scholar]
  77. Rothwell, W.J.; Stavros, J.M.; Sullivan, R.L.; Sullivan, A. (Eds.) Practicing Organization Development: A Guide for Leading Change; John Wiley & Sons: Hoboken, NJ, USA, 2009; Volume 34. [Google Scholar]
Figure 1. The Service blueprint for a food and beverage business.
Joitmc 04 00053 g001
Figure 2. The structural model with interview results.
Joitmc 04 00053 g002
Figure 3. The number of design elements in a food and beverage service provision.
Joitmc 04 00053 g003
Figure 4. The result of the structural equation model for South Korea.
Joitmc 04 00053 g004
Table 1. Definitions of design in contemporary business (modified, Nam [27]).
Author(s)Contents
Kotler and Rath [25]Design is the process of seeking to optimise consumer satisfaction and company profitability through the creative use of major design elements (performance, quality, durability, appearance, and cost) in connection with products, environments, information, and corporate identities.
Gorb and Dumas [28]A course of action for the development of an artefact or a system of the artefact; including the series of organisational activities required to achieve that development
Krippendorff [24]The etymology of design goes back—means making something, distinguishing it by a sign, giving it significance, designating its relation to other things, owners, users, or gods. … design is making sense (of things). … design is a sense creating activity … the product of design is to be understandable or meaningful to someone … design is concerned with the subjective meanings of “objectively existing” objects …
Borja de Mozota [22]Design = Intention + DrawingDesign is a problem-solving activity, a creative activity, a systemic activity, and a coordinating activity.
Hands [26]Design is both an integral and intrinsic part of a variety of business cultures that provide a fertile seedbed for strategic growth and sustainable development
Table 2. Definitions of value from a holistic perspective (modified, Nam [27]).
Author(s)Contents
Woodruff [35]Customer value is a customer’s perceived preference for an evaluation of those product attributes, attribute performances, and consequences arising from use that facilitate (or block) achieving the customer’s goals and purposes in use situation.
Wagner [36]Value is the pleasure derived from perceiving, evaluating, and judging a product or some facet of a product.
Holbrook [37]Consumer value is an interactive relativistic preference experience.
Grönroos [15]Value for customers means that after they have been assisted by a self-service—or a full-service process—they are or feel better off than before.
Table 3. The criteria of design value in business.
Author(s)CriteriaNotes
Kotler and Rath [25]Performance
Quality
Durability
Appearance
Cost
Authors described the constituencies (criteria) of effective design with both product and process perspectives.
Gorb [40]Product
Environment
Information
Corporate Identity
The identification is derived from designers’ role and their value to business
Alben [41]Understanding of users
Effective design process
Needed/Desired
Learnable/Usable
Appropriate
Aesthetic experience
Mutable
Manageable
Categorized the direct contribution to products/services and the indirect effect for the superiority of process
Moultrie et al. [42]Desirability
Novelty/Differentiation
Usability
Technical quality
Profitability
Although the tool was developed for a product design audit, it can also be applied to a service design audit
Table 4. The customer emotions of perceiving value (modified from Holbrook, [37], p. 12).
ExtrinsicIntrinsic
Self-orientedOutput/Input, Convenience, QualityFun, Beauty
Other-orientedSuccess, Impression management, Reputation, Materialism, PossessionsJustice, Virtue, Morality, Faith, Ecstasy, Sacredness, Magic
Table 5. Measurement variables.
VariablesOperation DefinitionsReferences
Product & ServiceAppealing and enjoyableAppealing and enjoyable emotion through the products and servicesGorb [37]; Holbrook [37]
PersonalityOne has the desired character/personality is reflected by using the products and services
Social valueThe consumption contributes to helping other people in needs in some respects
EnvironmentOverall atmosphereAttractive and exciting location, building, interior and atmosphere of the store
The character of the spaceThe environment of the store reflect one’s desired character
Design considerationsThe presence of design considerations for people with disabilities
InformationThe relevance of information materialsAppropriate and consistent information materials for the store’s identity
The character of information materialsOne’s preference for the expression of information materials
Social message of visible materialsThe presence and relevance of the store’s social responsible activities
Corporate IdentityShop imageThe image of the store through design elements
Self-expression through the brandDesign elements of the store reflect one’s character
Social responsibility of the brandThe image of the store is ethical/moral in some respects
LoyaltyCognitive loyaltyStore A has more benefits than others in its classOliver, [55], p. 398.
Affective loyaltyI have grown to like Store A more so than other brands
Conative loyaltyI intended to buy from Store A in the future
Action loyaltyWhen I have a need for products and services of this types, I buy only from Store A
Table 6. The demographic information of the survey participant.
CategoryNumber of Participants (%)
GenderMale50 (50.0%)
Female50 (50.0%)
Age10–197 (7.0%)
20–2920 (20.0%)
30–3952 (52.0%)
40–4913 (13.0%)
50+8 (8.0%)
Time elapsed from the consumption experienceWithin a week37 (37.0%)
Within a month46 (46.0%)
Within three months11 (11.0%)
Within six months4 (4.0%)
More than six months2 (2.0%)
Table 7. The component matrix result (N = 100).
ItemsReflective ValueAppealing ValueLoyaltySocial Responsibility Value
Appealing and enjoyable0.2260.6420.2390.073
Overall atmosphere0.3390.7820.0790.080
The relevance of information materials0.0250.7710.1330.168
Shop image0.1810.9000.1580.095
Personality0.7820.1420.2010.191
The character of the space0.8270.3530.0790.109
The character of information materials0.7920.2270.1050.182
Self-expression through the brand0.8400.0700.1240.193
Social value0.275−0.0320.1100.780
Design considerations−0.0050.4230.2450.560
Social message of visible materials0.1470.1020.1090.820
Social responsibility of the brand0.2680.1350.1760.828
Cognitive loyalty0.1590.1660.8280.061
Affective loyalty0.0900.1650.8840.151
Conative loyalty0.0110.3080.7570.159
Action loyalty0.305−0.0230.6430.278
% of Variance Explained38.34712.00011.5788.427
Eigenvalue6.1351.9201.8531.348
Cronbach’s alpha0.8420.8890.8000.824
KMO = 0.818; Bartlett’s χ2 = 1708.771; p < 0.001. Extraction method: Principal component Analysis; Rotation method: Varimax with Kaiser Normalisation.
Table 8. The Chi-square difference test of each question for gender.
Variablesχ2 Differencedfp-ValueInvariant?
Appealing and enjoyable5.95050.311No
Overall atmosphere6.39050.270No
The relevance of information materials2.79250.732No
Shop image6.45860.374No
Personality12.35160.055No
The character of the space7.27160.297No
The character of information materials9.83860.132No
Self-expression through the brand4.27760.639No
Social value6.69260.350No
Social message of visible materials10.55260.103No
Social responsibility of the brand8.09660.231No
Cognitive loyalty4.61760.594No
Affective loyalty3.15960.789No
Conative loyalty3.98060.679No
Action loyalty9.67060.139No
N = 100; Gender * each variable.
Table 9. The validity and correlation analysis results.
CRAVEMSVAppealing ValueReflective ValueSocial Responsibility ValueLoyalty
Appealing value0.9100.7150.3791
Reflective value0.9150.7300.4500.6711
Social Responsibility value0.8820.7150.4500.4730.6161
Loyalty0.8800.6530.4240.6510.5590.5271
Table 10. The multicollinearity test result of variables.
DVAV_1AV_2AV_3AV_4RV_1RV_2RV_3RV_4SRV_1SRV_1SRV_1
AV_1n/a2.8842.3293.5572.3553.4772.9012.4882.3422.0262.298
AV_21.823n/a2.3363.0782.5063.1182.9232.4382.3101.9802.989
AV_31.8542.940n/a2.8492.4153.5032.6002.4212.3371.9572.997
AV_41.6442.2501.654n/a2.5273.4972.8592.4642.3162.2012.995
RV_11.7292.9102.2274.015n/a3.0852.7172.4902.3352.0202.992
RV_21.8462.6182.3374.0192.231n/a2.7522.2412.3382.0242.997
RV_31.8332.9222.0643.9102.3393.276n/a2.1552.3442.0082.976
RV_41.8532.8712.2653.9712.5263.1432.539n/a2.3291.9802.991
SRV_11.8582.9002.3303.9772.5253.4952.9432.482n/a1.9782.096
SRV_21.8592.8742.2564.0132.5243.4982.9162.4392.287n/a2.468
SRV_31.8512.9332.3364.0222.5293.5022.9222.4921.6391.669n/a

