1. Introduction
Policy makers all over the world are concerned with the provision of good conditions for income generation in their regions. In particular, policy is interested in supporting the attraction and emergence of new knowledge-intensive industries (see [
1] for a review). Regional innovation policy is considered as one of the most important policy instruments to support incomes by allowing a competitive industrial structure to emerge, thereby generating high-skilled and well-paid jobs (e.g., [
2]). The challenge for an effective policy design stems from the inherent uncertain nature of innovation processes and their multifaceted features. For example, decisions are to be made concerning the distribution of the policy attention between a support of prevailing industrial structures and the support of the emergence of new industries. This can be considered as the regional counterpart of the well-known firm level trade-off between
exploitation and
exploration [
3]. Whereas an exploitative regional innovation policy focuses on the strengthening of existing industries and eventually the attainment of global industrial leadership, the explorative policy design is embedded in long-term considerations to maintain a globally competitive industrial portfolio. Obviously, the exclusive focus on existing structures maximizes the support of short-term incomes but endangers sustainable income generation in a global environment characterized by structural change driven by innovation and knowledge development. In other words, designing regional innovation policy is also confronted with the well-known “not-invented-here syndrome”: on the firm level, the syndrome is responsible for the disappearance of established companies to be observed after radical innovations accompanied by
competence destroying technological progress [
4]. On the regional level, the syndrome leads to structural crisis with low incomes and high unemployment, when missing new industries cannot compensate for losses of disappearing mature industries.
Because of the interaction between
short-term structure conserving goals and
long-term structural adaptation targets and the increasing uncertainty involved with long-term development driven by innovation, this situation is characterized by high complexity [
5]. Ponsiglione et al. [
6] rightly consider regional innovation systems as an example par excellence for complex adaptive systems. Together with the requirement to consider the involvement of different actors, ranging from established firms, start-up companies, universities, and government laboratories to consumers and their expectations as well as the meaning of so-called innovation networks, complexity increases even further. Most of the existing attempts in regional economics to support regional innovation policy design are still embedded in an optimization approach within an equilibrium orientation and assuming representative actors (e.g., a regional production function). These approaches are to be considered as oversimplifying and not at all informative for policy makers [
7].
To overcome this failure, the concept of
regional innovation systems (e.g., [
8]) was introduced, which explicitly highlights the complexity of innovation processes from an evolutionary economics point of view [
9]. This includes the involvement of heterogeneous actors, the underlying strong uncertainty and regional particularities concerning institutions, as well as path dependencies. One of the major advantages of the concept of regional innovation systems is that they include, besides firms engaged in innovation, also public research organizations, entrepreneurial activities and policy, and highlight the complex interactions between these entities. As a consequence, regional innovation systems behave like complex adaptive systems not accessible with standard econometric approaches, which built on linear input–output relationships in innovation and approximate knowledge in simplified ways, e.g., by research and development (R&D) investment. This way, characteristic feedback effects, time delays, and other dynamic and non-linear effects are often neglected. In particular, long-term knowledge-driven development of regional innovation systems and structural adaptations get out of sight.
Although the idea of regional innovation systems started with a descriptive perspective, meanwhile it has become a field that increasingly attracts modeling activities in order to be in a position to support policy makers with valuable information and knowledge in so-called policy laboratories, back-boned by computational models, in particular so-called agent-based models (ABM). ABM provide a powerful tool for modeling most salient features of an innovation system in a virtual simulation environment, running ceteris paribus policy experiments and analyzing the economic consequences of these interventions from various angles.
The aim of this paper is to introduce the reader to a policy laboratory designed for a region in the southwest of Germany, namely Heilbronn-Franken, to support the design of future-oriented policy instruments (see also [
10,
11]). We begin in
Section 2 with a critical review on the way knowledge and learning is treated in economics and the introduction of an alternative view of knowledge generation processes in innovation networks.
Section 3 briefly introduces the methodology of policy laboratories and agent-based modeling and shows why these concepts are suited to improve policy consulting from a regional economics perspective.
Section 4 and
Section 5 highlight some experiments from our VISIBLE project. In
Section 6, we draw conclusions and point out promising avenues for future research.
2. From Technological Spillovers to Innovation Networks
In the 1950s, Robert Solow [
12] published a seminal paper in which he showed that the bulk of U.S. growth between 1850 and 1950 could not be explained with the quantitative increase of labor and capital. He concluded from his so-called
growth accounting study that technological progress must be by far the most important driver of economic growth. His growth theory [
13], which was already published one year earlier, built on this observation but missed the opportunity to endogenize innovation processes. Instead, in his model, new technological knowledge falls like
Manna from Heaven and from time to time pushes a macroeconomic production function exogenously towards higher outputs, thereby allowing one to escape the trap of diminishing growth rates. This non-satisfactory detail was only cured in the 1980s when the so-called
new growth theory was introduced, e.g., by Paul Romer [
14], among others. The trick to generate non-diminishing growth rates is to endogenize innovation by referring to positive feedback effects of R&D: because of the assumed public good nature of new technological knowledge, not only the innovating company benefits from its R&D activities, but also the knowledge spills over into the whole economy. Knowledge spillovers are positively interpreted as
idea-creating effects in new growth theory.
Unfortunately, what seems to be the solution for Solow’s problem concerning the understanding of economic growth on a macroeconomic level is at odds with how knowledge is treated on the industry level in the literature of industrial economics and industrial organization. There, also inspired by the work of Robert Solow, since the 1950s, a growing literature was interested in understanding innovation and R&D on a firm and industry level. Latest since Kenneth Arrow’s [
15] most influential paper, mainstream economics considered the public good nature of new technological knowledge the major point of interest in the economic analysis of firm level innovation processes. According to Arrow, new technological knowledge shares with public goods the feature of
non-rivalry and thus is transferred involuntarily and unavoidably in the form of technological spillover effects. Therefore, like in the case of public goods, the economy is confronted with a market failure. Firms cannot appropriate the innovation rents because they lose costly generated knowledge to competitors, which are characterized by free-riding behavior. So, instead of the positive interpretation as
idea-creating effects, knowledge spillovers are interpreted in a negative way as
incentive-reducing effects. From this, the whole interest of mainstream innovation economics until today is centered around the mission to repair this market failure by restoring the incentives and lifting R&D investments to a socially optimal level. An optimal amount of new technological knowledge therefore is guaranteed by (i) the production of new knowledge in public research institutes and universities, (ii) subsidizing R&D on the firm level in order to restore missing incentives or (iii) institutionally generated intellectual property rights like patents.
To illustrate this view, we introduce a simple model, which will be expanded stepwise to reflect the critical discussion on this view of new technological knowledge as a public good. Equation (1) resembles the production function of a firm
i. In addition to traditional input factors, this production function includes knowledge generated by the firm and knowledge generated by other firms, which due to the public good nature is available for firm
i in the form of a so-called spillover pool
Zi. New technological knowledge is approximated following the mainstream analysis of innovation processes with the help of the investment in R&D activities.
yi = Output of firm i
xi = Inputs in the production of firm i
ri = R&D expenditures of firm i
Zi = Spillover-Pool of firm i
β = Spillover-Parameter; β between 0 (private good) and 1 (public good)
rj = R&D-expenditures of another firm j.
It is important to note that this kind of knowledge transfer between different firms happens involuntarily and depends only on the so-called spillover parameter β, which is 1 if knowledge is considered to be a purely public good.
Equation (2) describes the assumed incentive-reducing effect: with a growing spillover parameter
β, the investment in R&D is decreasing and, with it, the rate of production of new knowledge. In the extreme case of
β = 1, the incentives to invest in R&D completely disappear.
This leads to the negative interpretation of technological spillovers: the private incentives to invest in R&D are smaller than the social optimal incentives and the abovementioned policy instruments are supposed to repair this market failure.
Although Arrow’s characterization of knowledge as a public good prevails in mainstream economics until today, from the very beginning also alternative theories have expressed a critical view. Most famous is Michael Polanyi’s [
16] observation that by far not all knowledge is codifiable, but that larger parts of knowledge are implicit and cannot easily be transferred—and certainly not involuntarily. He coined the notion of
tacit knowledge for this part of the knowledge, which restricts the spillover pool. Later in the 1960s, Atkinson and Stiglitz [
17] added another restriction to the view of knowledge as a poor public good: the microeconomic theory of production assumes that within a production technology there are infinite possibilities to substitute between different production factors. In reality, however, only single production points are defined to represent meaningful technological possibilities. This means that knowledge behind process innovations, which affect single technologies in the production space, is not automatically globally useful for other technologies. Instead, in many cases, technological progress is
local and technically cannot spillover to neighbored but different technologies, i.e., not the whole isoquants are affected and shifted towards the origin of the production space, but only single points. Both observations, the tacit and local character of new technological knowledge lead to a reduction of the spillover parameter
β to values significantly lower than 1 and, accordingly, the incentive-reducing effect must be lower than assumed in mainstream economics.
Mansfield, Schwartz, and Wagner [
18] empirically showed that
β is much smaller than 1 in a study, which compares imitation time and costs with innovation time and costs. In the case of large spillover effects, the imitation time and costs should be significantly lower than the innovation costs and time. However, in their study, this is not true for most cases investigated; in several cases, the imitation time and costs are even higher than the original innovation time and costs. The famous
Yale Survey by Levin et al. [
19] points into a similar direction. The authors tested the popularity of different means to appropriate innovation rents and found that formal instruments like patents are not used more frequently than other informal instruments like secrecy and first mover advantages. This also points to the observation that new technological knowledge cannot be characterized as a purely public good, but that other features may prevent an immediate leakage of knowledge.
Inspired by these observations, Cohen and Levinthal [
20] introduced a new concept into this discussion, which highlights prerequisites of knowledge absorption on the receiving side: In order to understand new technological knowledge and to apply it for own purposes, the receiving firms need to have prior knowledge, which Cohen and Levinthal labelled
absorptive capacities. In order to build up absorptive capacities, firms need to invest in their own R&D, thereby counteracting the potentially incentive-reducing effects of technological spillovers. Equation (3) introduces absorptive capacities µ into our model:
From (3) it follows that even if β = 1, it is not clear whether third parties may benefit from spillovers. They have to provide absorptive capacities µ to integrate the spillover effects. To cut a long story short, the possibility of freely available knowledge in the form of spillover effects can also be considered as a positive incentive contributing to the level of R&D efforts.
To complicate matters even further, in the 1980s, innovation economics also introduced the concept of
technological opportunities (e.g., [
19]). In industries with rich opportunities, we find stronger R&D activities compared to industries with low technological opportunities (e.g., compare biotechnology and textiles). Most importantly, technological opportunities of different technologies are not independent but may influence each other. So-called cross-fertilization effects (or technological complementarities) create rich new technological opportunities (e.g., bio-informatics, CNC-machine tools, optoelectronics, etc.). Technological advances in some technologies can even have an impact on the overall technological development (e.g., computer technologies, dynamo, mass production…). For this deep effect, the term general purpose technologies is used.
We can introduce the concept of technological opportunities
Ti into our model. Equation (4) illustrates that this finally leads to a dead end of this discussion of innovation processes because no clear conclusions can be made without introducing further assumptions.
The standard interpretation of neoclassical innovation economics assumes a substitutive relationship and, therefore, the effect of a growing spillover pool on technological opportunities is negative (<0). In the modern evolutionary economics approach, the idea-creation effects of spillovers are dominant and, therefore, the sign of the deviation
is positive. This result corresponds with the outcome of mainstream models of process innovation (e.g., [
21]) and illustrates that the analysis of innovation processes using the accumulated R&D expenditures as an approximation of firm knowledge has its limits. It furthermore illustrates the fundamental difference between the concept of incentive-reducing and idea-creating spillover effects, which can be considered as one of the most important demarcation lines between mainstream and evolutionary innovation economics. Consequently, the policy conclusions in evolutionary economics are fundamentally different: instead of reducing technological spillovers, emphasis is placed on fast knowledge transfer and R&D cooperation in innovation networks. The problem identified is not a too high rate of knowledge diffusion but a too low rate in order to realize cross-fertilization and synergies.
These insights finally start to become accepted in the analysis of innovation processes since the late 1980s. Instead of R&D expenditures as an approximation of innovation, the knowledge base of companies and firm learning moved into the center of interest. In the evolutionary camp, Giovanni Dosi ([
22], p. 225) was highlighting that “[f]irms cannot produce and use innovations by dipping freely into a general ‘stock’ or ‘pool’ of technological knowledge.” In a similar vein, Paul Geroski ([
23], p. 85) followed this view for the neoclassical camp: “In particular, what often appears to be an involuntary flow of knowledge between firms may be nothing more than a pair of draws from a narrow but common pool shared by a group of agents within a common set of problems.” The focus on technological spillovers was increasingly replaced by the idea of knowledge flows in innovation networks [
24]. In modern innovation research, innovation networks are considered as an advantageous organizational device for complex innovation processes. Imai and Baba ([
25], p. 389) were among the first to emphasize the need for a systemic analysis of innovation processes: “The dominant mode of innovation is systemic. Systemic innovation is brought about through the fission and fusion of technologies; it triggers a series of chain reactions in a total system… The interactive process of information creation and learning is crucial for systemic innovation. The characteristic trait of the new industrial society is that of continuous interactive innovation generated by the linkages across the borders of specific sectors and specific scientific disciplines”.
With this, the idea of innovation systems was born (e.g., [
26,
27]) in which Nelson’s [
28] suggestion to treat new technological knowledge as a
latent public good, is widely accepted. This offers the perspective to treat innovation processes as open experimental processes with knowledge inputs from diverse and heterogeneous actors, encompassing start-up companies, established firms, universities, and public research organizations, the demand side as well as government agencies.
Be it national, regional, sectorial, or technological, innovation systems have enjoyed a high popularity in innovation research and innovation policy for more than 25 years. Because the theory highlights the importance to distinguish between different economies, different regions, and different industries, the approach has been applied so far almost solely in a descriptive fashion. However, with the availability of simulation models in economics, the high complexity of innovation systems has become the target of formal model building (e.g., see also [
29]).
3. Agent-Based Models, Policy Laboratories, and Regional Development
The following paragraphs briefly illustrate the application of agent-based models in so-called
policy laboratories, which are an innovative approach to improve our understanding of complex innovation processes and help to improve policy designs by offering the opportunity to test the impact of various instruments in complex adaptive systems. For several years, policy laboratories have been considered as valuable tools to inform policy makers in complex decision-making processes (e.g., [
6,
30,
31]). The
policy laboratory notion stems from the possibility to use these models experimentally together with decision makers from innovation policy, to study the dynamics of complex systems and the possibility of governing their development [
32].
Agent-based modeling is a computational methodology (see among others [
33]) that allows the analyst to create, analyze, and experiment with artificial worlds populated by agents represented by computer programs that interact in non-trivial ways. Agents are units that have behavior and act within a (simulated) environment. Agents can react to other agents, pursue goals, communicate with other agents and move around within the environment [
34]. Through the interaction, a complex system is established in which macro-level features can emerge from the interaction of agents on the micro-level. These features of agent-based models are required to study the evolution of innovation systems (e.g., [
35]): in innovation systems, heterogeneous agents are exchanging knowledge, learning from each other and jointly generate new knowledge. The knowledge flows are channeled in dynamic innovation networks generated on the one side by the agents’ interaction, but which are also influenced, on the other side, by policy interventions to spur innovation processes, e.g., within a region.
The focus of agent-based models is—due to the procedural character—on the understanding of the underlying system’s behavior. Therefore, agent-based models do not focus on the explanation of causal mechanisms, but develop tools to understand the system’s evolution and the impact of interventions into the system. In other words, agent-based models allow to investigate complex systems. However, the disclaimer remains that agent-based models remain models and, thus, despite their large possibilities, are like all other models simplifying and abstracting from reality. This has to be kept in mind, particularly because the models are supposed to be used together with policy makers in policy laboratories.
Compared to mainstream innovation models in economics, the agent-based models are not squeezed into the corset of a set of strong assumptions but offer a high degree of flexibility concerning the implementation of innovation processes. For example, instead of optimization, trial and error in an uncertain innovation process are central to capturing knowledge creation and diffusion processes among heterogeneous actors, which replace the idea of a representative firm. Therefore, it is likewise easier to recognize the modelled situation and to reflect the parallels to the real world. Most importantly, the models can be adjusted to the particularities of single economies, regions, and industries, e.g., by calibrating the set of actors according to the real-world observations. Furthermore, the system development can be analyzed from various perspectives, reflecting e.g., the role of government agencies, firms, entrepreneurial activities, and/or research institutes. The decisive advantage from the economics of knowledge perspective (see
Section 2) is that this class of models is suited to focus on knowledge flows among heterogeneous actors in innovation networks (for a fundamental reference see [
36]) and on the evolution of the underlying network structures.
This way, these computational models allow to integrate regional and national actors that, besides firms, influence innovation processes and usually are considered as being the immediate carriers of innovation policies (e.g., universities and different government agencies such as transfer institutions, facilities to support entrepreneurship etc.). However, not only is the possibility to add other actors important, but so is the possibility to consider different ways how these diverse actors are connected in innovation networks [
37]. The important role of innovation networks is responsible for a further level of complexity in the evolution of the underlying innovation systems. In particular, feedback effects between micro-, meso-, and macro-levels of the system [
38] are responsible for non-linearities and emergent behavior. In other words, although single systems might be considered as likewise similar, they might be supposed to drastically varying reactions concerning the application of single instruments from innovation policy [
5]. In the case of regional innovation systems, [
39] empirically shows that the effects of similar policy interventions can differ strongly between different regions. To make things even more complicated, policy interventions do not unfold their effects in isolation. Instead, “[…] each new policy instrument will clearly interact with and affect existing policy instruments in a complex and often unpredictable manner.” ([
40], p. 167). These surprising deviations from expected results in a benchmark-oriented policy design remain unexplained in mainstream analysis but become visible in agent-based models including an adequate level of complexity. Therefore, this class of models is considered as a means supporting policy learning [
41], because policy makers are confronted with the same uncertainty as other actors and cannot apply a rationale relying on optimization and focusing on welfare maximization.
The amalgamation of regional models of innovation systems and agent-based models generates specific simulation models that allow the explicit consideration of regional particularities and a close interaction with empirical research by a multifaceted and flexible use of regional data. This
validation of the agent-based model helps to transfer the model into a policy laboratory, which can be used to test alternative policy interventions. Gilbert et al. [
42] emphasize that it is important to keep an adequate level of abstraction. Otherwise, the model quickly can become uncontrollable. Here, a conflict between the possibilities of the modeler and the expectation of policy makers might emerge. Generally, the involvement of policy makers in the design of the model improves its relevance. However, it also asks for a strong effort in communication to avoid misunderstandings and potentially arising ethical issues, e.g., if policy makers cannot translate the qualitative results of the experiments and attempt to use the simulation platform as a kind of crystal ball to predict concrete future developments.
4. The VISIBLE Laboratory
4.1. Introducing the VISIBLE Simulation Environment—Aim and Scope
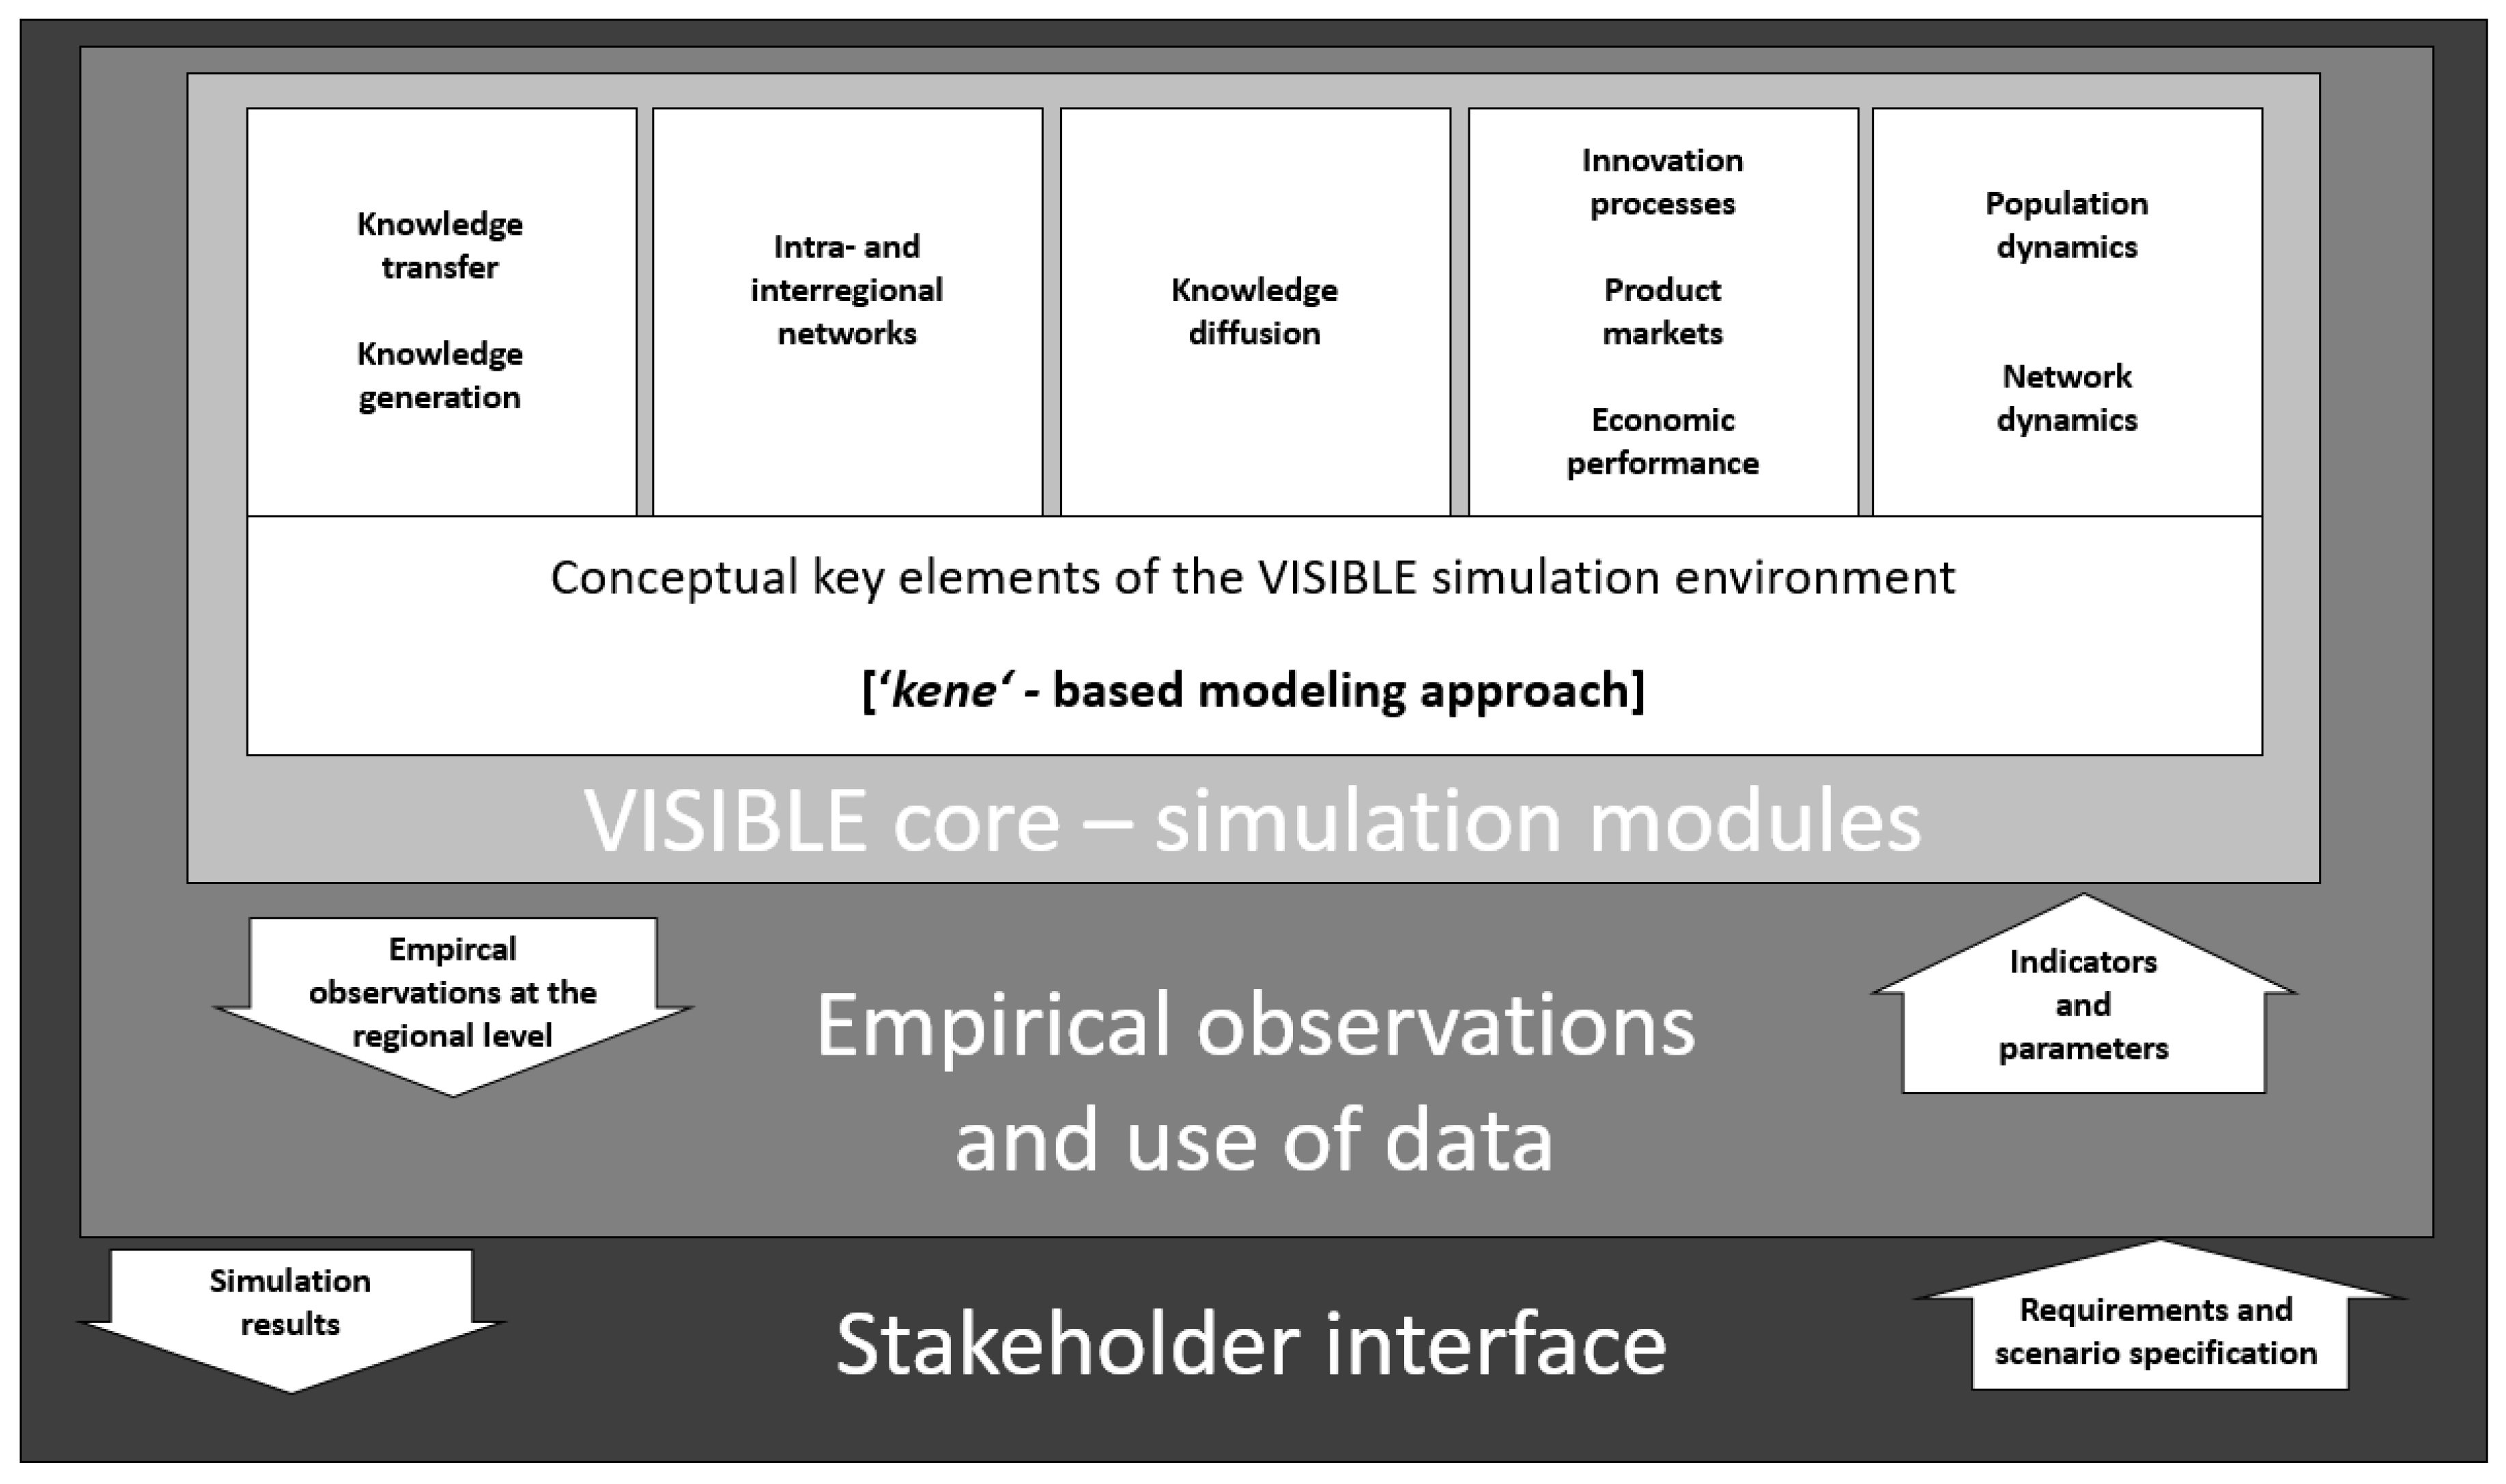
VISIBLE (Virtual Simulation Lab for the Analysis of Investments in Learning and Education) represents a set of conceptually related agent-based simulation modules designed for ex-ante policy evaluations against the backdrop of empirical observations and stakeholder requirements. The modularity of the VISIBLE simulation environment allows for specifying and aligning the direction and scope of a simulation analysis both conceptually and analytically.
Figure 1 provides a schematic illustration of the VISIBLE simulation environment, composed of three closely interrelated conceptual layers: (i) VISIBLE core—simulation modules, (ii) empirical observations and use of data, and (iii) stakeholder interface.
To start with, we take a glance at the first layer, shown at the top of
Figure 1. There is a longstanding debate in the literature on the level of complexity of an ABM. The modeler always faces the common trade-off between setting up rather simple models vs. specifying models with high attention to detail. Since each VISIBLE simulation module is deliberately narrowed down to a particular thematic issue, we always try to keep the model as lean as possible by following either the KISS approach (“
Keep It Simple, Stupid”) or the TAPAS approach (“
Take A Previous model and Add Something”). As a consequence, the VISIBLE core consists of a set of very focused but complementary simulation modules (see for example: [
35,
43,
44,
45]).
The common denominator of all VISIBLE simulation modules is the use of the “kene”-concept in an organizational context. Agents are considered to be organizations such as firms, universities, private or public research facilities, or other organizational entities actively involved in regional innovation processes. Central to this approach is its novel way of representing the knowledge stock of organizations. According to Gilbert [
46], the knowledge stock of an agent can be fully described by a number of “units of knowledge”, while each unit of knowledge is represented by a triple of an organizations’ capability
C, an ability
A, and the expertise level
E. The knowledge
of an organization
can thus be written as shown in (5):
In this context, the respective capability refers to the general technological or business domain (e.g., biochemistry), represented by an integer. Its ability is the indicator for the application in this field (e.g., a synthesis procedure or filtering technique in the field of biochemistry). Finally, the expertise level gives information about the expertise of the firm in that particular field gained so far (see also [
7]).
The second layer in
Figure 1 accounts for the use of empirical information and data. First and foremost, enriching the model by using empirical data does not mean to replicate or mirror a regional innovation system in all its detail. Instead, the integration of empirical data for a limited number of variables can provide important reference points for the simulation and tailor it to particular regional circumstances. At the same time, one strength of ABM becomes an obstacle when it comes to empirical validation and calibration. For instance, due to the fine-grained but highly abstract nature of the knowledge representation in the model, some conceptual elements do not find empirical counterparts (e.g., the parameter settings defining the range of capabilities, abilities and expertise levels). ABM allows for generating data endogenously, particularly for not directly observable determinants, as long as the underlying mechanism is theoretically well-informed and understood. Hence, the use and integration of empirical data is typically restricted to a limited number of variables in the model. This includes variables such as number of firms, firm size, firm age, number of cooperation partners etc. In some models, a complete renouncement of empirical data is reasonable since the analytical focus is more general in nature.
The third layer refers to the importance of stakeholder involvement along all stages of ex-ante policy evaluation exercises. The analytical focus of VISIBLE is guided by real-world problems that may occur along the way from an inventor’s initial idea to the successful commercialization of an invention. Stakeholders may bear the potential to significantly incentivize, fuel or hamper innovation processes. Successful specification and implementation of systemic interventions needs taking into account all the requirements, perceptions, and restrictions of decision-makers and other stakeholders involved. Having said this, the VISIBLE simulation environment can be used in two ways. On one hand, VISIBLE can be used to explore regional innovation systems, gain an in-depth understanding of system properties, processes, and mechanisms, and identify potential system failures that may hamper or even mitigate innovation activities of actors involved. Insights gained from this analytical exercise are critically reflected on and questioned against the backdrop of empirical observations and finally used to brief stakeholders and sensitize them for otherwise eventually neglected particularities of the analyzed system. On the other hand, VISIBLE provides an in-silico policy laboratory for a systematic ceteris paribus analysis of well-targeted policy interventions and subsequent economic consequences. Or to put it differently, in the context of complex adaptive systems where optimal reference constructs for the evaluation of alternatives are missing, ABM provides a powerful tool to reveal and compare the system’s potential outcomes of interventions prior to their implementation. Stakeholders play an important role in this context. They ensure the modeling, integration, and analysis of realistic policy intervention.
4.2. An Application
The following section describes a simulation line-up that is based on the VISIBLE simulation environment. It represents an ex-ante policy simulation laboratory designed to reproduce the innovative competition and knowledge generation within regions and analyze interventions and related economic consequences. The focus of our exercise is to demonstrate the possibilities of ABM. In more detail, we aim at showing how ABM can be used within a regional context to identify and analyze important effects of the underlying network structure that have to accounted for when designing policy instruments to foster regional innovativeness.
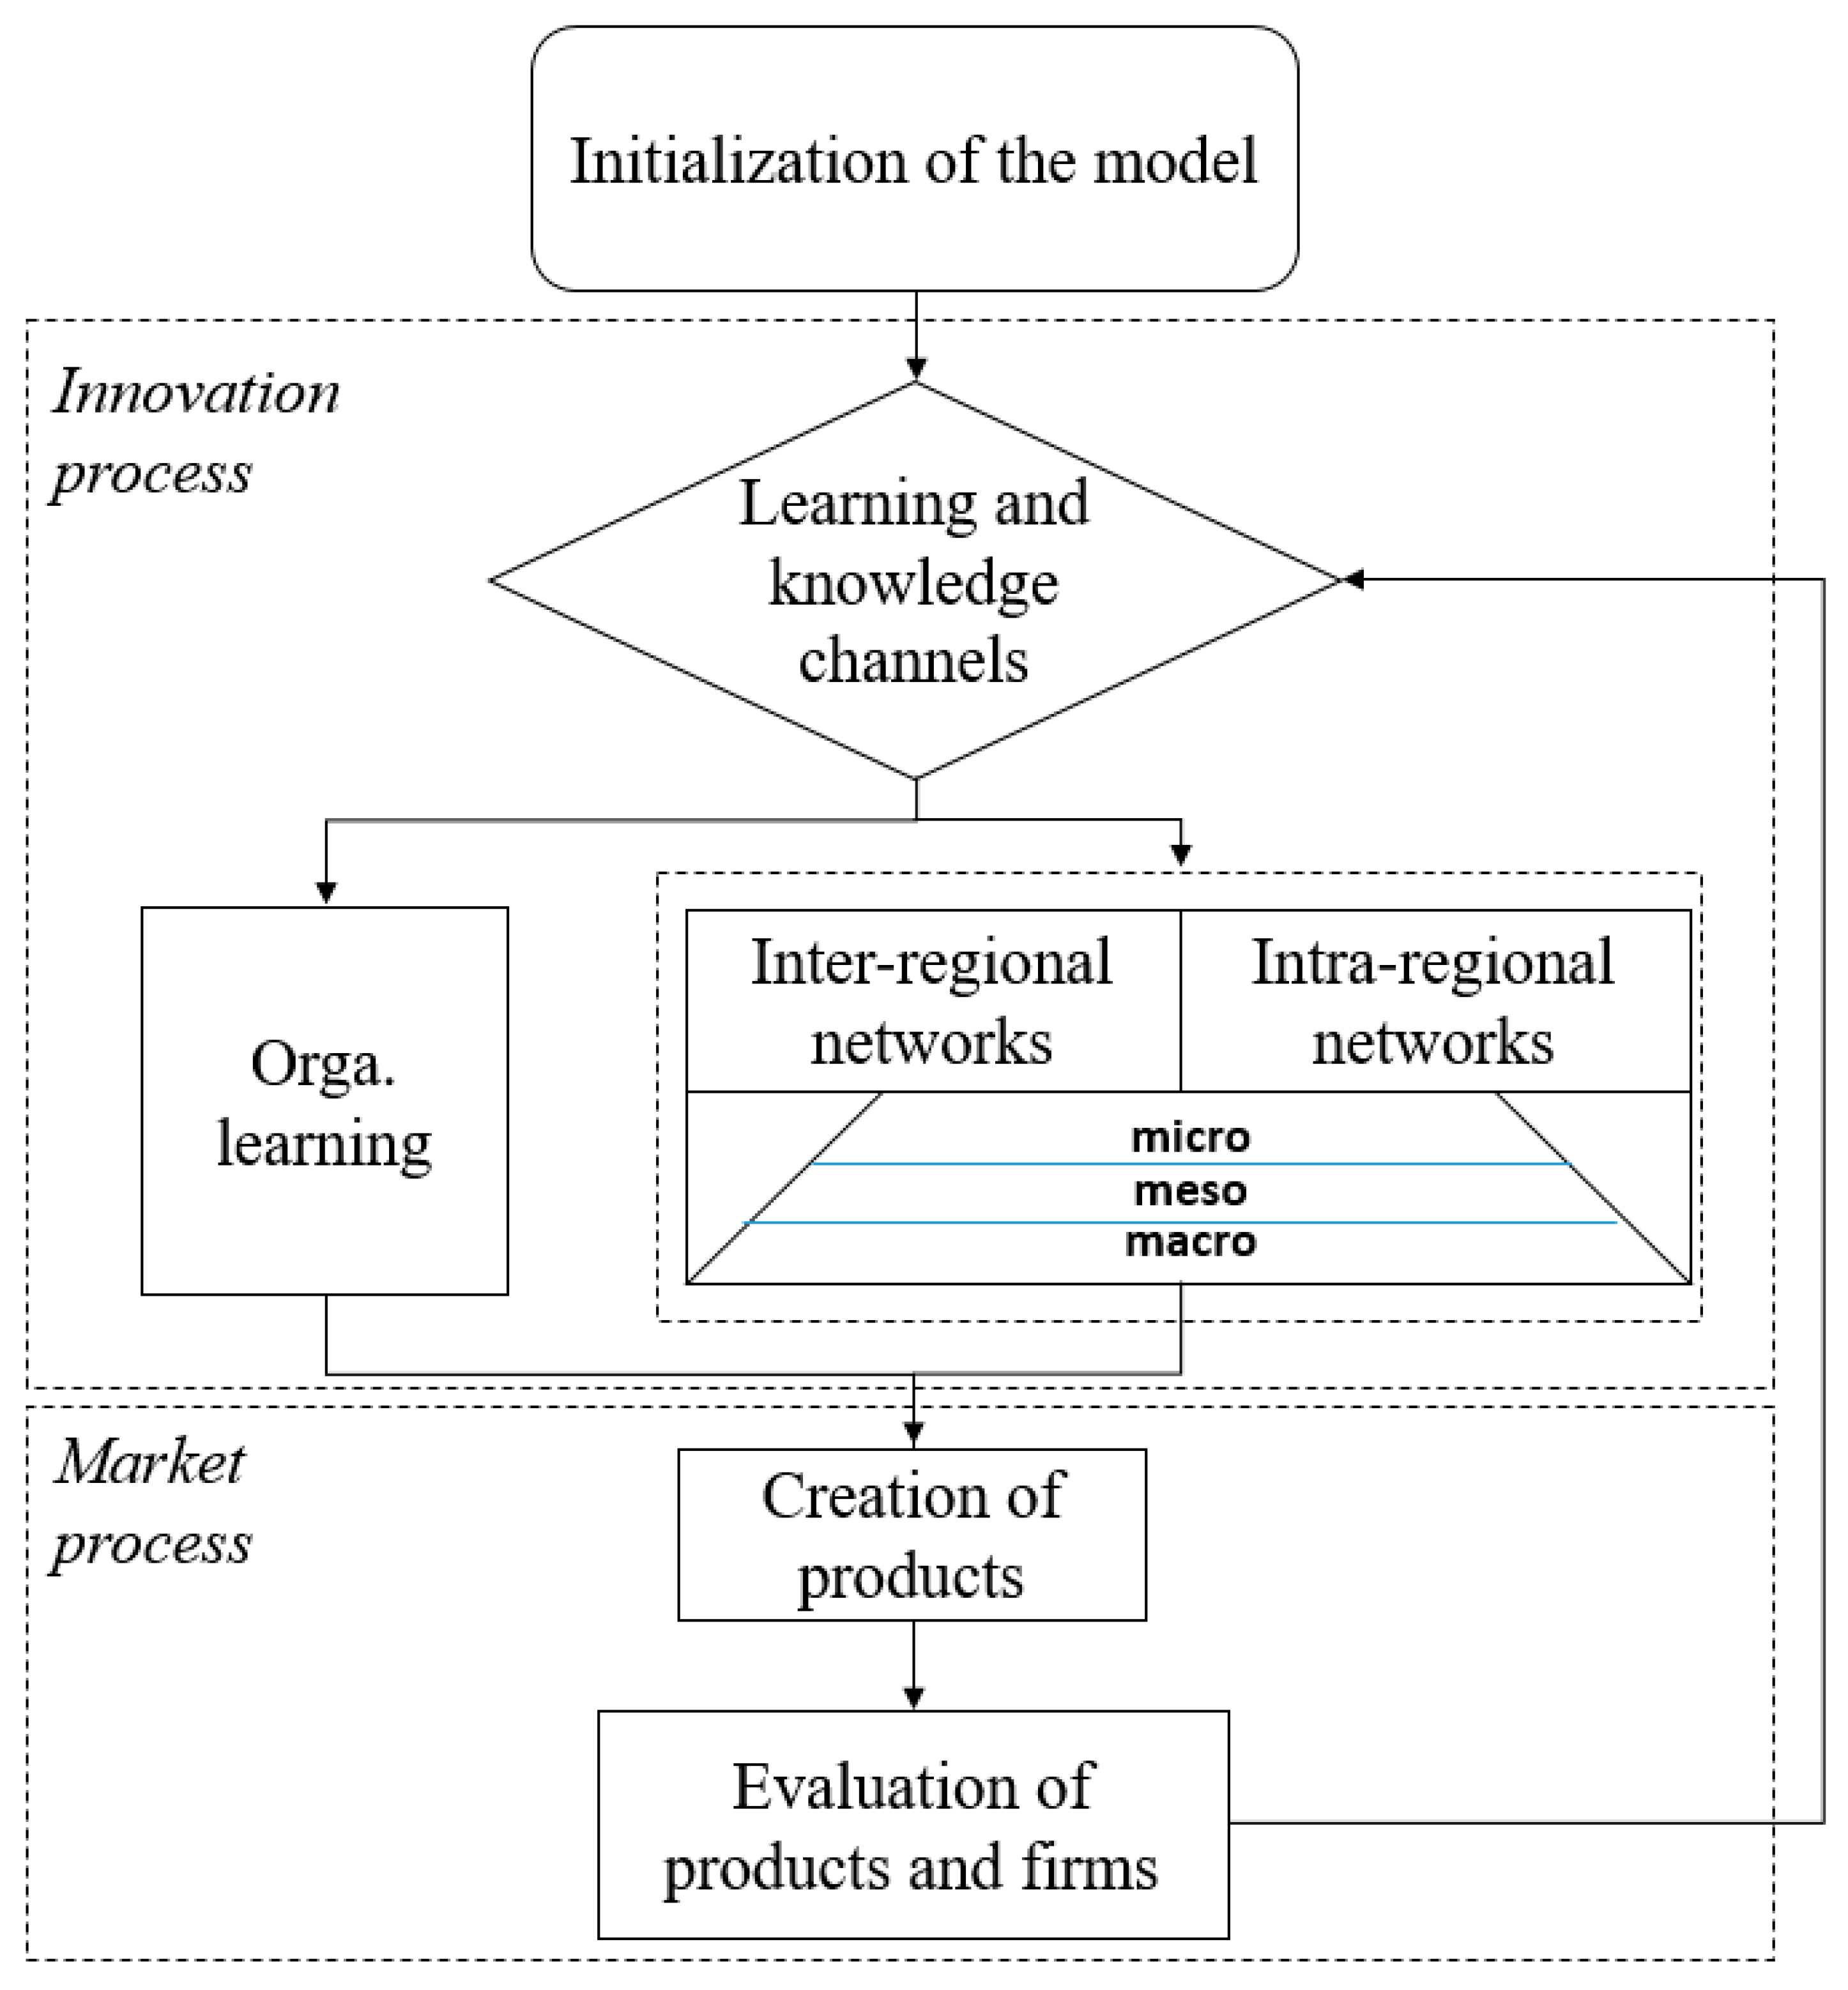
Figure 2 provides a schematic overview of the simulation modules employed to demonstrate the usability of ABM for ex-ante policy evaluation in a regional context. The simulation starts with an initialization procedure. Initial parameter settings of the simulation are typically informed by using empirical data and background information for region under investigation. During this initialization procedure, the regional model is populated by a fixed number of firms. These firms are assumed to engage in an innovation process with the goal to generate novel products. The innovation process module in our simulation allow firms to use alternative learning and knowledge access modes. In this example, we assume that firms have the possibility to generate new knowledge through the initialization of intra-organizational learning processes on the one hand, and through cooperation with partners located within the same region or partner located outside the region, on the other hand. An integrated market process module evaluates these products and rewards the firms for their innovative activities. This procedure is repeated for a fixed number of simulation steps.
Based on the preceding considerations we turn our attention now to the detailed description of the simulation.
Drawing on the kene approach, we assume that products are unique combinations of two non-identical knowledge units. These combinations of knowledge units are referred to as innovation hypotheses of firms and are assumed to consist always of two non-identical knowledge units. A special feature of our model is that firms can produce several products simultaneously. As stated previously, firms in the region face innovation competition, i.e., their product and service portfolio are permanently supposed to obsolesce, meaning that they have to innovate. Innovation is conceptualized as an experimental testing of new (competence) combinations on a market, which is confronted with strong uncertainty. New products are included into the firm´s product portfolio or rejected if the profits generated by the product is smaller than a given threshold.
To evaluate a product´s profit we use a market model that evaluates the profit of a product (
) by the following factors (For a detailed description and in-depth discussion of the model, see: [
10,
11]):
- ▪
Potential demand for a product, i.e., for that combination of knowledge drawn from an exponential distribution ,
- ▪
Expertise levels within the respective knowledge units used weighting the experience of a firm,
- ▪
Competition factor (How many other firms in that region produce the same product) ,
- ▪
A time factor which defines the end of a products life circle .
The profit function hence can be written as:
To face the impending obsolescence of their products, firms engage in several activities to improve their existing knowledge and gain new knowledge. In particular, in the VISIBLE simulation model, we differ between three levels of learning, i.e., improving and gaining knowledge:
learning by doing/forgetting by not doing,
Intra-organizational learning (R&D),
knowledge access and acquisition through intra- and inter-regional cooperation,
As the first central element of firms´ learning capabilities, we assume that firms gain experience by using their knowledge. For every knowledge unit which is used for the production of a product, the expertise levels in the respective knowledge units are increased by one with a chance of 50%. On the other hand, firms lose expertise for knowledge that is not used for the production of products and thus remains unused. The expertise levels in these knowledge units are decreased with a chance of 50%. Finally, if the expertise level in a knowledge unit reaches the level of 0, the firm forgets the knowledge unit and removes it from its kene.
The key element of the simulation, however, is that firms can access different sources for new knowledge. We differ in this context between R&D, networks of cooperation, and enticement of specialized and skilled employees. For all three sources, we assume crucial differences in terms of the novelty of new knowledge (both in the regional but also on a firm level) and the problems of integrating the new knowledge within an existing body of knowledge of a firm.
Intra-organizational learning (R&D), as a potential knowledge source, reflects a firm´s capability to create new knowledge by its own efforts. By now, it is well-recognized that a firm needs a certain level of knowledge in order to identify, access, and generate new knowledge and use it to commercial end [
20]. It is important to note that knowledge created by intra-organizational learning processes is always related to existing knowledge of the firm.
As the second knowledge source, the simulation model assumes networks between firms located in the same region. We assume that every firm can receive and copy the existing knowledge of a cooperation partner with a constant probability. However, we have to consider that the knowledge shared is not new in the region. To analyze the importance of the network topology within cooperation networks, we apply four different network algorithms that are discussed in the literature and create structurally different network topologies (see also [
47,
48] for a detailed discussion on the four network algorithms). The four network algorithms are the (i) Erdős–Rényi random network [ER], (ii) Barabási–Albert network [BA], (iii) Watts–Strogatz network [WS], and (iv) Evolutionary network [EV]).
Finally, firms can also acquire new knowledge through inter-regional networks, i.e., from outside the region. In contrast to other knowledge sources, this knowledge is completely random and hence can enable firms to produce radically new products. However, it also is the most difficult knowledge to integrate in an existing kene.
Learning new knowledge units within the VISIBLE model covers two important aspects from the discussion in
Section 2. First, with reference to the limited absorptive capacities of firms, we assume for all three knowledge sources different expertise levels of the new knowledge units. Creating new knowledge through R&D benefits from the experience gained in other knowledge fields, which is why we assume that knowledge units learned through R&D have high expertise levels. Learning through networks creates knowledge with medium expertise levels and receiving knowledge units from outside the region leads to minimal expertise levels. At the same time, the model incorporates the fact that receiving new knowledge does not automatically lead to positive effects. Firms have to be able to make use of the new knowledge, which strongly depends on their existing knowledge stocks.
5. Simulation Results
The discussions in
Section 2 sensitize for the fact that the mainstream economic understanding of knowledge as a public good is insufficient for understanding innovation processes in a systemic context (see also [
49], on a related discussion). The following simulation exercise aims at demonstrating the potential of new computational approaches to gain a comprehensive picture of how firms access and use knowledge via networks in their efforts to generate innovative products and services (see also [
10,
11] for other applications of the VISIBLE model). In doing so, we start with an analysis at the overall network level and explore the relationship between different types of network topologies, firm innovativeness, and the economic performance of actors. Next, we zoom into these networks to disentangle in which way firms’ specific network positions and roles may affect and/or explain the outcomes observed at the overall level. To reduce random effects of the simulation, the results presented are the average of 2000 simulation runs with the same parameter setting (if not stated otherwise). For the following analysis, we focus as output variables on the average and individual rewards of firms within our artificial region over time or and the end of a simulation run.
Table 1 shows the standard setting of parameters used (other output variables, e.g., the number of products per firm or the average reward per product have also been analysed and reveal the same qualitative results).
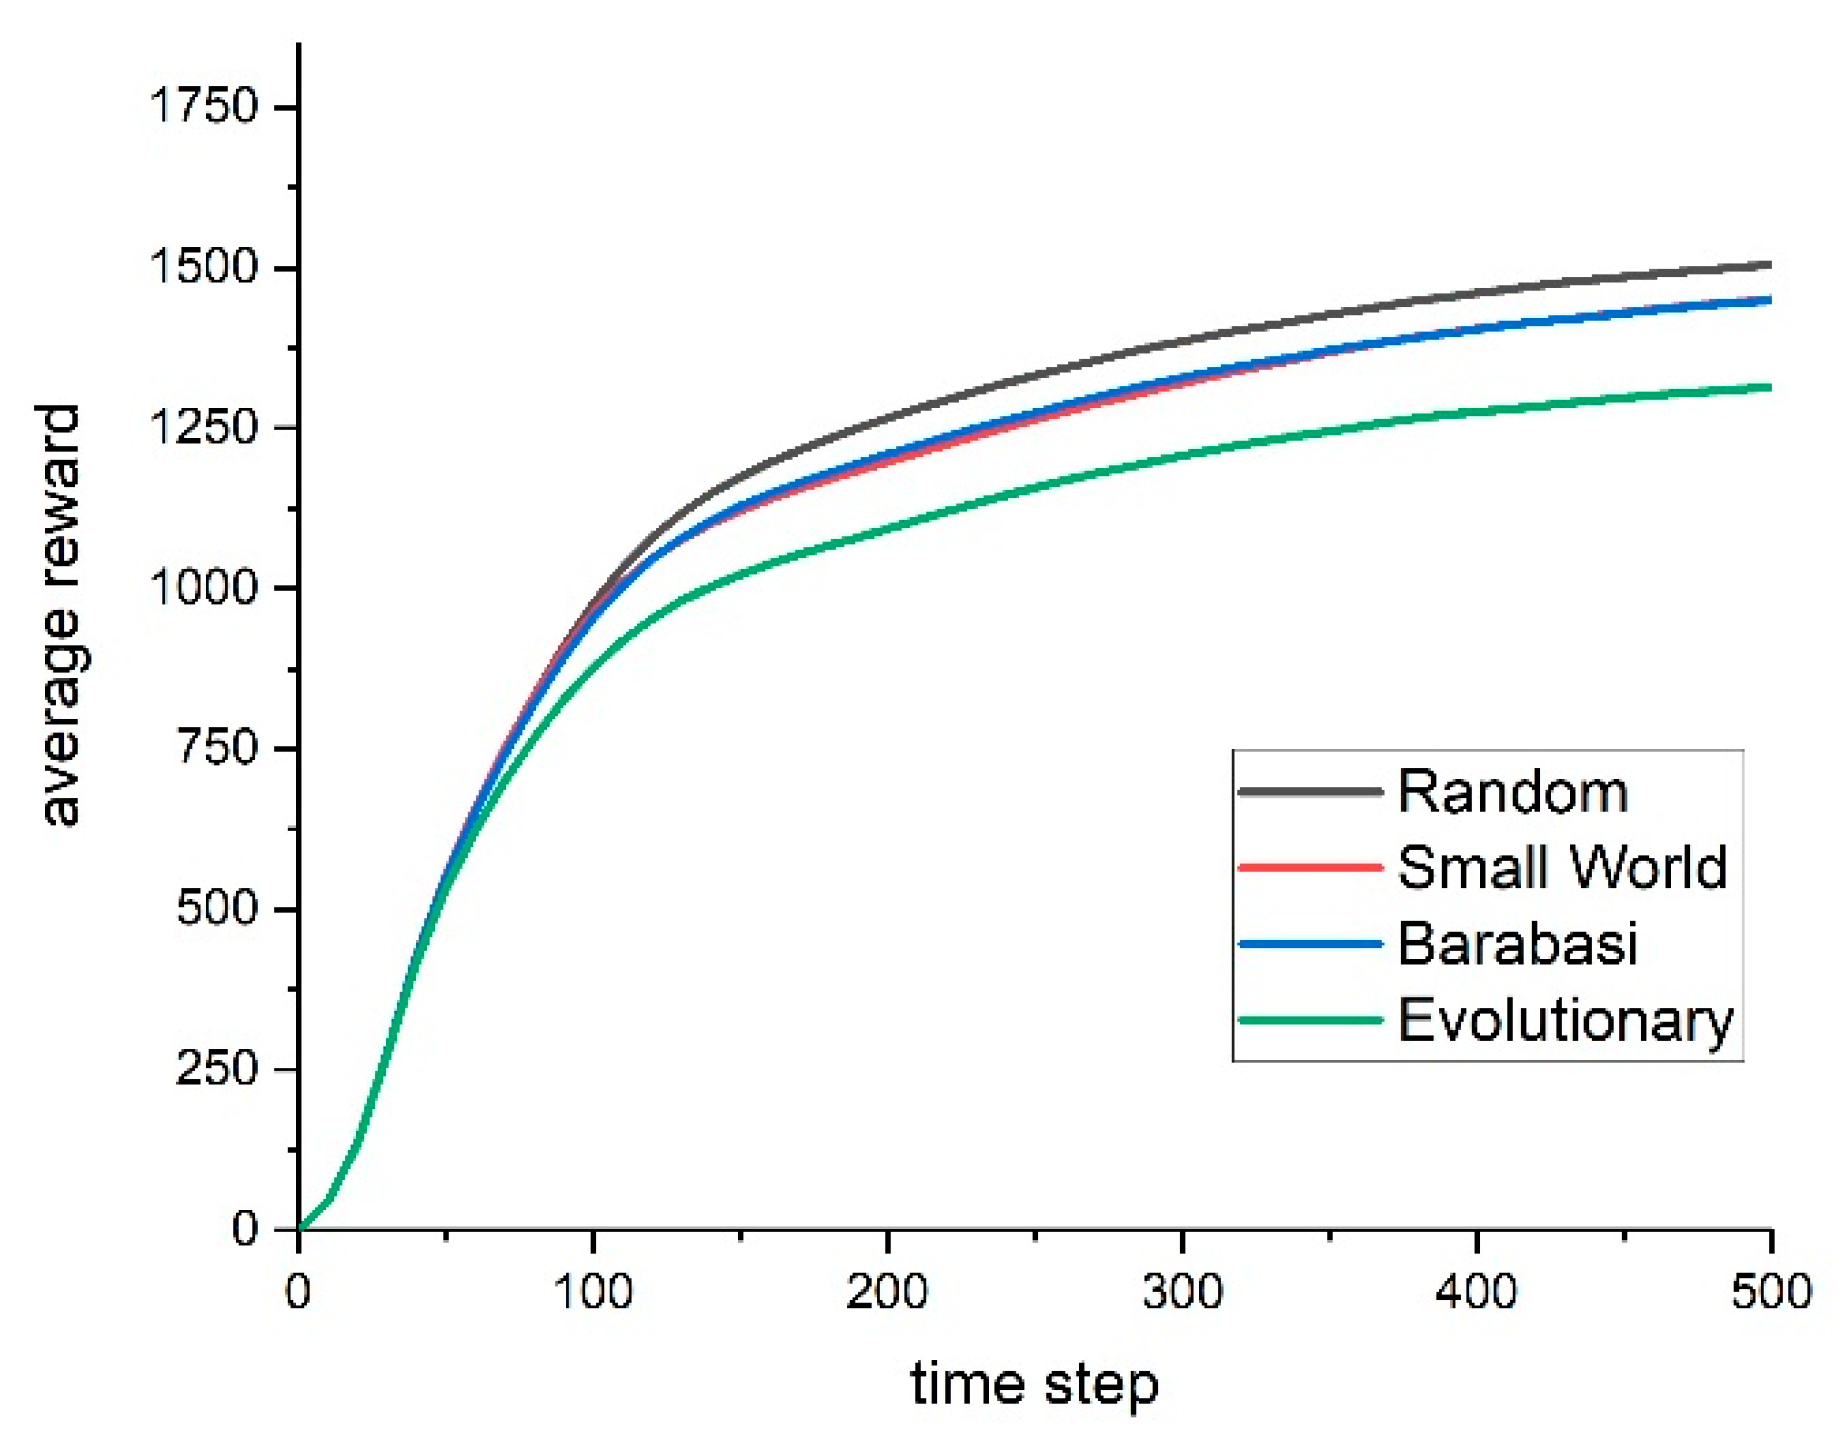
Figure 3 shows the reward gained by firms against the backdrop of four static network topologies, with a given density (200 links) over 500 simulation steps. The first insight of our analysis is that the overall network topology has indeed a major impact on the innovative outcomes and economic performance. We see that in the long run, firms embedded in networks following a purely random linking perform significantly better than firms embedded in other networks.
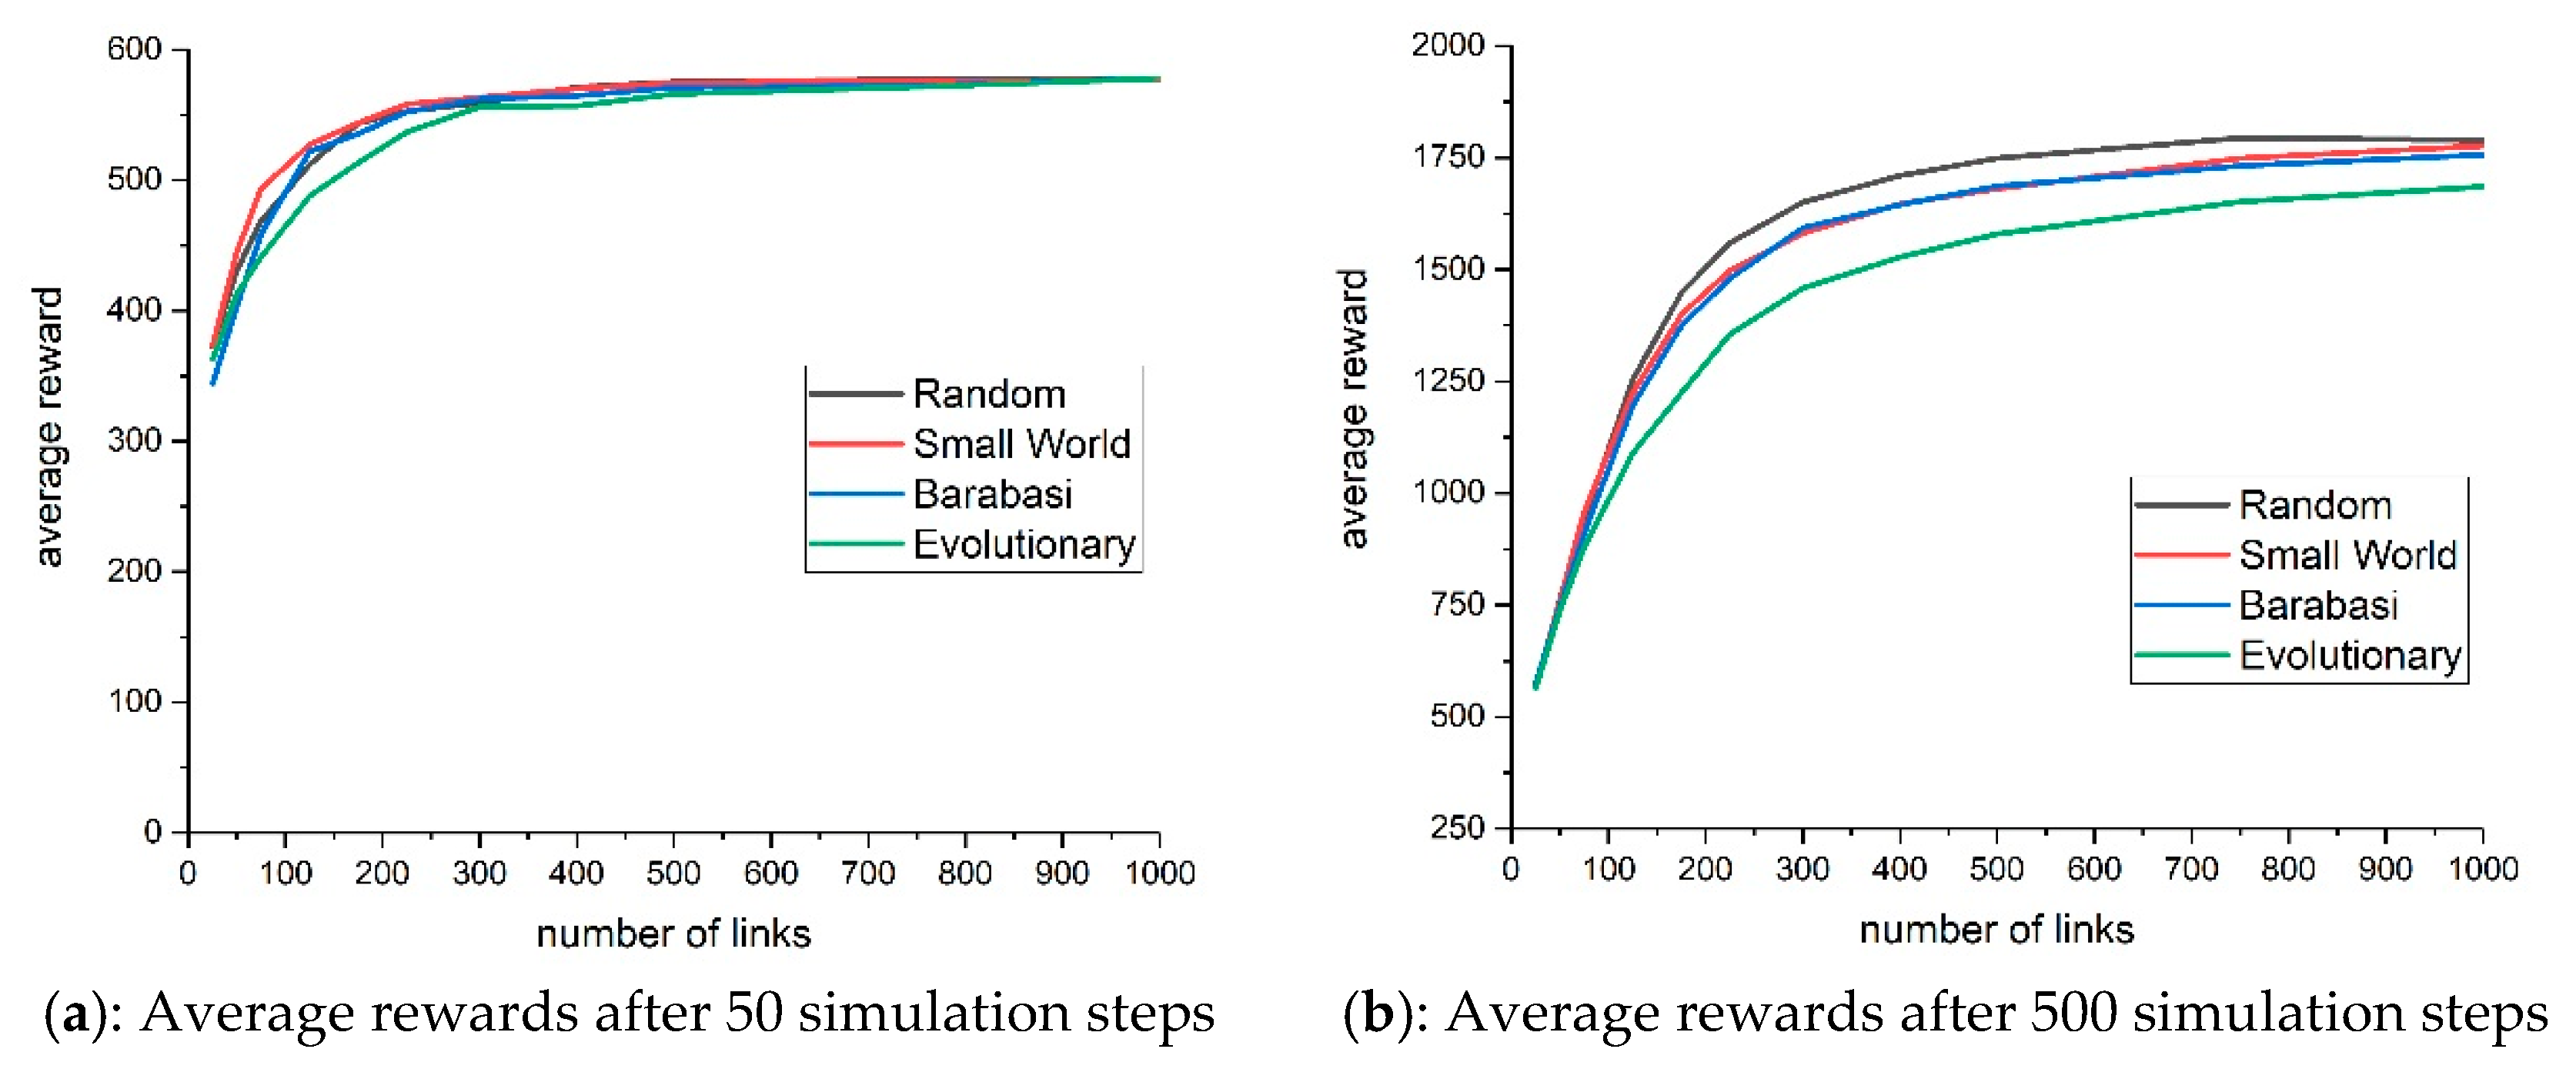
In a second step, we vary the network density to see whether the results remain robust. For this, we repeated the simulation for different number of links (between 25 and 1000) assuming the same number of network actors.
Figure 4 (l.h.s.) displays the average rewards of firms after 50 simulation steps while
Figure 4 (r.h.s.) shows the results after 500 simulation steps. As we can see, the qualitative ordering reported in
Figure 3 remains robust for different network density level. Additionally, we see that, in both cases, networks have a positive effect on the average rewards of firms, albeit with diminishing returns.
The long-run results of our simulation are relevant for regional innovation policy since the best performing networks—against the predictions of contemporary theoretical models—are neither the networks with the shortest path-lengths nor with the highest clustering coefficient (see
Table 2).
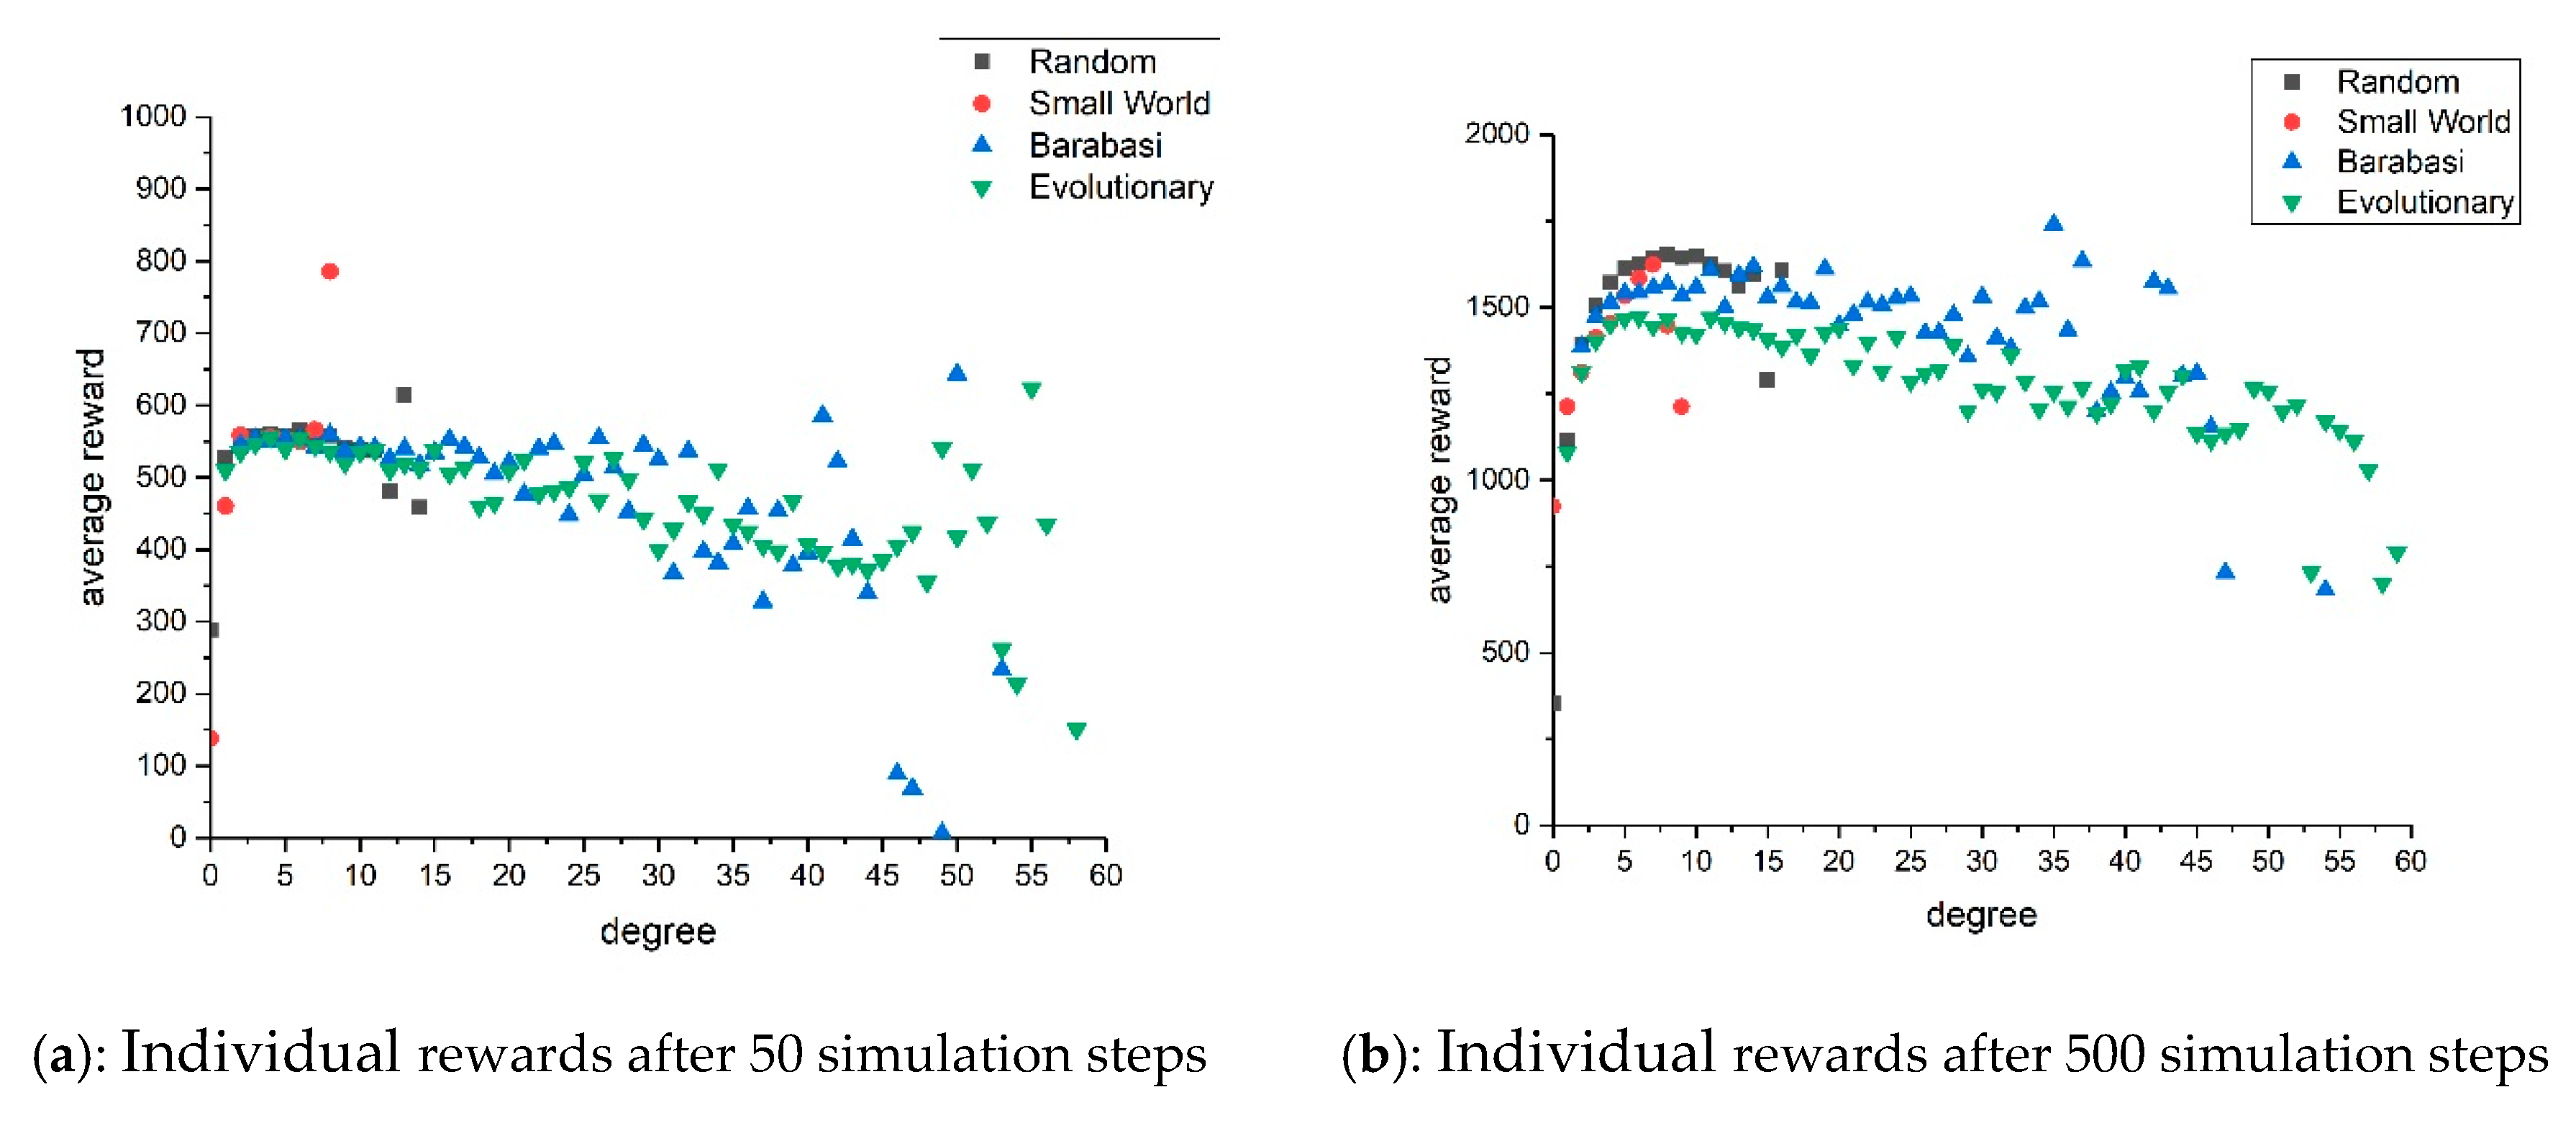
The clarification of this observation requires a closer look at the micro level, i.e., in-depth explorations at the firm level. More precisely, we focus in accordance with [
47,
48] on the relationship between an actor’s individual average reward and its degree after 50 (
Figure 5, l.h.s.) and 500 simulation steps (
Figure 5, r.h.s.). We observe in both cases, for actors with a small degree, a positive relationship between number of ties and individual rewards. However, this positive degree effect does not last. Especially, for actors involved in network topologies with a fat-tailed degree distribution, i.e., networks created through a ‘Barabási–Albert’ or ‘Evolutionary’ network algorithm, we observe that after a certain threshold, having more ties can have a negative impact on the performance of a firm. As a consequence, we see that the average rewards of firms in networks with a fat-tailed degree distribution is lower than of firms embedded in networks where links are distributed equally (see also [
10]).
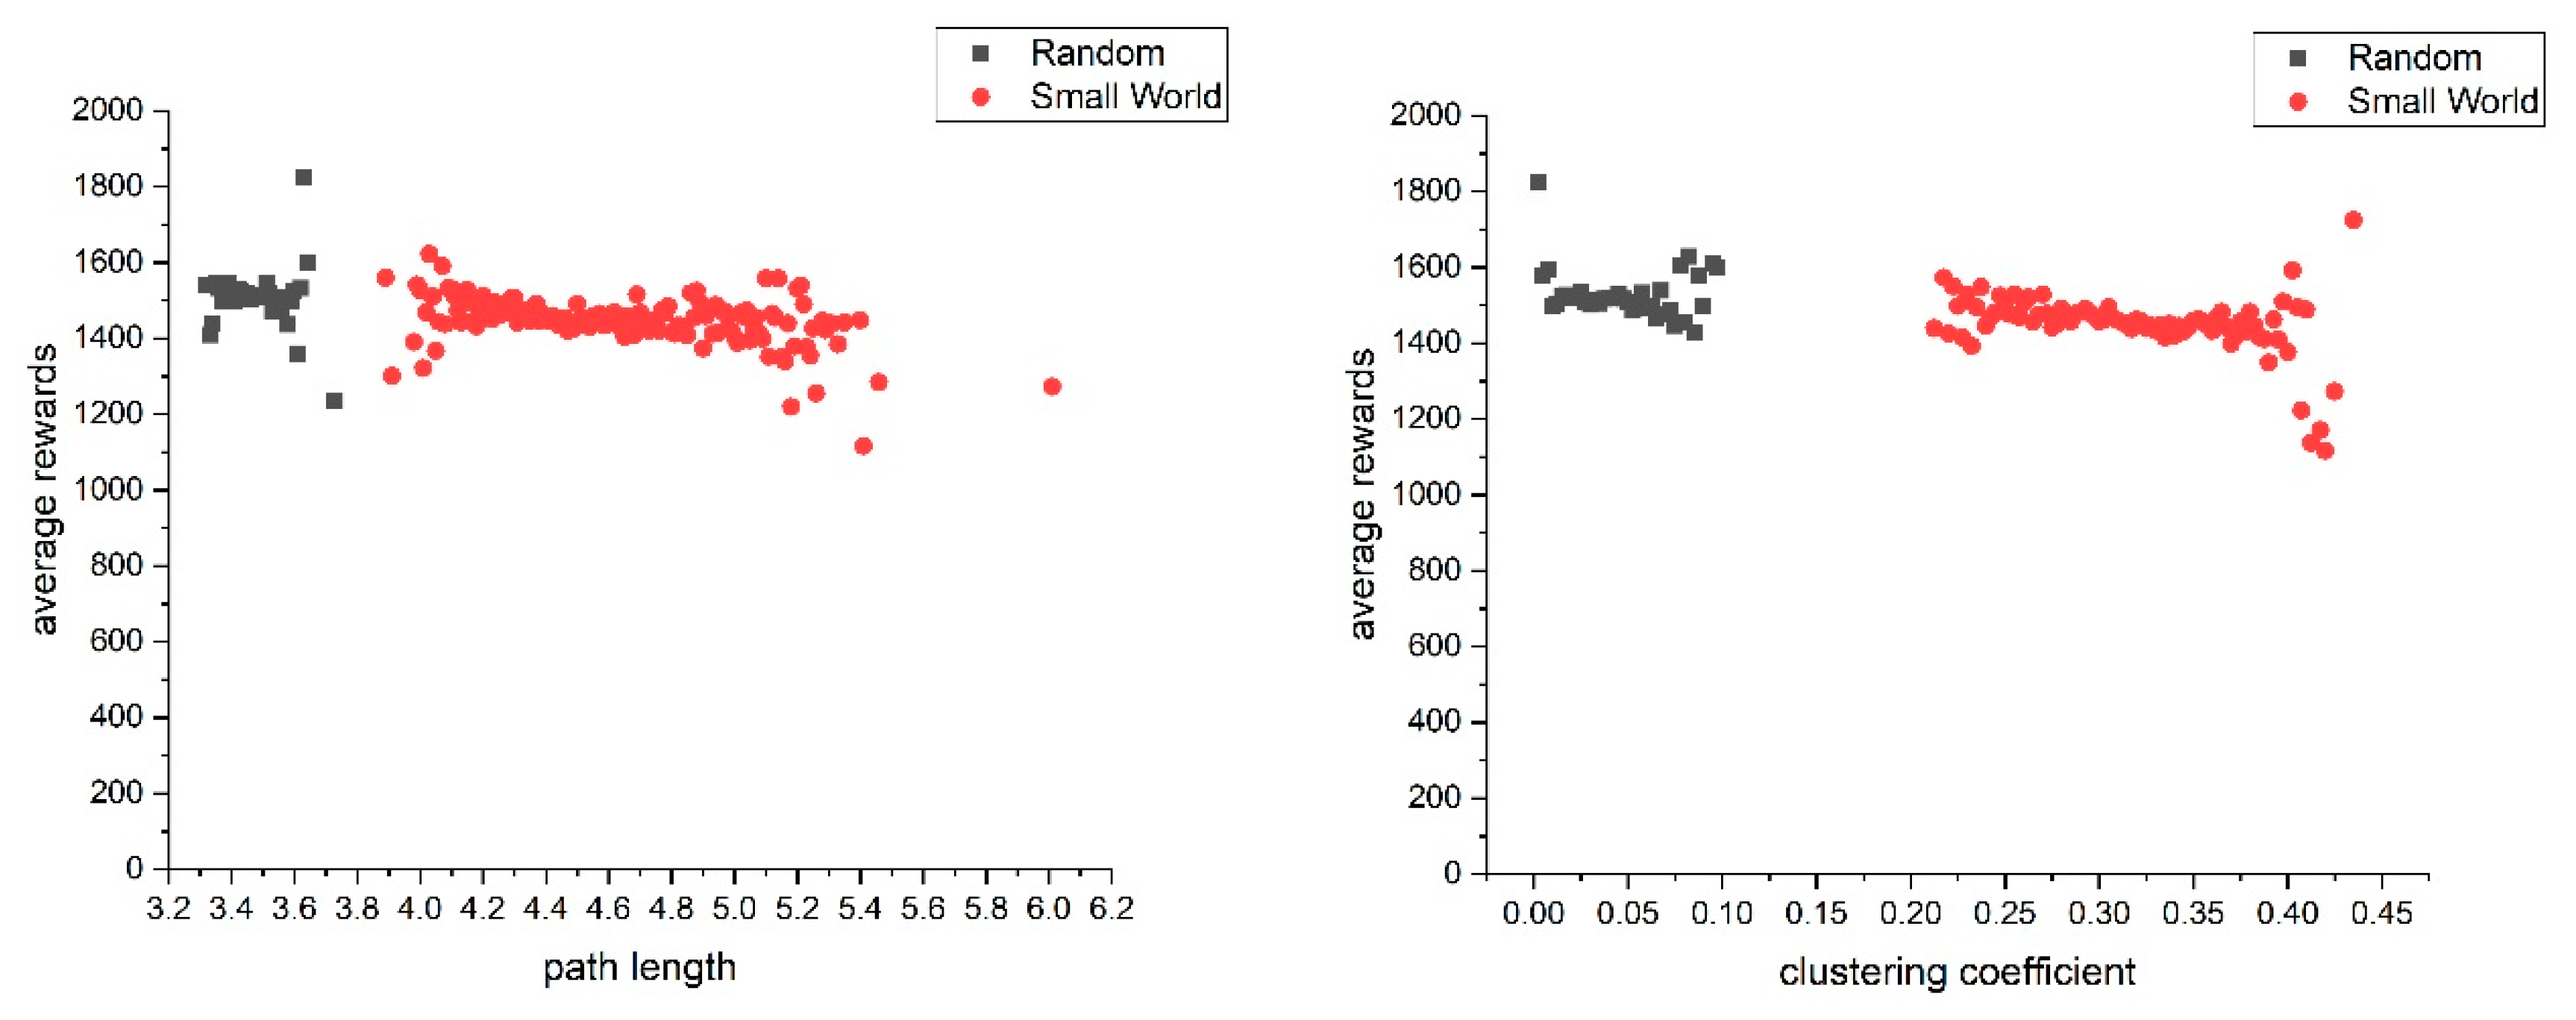
While this effect explains the negative performance of ‘Barabási–Albert’ and ‘Evolutionary’ network topologies, it does not explain the difference between ‘Small-world’ networks and ‘Random’ networks displayed in
Figure 3. Consequently,
Figure 6 illustrates the relationship between the path-length and clustering coefficients of networks and the average rewards of firms within these networks. Especially for ‘Small-world’ networks, two interesting effects become evident, which explain the worse performance of ‘Small-world’ networks. First, we see that networks with a shorter path-length perform better than networks with high path-length. At the same time, however, we see that networks with a high clustering coefficient seem to have a negative impact on the average rewards gained by firms. While the first effect is in line with the literature, the latter, at first glance, is counter intuitive.
One plausible explanation for this observation is rooted in the converging knowledge stocks of firms in dense cliques. The generation of novelty in terms of innovations requires the permanent acquisition and application of new knowledge since existing knowledge may become obsolete over time. A high clustering coefficient implies that firms within these cliques typically cooperate with the same partners. This actor-specific cooperation behavior, however, leads to an erosion of knowledge over time within network cliques because no new knowledge is generated and existing knowledge becomes obsolete (see for example [
50,
51]). Furthermore, knowledge within these cliques becomes more and more similar. This implies that firms produce similar products, which in turn leads to higher competition and lower rewards for the firms. In contrast, firms with low actor-specific clustering coefficients cooperate with actors from other areas (not embedded in the same clique) and hence have access to qualitatively different knowledge.
6. Conclusions
Modern innovation economics considers the specific nature of knowledge and its role played for the generation of novelties. First and foremost, the generation of novelty is a non-linear process relying on the of exchange of qualitatively different knowledge types in a systemic context, while the outcome of innovation processes is anything but clear in advance. Second, the traditional treatment of knowledge leads to limitations concerning a meaningful analysis of innovation processes in several ways, while the detailed knowledge view of modern innovation economics with the focus on networks provides a promising way towards a better representation of inter-organizational knowledge transfer and learning processes. From this, it follows that we need new tools for understanding and analyzing the way in which knowledge exchange, learning, and innovation take place in complex adaptive systems to overcome the present dissatisfaction of policy makers concerning the applicability of regional innovation models.
One purpose of this paper is to show in which way new simulation approaches, such as the VISIBLE simulation environment, can be used to gain an in depth understanding of regional innovation processes. The strengths of these simulation approaches are the new way of conceptualizing knowledge at the actors’ level and the fine-grained implementation of knowledge exchange, learning, and innovation processes. One of the main features is that firms in the region face innovation competition, i.e., their product and service portfolio is permanently supposed to obsolescence. In order to keep pace with competitors, they have to innovate. Innovation is conceptualized as an experimental testing of new (competence) combinations on a market that is confronted with strong uncertainty. A second feature is that we consider the dynamics and the scarcity of the relevant knowledge. As firms in a region can observe, at least on a shallow level, the success of other firms as well as their knowledge, we expect that successful knowledge becomes easily available to other actors in this region and, therefore, the demand for the relevant competencies increases. At the same time, actors are confronted with various difficulties to get access to new knowledge. To get access, firms have to adapt their cooperation strategies and learn from partners. The interplay of these processes along different aggregation levels reveals overlooked but highly conclusive insights. Finally, the VISIBLE simulation environment can also be used for ex-ante policy evaluation. The systematic conceptualization of ceteris paribus simulation experiments provides a powerful approach to test the impact of specific policy instruments. Policy makers and other stakeholders play an important role in the application of the model.
Our analytical part provides an example of how we can use the VISIBLE simulation environment to analyze the relationship between overall network topologies, innovativeness of actors involved and subsequent economic performance outcomes at different aggregation levels. With our simulation, we can identify and analyze highly insightful effects of different network topologies, cooperation behavior at the micro level, and related economic outcomes. Against initial expectations, a random network topology is conducive to the realization of higher individual economic rewards of the actors involved. However, the policy implication from our exercise is not that firms embedded in regional networks should aim for a random linking behavior. In fact, a zoom into actor-specific network patterns points to two very important effects that have to be accounted for when designing policies to improve the innovative performance of a region. Consequently, our simulation experiments provide policy makers with sensitive information concerning their policies to support regional innovation networks. In more detail, we show that the potential contribution of networks to regional and firm development critically depends on network structures and actors’ positions. The widespread belief that regional networks and clusters are per se beneficial is not supported. Instead, the specific characteristics of networks have to be considered in detail in order to design policy interventions with a high probability of success. The varying performance of regional innovation policies for—at a first view—rather similar regions observed by [
39] therefore finds an explanation in the varying network architectures in these regions.
When it comes to the analytical scope of VISIBLE, several fruitful extensions are left for future research. First, the analytical part of this paper shows only one exemplary simulation experiment based on a prototype version of the VISIBLE simulation environment, originally designed for ex-ante policy evaluation in one particular region in Germany, i.e., Heilbronn Franken. The VISIBLE simulation environment can be easily adapted to other regions and the set of analytical elements can be easily extended due to its modular character. In more detail, it would be highly interesting to adapt our analysis to situations in which institutions, e.g., universities or other research institutions, are involved in the regional network. Second, the use and specification of ex-ante policy simulation scenarios for a systematic testing of policy intervention always requires a close involvement of stakeholders from the very beginning. Here, a lot remains to be done, particularly when it comes to a realistic translation of real-world policy instruments into testable simulation scenarios. Finally, we are convinced that VISIBLE can deploy its full strength through an increased utilization and integration of empirical data, for example, by additional empirical evidence that the effects revealed by our simulation are effective in real world scenarios. Similarly, the combination of our approach with other analytical tools opens up rich opportunities for future research. For instance, findings from behavioral experiments may provide us with new insights on the very nature of knowledge exchange and learning processes, while micro-econometric techniques can be used for a critical assessment of our model predictions.


