

Bone Marrow Mesenchymal Stem-Cell-Derived Exosomes Ameliorate Deoxynivalenol-Induced Mice Liver Damage

 and
and 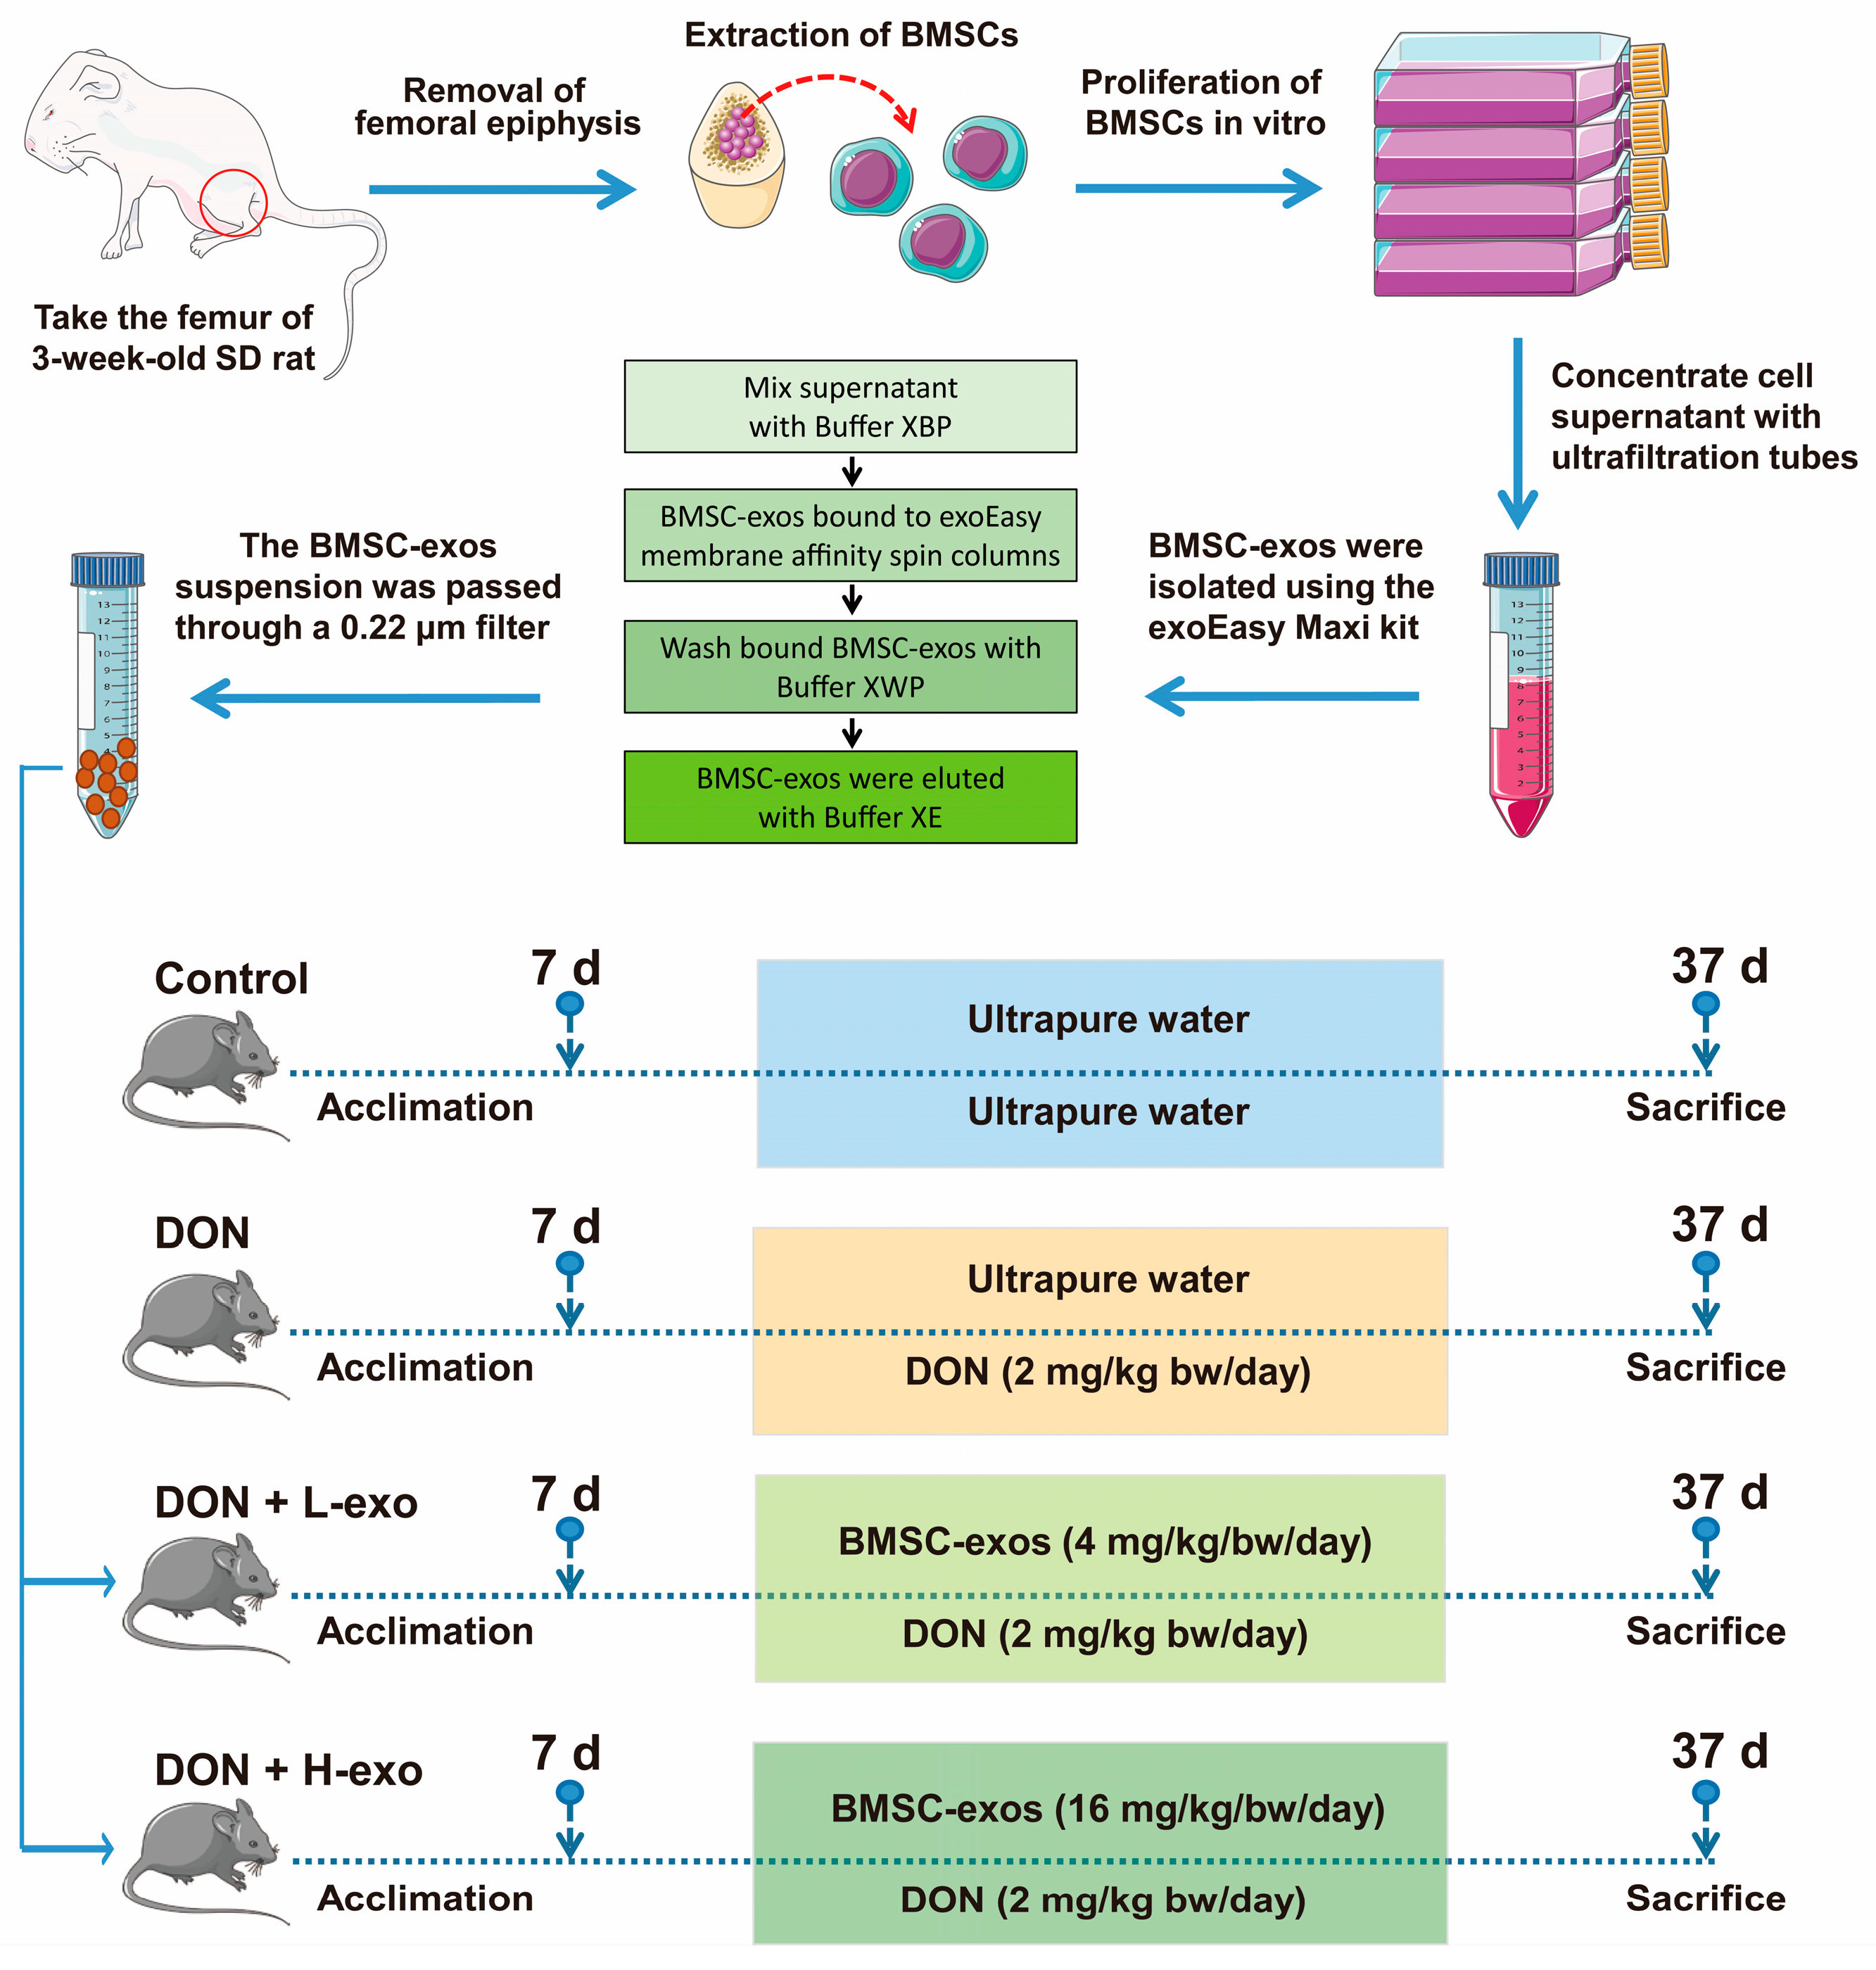
Abstract
1. Introduction
2. Materials and Methods
2.1. Reagents
2.2. Animals’ Housing and Treatment
2.3. Exosome Isolation and Characterization
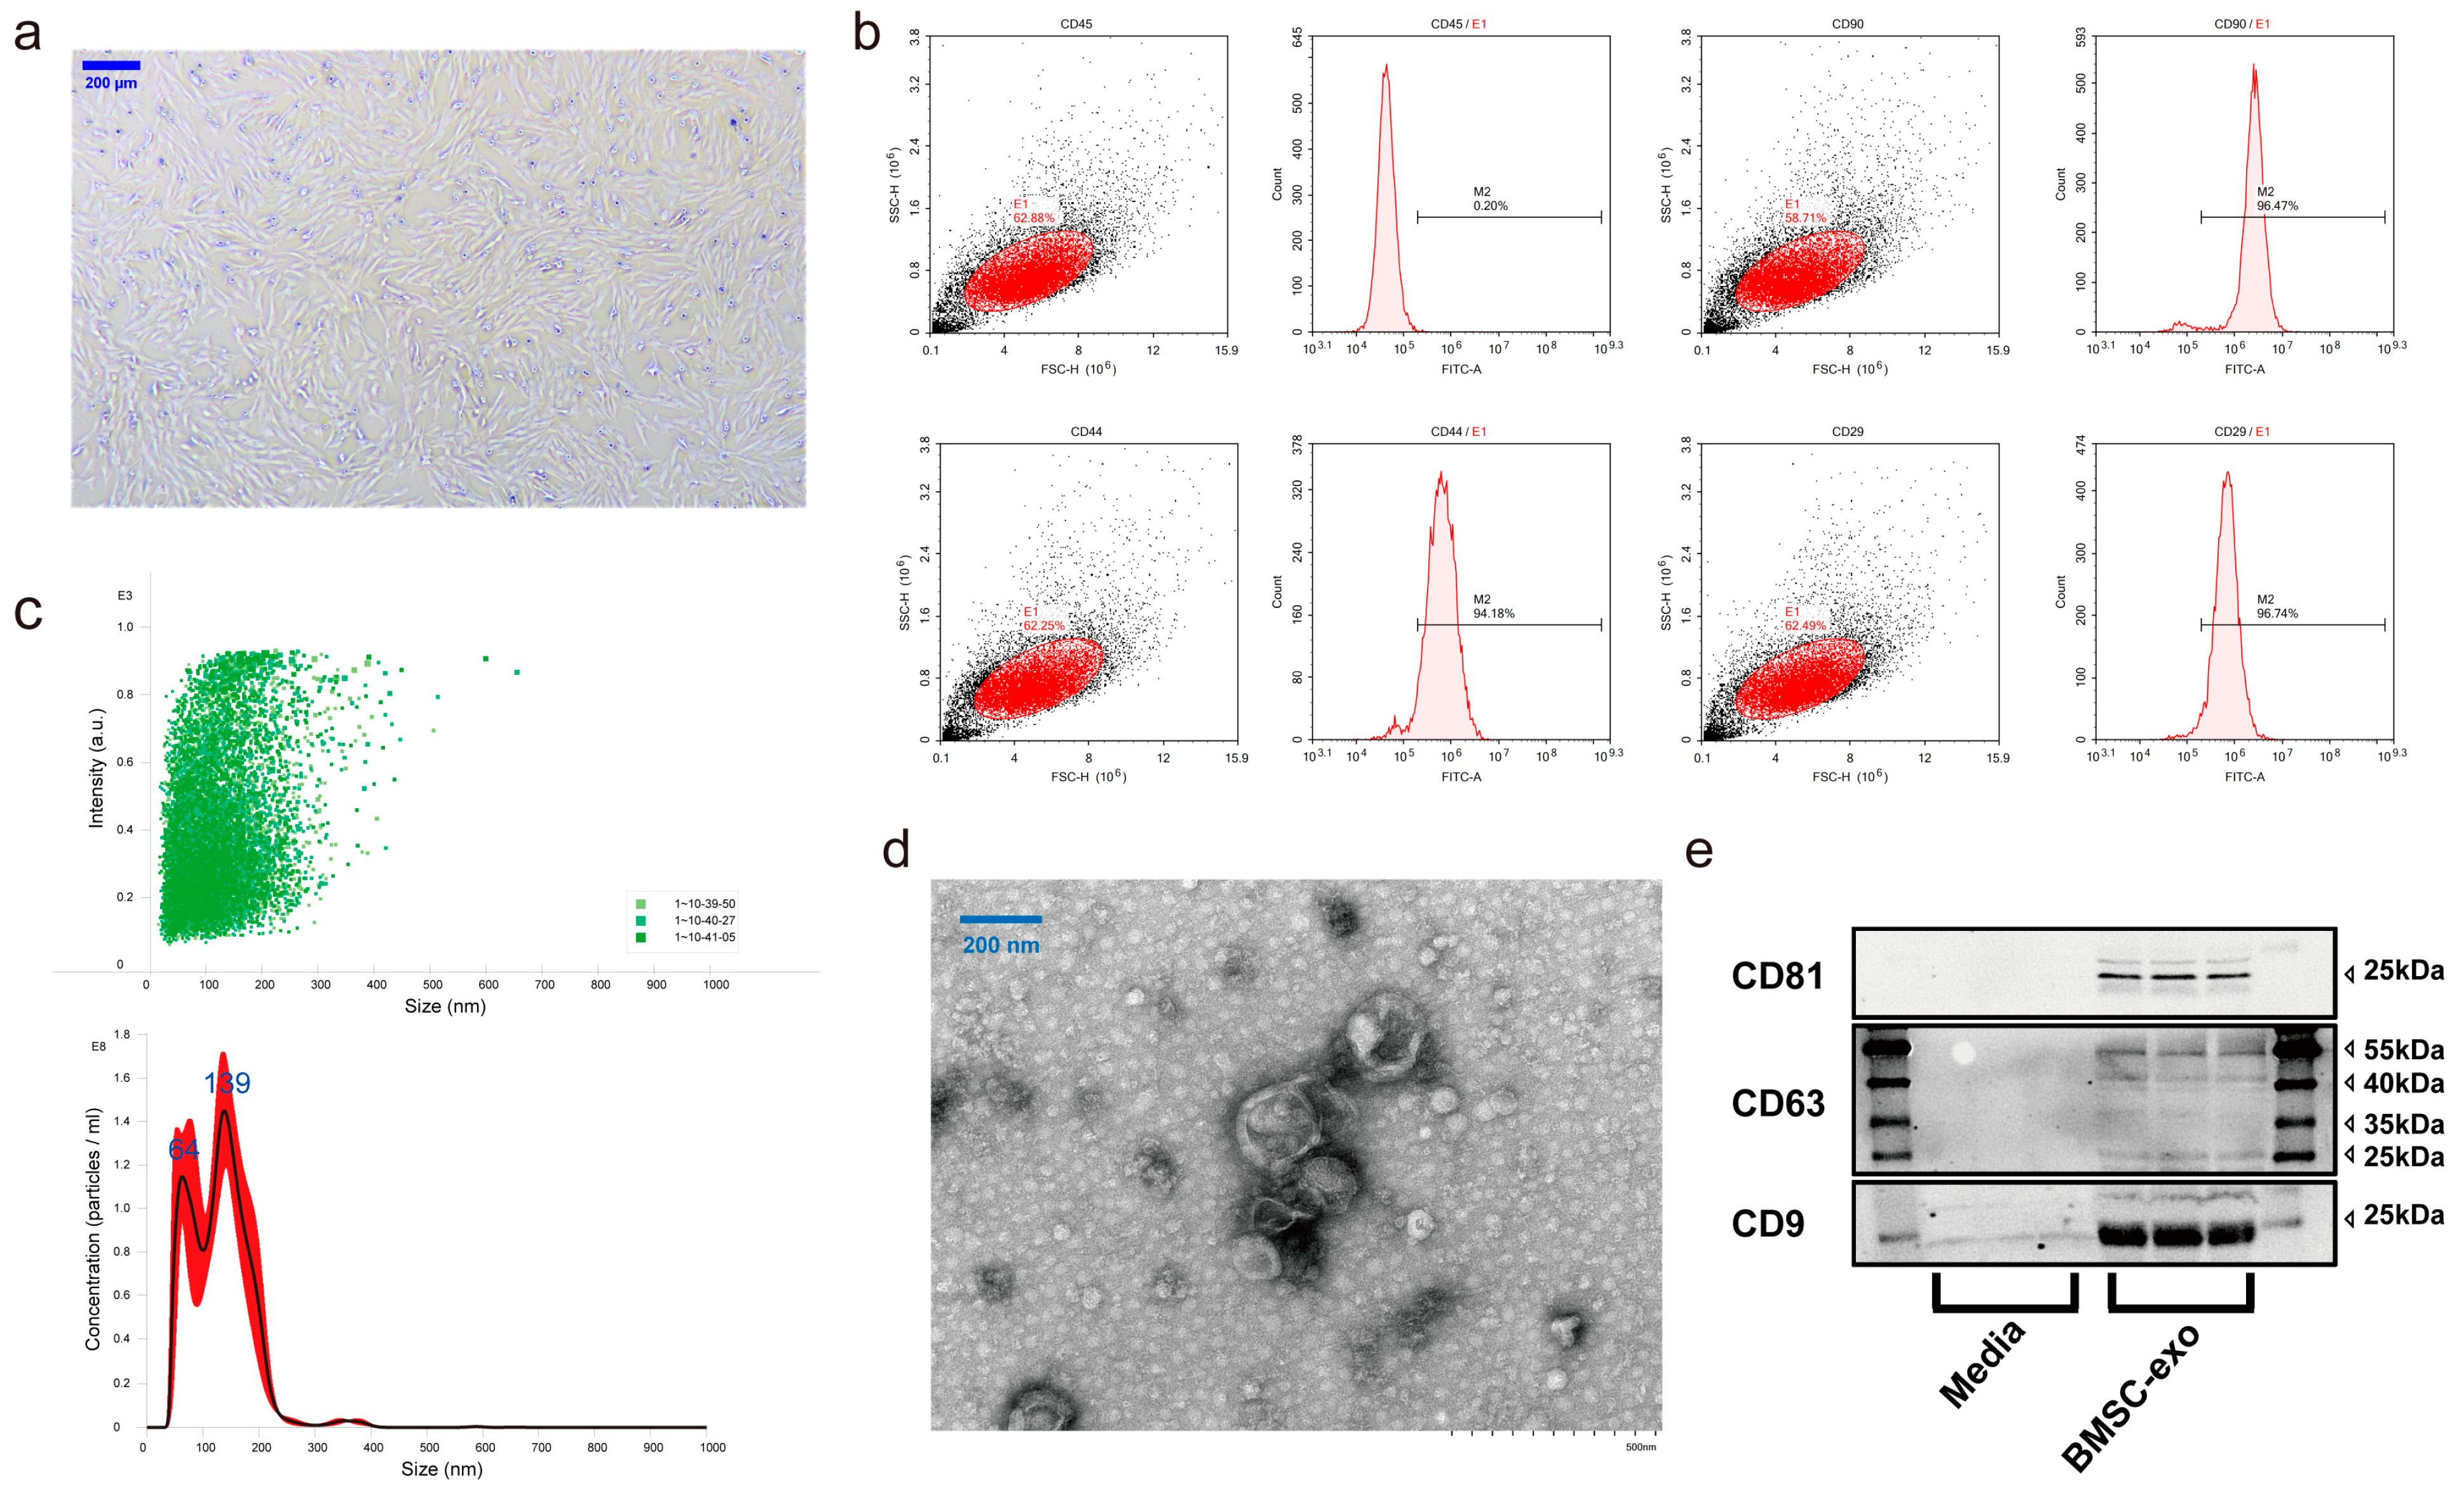
2.3.1. Bone Marrow Stem Cell Culture and Identification
2.3.2. Exosome Isolation, Purification, and Identification
2.4. Western Blotting
2.5. Liver Function Detection
2.6. Systemic Inflammatory Cytokine Detection
2.7. Determination of Lipid Peroxidation Levels and Antioxidant Enzyme Activities in the Liver
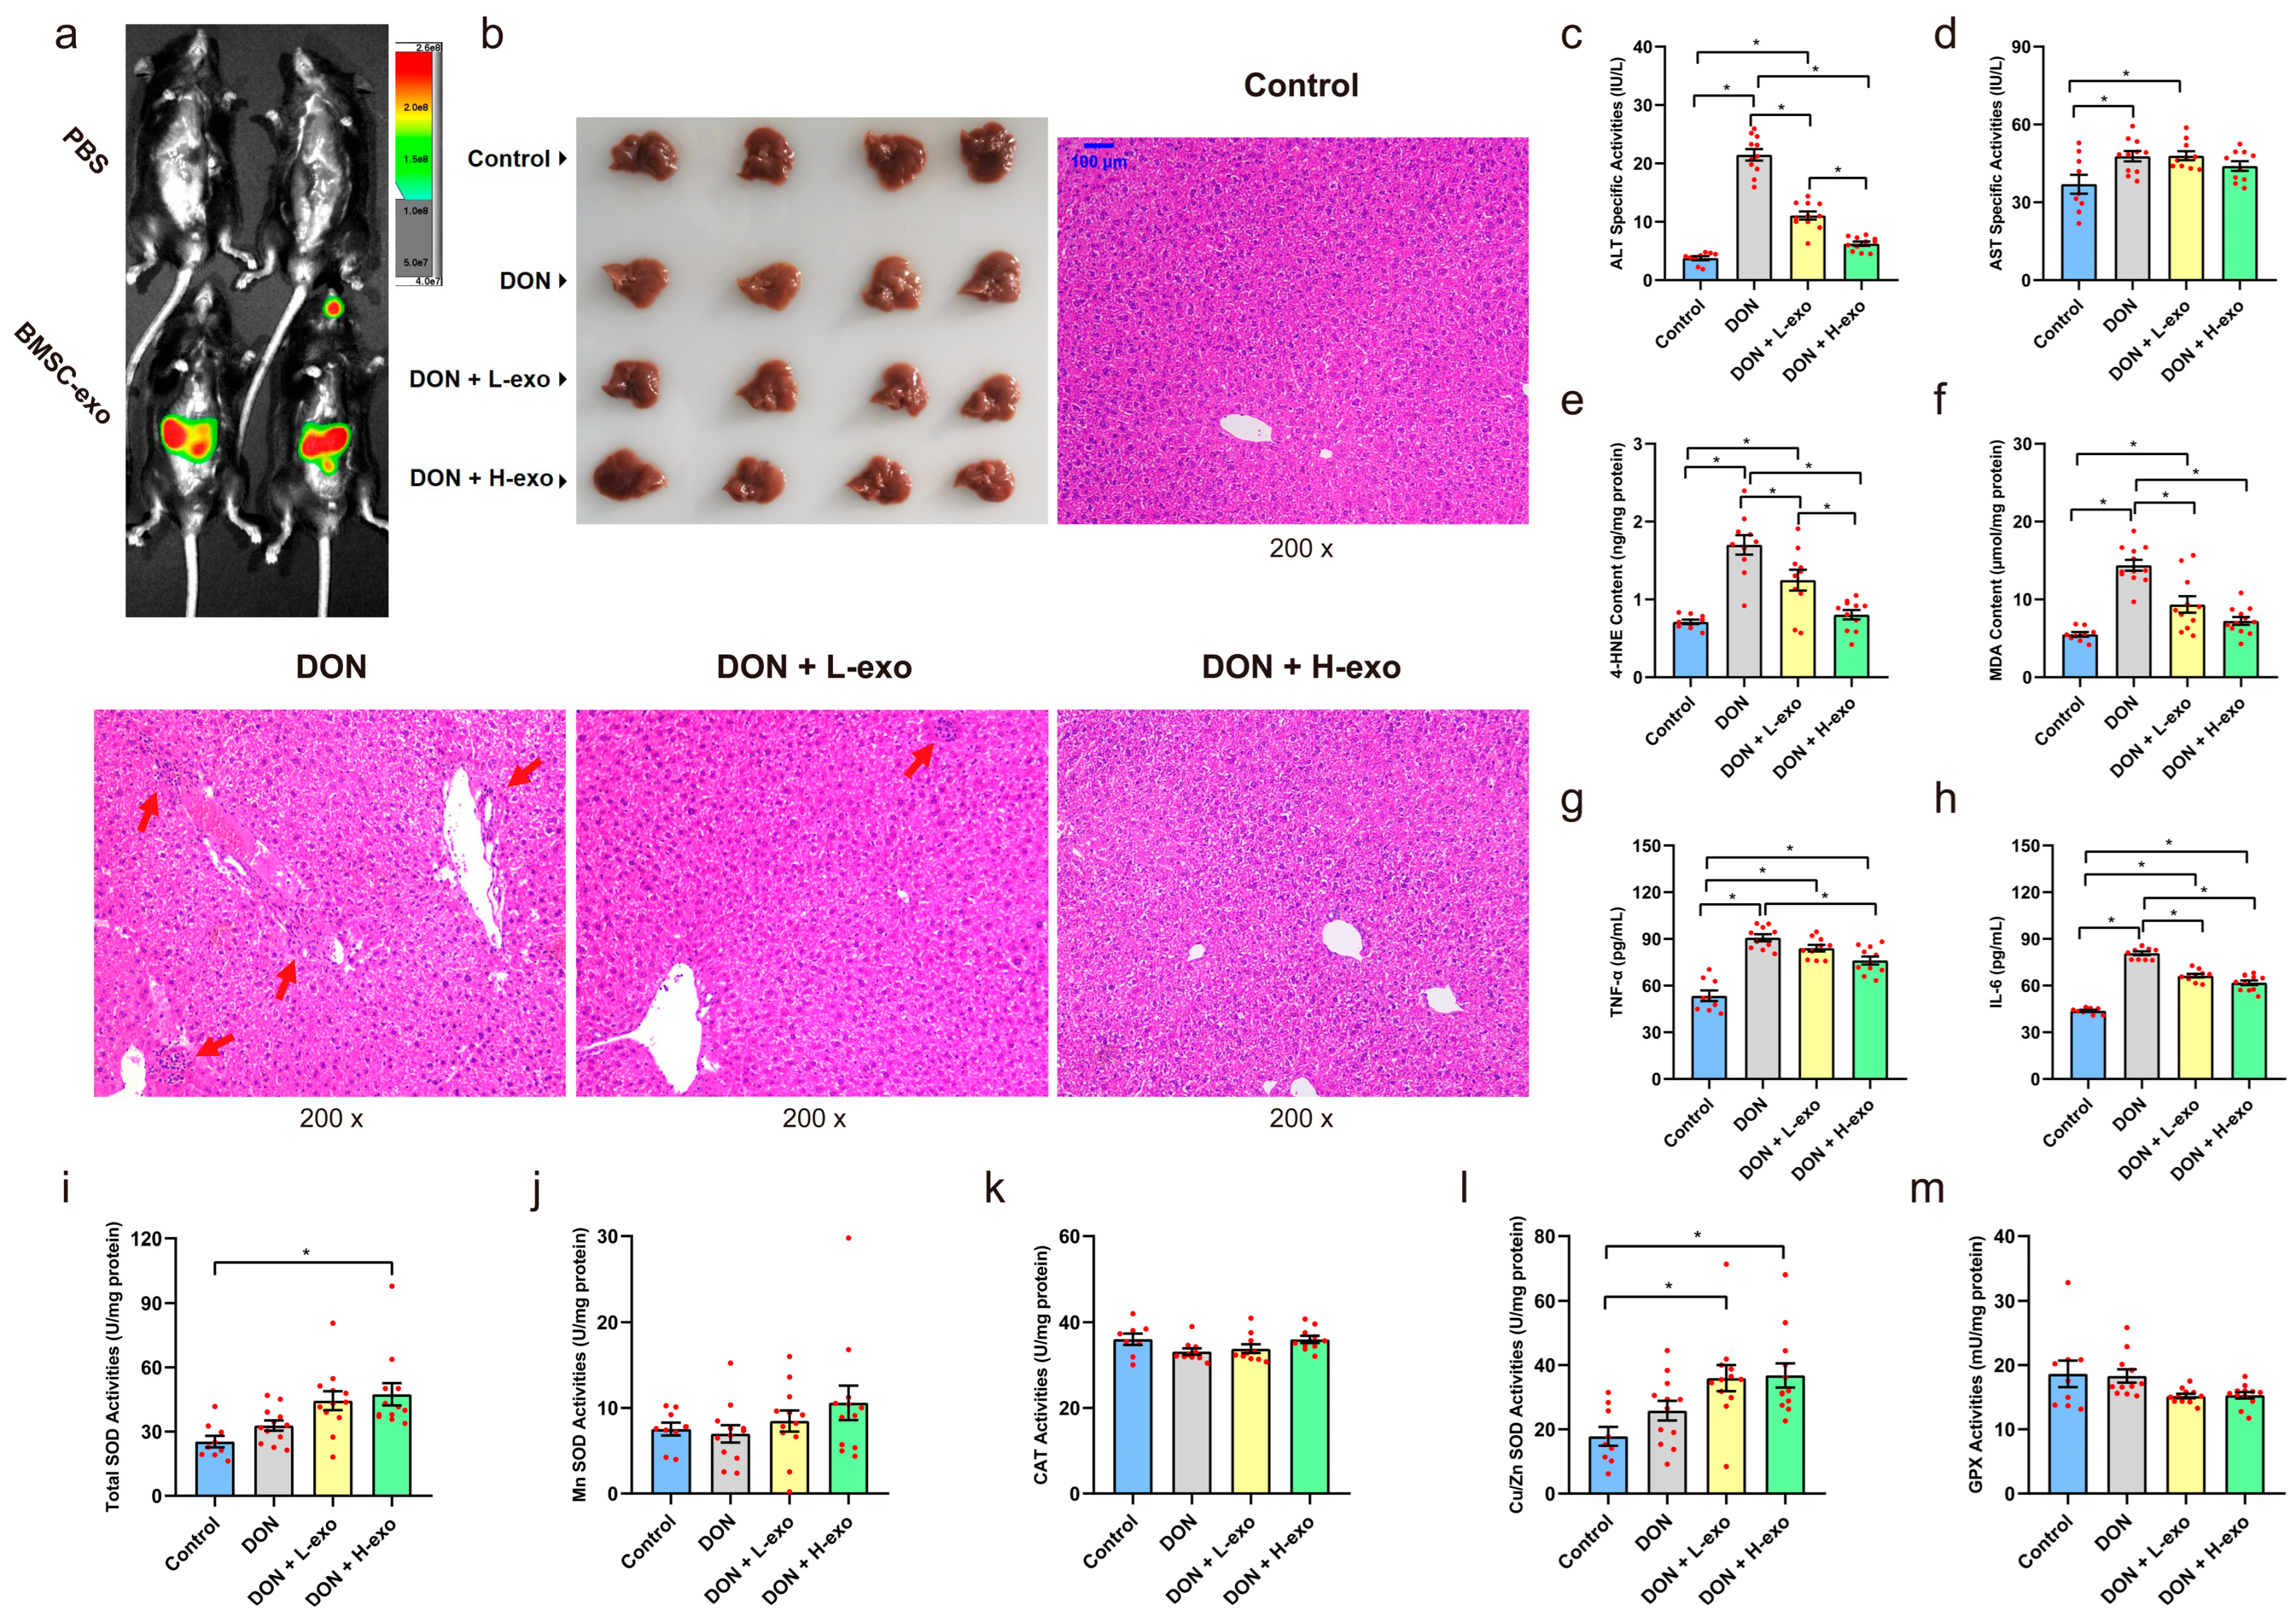
2.8. Exosome Labeling and Tracking Distribution in Mice
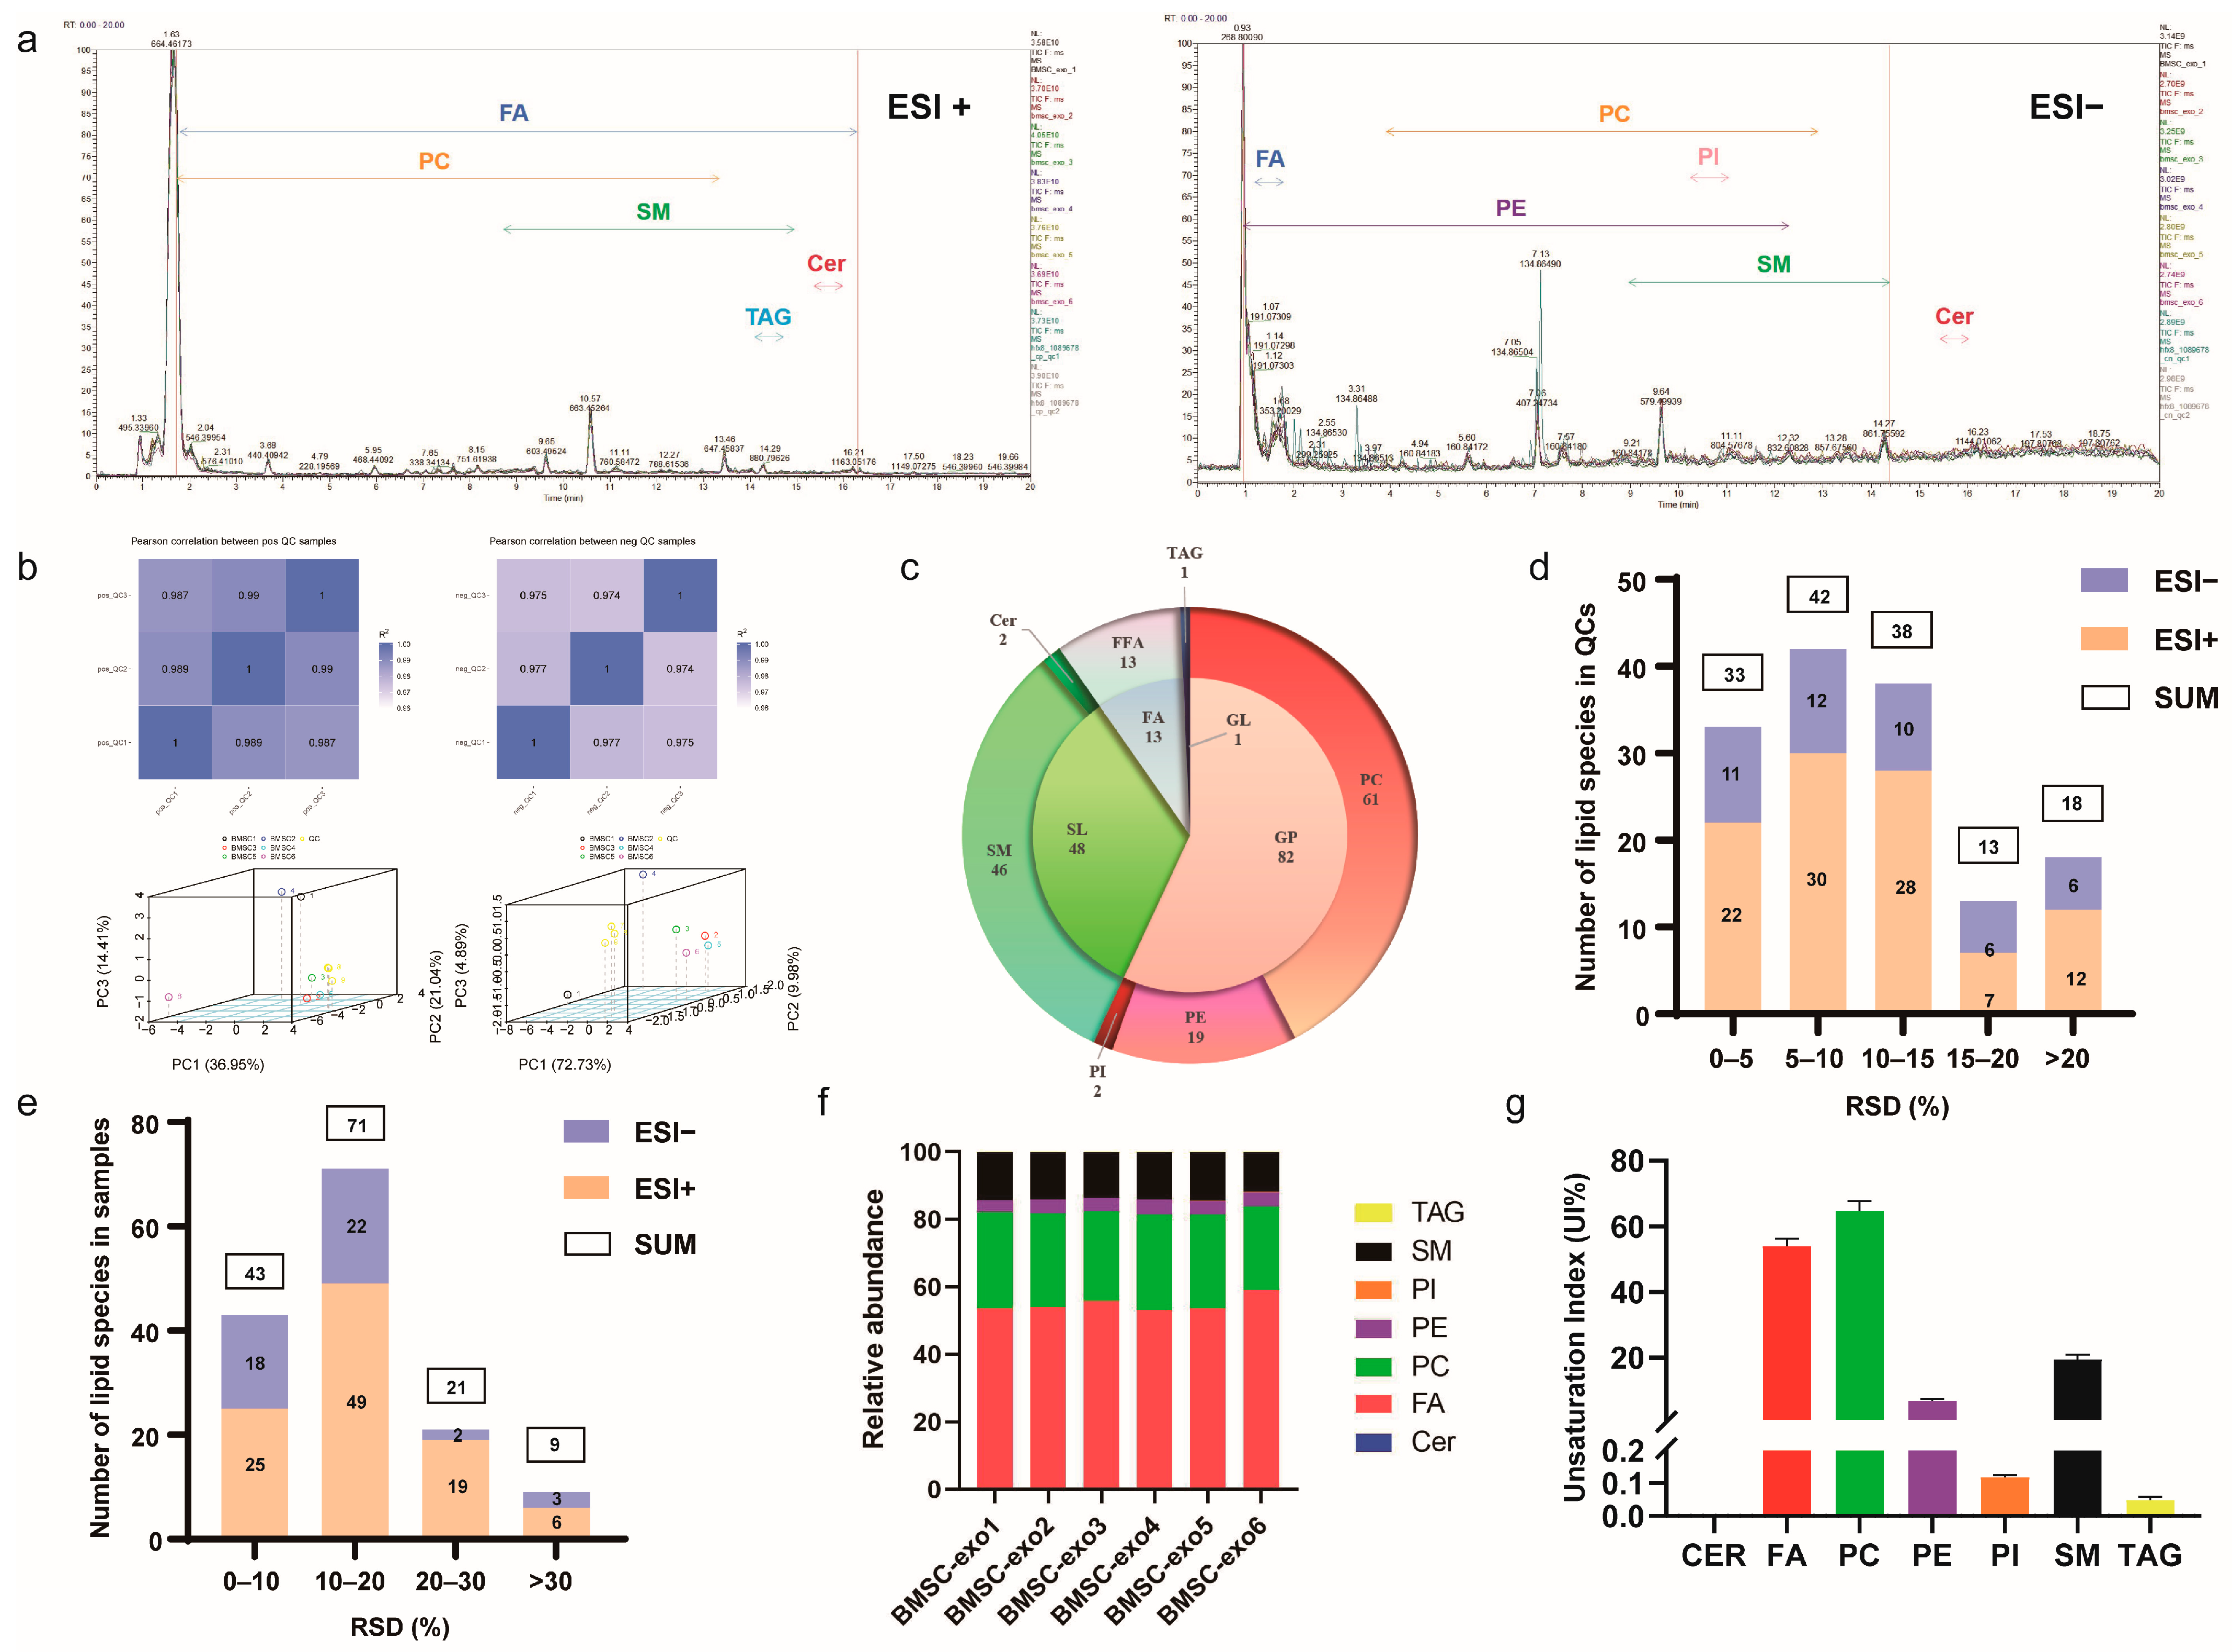
2.9. Analysis Profiles of Lipids and Hydroxyl Lipids
2.9.1. Lipid Profiling
2.9.2. Oxylipin Profiling
2.10. Statistical Analysis
3. Results
3.1. Characterization of BMSCs and BMSC-exos
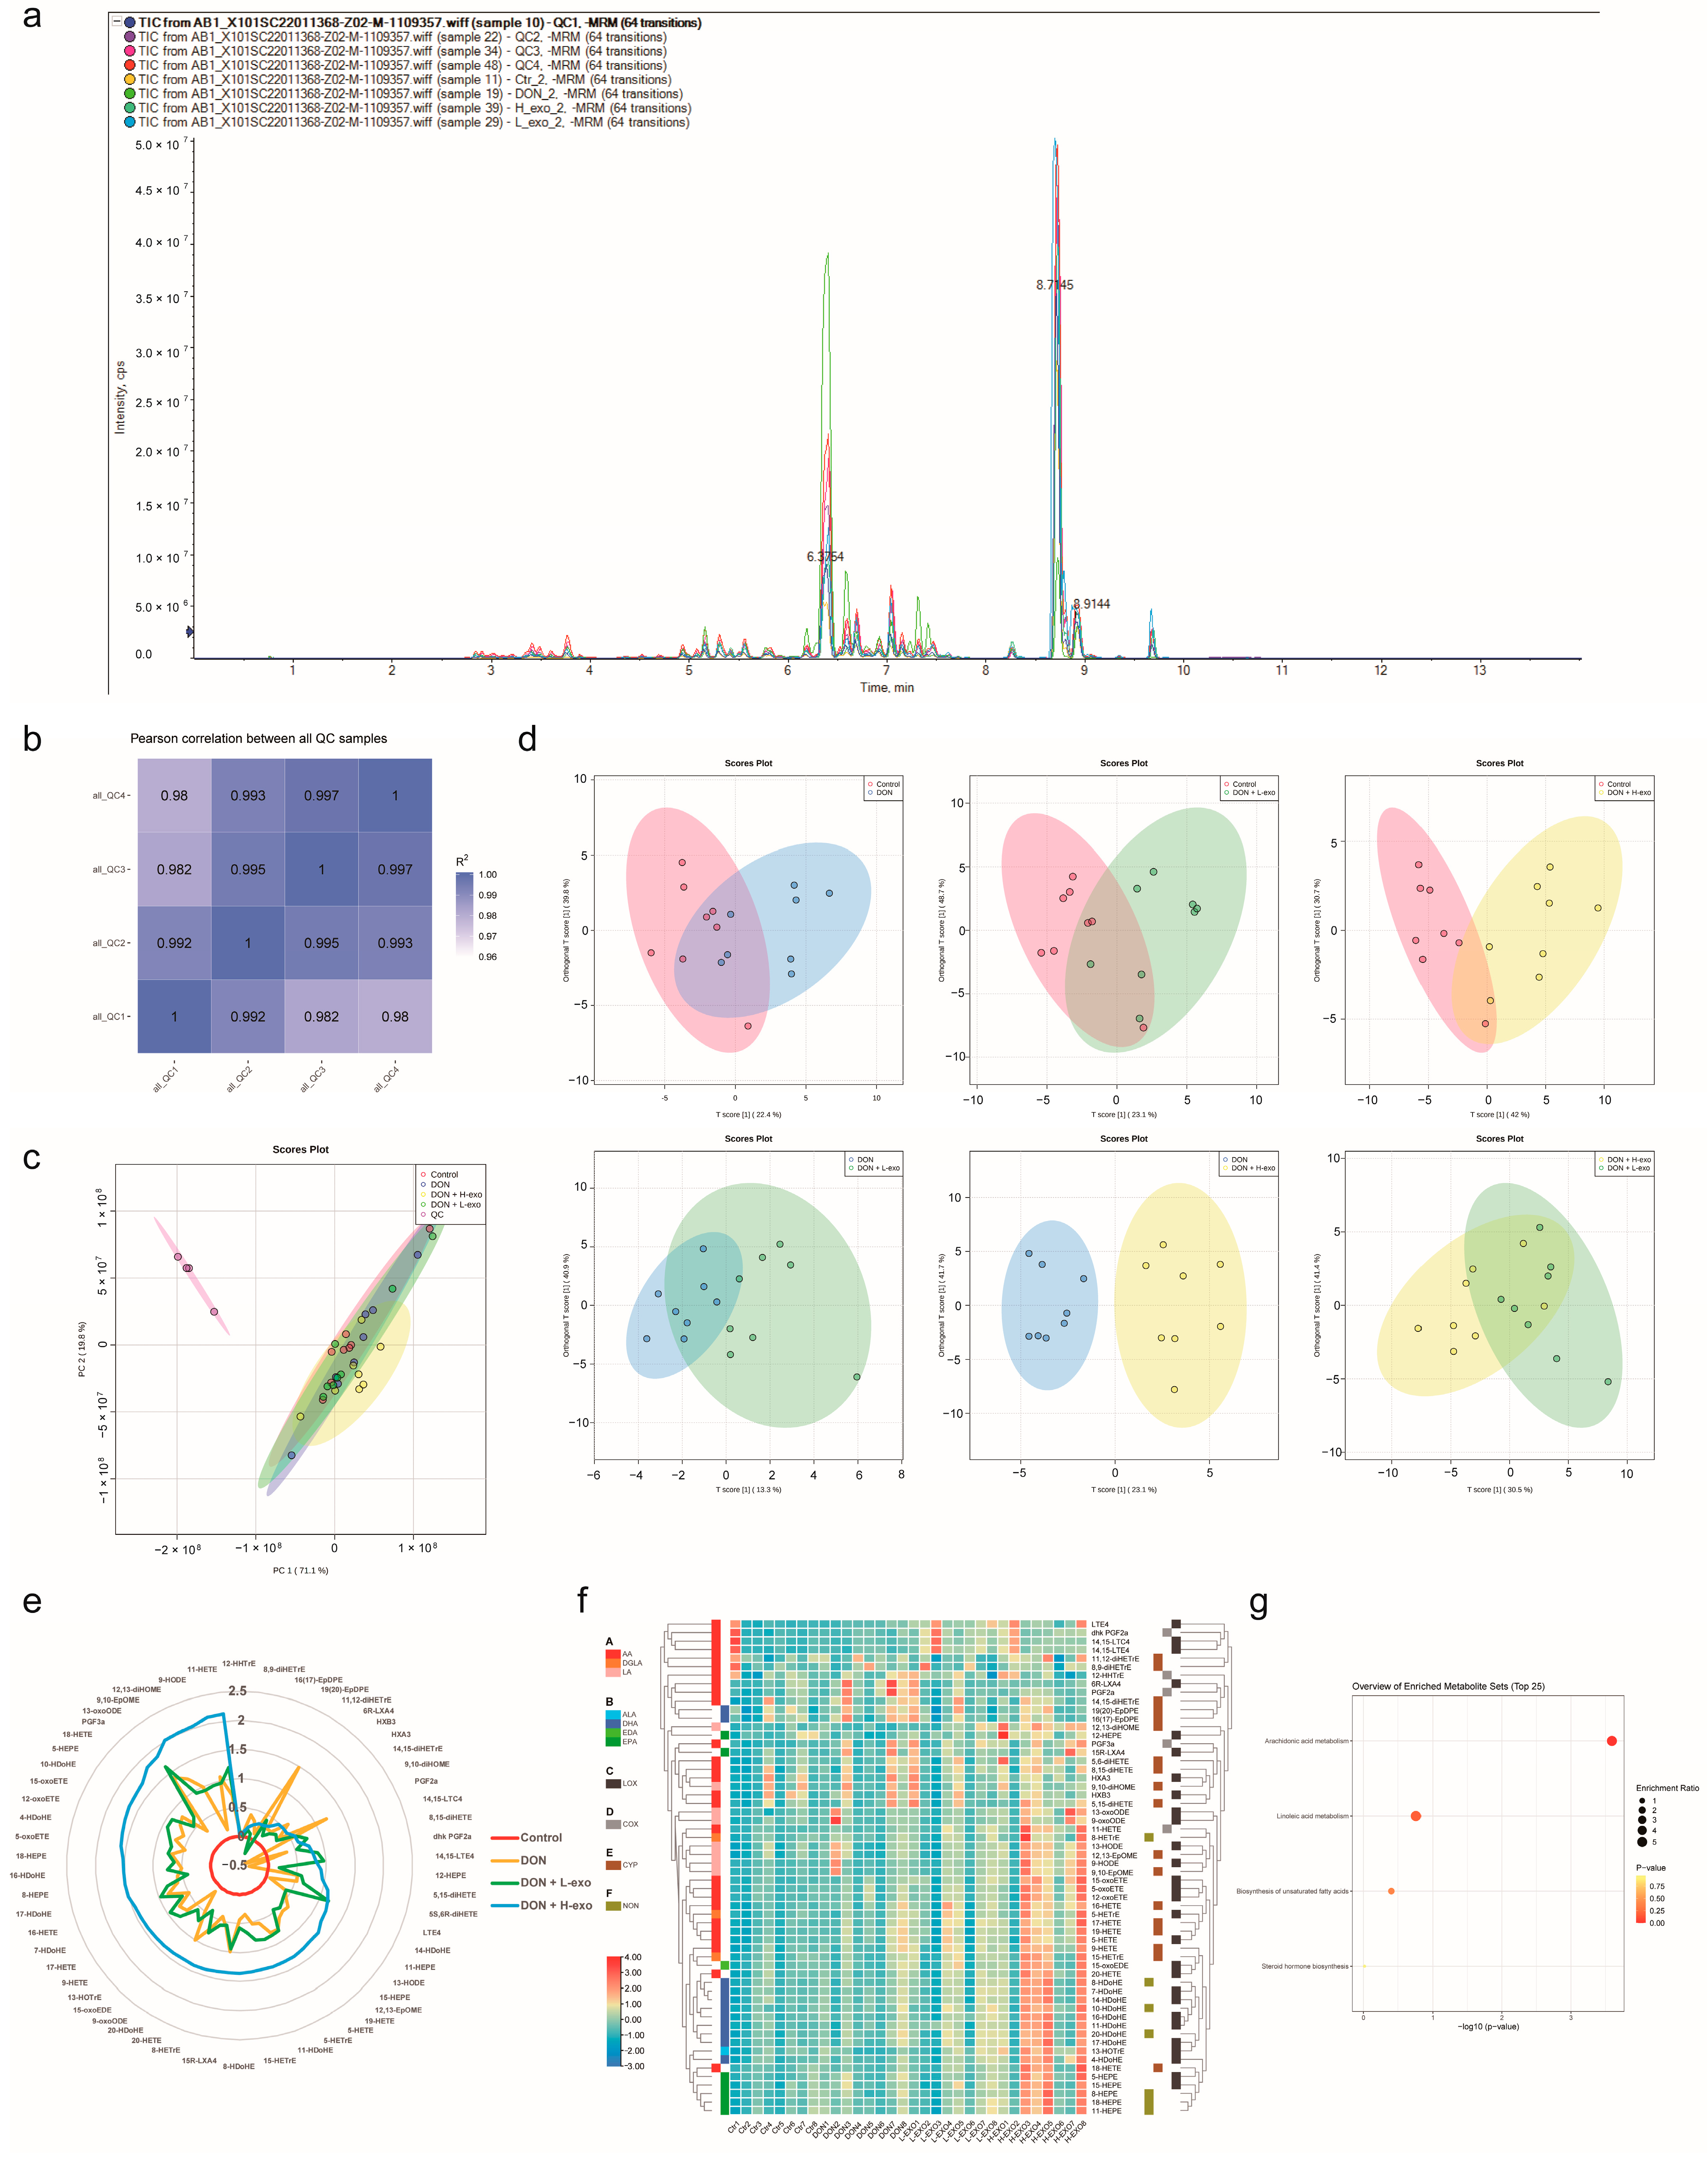
3.2. Comprehensive Analysis of Lipid Profiles for BMSC-exos Using UHPLC-MS/MS
3.3. BMSC-exos Alleviated DON-Induced Liver Damage
3.4. Effects of BMSC-exos Administration on Oxylipin Profile or Pattern after DON Exposure
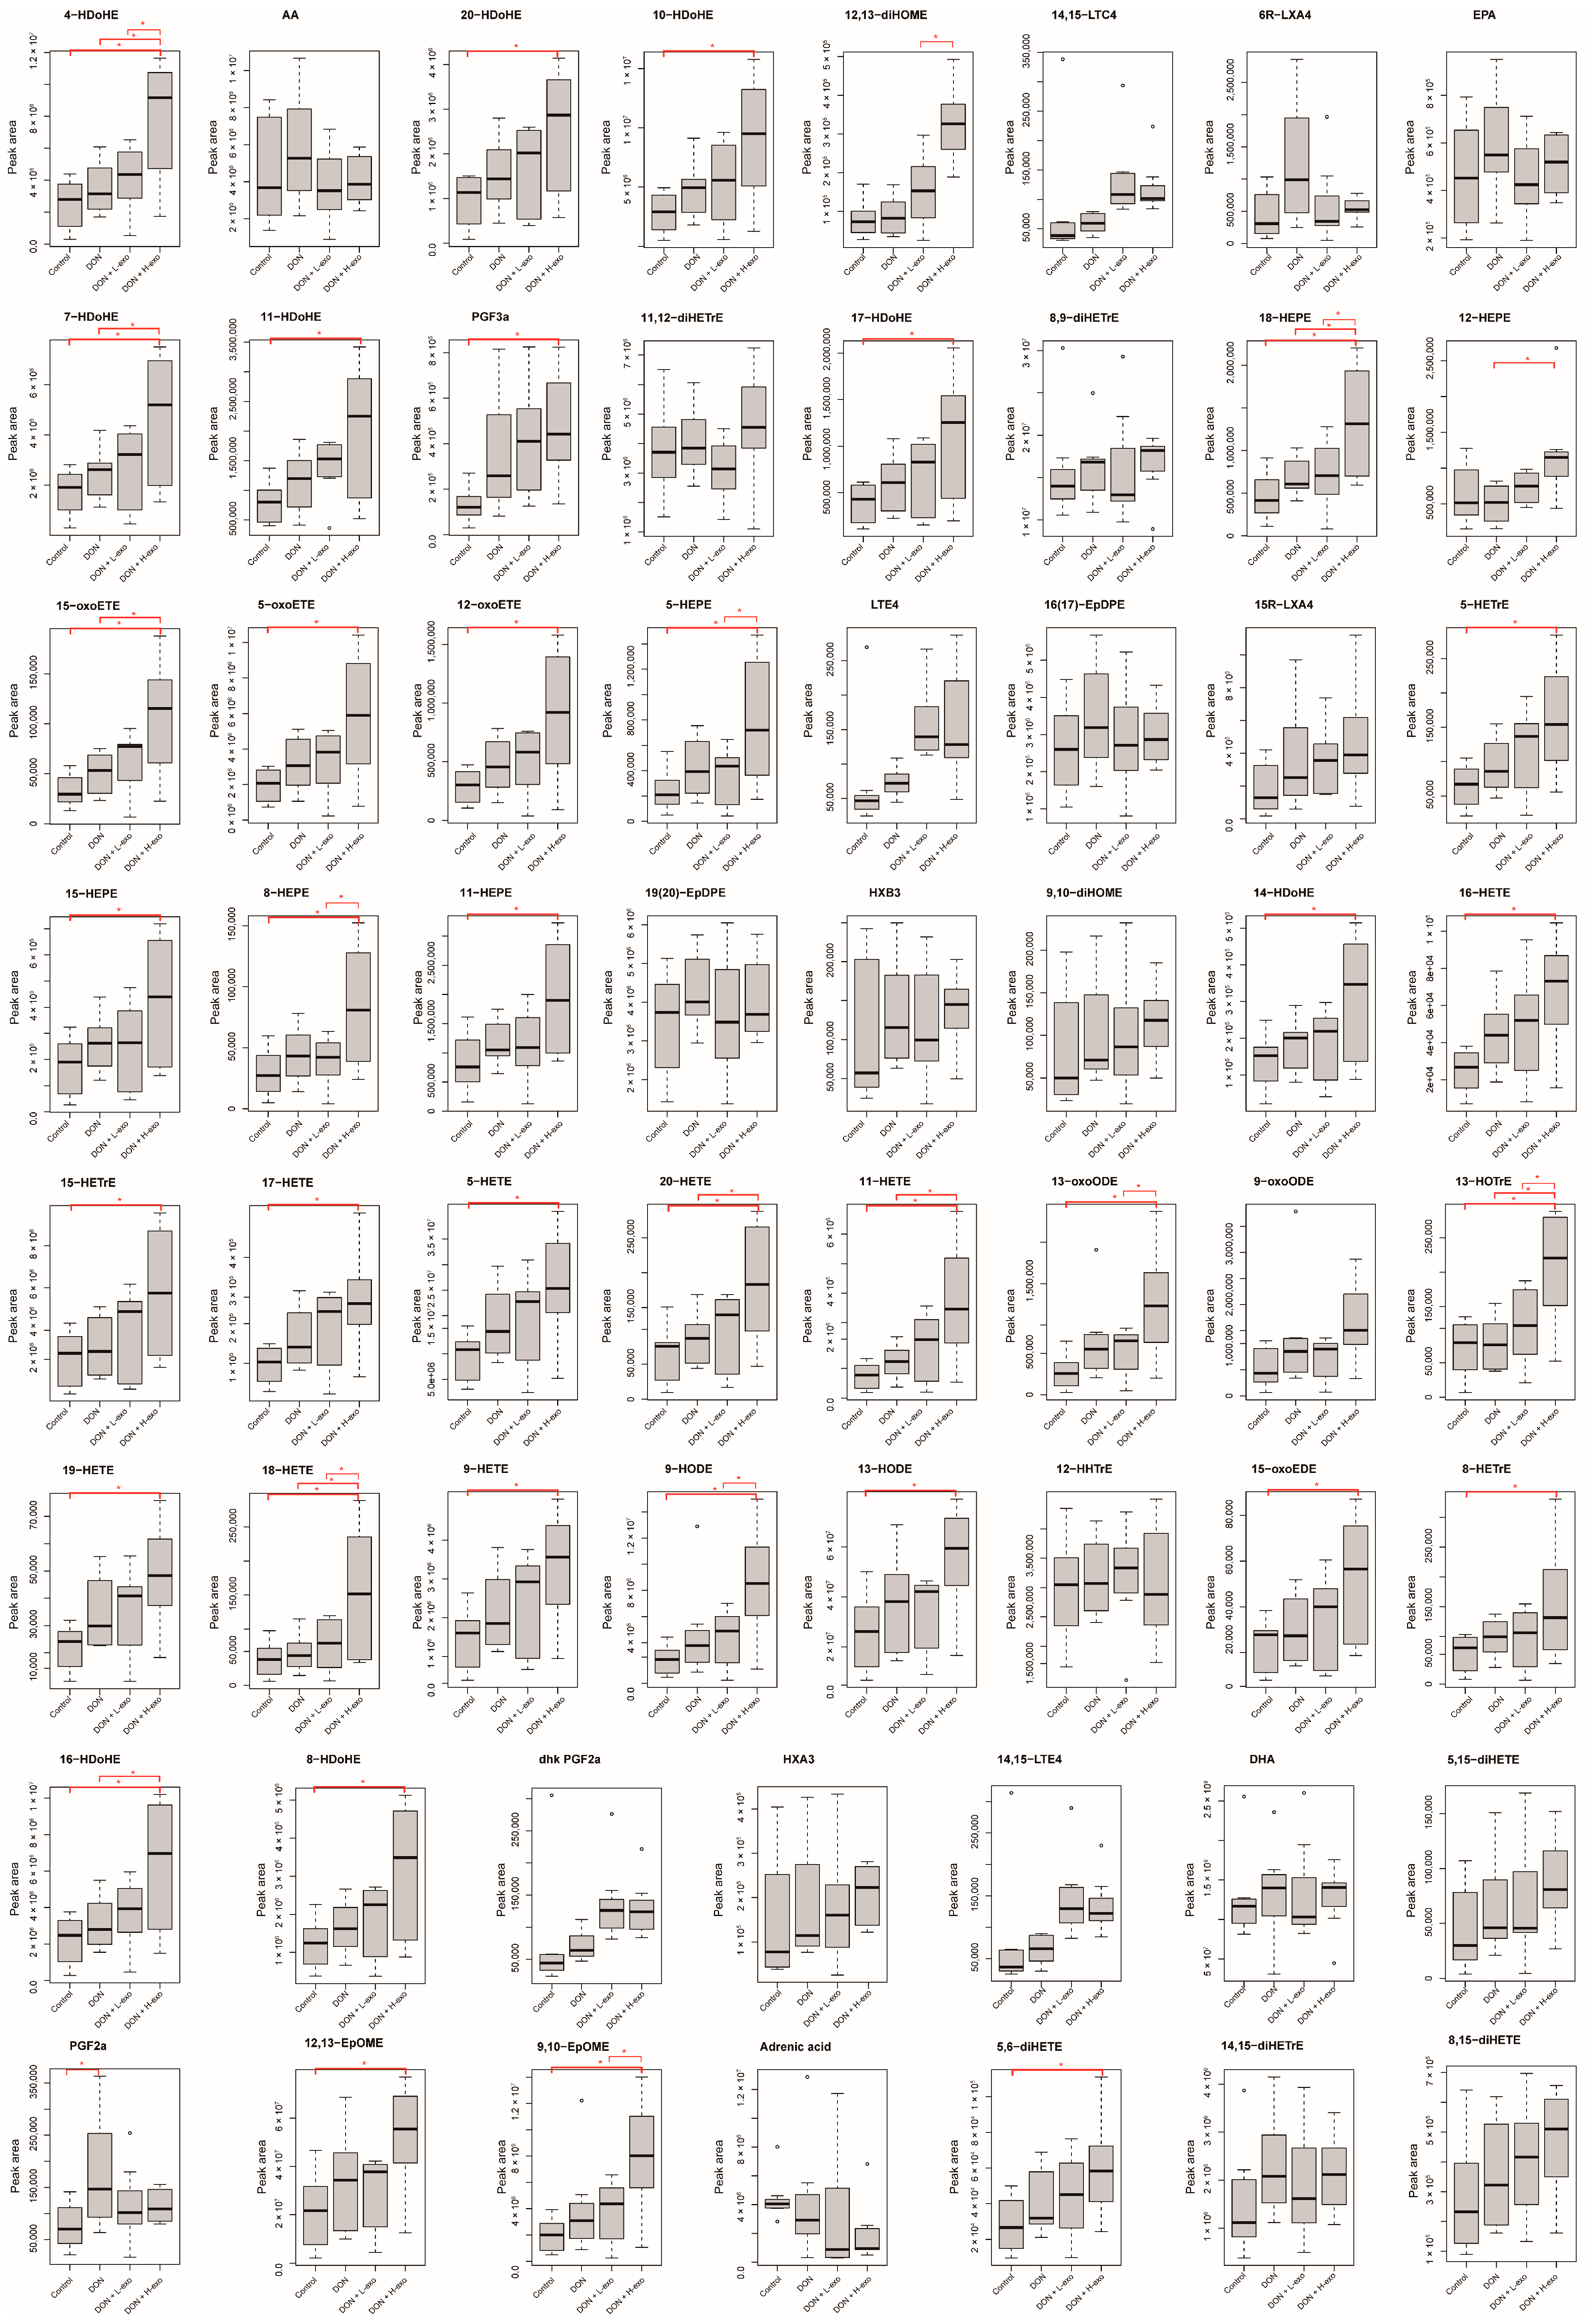
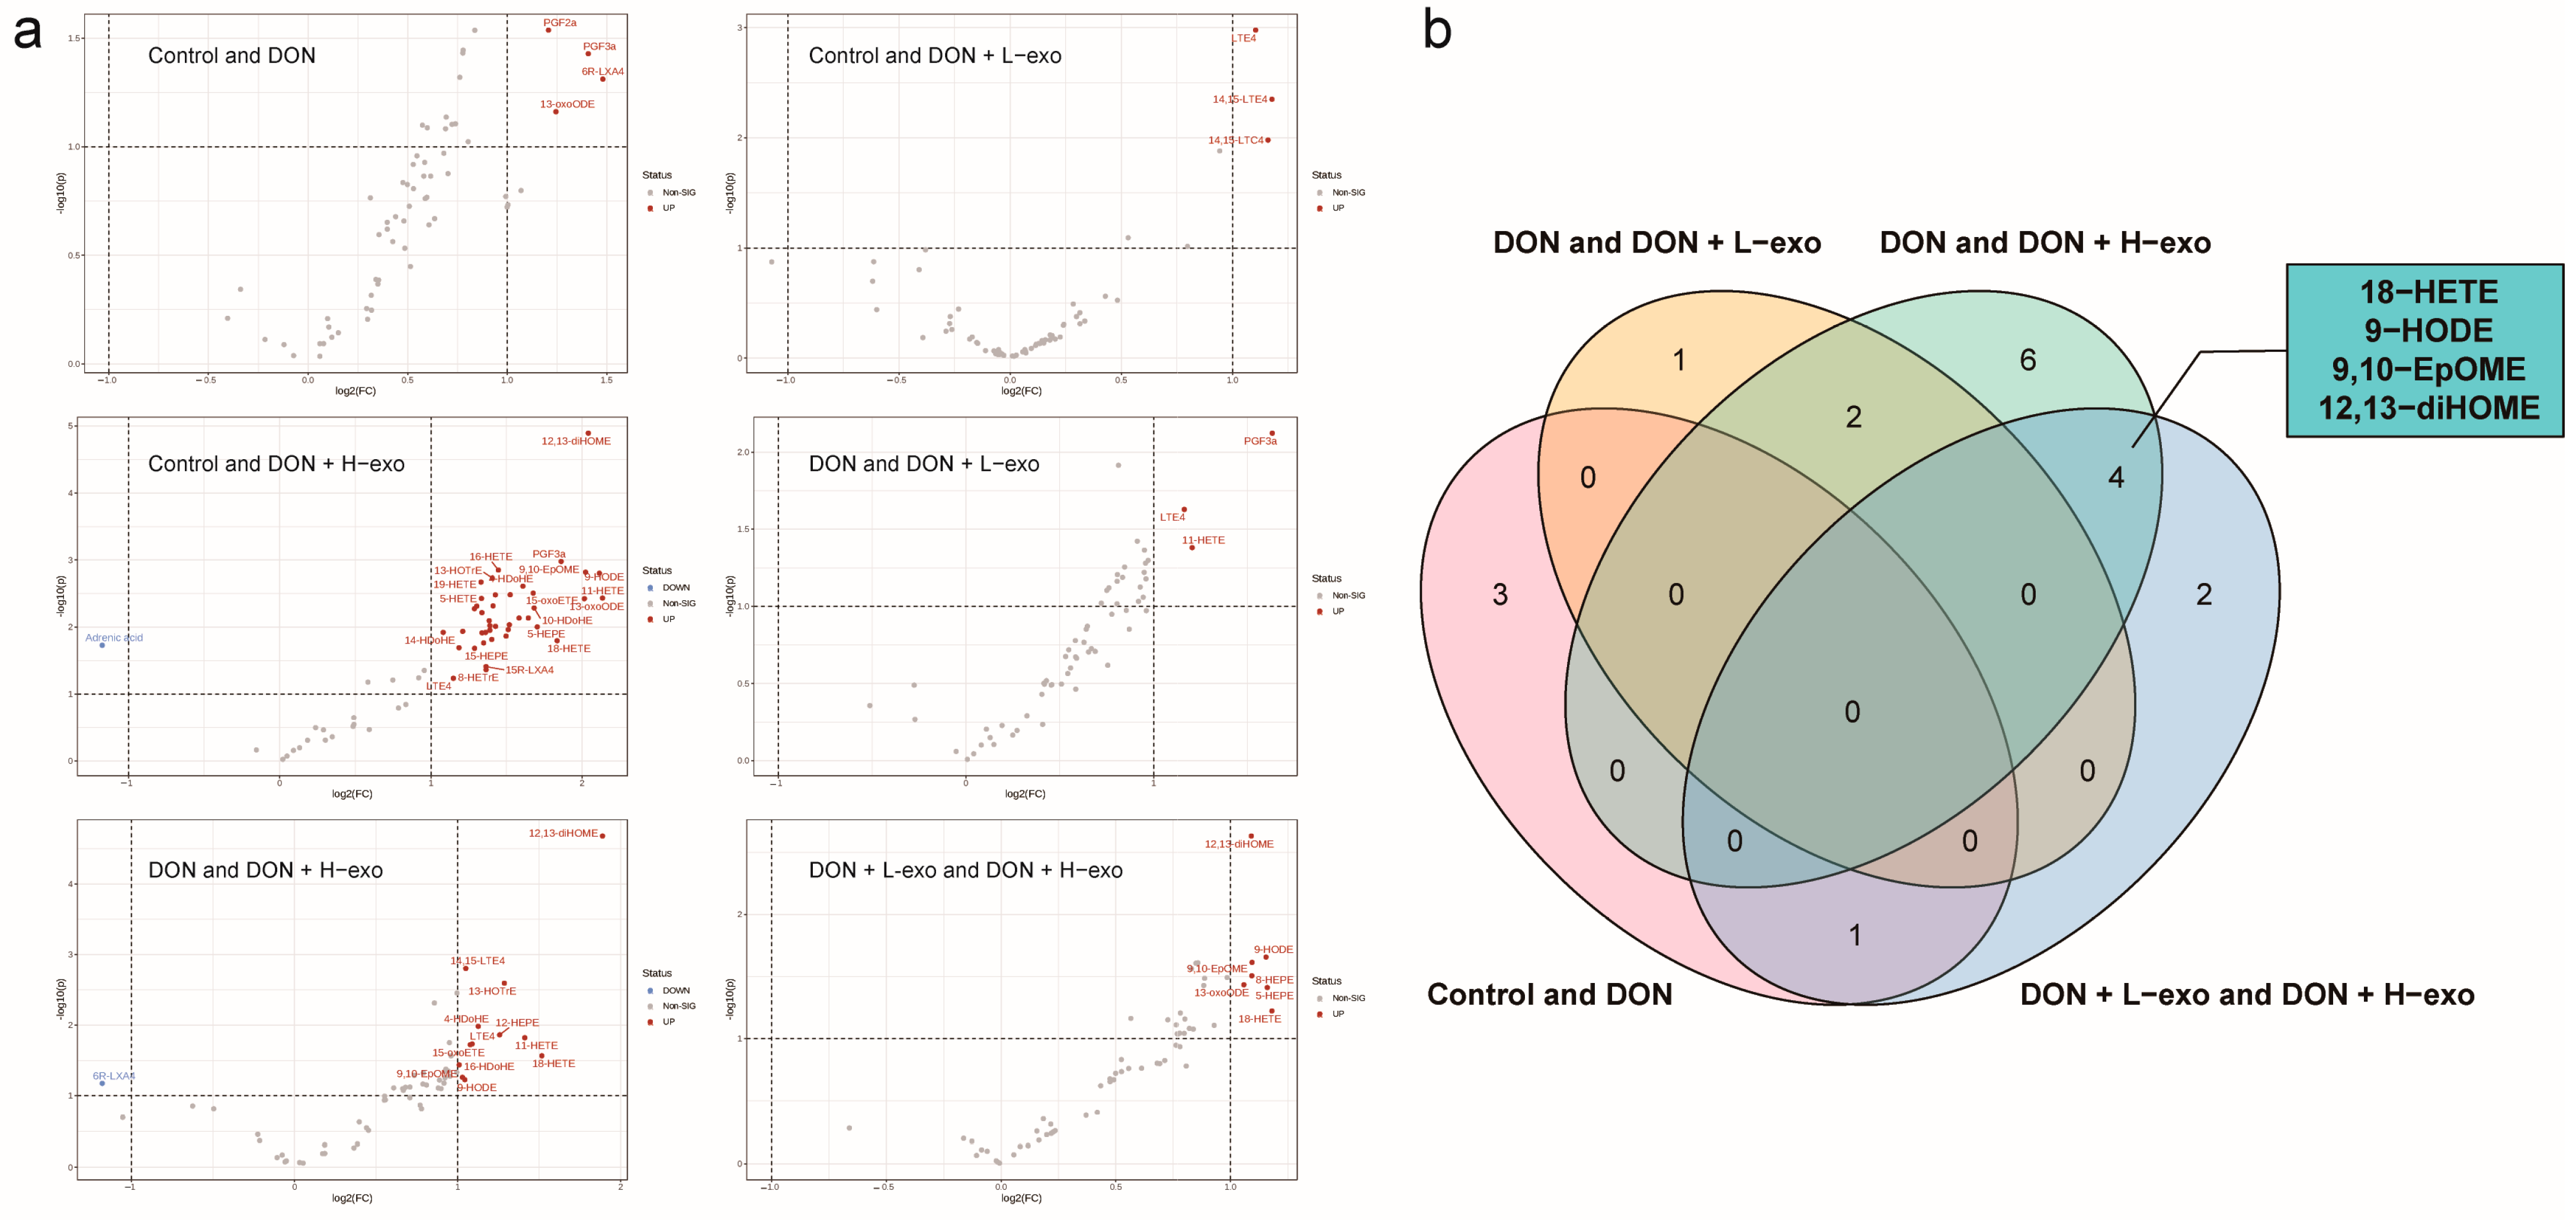
3.5. Screening for Different Key Oxylipins
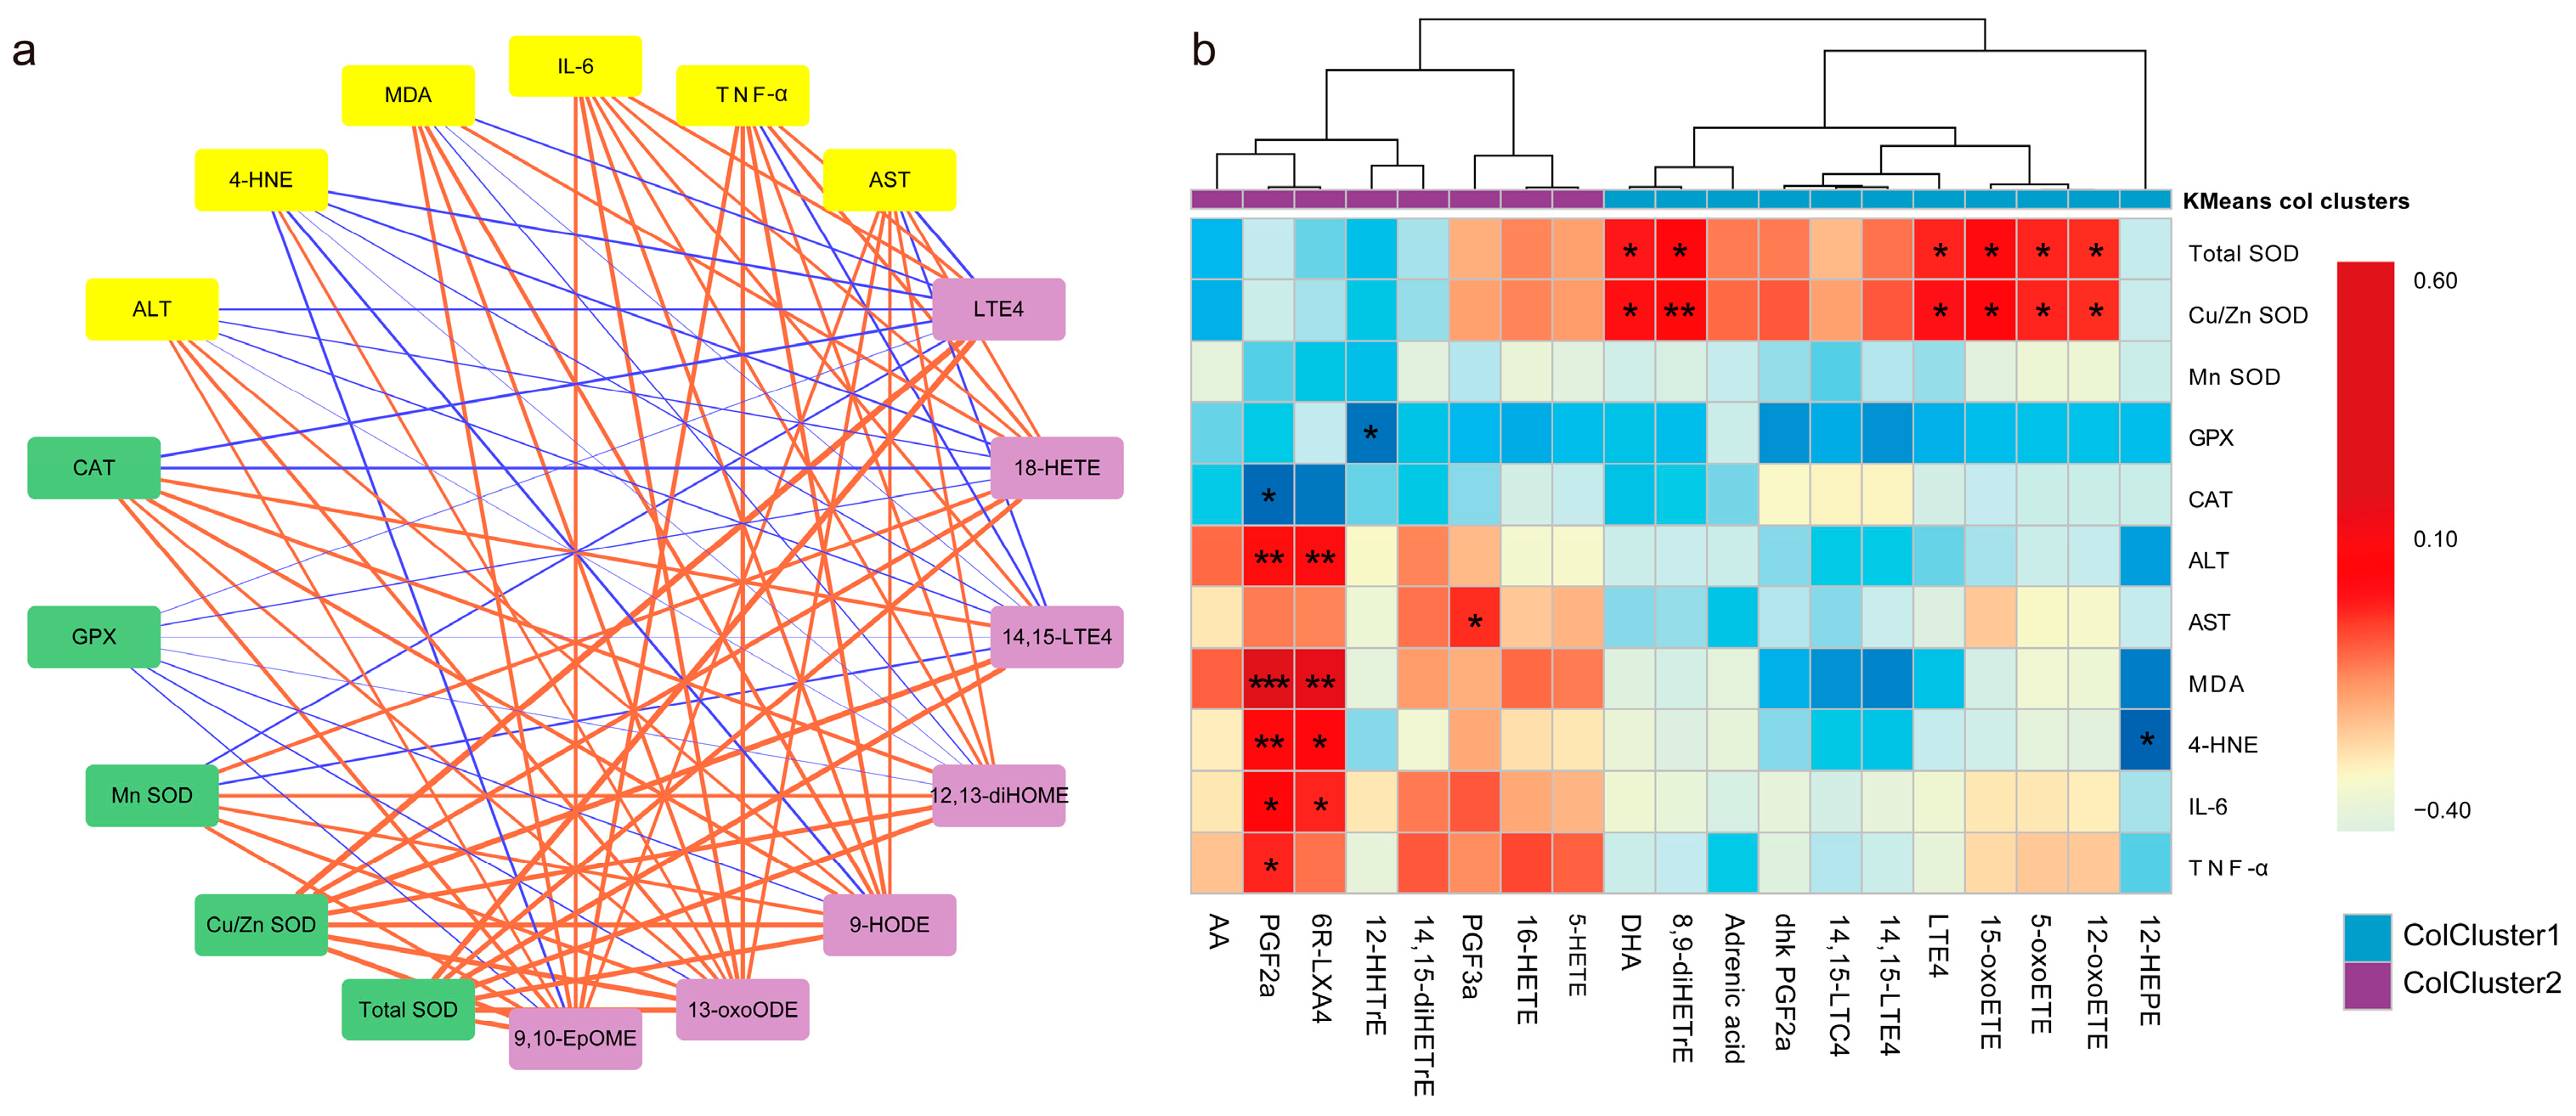
3.6. Association of Key Oxylipins with Lipid Peroxidation, Antioxidants, and Liver Function/Phenotype
4. Discussion
5. Conclusions
Supplementary Materials
Author Contributions
Funding
Institutional Review Board Statement
Informed Consent Statement
Data Availability Statement
Acknowledgments
Conflicts of Interest
References
- Bryla, M.; Ksieniewicz-Wozniak, E.; Waskiewicz, A.; Szymczyk, K.; Jedrzejczak, R. Natural Occurrence of Nivalenol, Deoxynivalenol, and Deoxynivalenol-3-Glucoside in Polish Winter Wheat. Toxins 2018, 10, 81. [Google Scholar] [CrossRef] [PubMed]
- Marin, S.; Ramos, A.J.; Cano-Sancho, G.; Sanchis, V. Mycotoxins: Occurrence, toxicology, and exposure assessment. Food Chem. Toxicol. 2013, 60, 218–237. [Google Scholar] [CrossRef] [PubMed]
- Pestka, J.J.; Smolinski, A.T. Deoxynivalenol: Toxicology and potential effects on humans. J. Toxicol. Environ. Health B Crit. Rev. 2005, 8, 39–69. [Google Scholar] [CrossRef] [PubMed]
- Sirot, V.; Fremy, J.M.; Leblanc, J.C. Dietary exposure to mycotoxins and health risk assessment in the second French total diet study. Food Chem. Toxicol. 2013, 52, 1–11. [Google Scholar] [CrossRef]
- Pestka, J.J. Deoxynivalenol: Mechanisms of action, human exposure, and toxicological relevance. Arch. Toxicol. 2010, 84, 663–679. [Google Scholar] [CrossRef]
- Wu, F.; Groopman, J.D.; Pestka, J.J. Public health impacts of foodborne mycotoxins. Annu. Rev. Food Sci. Technol. 2014, 5, 351–372. [Google Scholar] [CrossRef]
- Costa, S.; Schwaiger, S.; Cervellati, R.; Stuppner, H.; Speroni, E.; Guerra, M.C. In vitro evaluation of the chemoprotective action mechanisms of leontopodic acid against aflatoxin B1 and deoxynivalenol-induced cell damage. J. Appl. Toxicol. 2009, 29, 7–14. [Google Scholar] [CrossRef]
- Krishnaswamy, R.; Devaraj, S.N.; Padma, V.V. Lutein protects HT-29 cells against Deoxynivalenol-induced oxidative stress and apoptosis: Prevention of NF-kappa B nuclear localization and down regulation of NF-kappa B and Cyclo-Oxygenase 2 expression. Free Radic. Bio Med. 2010, 49, 50–60. [Google Scholar] [CrossRef]
- Zhang, X.; Jiang, L.; Geng, C.; Cao, J.; Zhong, L. The role of oxidative stress in deoxynivalenol-induced DNA damage in HepG2 cells. Toxicon 2009, 54, 513–518. [Google Scholar] [CrossRef]
- Braca, A.; Sortino, C.; Politi, M.; Morelli, I.; Mendez, J. Antioxidant activity of flavonoids from Licania licaniaeflora. J. Ethnopharmacol. 2002, 79, 379–381. [Google Scholar] [CrossRef]
- Pryor, W.A.; Godber, S.S. Oxidative stress status: An introduction. Free. Radic. Biol. Med. 1991, 10, 173. [Google Scholar] [CrossRef]
- Sahu, S.C.; Garthoff, L.H.; Robl, M.G.; Chirtel, S.J.; Ruggles, D.I.; Flynn, T.J.; Sobotka, T.J. Rat liver clone-9 cells in culture as a model for screening hepatotoxic potential of food-related products: Hepatotoxicity of deoxynivalenol. J. Appl. Toxicol. 2008, 28, 765–772. [Google Scholar] [CrossRef]
- Nagy, C.M.; Fejer, S.N.; Berek, L.; Molnar, J.; Viskolcz, B. Hydrogen bondings in deoxynivalenol (DON) conformations—A density functional study. J. Mol. Struc.-Theochem. 2005, 726, 55–59. [Google Scholar] [CrossRef]
- World Health Organization. Safety evaluation of certain contaminants in food. Prepared by the Sixty-fourth meeting of the Joint FAO/WHO Expert Committee on Food Additives (JECFA). FAO Food Nutr. Pap. 2006, 82, 1–778. [Google Scholar]
- Wang, L.L.; Liao, Y.X.; Peng, Z.; Chen, L.K.; Zhang, W.H.; Nussler, A.K.; Shi, S.J.; Liu, L.G.; Yang, W. Food raw materials and food production occurrences of deoxynivalenol in different regions. Trends Food Sci. Technol. 2019, 83, 41–52. [Google Scholar] [CrossRef]
- Haga, H.; Yan, I.K.; Takahashi, K.; Matsuda, A.; Patel, T. Extracellular Vesicles from Bone Marrow-Derived Mesenchymal Stem Cells Improve Survival from Lethal Hepatic Failure in Mice. Stem. Cells Transl. Med. 2017, 6, 1262–1272. [Google Scholar] [CrossRef]
- Herrera, M.B.; Fonsato, V.; Gatti, S.; Deregibus, M.C.; Sordi, A.; Cantarella, D.; Calogero, R.; Bussolati, B.; Tetta, C.; Camussi, G. Human liver stem cell-derived microvesicles accelerate hepatic regeneration in hepatectomized rats. J. Cell Mol. Med. 2010, 14, 1605–1618. [Google Scholar] [CrossRef]
- Psaraki, A.; Ntari, L.; Karakostas, C.; Korrou-Karava, D.; Roubelakis, M.G. Extracellular vesicles derived from mesenchymal stem/stromal cells: The regenerative impact in liver diseases. Hepatology 2022, 75, 1590–1603. [Google Scholar] [CrossRef]
- Rani, S.; Ryan, A.E.; Griffin, M.D.; Ritter, T. Mesenchymal Stem Cell-derived Extracellular Vesicles: Toward Cell-free Therapeutic Applications. Mol. Ther. 2015, 23, 812–823. [Google Scholar] [CrossRef]
- Kalluri, R.; LeBleu, V.S. The biology, function, and biomedical applications of exosomes. Science 2020, 367, eaau6977. [Google Scholar] [CrossRef]
- Xiong, Y.; Mahmood, A.; Chopp, M. Emerging potential of exosomes for treatment of traumatic brain injury. Neural Regen. Res. 2017, 12, 19–22. [Google Scholar] [CrossRef] [PubMed]
- Wen, S.; Dooner, M.; Cheng, Y.; Papa, E.; Del Tatto, M.; Pereira, M.; Deng, Y.; Goldberg, L.; Aliotta, J.; Chatterjee, D.; et al. Mesenchymal stromal cell-derived extracellular vesicles rescue radiation damage to murine marrow hematopoietic cells. Leukemia 2016, 30, 2221–2231. [Google Scholar] [CrossRef] [PubMed]
- Hong, J.Y.; Zapata, J.; Blackburn, A.; Baumert, R.; Bae, S.M.; Ji, H.; Nam, H.J.; Miller, R.K.; McCrea, P.D. A catenin of the plakophilin-subfamily, Pkp3, responds to canonical-Wnt pathway components and signals. Biochem. Biophys. Res. Commun. 2021, 563, 31–39. [Google Scholar] [CrossRef] [PubMed]
- Chen, L.; Lu, F.B.; Chen, D.Z.; Wu, J.L.; Hu, E.D.; Xu, L.M.; Zheng, M.H.; Li, H.; Huang, Y.; Jin, X.Y.; et al. BMSCs-derived miR-223-containing exosomes contribute to liver protection in experimental autoimmune hepatitis. Mol. Immunol. 2018, 93, 38–46. [Google Scholar] [CrossRef]
- Valadi, H.; Ekstrom, K.; Bossios, A.; Sjostrand, M.; Lee, J.J.; Lotvall, J.O. Exosome-mediated transfer of mRNAs and microRNAs is a novel mechanism of genetic exchange between cells. Nat. Cell Biol. 2007, 9, U654–U672. [Google Scholar] [CrossRef]
- Zhang, B.; Wang, M.; Gong, A.H.; Zhang, X.; Wu, X.D.; Zhu, Y.H.; Shi, H.; Wu, L.J.; Zhu, W.; Qian, H.; et al. HucMSC-Exosome mediated-Wnt4 signaling is required for cutaneous wound healing. Stem Cells. 2015, 33, 2158–2168. [Google Scholar] [CrossRef]
- Skotland, T.; Sandvig, K.; Llorente, A. Lipids in exosomes: Current knowledge and the way forward. Prog. Lipid. Res. 2017, 66, 30–41. [Google Scholar] [CrossRef]
- Ivanov, A.V.; Smirnova, O.A.; Petrushanko, I.Y.; Ivanova, O.N.; Karpenko, I.L.; Alekseeva, E.; Sominskaya, I.; Makarov, A.A.; Bartosch, B.; Kochetkov, S.N.; et al. HCV core protein uses multiple mechanisms to induce oxidative stress in human hepatoma Huh7 cells. Viruses 2015, 7, 2745–2770. [Google Scholar] [CrossRef]
- Li, H.; Zhu, W.; Zhang, L.; Lei, H.; Wu, X.; Guo, L.; Chen, X.; Wang, Y.; Tang, H. The metabolic responses to hepatitis B virus infection shed new light on pathogenesis and targets for treatment. Sci. Rep. 2015, 5, 8421. [Google Scholar] [CrossRef]
- Gentric, G.; Maillet, V.; Paradis, V.; Couton, D.; L’Hermitte, A.; Panasyuk, G.; Fromenty, B.; Celton-Morizur, S.; Desdouets, C. Oxidative stress promotes pathologic polyploidization in nonalcoholic fatty liver disease. J. Clin. Investig. 2015, 125, 981–992. [Google Scholar] [CrossRef]
- Singal, A.K.; Jampana, S.C.; Weinman, S.A. Antioxidants as therapeutic agents for liver disease. Liver Int. 2011, 31, 1432–1448. [Google Scholar] [CrossRef]
- Yan, Y.M.; Jiang, W.Q.; Tan, Y.W.; Zou, S.Q.; Zhang, H.G.; Mao, F.; Gong, A.H.; Qian, H.; Xu, W.R. hucMSC Exosome-Derived GPX1 Is Required for the Recovery of Hepatic Oxidant Injury. Mol. Ther. 2017, 25, 465–479. [Google Scholar] [CrossRef]
- Borst, J.W.; Visser, N.V.; Kouptsova, O.; Visser, A.J.W.G. Oxidation of unsaturated phospholipids in membrane bilayer mixtures is accompanied by membrane fluidity changes. Bba-Mol. Cell Biol. L 2000, 1487, 61–73. [Google Scholar] [CrossRef]
- Ji, J.; Zhu, P.; Cui, F.; Pi, F.; Zhang, Y.; Li, Y.; Wang, J.; Sun, X. The Antagonistic Effect of Mycotoxins Deoxynivalenol and Zearalenone on Metabolic Profiling in Serum and Liver of Mice. Toxins 2017, 9, 28. [Google Scholar] [CrossRef]
- Liu, A.Q.; Lin, D.; Zhao, H.J.; Chen, L.; Cai, B.L.; Lin, K.L.; Shen, S.G.F. Optimized BMSC-derived osteoinductive exosomes immobilized in hierarchical scaffold via lyophilization for bone repair through Bmpr2/Acvr2b competitive receptor-activated Smad pathway. Biomaterials 2021, 272, 120718. [Google Scholar] [CrossRef]
- Guo, J.Q.; Gao, X.; Lin, Z.J.; Wu, W.Z.; Huang, L.H.; Dong, H.Y.; Chen, J.; Lu, J.; Fu, Y.F.; Wang, J.; et al. BMSCs reduce rat granulosa cell apoptosis induced by cisplatin and perimenopause. BMC Cell Biol. 2013, 14, 18. [Google Scholar] [CrossRef]
- Kim, H.Y.; Cheon, J.H.; Lee, S.H.; Min, J.Y.; Back, S.Y.; Song, J.G.; Kim, D.H.; Lim, S.J.; Han, H.K. Ternary nanocomposite carriers based on organic clay-lipid vesicles as an effective colon-targeted drug delivery system: Preparation and in vitro/in vivo characterization. J. Nanobiotechnol. 2020, 18, 17. [Google Scholar] [CrossRef]
- Yan, Y.Z.; Wang, J.H.; Huang, D.G.; Lv, J.; Li, H.; An, J.; Cui, X.J.; Zhao, H.P. Plasma lipidomics analysis reveals altered lipids signature in patients with osteonecrosis of the femoral head. Metabolomics 2022, 18, 14. [Google Scholar] [CrossRef]
- Matyash, V.; Liebisch, G.; Kurzchalia, T.V.; Shevchenko, A.; Schwudke, D. Lipid extraction by methyl-tert-butyl ether for high-throughput lipidomics. J. Lipid Res. 2008, 49, 1137–1146. [Google Scholar] [CrossRef]
- Fahy, E.; Alvarez-Jarreta, J.; Brasher, C.J.; Nguyen, A.; Hawksworth, J.I.; Rodrigues, P.; Meckelmann, S.; Allen, S.M.; O’Donnell, V.B. LipidFinder on LIPID MAPS: Peak filtering, MS searching and statistical analysis for lipidomics. Bioinformatics 2019, 35, 685–687. [Google Scholar] [CrossRef]
- Kind, T.; Liu, K.H.; Lee, D.Y.; DeFelice, B.; Meissen, J.K.; Fiehn, O. LipidBlast in silico tandem mass spectrometry database for lipid identification. Nat. Methods 2013, 10, 755. [Google Scholar] [CrossRef] [PubMed]
- Zhang, C.L.; Wang, H.L.; Li, P.C.; Hong, C.D.; Chen, A.Q.; Qiu, Y.M.; Zeng, A.P.; Zhou, Y.F.; Hu, B.; Li, Y.N. Mfsd2a overexpression alleviates vascular dysfunction in diabetic retinopathy. Pharmacol. Res. 2021, 171, 105755. [Google Scholar] [CrossRef] [PubMed]
- Wang, Y.; Armando, A.M.; Quehenberger, O.; Yan, C.; Dennis, E.A. Comprehensive ultra-performance liquid chromatographic separation and mass spectrometric analysis of eicosanoid metabolites in human samples. J. Chromatogr. A 2014, 1359, 60–69. [Google Scholar] [CrossRef] [PubMed]
- Narvaez-Rivas, M.; Zhang, Q.B. Comprehensive untargeted lipidomic analysis using core-shell C30 particle column and high field orbitrap mass spectrometer. J. Chromatogr. A 2016, 1440, 123–134. [Google Scholar] [CrossRef]
- Dominici, M.; Le Blanc, K.; Mueller, I.; Slaper-Cortenbach, I.; Marini, F.; Krause, D.; Deans, R.; Keating, A.; Prockop, D.; Horwitz, E. Minimal criteria for defining multipotent mesenchymal stromal cells. The International Society for Cellular Therapy position statement. Cytotherapy 2006, 8, 315–317. [Google Scholar] [CrossRef]
- McCue, M.D. Fatty acid analyses may provide insight into the progression of starvation among squamate reptiles. Comp. Biochem. Phys. A 2008, 151, 239–246. [Google Scholar] [CrossRef]
- Pan, D.A.; Storlien, L.H. Dietary lipid profile is a determinant of tissue phospholipid fatty acid composition and rate of weight gain in rats. J. Nutr. 1993, 123, 512–519. [Google Scholar] [CrossRef]
- Bouaziz, C.; Abid-Essefi, S.; Bouslimi, A.; El Golli, E.; Bacha, H. Cytotoxicity and related effects of T-2 toxin on cultured Vero cells. Toxicon 2006, 48, 343–352. [Google Scholar] [CrossRef]
- Braicu, C.; Berindan-Neagoe, I.; Tudoran, O.; Balacescu, O.; Rugina, D.; Gherman, C.; Socaciu, C.; Irimie, A. In vitro evaluation of the chemoprotective action of flavan-3-ols against deoxynivalenol related toxicity. Arch. Zootech 2009, 12, 45–55. [Google Scholar]
- Munagala, R.; Aqil, F.; Jeyabalan, J.; Gupta, R.C. Bovine milk-derived exosomes for drug delivery. Cancer Lett. 2016, 371, 48–61. [Google Scholar] [CrossRef]
- Cheeseman, K.H. Mechanisms and effects of lipid peroxidation. Mol. Asp. Med. 1993, 14, 191–197. [Google Scholar] [CrossRef]
- Yin, H.; Xu, L.; Porter, N.A. Free radical lipid peroxidation: Mechanisms and analysis. Chem. Rev. 2011, 111, 5944–5972. [Google Scholar] [CrossRef]
- Girotti, A.W. Mechanisms of lipid peroxidation. J. Free Radic. Biol. Med. 1985, 1, 87–95. [Google Scholar] [CrossRef]
- Mosca, M.; Ceglie, A.; Ambrosone, L. Effect of membrane composition on lipid oxidation in liposomes. Chem. Phys. Lipids 2011, 164, 158–165. [Google Scholar] [CrossRef]
- Astarita, G.; Kendall, A.C.; Dennis, E.A.; Nicolaou, A. Targeted lipidomic strategies for oxygenated metabolites of polyunsaturated fatty acids. Biochim. Et Biophys. Acta 2015, 1851, 456–468. [Google Scholar] [CrossRef]
- Gladine, C.; Ostermann, A.I.; Newman, J.W.; Schebb, N.H. MS-based targeted metabolomics of eicosanoids and other oxylipins: Analytical and inter-individual variabilities. Free Radic. Biol. Med. 2019, 144, 72–89. [Google Scholar] [CrossRef]
- Tribble, D.L.; Aw, T.Y.; Jones, D.P. The pathophysiological significance of lipid peroxidation in oxidative cell injury. Hepatology 1987, 7, 377–386. [Google Scholar] [CrossRef]
- Rice-Evans, C.; Burdon, R. Free radical-lipid interactions and their pathological consequences. Prog. Lipid Res. 1993, 32, 71–110. [Google Scholar] [CrossRef]
- Kappus, H. 12—Lipid Peroxidation: Mechanisms, Analysis, Enzymology and Biological Relevance. In Oxidative Stress; Sies, H., Ed.; Academic Press: London, UK, 1985; pp. 273–310. [Google Scholar]
- Esterbauer, H.; Schaur, R.J.; Zollner, H. Chemistry and biochemistry of 4-hydroxynonenal, malonaldehyde and related aldehydes. Free Radic. Biol. Med. 1991, 11, 81–128. [Google Scholar] [CrossRef]
- Sies, H. Strategies of antioxidant defense. Eur. J. Biochem. 1993, 215, 213–219. [Google Scholar] [CrossRef]
- Esterbauer, H. Aldehydic products of lipid peroxidation. Free. Radic. Lipid Peroxidation Cancer 1982, 101–128. Available online: https://cir.nii.ac.jp/crid/1573105974215594368 (accessed on 20 February 2023).


Disclaimer/Publisher’s Note: The statements, opinions and data contained in all publications are solely those of the individual author(s) and contributor(s) and not of MDPI and/or the editor(s). MDPI and/or the editor(s) disclaim responsibility for any injury to people or property resulting from any ideas, methods, instructions or products referred to in the content. |
© 2023 by the authors. Licensee MDPI, Basel, Switzerland. This article is an open access article distributed under the terms and conditions of the Creative Commons Attribution (CC BY) license (https://creativecommons.org/licenses/by/4.0/).
Share and Cite
Meng, Z.; Liao, Y.; Peng, Z.; Zhou, X.; Zhou, H.; Nüssler, A.K.; Liu, L.; Yang, W. Bone Marrow Mesenchymal Stem-Cell-Derived Exosomes Ameliorate Deoxynivalenol-Induced Mice Liver Damage. Antioxidants 2023, 12, 588. https://doi.org/10.3390/antiox12030588
Meng Z, Liao Y, Peng Z, Zhou X, Zhou H, Nüssler AK, Liu L, Yang W. Bone Marrow Mesenchymal Stem-Cell-Derived Exosomes Ameliorate Deoxynivalenol-Induced Mice Liver Damage. Antioxidants. 2023; 12(3):588. https://doi.org/10.3390/antiox12030588
Chicago/Turabian StyleMeng, Zitong, Yuxiao Liao, Zhao Peng, Xiaolei Zhou, Huanhuan Zhou, Andreas K. Nüssler, Liegang Liu, and Wei Yang. 2023. "Bone Marrow Mesenchymal Stem-Cell-Derived Exosomes Ameliorate Deoxynivalenol-Induced Mice Liver Damage" Antioxidants 12, no. 3: 588. https://doi.org/10.3390/antiox12030588
APA StyleMeng, Z., Liao, Y., Peng, Z., Zhou, X., Zhou, H., Nüssler, A. K., Liu, L., & Yang, W. (2023). Bone Marrow Mesenchymal Stem-Cell-Derived Exosomes Ameliorate Deoxynivalenol-Induced Mice Liver Damage. Antioxidants, 12(3), 588. https://doi.org/10.3390/antiox12030588