Article

Modeling, Simulation, Optimization, and Experimental Verification of Mercury Removal onto Natural and Sulfur-Impregnated Zeolite Clinoptilolite—Assessment of Feasibility for Remediation of Mercury-Contaminated Soil

1
Faculty of Chemistry and Technology, University of Split, Ruđera Boškovića 35, 21000 Split, Croatia
2
Regional Veterinary Institute Split, Croatian Veterinary Institute, Poljička cesta 33, 21000 Split, Croatia
*
Author to whom correspondence should be addressed.
Processes 2023, 11(2), 606; https://doi.org/10.3390/pr11020606
Submission received: 18 January 2023 / Revised: 10 February 2023 / Accepted: 14 February 2023 / Published: 16 February 2023
(This article belongs to the Section Environmental and Green Processes)

Abstract

:
In this paper, a series of equilibrium and kinetic experiments of Hg(II) removal in a single-stage batch reactor on natural (NZ) and sulfur-impregnated zeolite (SZ) were performed. Batch sorption of Hg(II) on zeolites was studied using different isothermal and kinetic models. It was found to be best described by the Brouers-Sotolongo isotherm and the Vermeulen’s approximation, which were applied in optimizing the mass and contact time in two-stage cross-current and counter-current flow batch reactors based on the desired criterion of 99.9% removal efficiency. Mathematical models for minimizing zeolite mass and contact time were developed and experimentally verified. The optimum minimum masses of NZ and SZ were calculated for all systems, and a significant saving in SZ consumption was found when the counter-current design was applied. The toxicity characteristic leaching procedure (TCLP) was applied to mercury contaminated soil from the Idrija mine region in Slovenia to evaluate potential soil toxicity. The results showed that the soil is extremely contaminated and represents hazardous waste. The addition of zeolites significantly reduced the concentration of leached Hg, with the most satisfactory results obtained with SZ. It was found that at the lowest dose of 0.25 g of SZ, the leached Hg concentration was reduced below the maximum concentration criterion of 0.2 mg/L according to the TCLP test. This study revealed that SZ could be a potential sorbent for in situ remediation of mercury contaminated soil.

Graphical Abstract

1. Introduction

Water is undoubtedly the most important and invaluable natural resource that human utilize from nature. The main source of fresh water for food and industrial production, human consumption, etc., is mostly groundwater [1]. However, groundwater is vulnerable because it is often the target of pollution from natural and, in particular, anthropogenic sources. Some of the anthropogenic activities such as inadequate disposal of solid waste, discharge of insufficiently treated industrial wastewater, use of fertilizers, and mining cause the release of contaminants into the environment. Among the mentioned, mining activities have significant negative impact on the environment. Namely, during the excavation and ore processing, waste material is generated in addition to mine tailings, which are most often disposed of near the mine. Moreover, under the influence of environmental conditions (wind or water runoff), pollution is transported kilometers to more distant places from the source of pollution [1,2,3].
One such example is the Idrija mine in Slovenia, which ceased operations in 1995 due to low mercury content in the ore, and thus lack of profitability, as well as awareness of mercury toxicity effects and the mass poisonings that occurred in Minamata (in 1953, 1956, and 1965) and Iraq (in 1971/1972) [4,5,6]. Despite the fact that mining activities in the Idrija mine have been discontinued for almost 27 years, investigations have shown that the mentioned area is extremely polluted with mercury, which is transported through watersheds to more distant areas and even to the Gulf of Trieste via the Idrijca and Soča-Isonzo rivers [7,8]. Investigations of the mercury content in the vicinity of the Idrija mine revealed that the amount of mercury in the soil in some locations was over 10,000 mg/kg. It was found that mercury is present in the form of cinnabar in the amount of 35–50%, which indicates a large presence of potentially mobile mercury [9,10]. Although the mercury is present mainly in inorganic form, it can also make complexes with organic matter which increases its mobility, or it can abiotically or biotically transform into an organic form. Among the organic mercury compounds, methylmercury is the most toxic because it can be easily uptaken to phytoplankton, representing the starting point for its bioaccumulation and biomagnification within the food web [6,11,12]. Therefore, remediation of the soil in surrounding areas of the Idrija mine in Slovenia is of significant interest in order to prevent or reduce the formation of methylmercury, as well as spreading of pollution and negative impacts on the entire ecosystem. Moreover, remediation is of crucial interest since Teršić et al. [8] estimate the leaching of soluble mercury in the period of at least the next 100 years.
For this purpose, different in situ and ex situ remediation methods could be applied, whereby the first ones based on sorption processes are more easily feasible [13,14,15]. For in situ remediation such as soil sprinkling with a sorbent, it is very important that the mercury is stabilized within the sorbent with minimal or no re-sorption, since sorbent is permanently left in the environment. In case the sorbent is used for ex situ remediation, the saturated sorbent must be disposed of in appropriate manner [13,15]. Regardless of the physico-chemical remediation method, for removal of extremely toxic mercury, the sorbent must have high selectivity and capacity. According to the available literature, the most common sorbents for mercury sorption are activated carbon [16,17,18] and biochar [19,20,21,22,23]. However, due to the high cost of their preparation, they are often replaced by other natural sorbents such as zeolites [24,25,26,27] and clays [28,29,30]. Among them, zeolites as naturally occurring materials are already recognized as highly efficient in environmental remediation. Moreover, they are compatible with nature, i.e., non-toxic, eco-friendly, cost effective, widespread, and easily available. Natural zeolites belong to the group of aluminosilicate minerals with a three-dimensional framework consisting of SiO4 and AlO4 tetrahedra. They have a negative charge due to the isomorphous substitution of Si4+ with Al3+, which is compensated by cations, mostly Na+, K+, Ca2+ and Mg2+. These cations have the ability to participate in the ion exchange process with heavy metal cations in the surrounding media [31,32]. Additionally, modifications of zeolites usually improve their sorption capacity and make them capable of removing of not only cationic, but also anionic and organic compounds [33].
Since it is well-known that sulfides are the most common scavengers of mercury in nature, materials impregnated with sulfur species are most commonly used as mercury-binding sorbents due to the high affinity of sulfur for mercury according to the HASAB theory (hard and soft Lewis acids and bases) [13]. Recently, various modification methods have been applied, mainly with sodium sulfide [16,17,19,20,21,27,34], potassium sulfide [35], carbon disulfide [19,36,37], dimethyl disulfide [18], sulfuric acid [17,19], sulfur powder [18], sulfur dioxide [18,38], and cystamine hydrochloride [25]. Investigations have shown increased sorption properties of the modified sorbents compared to the starting materials. Namely, the modifications contribute to the change of the sorbent physico-chemical properties as well as the incorporation of sulfide species, which are primarily responsible for the improved mercury capture. Therefore, zeolite impregnated with sulfur species should be an extremely selective and promising sorbent for the Hg species removal due to the high affinity of sulfur for mercury, forming sparingly soluble HgS (Ksp = 3.9∙× 10−53) [39]. Its application does not introduce additional contamination into the environment, since sulfide species are natural constituents of the hydrogeological layer, making it environmentally friendly.
Despite the requirement for additional preparation, natural sorbents can be considered as low-cost, as long as their improved sorption capacity can compensate the incurred cost. Furthermore, it is important to consider the treatment efficiency in parallel with the costs involved in the process [40]. Thus, it is necessary to take into consideration sorption optimization in terms of minimizing sorbent mass and contact time while achieving maximum sorption efficiency. In this sense, two batch reactor design approaches that include the processing of equilibrium or kinetic data are used. If the sorption process allows sufficient contact time, as in the case of in situ remediation, then an optimization method based on equilibrium data is applied using the mass balance equation and the appropriate isotherm model. This achieves mass optimization in the so-called single-stage sorption process, which can be effective for remediation of environments loaded with low mercury concentrations. For higher concentrations, a single stage is often not enough to reduce the concentration to the desired level, therefore multi-stage operations are desirable. This requires the application of ex situ remediation methods, which are economically more demanding than those performed in situ. Furthermore, with the increase in the number of stages, both capital and operating costs increase. Therefore, in practical application, it is considered that sorption treatment in more than two stages is not economically profitable [41,42]. Two-stage sorption optimization implies minimization of the sorbent mass required to achieve high sorption efficiency within sufficient contact time, or minimization of contact time with a fixed mass of sorbent in each stage. The first approach enables the maximum sorbent utilization in each stage, i.e., its complete saturation, while the second is preferred for shortening the sorption process when equilibrium is not achieved in a short time. Previous studies have focused on the optimization of mass and contact time separately, taking into account in the first case the maximization of sorbent utilization, while in the second case the minimization of contact time with achieving high efficiency [41,43,44,45].
This paper investigates Hg(II) sorption on natural and sulfur-impregnated zeolite. The obtained equilibrium and kinetic data will be fitted according to selected isotherm and kinetic models. By applying the appropriate isotherm model and mass balance equation, mass optimization in a two-stage cross-current and counter-current flow batch process will be considered together with contact time with the aim of maximum sorbent utilization in the shortest possible operating time. Finally, the results will serve to predict the minimum zeolite mass for remediation of mercury-contaminated soil from the area of the Idrija mine, Slovenia, using a toxicity characteristic leaching procedure.

2. Materials and Methods

2.1. Sample Preparation

Natural zeolite (NZ) clinoptilolite was collected from the Zlatokop deposit (Vranjska Banja, Serbia). The sample was milled and sieved, and a particle size fraction of 0.6 to 0.8 mm was separated. The sample was then washed in ultrapure water and dried at 60 °C. Sulfur-impregnated zeolite (SZ) was prepared by immersing NZ in 1 mol/L Na2S for 4 h at 150 °C according to a previously published procedure [27]. The systematic physico-chemical characterization of the NZ and SZ samples is described in detail in previously published papers [27,46].
Briefly, the fine distribution of sulfide species over the entire surface of the SZ was confirmed by SEM-EDS analysis, indicating successful impregnation of the NZ surface with sulfide species. The deposition of sulfide species on the inner and outer zeolite surfaces was confirmed by the decrease of the specific surface area of the SZ, which partially block the zeolite pores and channels. XRPD analysis of the NZ revealed that clinoptilolite is the main zeolite mineral (minimum 80%), as well as a slight decrease in the crystallinity of the SZ. Namely, the alkaline medium contributes to desilication of the zeolite structure, an increase in the negative surface charge and basicity of the SZ, which was confirmed by determining the total basicity and zeta potential. The point of zero charge for NZ is established at pHpzc = 1.84, and for SZ at pHpzc = 1.31. Above pHpzc, both zeolites have a negative charge, whereby SZ possesses a more negative one, which is a consequence of the modification and thus shifting pHpzc towards lower pH values compared to NZ. Therefore, above pHpzc, an increase in pH will result in a favored electrostatic attraction between the positive Hg(II) species and the negative zeolite surface. The resulting negative lattice charge is compensated by sodium cations, which represent the dominant exchangeable cations. Accordingly, the obtained sulfur-impregnated zeolite poses improved sorption properties toward mercury species due to (I) the presence of sulfur in its structure, (II) a high amount of exchangeable sodium cations, and (III) a significant increase in the negative surface charge [28].

2.2. Sorption Experiments

The Hg(II) stock solution of 14 mmol/L was prepared by dissolving the Hg(NO3)2·H2O salt in ultrapure water of initial pHo = 2, which was adjusted by adding 1 mol/L HNO3. The Hg(II) solutions of lower concentrations were prepared by diluting the stock solution. All experiments were performed in batch mode and at optimal conditions, pHo = 2 to prevent Hg(II) precipitation and a solid/liquid ratio of 10 g/L. The Hg(II) concentrations before and after sorption were determined by using an Atomic Absorption Spectrophotometer PinAAcle 900F (AAS).

2.2.1. Equilibrium Study

Equilibrium sorption experiments were performed in a single-stage batch reactor by mixing 100 mL of Hg(II) solution with initial concentrations in the range 0.460–12.260 mmol/L with 1.0 g of NZ or SZ. The suspensions were placed in glass vials with stoppers and oscillated on an incubator shaker at 230 rpm for 24 h at room temperature. After equilibration, the suspensions were filtered and subjected to residual Hg(II) concentration analysis.

2.2.2. Kinetic Study

Kinetic sorption experiments were performed in a single-stage batch reactor by mixing 20 g of NZ or SZ with 2 L of Hg(II) solution. The initial concentrations of Hg(II) for sorption on NZ were 3.941, 6.085, and 7.917 mmol/L, and 5.982, 8.166, and 10.164 mmol/L for sorption on SZ. The suspensions were stirred in a 3 L glass beaker at 550 rpm using a centrifugal stirrer with two flexible blades driven by a Heidolph RZR 2041 variable speed motor. Samples were collected at selected time intervals within 24 h, centrifuged, and supernatants were subjected to analysis of the residual Hg(II) concentration. In order not to disrupt the process, the total sampled volume was less than 5–6% of the total suspension volume.

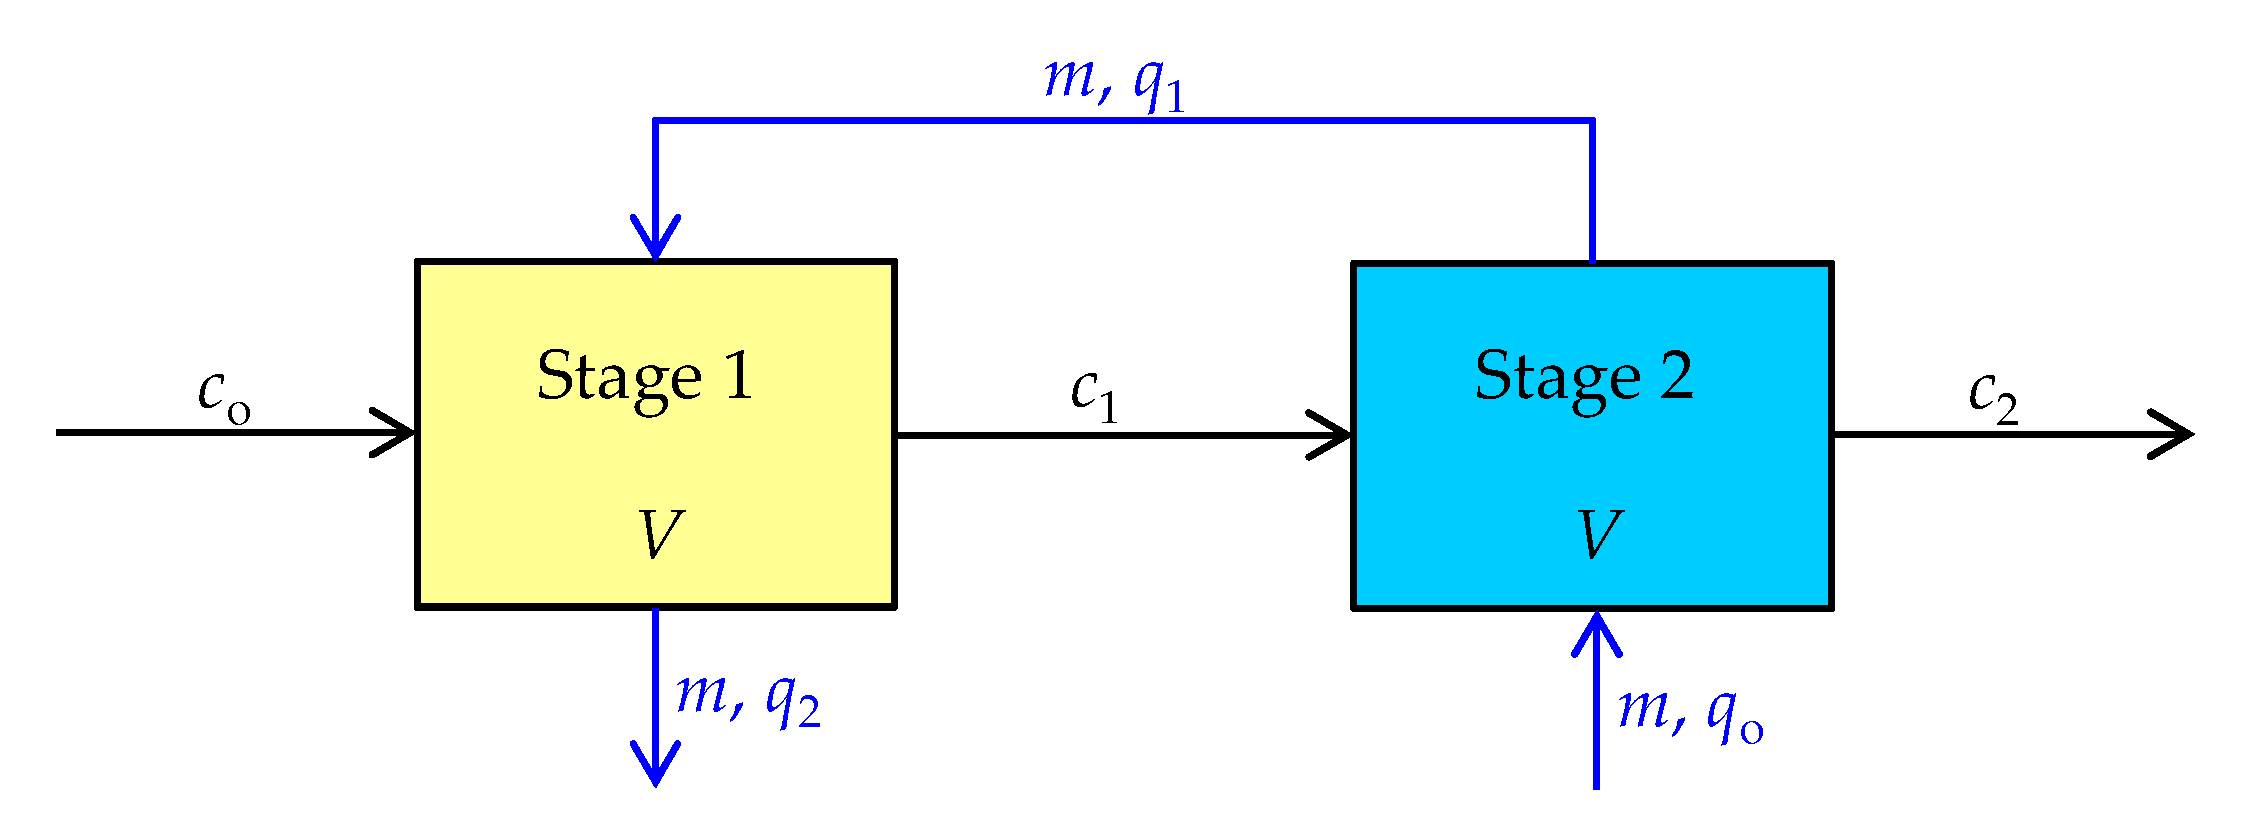
2.2.3. Kinetic Study in the Two-Stages Reactors

Based on the obtained equilibrium and kinetic data described in Section 2.2.1 and Section 2.2.2, the predicted results of mass and contact time optimization of Hg(II) sorption on SZ in two-stage cross-current and counter-current flow batch reactors were experimentally verified.
To verify the predicted results in two-stage cross-current flow batch reactor, initial solutions of Hg(II) in the range 0.046–12.260 mmol/L were prepared and the predicted masses of SZ for each stage were weighed. The zeolite-Hg(II) solution contact time for each stage was defined based on prediction and optimization.
To verify the predicted results in the two-stage counter-current flow batch reactor, initial solutions of Hg(II) in the range 0.460–12.260 mmol/L were prepared for the first stage and intermediate concentrations in the range 0.016–0.520 mmol/L for the second stage. The predicted masses of SZ were weighed and the zeolite-Hg(II) solution contact time for each stage was defined based on prediction and optimization. Initial, intermediate, and final Hg(II) concentrations were determined as previously explained by means of AAS. In order to easily understand the implementation of experiment, the detailed procedure of both experiments is explained in Section 3.3.

2.3. Experiments with a Mercury-Contaminated Soil

2.3.1. Soil Sample Preparation

The soil sample was taken in the area of the Idrija mine, at the location of the Frbejžene trate. The sample was dried at 35 °C to a constant mass, and then ground in a ceramic mortar, homogenized, and sieved through a 2 mm pore size mesh. Thereafter, the sample was additionally pulverized in an agate mill to fine grain size (<0.075 mm) and stored in a polyethylene bag. The total Hg content in the homogenized soil sample was measured after aqua regia digestion for 3 h at 160 °C by using the inductively coupled plasma emission spectrometry (ICP-ES) method.

2.3.2. Leaching Experiments According to the Toxicity Characteristic Leaching Procedure

The toxicity characteristic leaching procedure (TCLP) is the most commonly used single extraction test [47]. The TCLP test involves the extraction of harmful substances from a milled sample with an extraction solution of pH values of 2.88 and 4.93 prepared according to the detailed procedure described [47], by mixing 1 mol/L NaOH and/or 0.1 mol/L glacial acetic acid. The TCLP prescribes a solids/liquids ratio of 1:20, a leaching time of 18 ± 2 h, with shaking at 30 rpm. According to the TCLP procedure, waste material is classified as hazardous if the concentration of leached Hg exceeds the prescribed limit value of 0.2 mg/L.
First, leaching of Hg from mercury-contaminated soil was carried out by mixing 15 g of raw soil with 300 mL of extraction solution of pH = 2.88 and pH = 4.93 for 20 h and at 30 rpm. After the end of the extraction time, the soil suspensions were centrifuged, the liquid phase was separated, and one part was taken for the analysis of total leached soluble Hg concentrations using the LECO’s AMA254 Mercury Analyzer, and the residual part was used for the subsequent sorption experiment.
Afterwards, different amounts of NZ and/or SZ ranging from 0.25 to 1.00 g were added to a fixed volume of 50 mL of the separated liquid phase (mercury leachate) obtained at pH = 2.88 and pH = 4.93 and were oscillated on an incubator shaker for 24 h at 230 rpm. This experiment represents a simulation of ex situ remediation.
In addition, simultaneous leaching and sorption was carried out in such a way that a mass of 2.5 g of a mercury-contaminated soil was leached with 50 mL of extraction solutions of pH = 2.88 and/or pH = 4.93 (solid/liquid ratio was 1:20) with the addition of NZ and/or SZ in an amount of 10 wt.–40% wt. (0.25–1.00 g) relative to the mass of the soil during 20 h at 30 rpm. As already mentioned, the Hg concentration in the suspension was determined on the LECO’s AMA254 Mercury Analyzer. This experiment represents a simulation of in situ remediation.

2.4. Calculation of Sorption and Leaching Parameters

The amount of mercury sorbed on zeolites in equilibrium, qe (mmol/g), and sorption efficiency in equilibrium, αe (%) was calculated using Equations (1) and (2):
q e = c o c e V m
α e = c o c e c o 100
where co and ce are the initial and equilibrium Hg(II) concentrations (mmol/L), V is the volume of treated solution (L) and m is the mass of zeolite (g).
The removal efficiency of leached Hg, αleach (%) in the zeolite-treated soil samples was calculated according to the Equation (3):
α leach = c Hg ,   raw   soil c Hg ,   treated   soil c Hg ,   raw   soil 100
where: cHg, raw soil is the concentration of total leached Hg from the raw soil sample (mg/L) while cHg, treated soil is the concentration of total leached Hg from the raw soil sample treated with zeolites (mg/L).

2.5. Isotherm and Kinetic Sorption Models

2.5.1. Isotherm Models

The equilibrium in the suspension, zeolite–aqueous solution of Hg(II) can be described by adsorption isotherms whose parameters provide insight into the sorption mechanism and surface properties of zeolite. For this purpose, different two-parameter (Langmuir, Freundlich, Temkin, Dubinin-Raduskevich) and three-parameter (Langmuir-Freundlich, Khan, Brouers-Sotolongo) isotherms were applied as follows [48,49,50,51,52,53,54,55,56,57,58,59,60,61]:
The Langmuir isotherm empirical model describes monolayer sorption on an energetically homogeneous surface with fixed number of active sites that has the same affinity for the sorbates. Non-linear form of isotherm is given by Equation (4) [51,52]:
q e = q m K L c e 1 + K L c e
where qm is the maximum sorption capacity obtained from the model and KL is the Langmuir constant related to the sorbent’s affinity for metal cations (L/mmol).
The value of KL is connected with the dimensionless constant, the Langmuir separation factor, RL according to the Equation (5) [48,49,50]:
R L = 1 1 + K L c o
RL values indicate the type of sorption: unfavorable (RL > 1), linear (RL = 1), favorable (0 < RL < 1), and irreversible (RL = 0).
The Freundlich isotherm empirical model assumes multilayer sorption on a heterogeneous surface with various sorts of active sites and is given by non-linear Equation (6) [53]:
q e = K F c e 1 / n F
where KF is the Freundlich constant (L/mmol) and nF is the constant indicative to the intensity of sorption and heterogeneity of the surface. A higher value of nF indicates a more heterogeneous sorbent surface, and for nF > 1 sorption is favorable [47,48,49].
The Temkin isotherm model assumes that the heat of sorption decreases linearly with increasing coverage taking into consideration sorbent–sorbate interactions. The non-linear form of the Temkin isotherm as well as the heat of sorption is given by the following Equations [50,54,55]:
q e = R T β T ln K T c e
B T = R T β T
where KT is the equilibrium binding constant (L/mmol), βT is the Temkin constant, R is the gas constant [8.314·10−3 kJ/(K mol)], T is the absolute temperature (K), and BT is related to the heat of sorption (kJ/mol).
The Dubinin-Radushkevich isotherm empirical model describes sorption mechanism with Gauss energy distribution onto a heterogeneous surface based on potential theory. The non-linear form as well as meaning of ε and E is given by Equations (9)–(11) [56,57,58]:
q e = q m e K D R ε 2
ε = R T l n 1 + 1 c e
E = 1 2 K R D
where KDR is the Dubinin-Raduskevich isotherm constant (mol2/kJ2), ε is the Polany potential (kJ/mol), and E is the mean free sorption energy (kJ/mol). Distinguishing the nature of the sorption process could be predicted based on the E value. If E < 8 kJ/mol, the sorption is of a physical nature, for 8 < E < 16 kJ/mol, the sorption takes place by ion exchange, while for E > 8 kJ/mol, the sorption is of a chemical nature.
The Langmuir-Freundlich isotherm empirical model is derived from Langmuir and Freundlich isotherm which describes sorption on a heterogeneous surface and non-linear Equation (12) is given as follow [48,49,50]:
q e = q m K L F c e β L F 1 + K L F c e β L F
where KLF is the Langmuir-Freundlich isotherm constant (L/mmol) and exponent βLF is the heterogenous parameter with value in the range 0–1. Higher parameter values indicate a higher degree of heterogeneity. Additionally, if βLF = 1, the model has the form of a Langmuir isotherm.
The Khan isotherm model describes sorption of bi-sorbate onto sorbent and is given by Equation (13) [48,49,50,59,60]:
q e = q m K K c e 1 + K K c e β K
where KK is the Khan isotherm constant (L/mmol) and βK is the Khan isotherm exponent.
The Brouers-Sotolongo isotherm model describes sorption on a heterogeneous surface that has a fixed number of active sites of equal energy. The mathematical form represents a deformed exponential function as follows [50,60,61]:
q e = q m 1 e K B S c e β B S
where KBS is the Brouers-Sotolongo isotherm constant (L/mmol) and βBS is the parameter related with energy distribution and surface heterogeneity.

2.5.2. Kinetic Models

In order to discern the rate-controlling step among mass transfer, diffusion or chemical reactions, different reaction, and diffusion kinetic models are applied to test experimental data.
Three reaction kinetic models, pseudo-first order, PFO (Lagergren), pseudo-second order, PSO (Ho), and Elovich model are most commonly used to confirm whether a chemical reaction is the limiting step. The non-linear equation of pseudo-first order is expressed as follows [62,63]:
q t = q m ( 1 e k 1 t )
where qt is the amount of sorbate sorbed on sorbents in time t (mmol/g) and k1 is the rate constant of the PFO (1/min) and t is the time (min).
The non-linear form of the pseudo-second order is represented by the Equation (16) [62,63]:
q t = k 2 q m 2 t 1 + k 2 q m t
in which k2 is the rate constant of the PSO [g/(mmol∙min)].
The Elovich model was originally employed to describe the chemisorption of gases on a solid surface. The model describes the predominantly chemical sorption of sorbate on the heterogeneous surface of the sorbent. The non-linear form of the Elovich model is represented by the Equation (17) [64,65,66]:
q t = 1 β E ln 1 + α E β E t
where αE is the initial chemisorption rate [mmol/(g·min)] and βE is related to the surface coverage (g/mmol).
Since zeolites are micro and mesoporous materials, sorption is often limited by mass transfer to active sites within the zeolite particle through cavities and pores. The rate-limiting step in well-stirred systems is most commonly attributed to film or intraparticle diffusion since the resistance to mass transfer from the bulk to the particle surface has no effect. Whether film or intraparticle diffusion is the slowest step in the overall sorption process can be determined by applying different diffusion kinetic models.
The film or intraparticle diffusion as the sorption rate-limiting step can be established using the linear equation of the Weber-Morris model as follows [67]:
q t = k W M t 1 / 2 + I
where kWM is the Weber-Morris diffusion constant [mmol/(g∙min1/2)] and I represent the thickness of the boundary layer (mmol/g).
In the case that I = 0, film diffusion is the only rate-limiting step, otherwise both film and intraparticle diffusion play a role in mass transfer. The contribution of film or intraparticle diffusion can be calculated according to the Equation (19) [67]:
R C = I q e 100
where RC represents the relative coefficient expressed in %. Lower RC values indicate that film diffusion has a lower contribution in the overall mass transfer process.
By calculating the Weber-Morris diffusion constant, kWM from Equation (18), the diffusion coefficient DWM (cm2/min) can be calculated using the following equation:
D W M = π d p k W M 12 q e
where dp is the sorbent particle diameter (cm).
The two-step sorption kinetics are described by a Double-exponential non-linear model as follows [68,69,70]:
q t = q m B 1 m z e k B 1 t B 2 m z e k B 2 t
where B1 and B2 are the concentrations of the sorbed sorbate in the rapid and slow steps (mmol/L), while kB1 and kB2 are the rapid and slow rate constants (1/min), respectively.
The overall sorption rate, r in [mmol/(g∙min)] is a sum of the rapid, r1 and slow, r2 steps [68,69,70]:
r = r 1 + r 2 = B 1 m z k B 1 + B 2 m z k B 2
Additionally, the proportion of sorbate sorbed in rapid (RF) and in slow (SF) steps expressed in percentage can be calculated as follows [68,69,70]:
R F = B 1 B 1 + B 2 100
S F = B 2 B 1 + B 2 100
The Vermeulen’s approximation implies intraparticle diffusion as the rate limiting step and is represented by Equation (25) [71]:
q t = q m 1 e 4 D V π 2 t r p 2 1 2
where DV is the intraparticle diffusion coefficient (cm2/min) and rp is the sorbent particle radius (cm).

2.6. Statistical Data Analysis

The fitting of the experimental data to the isotherm and kinetic models by non-linear regression analysis was performed using the mathematical tool MathCad 14, except for the Weber-Morris model, which is originally linear. Non-linear forms of the model were used, since it was observed that the transformation to a linear form increases the parameter estimation error [43].
In order to compare the applicability of each model, the linear, R2 and non-linear, r2 correlation coefficients were used in addition to two error functions, non-linear chi-square test (χ2) and root mean square error (RMSE) [72]:
χ 2 = i = 1 n q m q e 2 q m
R M S E = i = 1 n q m q e 2 n
Smaller error function values are an indication of better correlation between experimental, qe and calculated, qm values. Quantitative estimation of the fit accuracy is crucial to select the best model since the best fitting model will be used in the design of the two-stage batch reactors.

3. Results and Discussion

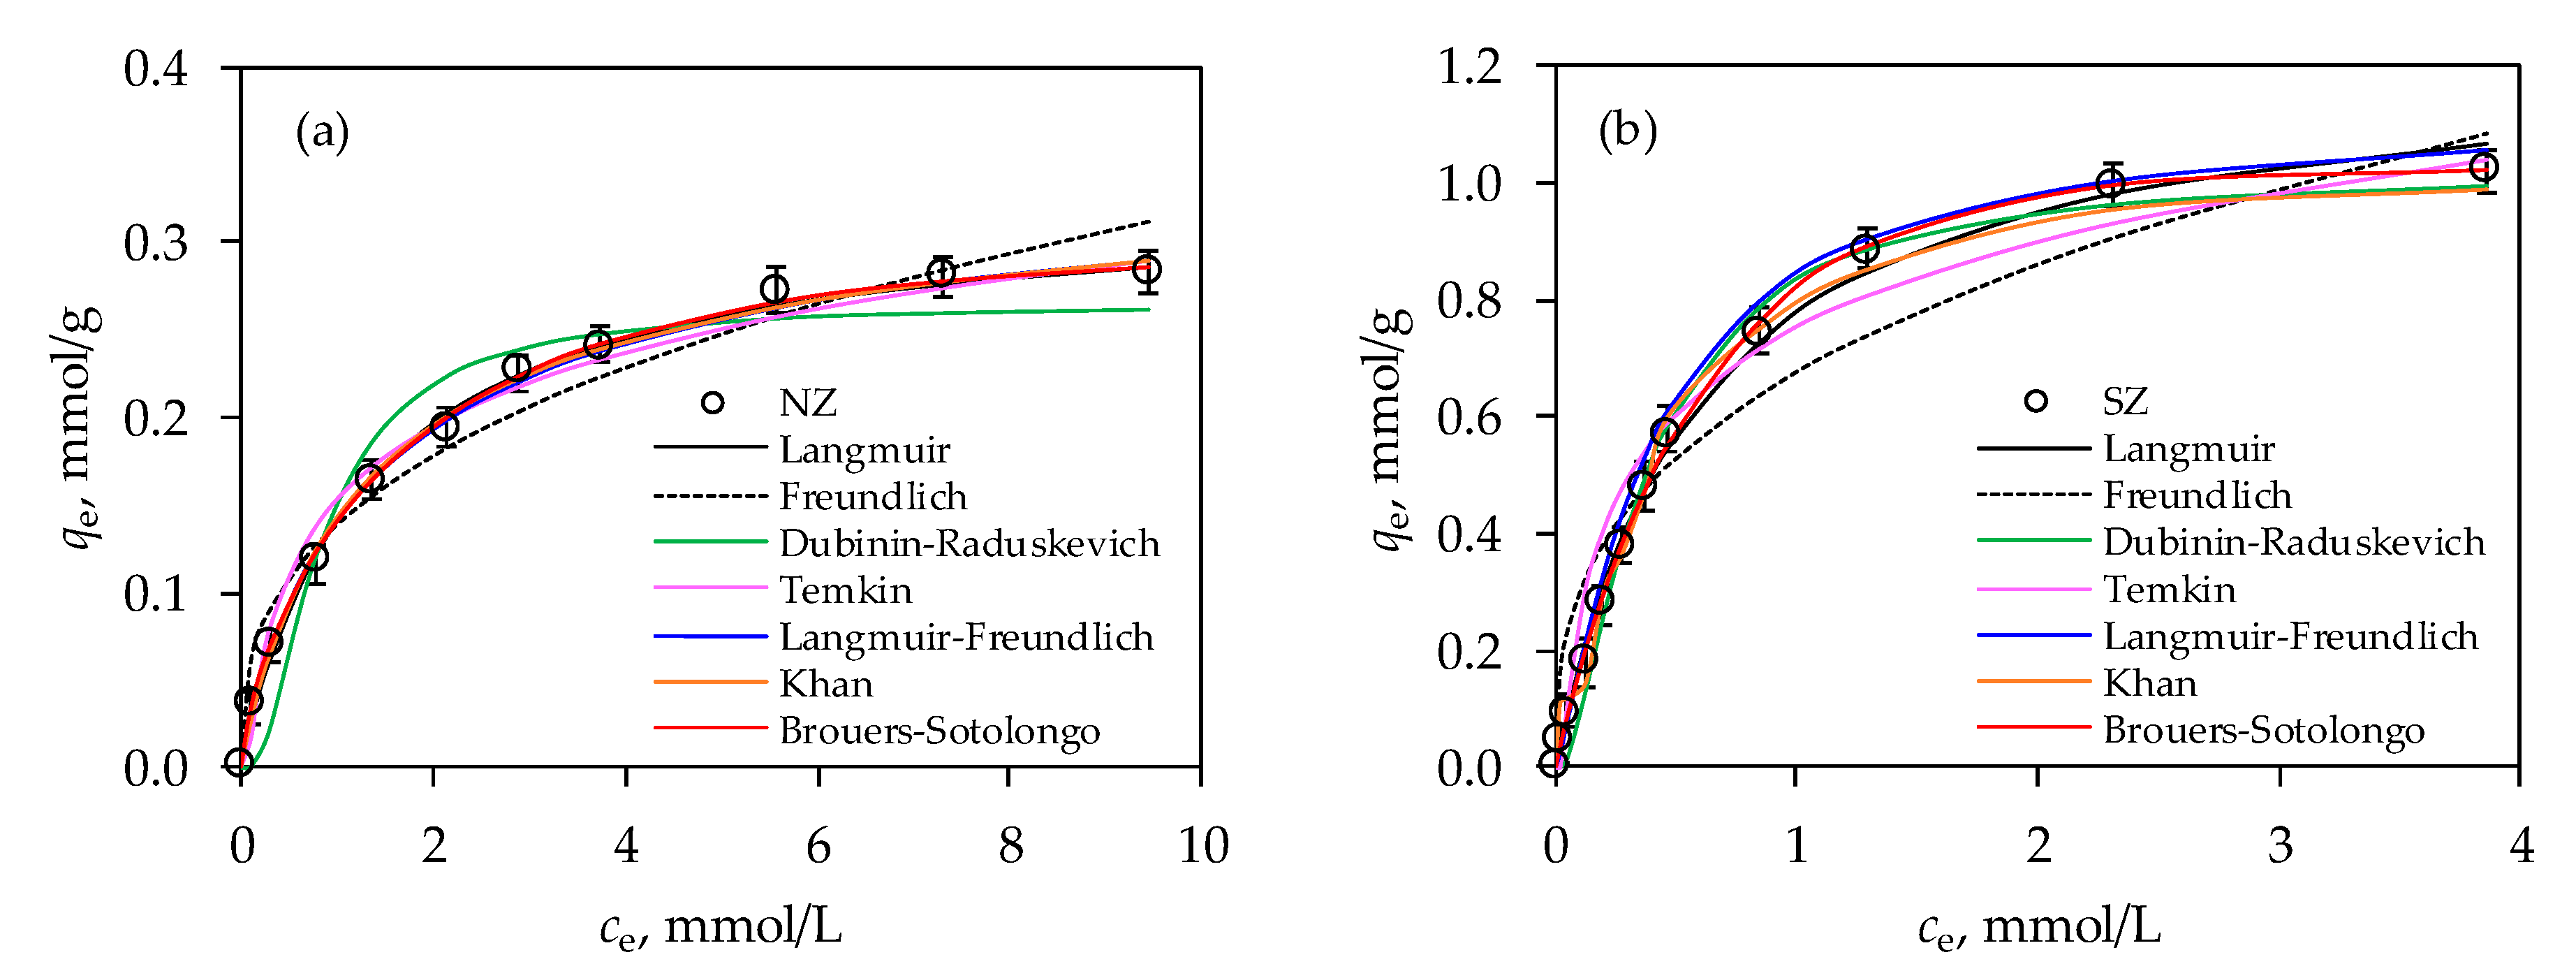
3.1. Modeling of Equilibrium Data

The equilibrium in an aqueous solution of the Hg(II)-zeolite system is described by different two-parameter (Langmuir, Freundlich, Temkin, Dubinin-Raduskevich) and three-parameter (Langmuir-Freundlich, Khan, Brouers-Sotolongo) isotherm models, whose parameters will provide insight into the sorption mechanism and surface properties of the zeolite as well as determining the maximum sorption capacity. To predict sorption under other conditions, such as different solid/liquid ratios in single-stage or the design of two-stage systems, requires the implementation of an isotherms model testing procedure based on which the best fitting isotherm will be selected. Accordingly, the comparison of experimental data and predicted isotherms using non-linear regression analysis for Hg(II) sorption onto NZ and SZ is depicted in Figure 1. The calculated isotherms parameters, the non-linear regression coefficient, r2, and the error functions are listed in Table 1.
To begin with, it can be seen from Figure 1a,b that the sorption capacity was achieved in the amount of 0.282 mmol Hg/g for the NZ and 1.024 mmol/g for the SZ. The 3.6 times higher sorption capacity of SZ compared to NZ firstly justifies the sulfur impregnation procedure, and then also indicates its possible application for remediation purposes.
Several researchers have reported that impregnation of sorbents with sulfur species contributes to the improvement of Hg sorption. Thus, Cai et al. carried out the modification of activated carbon with KOH and SO2 at 600–900 °C, whereby the produced KOH-SO2-activated carbon showed a sorption capacity in the range 0.210–0.360 mmol Hg/g [38]. Asasaian and Kaghazchi fabricated three types of sulfurized activated carbon using dimethyl disulfide, elemental sulfur, and sulfur dioxide at 30–700 °C. The optimal sorption kinetic results obtained at different temperatures of the three sorbents were 1.087 mmol/g, 0.702 mmol/g, and 0.869 mmol/g, respectively [18]. Al-Ghouti et al. calculated that the maximum sorption capacity obtained from the Langmuir isotherm for sulfur-modified roasted date pits was 1.39 mmol Hg/g, which is comparable to the starting material, roasted date pits [36]. Gupta et al. obtained a maximum sorption capacity of 0.755 mmol Hg/g on sulfur functionalized carbon nanotubes using CS2 as a modifying agent [37]. The maximum sorption capacity of 0.025 mmol Hg/g of Na2S-modified biochar was found by Tan et al. [20]. Wajima et al. reported a sorption capacity of 0.856 mmol Hg/g at 25 °C on sulfur-impregnated coal obtained by modification with K2S at 800 °C [35]. Abdelouahab-Reddam et al. performed the impregnation of activated carbon with different doses of Na2S at 25 and 140 °C and determined the sorption capacity in the range 0.018–0.02 mmol Hg/g [17]. Zhu et al. found a noticeable improvement in the sorption capacity of sulfur-modified chitosan, which is 0.935 mmol Hg/g [73]. Investigation by Gebremedhin-Haile et al. showed that treatment of zeolite with cysteinamine hydrochloride and cysteinamine dihydrochloride results in a sorption capacity in the range of 0.011–0.051 mmol Hg/g [25]. A comparison of the sorption capacities of sulfur-modified sorbents indicated that a relatively simple modification of the natural zeolite proposed in this paper achieves a significant sorption capacity towards Hg. The obtained sorption capacity is comparable to those obtained on sulfur-modified activated carbons. The realization that the preparation of activated carbon requires high temperatures, and thus increases the cost of the entire preparation procedure of sulfur-impregnated sorbents, justifies the modification of natural zeolite.
Furthermore, for the lowest initial concentration of 0.460 mmol/L, 76% of Hg(II) was removed on NZ and 96% on SZ. It is clear that for co > 0.460 mmol/L, it will be necessary to conduct the sorption process in two stages for achieving the removal efficiency of 99.9%, while for lower concentrations a single stage will be quite acceptable. These results are valuable in the preliminary assessment of determining the number of batches in reactor design if the remediation is carried out in the ex situ mode or for the assessment of the minimum zeolite mass in the case of in situ remediation. Accurate answers can be obtained by analyzing the experimental data according to the isotherm models as follows.
According to the calculated values of the non-linear regression correlation coefficients, r2 shown in Table 1, it can be seen that all isotherm models could be applicable to the experimental results, since the minimum value of r2 is 0.940. Therefore, apart from r2, the qm parameter and error analysis will be taken into account for estimation of fitting the experimental data with those of models. For the two-parameter models, the highest value of r2 was obtained for the Langmuir model for both NZ and SZ, while the best agreement of the parameters qe and qm was obtained for the Dubinin-Raduskevich isotherm. Therefore, all two-parameter isotherms can contribute to the assessment of the sorption mechanism and surface properties of zeolites. The value of the Langmuir parameter, KL is higher for SZ, compared to NZ, indicating a higher affinity of SZ towards Hg(II). This was further confirmed by the lower RL value for SZ than for NZ, whereby both values were in the range 0 < RL < 1 indicating favorable sorption of Hg(II) onto zeolites. Since there are no similarities between experimental and calculated sorption capacity, this indicates that sorption of Hg(II) onto both zeolites did not occur in the monolayer. Thus, according to the Freundlich isotherm, sorption could be multilayer, where SZ showed greater surface heterogeneity and higher sorption intensity for Hg(II) than NZ. For both zeolites, the value of nF was higher than 1, which indicates a favored sorption process, which is in agreement with the Langmuir isotherm. Higher values of equilibrium binding constant were obtained from the Temkin model, KT for SZ compared to NZ, indicating its greater selectivity towards Hg(II) ions, which is evident from the 3.6-fold higher sorption capacity. Furthermore, this model can be helpful for elucidating the nature of the sorption process based on the heat of sorption. In the case of physical sorption, the activation energy is no higher than 4.184 kJ/mol (1 kcal/mol), while in the case of chemical sorption it is above 41,840 kJ/mol (10 kcal/mol) [74,75]. Between these two values, physical and chemical sorption is included. Thus, the values of the parameter BT (Table 1) suggest that the sorption of Hg(II) onto both NZ and SZ is of a physical nature. The Dubinin-Raduskevich isotherm is very useful for distinguishing the nature of the sorption process based on the E value. The value of E for both zeolites was <8 kJ/mol which is attributed to the physical sorption of Hg(II) onto zeolites.
In order to obtain better data agreement, three-parameter isotherms were also applied. Langmuir-Freundlich isotherm model fits well with the experimental data based on r2 and error functions than that of Khan model, indicating the higher heterogeneity surface of SZ compared to the NZ. The value of qm for both models differs in relation to qe, which shows that these isotherms are not suitable for description of experimental data.
The Brouers-Sotolongo isotherm model is the most appropriate based on qm, r2, and error functions, compared to all applied models, suggesting that Hg(II) sorption on both NZ and SZ occurs on a heterogeneous surface which possess a fixed number of active sites with equal energy. Since the Brouers-Sotolongo isotherm showed the best fit, it can be applied to predict the optimal zeolite mass to achieve the desired removal efficiency in a single or two-stage batch reactor using the mass balance equation.
In a well-mixed system with a certain volume of Hg(II) solution, V of the co initial concentration is contacted with a certain zeolite mass for sufficient time to reach equilibrium, then the amount of Hg(II) removed from the solution must equal the amount of Hg(II) sorbed on the zeolite. Thereby, the mass balance equation at equilibrium states as follows [42]:
V c o c e = m q e q o
Since fresh zeolite is used, qo = 0, then Equation (28) can be rearranged as follows:
q e = c o c e V m
The required mass to achieve the desired efficiency can be predicted by inserting the Brouers-Sotolongo isotherm Equation (14) into Equation (29) as follows:
m = c o c e V q m 1 e K BS c e β BS
The required mass of NZ and SZ for 99.9% removal efficiency at a constant volume of 1 L in a single-stage system for the same selected initial concentrations at which the experiment was carried out at S/L = 10, are listed in Table 2.
It is worth noting again that at co = 0.460 mmol Hg/L, Hg(II) removal efficiency of 76% was achieved on NZ and 96% on SZ at S/L = 10 g/L. For the same initial concentration, a 72 times higher mass of NZ, i.e., 43 times higher mass of SZ, is required to achieve the removal efficiency of 99.9%. For higher concentrations, the required mass of both zeolites increases drastically, especially for NZ. At this point, the question of the economic sustainability of the performance of a single-stage system in order to achieve high removal efficiency is clearly raised.
Hence, mass optimization using a two-stage batch reactor can enhance the zeolite efficiency, minimize its total amount, and make the process more economic. The schematic representation of the two-stage cross-current flow batch reactor is shown in Figure 2.
In a two-stage system, each stage is analyzed in the same way, whereby the same volume of solution is treated in each stage with different zeolite mass, m1 and m2. The amount of fresh zeolite was used in each stage to reduce the Hg(II) in suspension from co to c1 in the first stage and from c1 to c2 in the second stage, thus the quantity of sorbed Hg(II), q, increases from qo to q1 in the first stage, and from qo to q2 in the second stage. The Hg(II) uptake process can be represented by a mass balance equation for each stage [42]:
V c o c 1 = m 1 q 1 q o
V c 1 c 2 = m 2 q 2 q o
When fresh zeolite is used at each stage (qo = 0), the quantity of Hg(II) sorbed on zeolite for desired removal efficiency in the first and second stages can be obtained by rearranging Equations (31) and (32) as follows:
q 1 = V m 1 c o c 1
q 2 = V m 2 c 1 c 2
Since the Hg(II) sorption on NZ and SZ follows the Brouers-Sotolongo isotherm, the zeolite mass required to achieve the desired removal efficiency in each stage for a given co can be predicted by inserting the Brouers-Sotolongo isotherm, Equation (14), into Equations (33) and (34) as follows:
m 1 = V q m 1 e K BS c 1 β BS c o c 1
m 2 = V q m 1 e K BS c 2 β BS c 1 c 2
The total required zeolite mass for both stages can be calculated by summing Equations (35) and (36) as follows:
m 1 + m 2 V = 1 q m c o c 1 1 e K BS c 1 β BS + c 1 c 2 1 e K BS c 2 β BS
If d m 1 + m 2 / V d c 1 is set equal to zero, then the extremum of the function corresponding to the total minimum required mass is sought as follows:
q m e K BS c 1 β BS K BS c 1 β BS 1 c o + c 1 + 1 + e K BS c 2 β BS = 0
Since all parameters except intermediate concentration, c1 are known in Equation (38), the value of c1 is determined by trial and error using the Microsoft Excel solver add-in. Then, the total zeolite mass is analytically determined using Equation (37), that is, the required minimum zeolite mass for each stage using Equations (35) and (36). Table 3 shows the calculated intermediate concentrations, c1 and optimized masses of NZ and SZ for each stage in a two-stage cross-current flow batch system assuming 99.9% removal efficiency at a constant volume of 1 L.
Table 3 shows an increase in the required mass of NZ and SZ with an increase in co in the first and second stages. In the first stage, a higher mass of both zeolites is needed than in the second stage, due to the lower outlet concentration compared to the initial one and thus a higher amount of sorbed Hg(II). The total required mass to achieve 99.9% removal efficiency is smaller using SZ than NZ, whereby a drastic difference is observed with increasing co, which justifies the zeolite impregnation with sulfur species.
It can also be seen from Table 3 that the inlet concentration in the second stage, c1 for all initial concentrations is about 22 times lower than the inlet concentration in the first stage, co. Furthermore, although the concentration after the first stage treatment has significantly decreased, the amount of zeolite required in the second stage to achieve the required removal efficiency is quite high, which is a consequence of the lower driving force of the process. On the other hand, although the required removal efficiency was achieved in the two-stage system, the zeolite from the second batch was not fully utilized since it was partially saturated. Therefore, from an economic point of view, it is crucial to consider both the maximum zeolite utilization, in addition to achieving the desired removal efficiency. This can be supported by the implementation of two-stage counter-current flow batch sorption process as illustrated in Figure 3.
In the counter-current flow process design, the liquid and solid phases are moved in opposite directions. Namely, the fresh zeolite first comes into contact in second stage with a low Hg(II) concentration, c1, which comes out of the first stage. After attaining equilibrium, the partially saturated zeolite is transferred to the first stage, where it is re-saturated with a solution of higher Hg(II) concentration, co. Accordingly, the amount of sorbed Hg(II) on the zeolite increases from qo to q2 from second to first stage, and in the opposite direction, the Hg(II) concentration decreases from co to c2.
Provided that the zeolite mass and the volume of the Hg(II) solution are constant in both stages, then the mass balance for each stage of the counter-current flow batch system is given as follows [42]:
V c o c 1 = m q 2 q 1
V c 1 c 2 = m q 1 q o
Inserting the Brouers-Sotolongo isotherm Equation (14) into the Equations (39) and (40) yields:
m V = c o c 1 q m 1 e K B S c 1 β B S q m 1 e K B S c 2 β B S
m V = c 1 c 2 q m 1 e K B S c 2 β B S
Equating Equations (41) and (42), we get:
c o c 1 q m 1 e K B S c 1 β B S q m 1 e K B S c 2 β B S = c 1 c 2 q m 1 e K B S c 2 β B S
Since co and c2 are always known, whereas the intermediate concentration, c1 is unknown, its value is estimated by trial and error using Equation (43) and Microsoft Excel solver add-in. Then, the total required zeolite mass for the counter-current flow system is determined with respect to c1 by applying the Equations (41) or (42), since the same zeolite mass is used in both stages. Table 4 summarizes the calculated intermediate Hg(II) concentration, c1 and the minimum mass of NZ and SZ for different initial Hg(II) concentrations applying counter-current flow sorption system with 99.9% removal efficiency at a constant volume of 1 L.
From Table 4, it can be seen that the total required mass of SZ in the counter-current flow design is smaller compared to NZ, for 2.6 to 4.9 times, and increase with increasing initial concentration. Calculated intermediate concentrations, c1 are higher for NZ than for SZ after the first stage, even though a higher mass of NZ was used. This can be explained by the fact that SZ has a higher number of active sites and thus a higher selectivity towards Hg(II), which consequently leads to a more pronounced decrease in concentration after the first stage. On the other hand, a higher concentration difference is realized in the first stage for SZ, which indicates a higher driving force of the sorption process, i.e., a higher achieved sorption capacity. In addition, with a significantly lower dose of SZ compared to NZ, the same outlet concentration, c2 is achieved, with 99.9% Hg(II) removal efficiency. This implies that SZ achieves a higher overall utilization per unit mass than NZ. Since the driving force is higher in the first stage, predictions indicate that the partially saturated zeolite in second stage can be reused. i.e., that it is really unnecessary to use fresh zeolite in the first stage.
Finally, comparing all three sorption process designs, it was observed that ≈10-fold NZ and ≈15-fold SZ savings were achieved using the cross-current flow design compared to the single-stage design. Furthermore, by applying the counter-current flow design, the consumption of both NZ and SZ is reduced twice compared to the cross-current flow design. Comparing the total consumed mass of NZ and SZ in single and two-stage systems, it was observed that by breaking the system into two stages, the total required zeolite mass to achieve the desired removal efficiency is drastically reduced. In summary, it is obvious that the counter-current flow batch system is more effective in terms of zeolite consumption and utilization than all other designs.

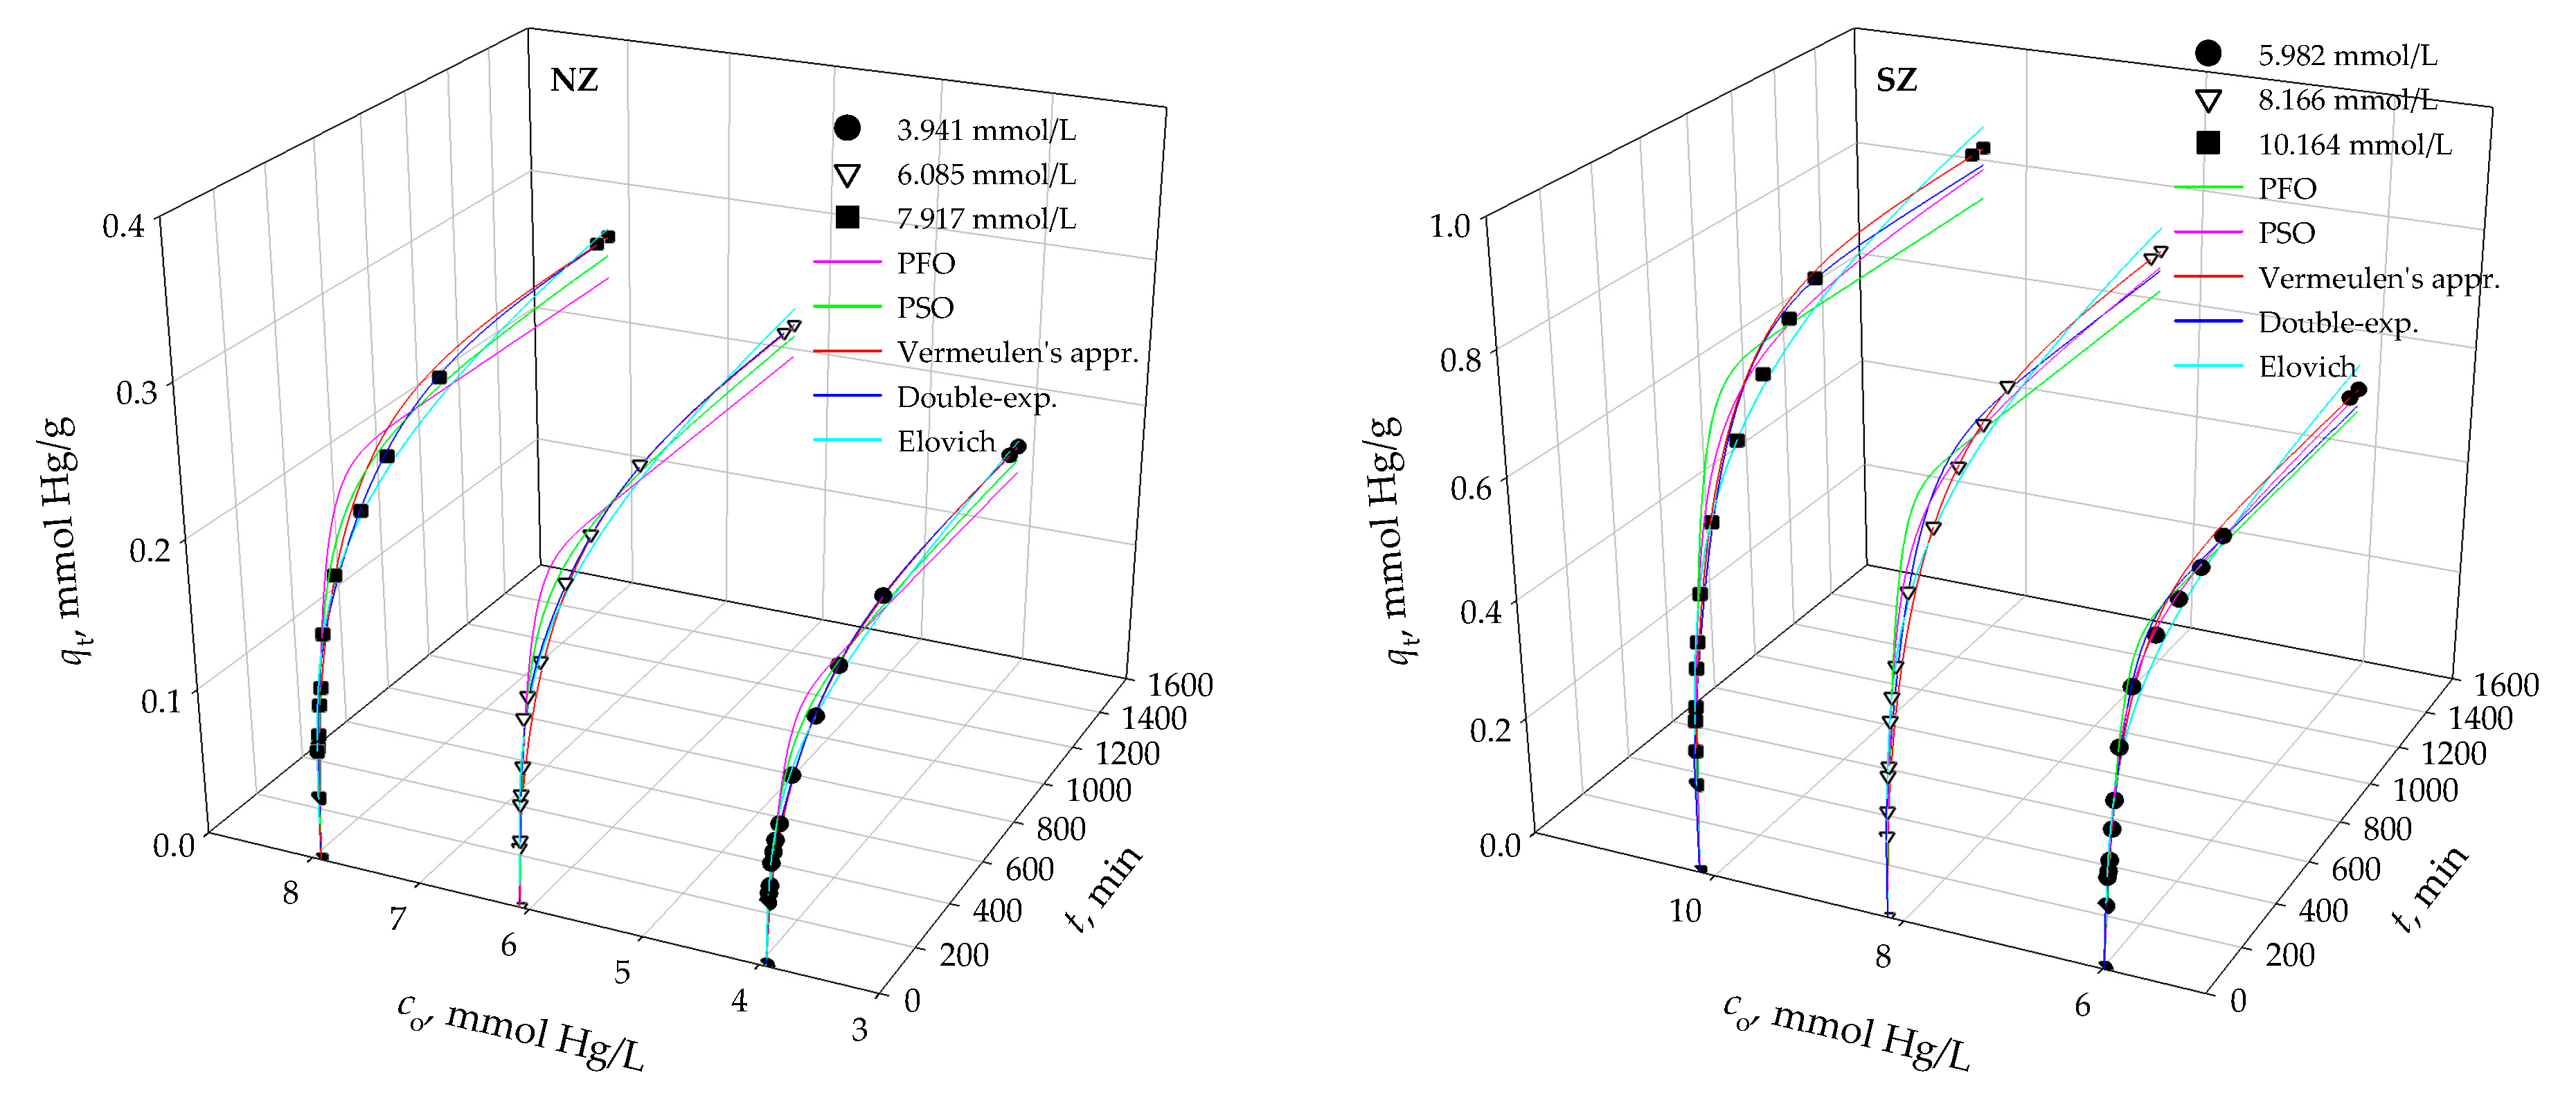
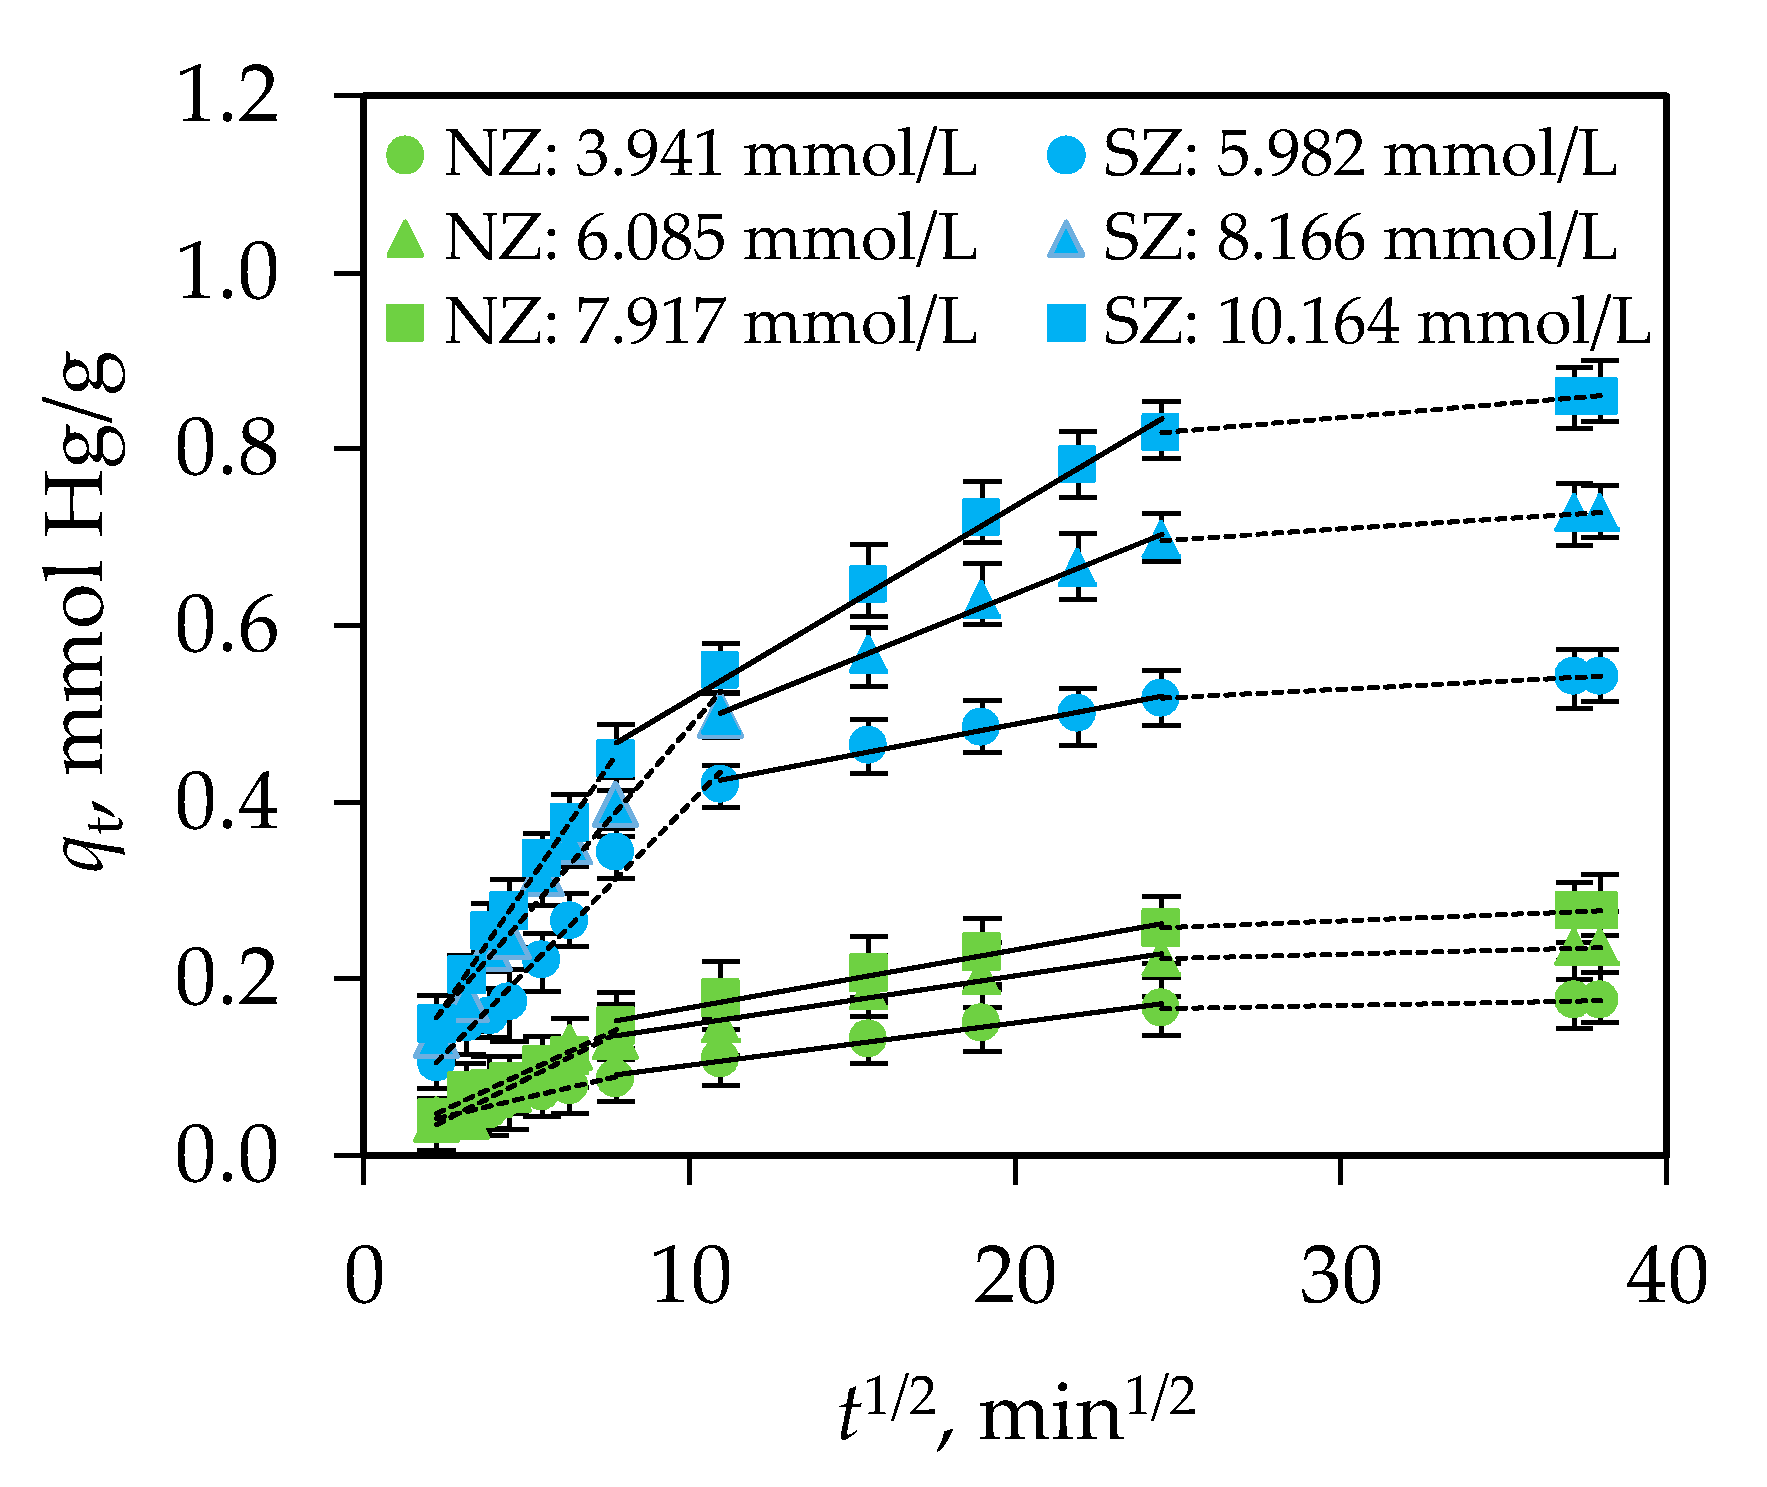
3.2. Modeling of Kinetic Data

Kinetic sorption data were analyzed using two reactions (pseudo-first order, pseudo-second order) and three diffusions (Weber-Morris, double exponential, Vermeulen’s approximation) kinetic models. Comparison of experimental data and predicted curves by kinetic models are shown in Figure 4 and Figure 5. Calculated kinetic parameters as well as agreement indicators (r2, R2, RMSE, χ2) are tabulated in Table 5.
Kinetic sorption data were analyzed using three reactions (pseudo-first order, pseudo-second order, Elovich) and three diffusions (Weber-Morris, double exponential, Vermeulen’s approximation) kinetic models. Comparison of experimental data and predicted curves by kinetic models are shown in Figure 4 and Figure 5. Calculated kinetic parameters as well as agreement indicators (r2, R2, RMSE, χ2) are tabulated in Table 5.
Two-stage sorption kinetic is observed for both zeolite samples and all initial Hg(II) concentrations (Figure 4). The first faster stage, up to 240 min, corresponds to the Hg(II) sorption to easily available active sites, followed by a slower stage of Hg(II) sorption to less available sites until equilibrium is established. With an increase in the initial Hg(II) concentration, the driving force of the process increases, and thus the achieved sorption capacity increases in the range 0.176–0.277 mmol Hg/g for NZ and 0.542–0.859 mmol Hg/g for SZ.
A comparison of the agreement indicators for PFO, PSO, and the Elovich model shows that PSO better describes the experimental data for NZ and SZ. The obtained parameters of the Elovich model indicate that with an increase in the Hg(II) concentration, the initial sorption rate, αE, and surface coverage, βE increases, i.e., the available active sites decrease. The results are in agreement with the assumptions of the model and the experimentally obtained sorption capacity. However, the disadvantage of this model is the inability to predict the sorption capacity, unlike PFO and PSO. The calculated values of qm from PSO are closer to the experimentally obtained values, qe in relation to PFO. However, according to the PSO model, the reaction rate constant is independent of the initial concentration, which is not the case for NZ and SZ. This finding does not deny the existence of chemisorption but suggests that the chemical reaction is not the limiting step of the sorption process. Namely, sorption most likely includes both physical and chemical sorption mechanisms, whereby the Hg(II) sorption on NZ took place by ion exchange [76], while on SZ it included a more complex mechanism, mainly ion exchange, then electrostatic attraction and surface complexation followed by co-precipitation in the form of HgS [27]. This indicates that physical sorption could be a more dominant mechanism of Hg(II) sorption on NZ, while it is chemisorption on SZ. In the following, by applying the diffusion models, it is necessary to clarify whether the control step is film or intraparticle diffusion.
For this purpose, the kinetic data were first fitted using the Weber-Morris model, since it can be used to reveal whether film diffusion alone or a combination of both film and intraparticle diffusion are the limiting steps. Figure 5 shows a plot of qt as a function of t1/2 from which multilinearity can be observed. The first two linear parts correspond to fast and slow sorption, while the third part corresponds to the establishment of an equilibrium state. In addition to the observed multilinearity, the values of intercept I are greater than zero (Table 5), which suggests that both film and intraparticle diffusion are involved in the sorption of Hg(II) on NZ and SZ. The calculated values of the parameters shown in Table 5 indicate that kWM1 > kWM2, as well as DWM1 > DWM2, confirming faster mass transfer through the film than that through macro and micro pores. Since the values of the relative coefficient, RC, are in the range of 3–10% for NZ and SZ, the influence of film diffusion is negligible compared to the influence of intraparticle diffusion.
The double exponential model, in contrast to the Weber-Morris model, implies that diffusion through the film and through the particle is involved in mass transfer. According to the calculated parameters listed in Table 5, the values kb1 > kb2, B1 > B2, and r1 > r2 confirm the two-stage sorption of Hg(II) on NZ and SZ. Thereby, the first stage controlled by film diffusion is faster than the second, which is controlled by intraparticle diffusion. Model parameters k and B for both stages and both zeolite samples increase with increasing Hg(II) concentration due to a higher concentration gradient and thus a higher driving force of the process. The mentioned parameters are significantly higher for SZ compared to NZ, which indicates a faster sorption of Hg(II) on SZ due to its more pronounced selectivity to Hg(II), as well as a higher amount of removed Hg(II) in the second, slower stage (SF > RF). Statistical indicators of correlation as well as comparable values of qm and qe indicate a good agreement between the experimental data and the model, confirming the dominant mechanism of mass transfer by intraparticle diffusion accompanied by film diffusion.
Furthermore, the experimental data were fitted according to the Vermeulen’s approximation since this model considers intraparticle diffusion as the only rate controlling step. A highly significant fit of the experimental data was observed from the beginning to the equilibrium of the process. The values of the diffusion coefficients are of the same order of magnitude, indicating the application of the mentioned model in the examined concentration range. Compared to other models, the calculated qm values are almost identical to those obtained experimentally, qe. The results of statistical indicators demonstrate the Vermeulen’s approximation provides the best correlation between the experimental results and the model, suggesting that the dominant limiting step of mass transfer is intraparticle diffusion. Thus, the Vermeulen’s approximation will be used to optimize the contact time in the design of two-stage batch reactors.
The procedure for designing a two-stage batch reactor, in addition to mass optimization in both stages, also includes contact time optimization with the aim of achieving the target outlet effluent concentration. Therefore, the optimization of mass and contact time for each stage can significantly contribute to improving the economic profitability of the two-stage process.
For this purpose, contact time optimization will be performed for both cross-current and counter-current flow two-stage batch reactors for different initial Hg(II) concentrations under the condition of achieving 99.9% Hg(II) removal efficiency. Contact time prediction for both stages will be performed based on the calculated optimum masses for cross-current (Table 3) and counter-current flow two-stage batch reactor (Table 4) achieving 99.9% removal efficiency.
Based on the schematic diagram shown in Figure 2 and the mass balance equation for the two-stage cross-current flow batch process, by substituting the parameters q1 and q2 in Equations (33) and (34) with the Vermeulen’s approximation model, Equation (25), the following equations were obtained for the first and second stages:
c o c 1 = m 1 V q m 1 1 e D V 1 π 2 t 1 r p 2 1 2
c 1 c 2 = m 2 V q m 2 1 e D V 2 π 2 t 2 r p 2 1 2
The percentage of Hg(II) removal in each stage, R1 and R2, is calculated as follows:
R 1 = c o c 1 100 c o
R 2 = c 1 c 2 100 c 1
By substituting Equation (44) into (46), as well as Equation (45) into (47) and isolating time to one side, the parameters t1 and t2 can be calculated as follows:
t 1 = r p 2 D V 1 π 2 ln 1 R 1 c o V 100 m 1 q m 1 2
t 2 = r p 2 D V 2 π 2 ln 1 R 2 c 1 V 100 m 2 q m 2 2
Since the parameters qm and DV are a function of co, their relationship for NZ is expressed as follows:
q m = 0.0721 c o 0.6517
D V = 4 10 7 c o 0.2355
that is, for the SZ:
q m = 0.1143 c o 0.8738
D V = 2 10 7 c o 0.6826
Thus, by inserting the expressions (50) and (51) into (48) as well as (52) and (53) into (49) for selected initial Hg(II) concentration in the range 0.46–12.26 mmol/L and pre-calculated optimal masses m1 and m2 (see Table 3) for the desired removal efficiency of 99.9% at a constant volume of 1 L, calculated predicted optimal values of contact time t1 and t2 for NZ and SZ in the two-stage cross-current batch reactor are presented in Table 6 and Table 7.
From Table 6 and Table 7 it is obvious that the contact time in the first stage is longer than in the second stage. The reason for this is the higher decrease in concentration in the first stage compared to the second stage since m1 > m2. Although the driving force of the process in the first stage is higher due to the higher concentration gradient, the zeolite mass in the second stage is therefore quite high in order to achieve a rather low outlet concentration, c2 despite the lower driving force of the process. This is supported by the almost approximate values of the SZ masses in both stages. Furthermore, for both zeolites, it is observed that with an increase in the initial Hg(II) concentration, the total contact time is shortened, which can be attributed to an increase in the driving force of the process as well as to a higher zeolite mass. In addition, the total contact time is less for NZ than for SZ for 3.5 to 5 times with an increase in initial concentration. On the other hand, by shortening the contact time by 3.5–5 times, it is necessary to increase the mass of NZ in relation to SZ by the same amount. Therefore, the results indicate that the optimization of the contact time based on using calculated NZ and SZ masses from equilibrium data with the assumption of 24-h contact is significant, because the time required to achieve 99.9% removal efficiency is significantly reduced. Although the total contact time is less in the system with NZ, the substantially smaller mass of SZ justifies its application with a relatively short contact time in the range of 92–110 min.
In the case of two-stage counter-current process design (Figure 3), the path of the Hg(II) concentration will be taken into consideration, which means that the fixed zeolite mass is first saturated in second stage, which corresponds to the contact time t2, the diffusion coefficient, DV2, the achieved sorption capacity, qe1, and the removal efficiency, R2. Then, the partially saturated zeolite is re-saturated with a higher inlet Hg(II) concentration co in the first stage, which corresponds to the contact time t1, the diffusion coefficient, DV1, the achieved sorption capacity, qe2, and the removal efficiency, R1.
By substituting the parameters q1 and q2 in Equations (39) and (40) with the equation of the Vermeulen’s approximation model, Equation (25), the Equations for the first and second stage are obtained:
c o c 1 = m V q m 2 1 e D V 1 π 2 t 1 r p 2 1 2 m V q m 1 1 e D V 2 π 2 t 2 r p 2 1 2
c 1 c 2 = m V q m 1 1 e D V 2 π 2 t 2 r p 2 1 2
By inserting Equation (54) into the equation of the Hg(II) percentage of removal in the first stage (46) and Equation (55) into the equation of the percentage of the Hg(II) removal in the second stage (47), and separating the contact times for the first and second stages, t1 and t2 to one side, the following equations are obtained:
t 1 = r p 2 D V 1 π 2 ln 1 R 1 c o V + 100 m q m 1 1 e D V 2 π 2 t 2 r p 2 1 2 100 m q m 2 2
t 2 = r p 2 D V 2 π 2 ln 1 R 2 c 1 V 100 m 2 q m 1 2
When the functional dependence of parameters qm and DV on co, which is shown by Equations (50) and (51) for NZ and by Equations (52) and (53) for SZ is inserted into Equations (56) and (57), the contact time t1 and t2 can be calculated for the selected initial Hg(II) concentration in the range 0.46–12.26 mmol/L and a pre-calculated optimum NZ and SZ mass, m for both stages (see Table 4) for a desired removal efficiency of 99.9% at a constant volume of 1 L. The calculated predicted optimal values of contact time t1 and t2 for NZ and SZ in a two-stage counter-current flow batch reactor are shown in Table 8 and Table 9.
Similar to the case of the cross-current flow two-stage design, the contact time of the counter-current design, for both NZ and SZ, is longer in the first stage, where a higher concentration reduction is achieved, than in the second stage. The total contact time is shortened by 3.5–5 times for NZ compared to SZ with increasing initial Hg(II) concentration. On the other hand, the required mass of NZ is 2.5–5 times higher than that of SZ. However, comparing the total contact time for both NZ and SZ in the cross-current and counter-current flow designs, it is clearly observed that the desired removal efficiency of 99.9% for any initial Hg(II) concentration requires approximately similar total contact time.
The counter-current design is more demanding because the zeolite transfers from the second stage and the treated solution from the first stage are not simultaneous. However, since the total contact time is almost similar for both cross-current and counter-current flow designs, the results suggest that the counter-current flow design is more desirable because it enables a more complete utilization of the zeolite with a significantly lower amount required compared to the cross-current flow design.
Therefore, the determination of sufficient contact time to achieve the desired removal efficiency, while at the same time completely saturating the sorbent enables the implementation of several batches per day, contributing to a more economically favorable process.

3.3. Experimental Verification of the Model Application

In order to confirm the accuracy of the design of the two configurations of the two-stage reactors, it is essential to carry out experimental verification of the predicted parameters. Furthermore, according to the design criterion of 99.9% Hg(II) removal efficiency, a significantly higher consumption saving was achieved for SZ than for NZ. Hence, the theoretical design of both two-stage cross and counter-current flow batch sorption systems will be verified only for Hg(II) removal on SZ.
For this purpose, the experimental testing of the predicted results shown in Table 7 and Table 9, as well as the validation of the developed mathematical models were carried out.
To verify the design of the two-stage cross-current flow batch reactor, the predicted masses of SZ for each stage were weighed and solutions of initial concentrations were prepared as shown in Table 7. For each initial solution, the experiment was conducted according to precisely defined predicted contact times for each stage (Table 7). Hence, for example, for the lowest concentration of 0.460 mmol Hg/L, a mass of 1.435 g of SZ was mixed with 100 mL of the mentioned solution for 73.43 min (i.e., 74 min). The liquid phase was then separated and mixed with 1.441 g of SZ for 36.56 min (i.e., 37 min) under the same conditions.
To verify the design of the two-stage counter-current flow batch reactor, the masses of SZ were weighed and the initial, co and intermediate, c1 Hg(II) concentrations were prepared as listed in Table 9. The experiment was carried out with respect to the SZ pathway, which is the opposite of the solution pathway. For example, for the initial concentration of Hg(II), co = 0.460 mmol/L, a mass of 1.465 g of SZ was first saturated with 100 mL of Hg(II) concentration, c1 = 0.016 mmol/L for 37.36 min (i.e., 38 min), which corresponds to the second stage. Thereafter, the partially saturated SZ was separated and transferred to the first stage and saturated with a solution of Hg(II) concentration, co = 0.460 mmol/L for 69.66 min (i.e., 70 min).
The predicted and experimentally determined values of Hg(II) concentrations for each stage, the total removal efficiency, as well as the percentage deviation are shown in Table 10 for the two-stage cross-current and in Table 11 for the two-stage counter-current flow design.
The results shown in Table 10 and Table 11 indicate that the predicted and experimental values of total removal efficiency are closely aligned, indicating that the disparity between predicted and actual results was mostly not significant. For both configurations of the two-stage reactors, the highest percentage of deviation was observed for the lowest initial Hg(II) concentration, while for the other concentrations it was below 1%. The reason for the higher deviation at the lowest concentration could be attributed to the lower driving force of the process, which indicates the need for either a higher SZ mass or a longer contact time. For the stated reason, the removal of extremely low concentrations of Hg(II), which corresponds to the second stage of a two-stage reactor, is often challenging.
Taking everything into consideration, the results both theoretically and experimentally demonstrated that the developed mathematical models by applying the mass balance equation and Brouers-Sotolongo isotherm to the equilibrium results, i.e., the Vermeulen’s approximation to the kinetic results, enable the estimation of the minimum required mass and contact time for Hg(II) sorption on SZ in both cross and counter-current flow batch designs. In summary, the two-stage counter-current flow design was confirmed and recommended for the sorption of Hg(II) onto SZ.

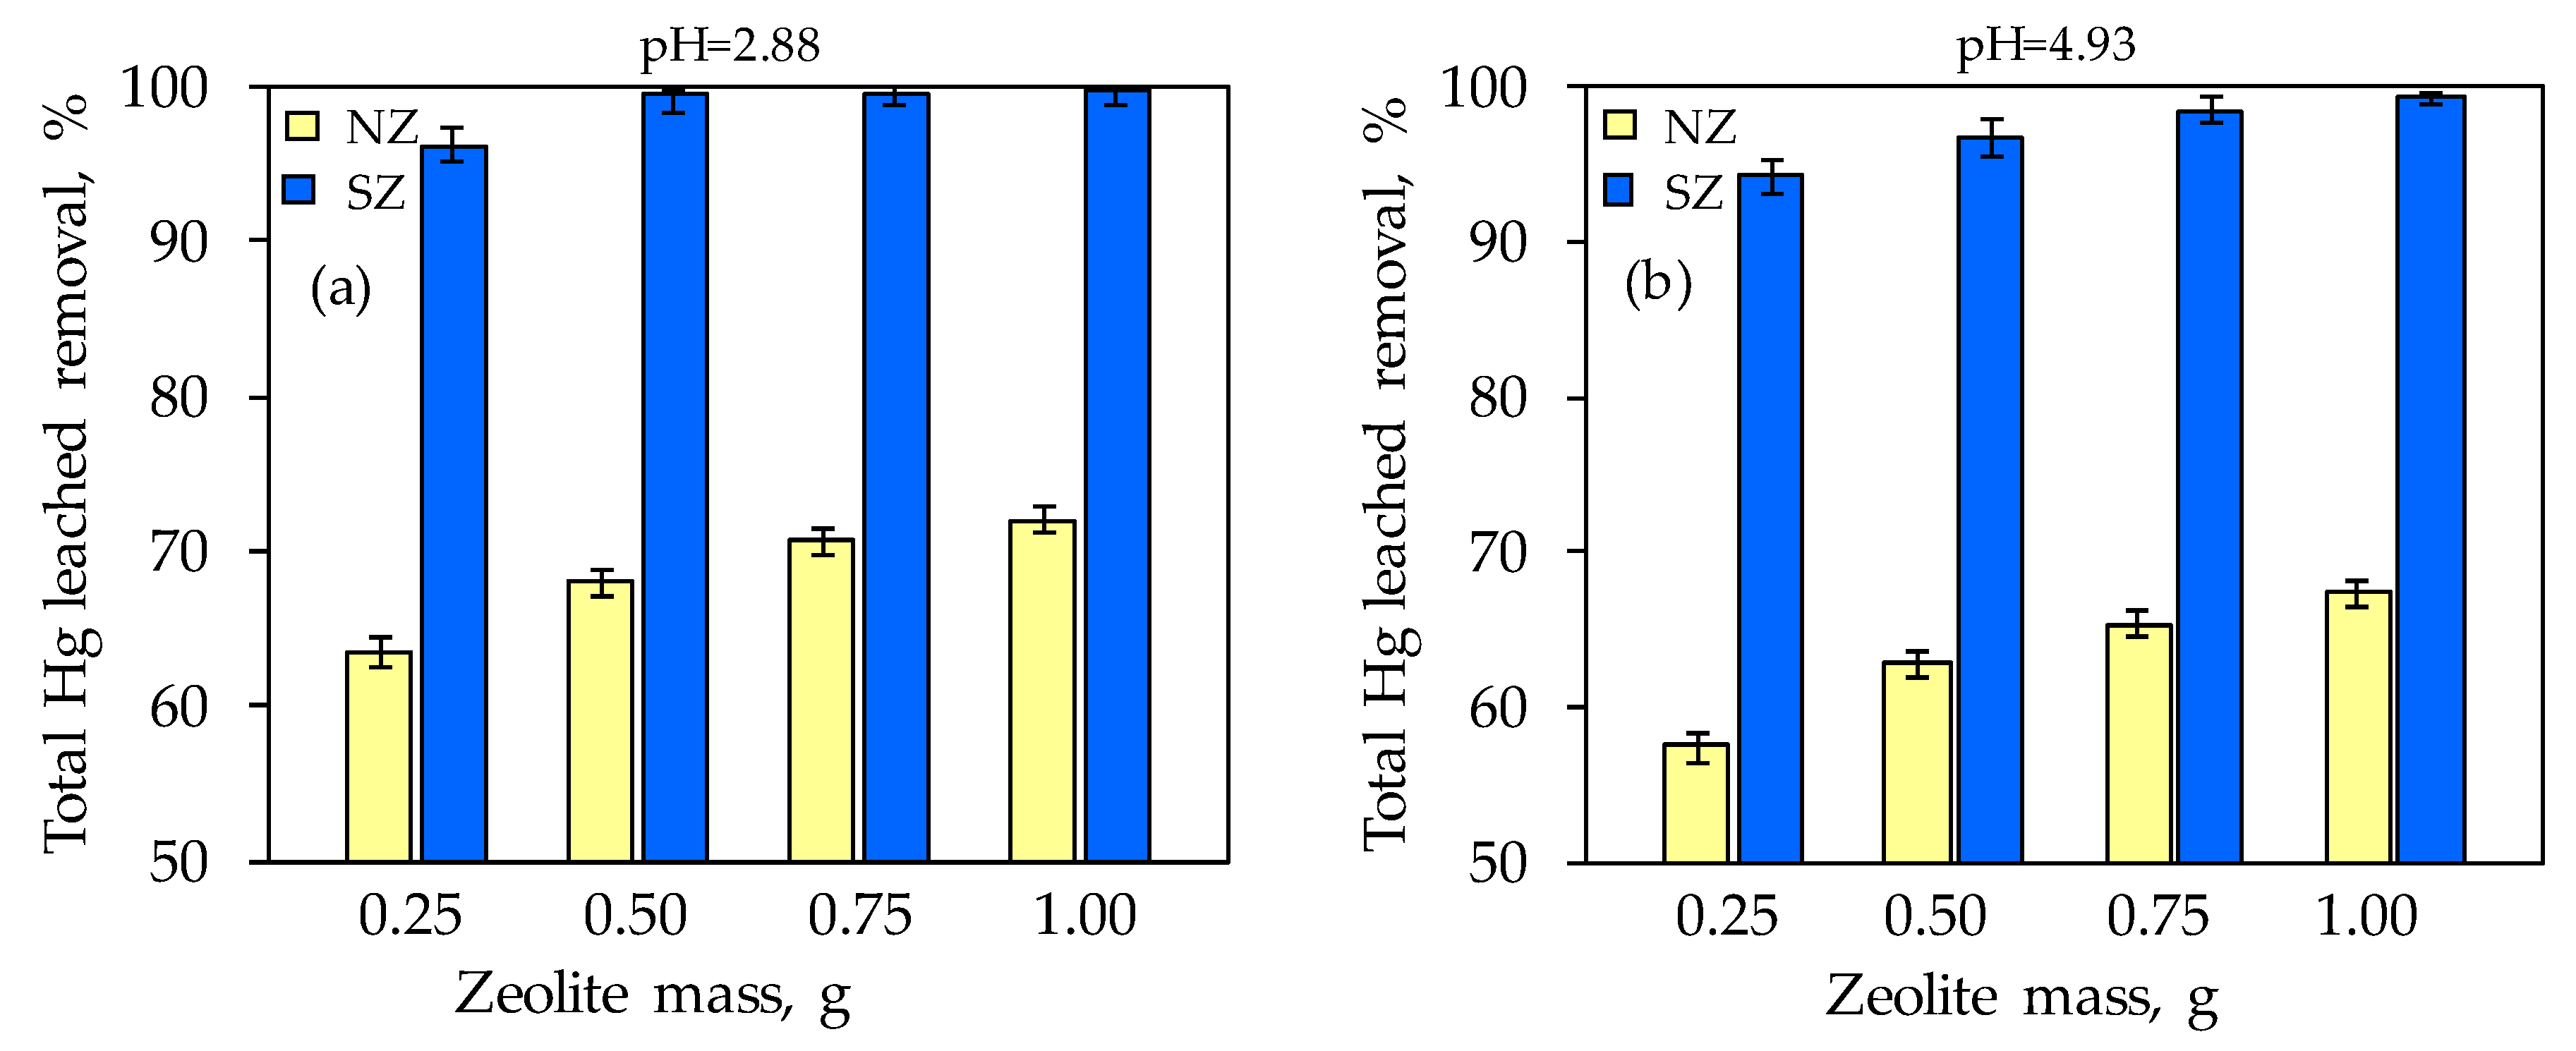
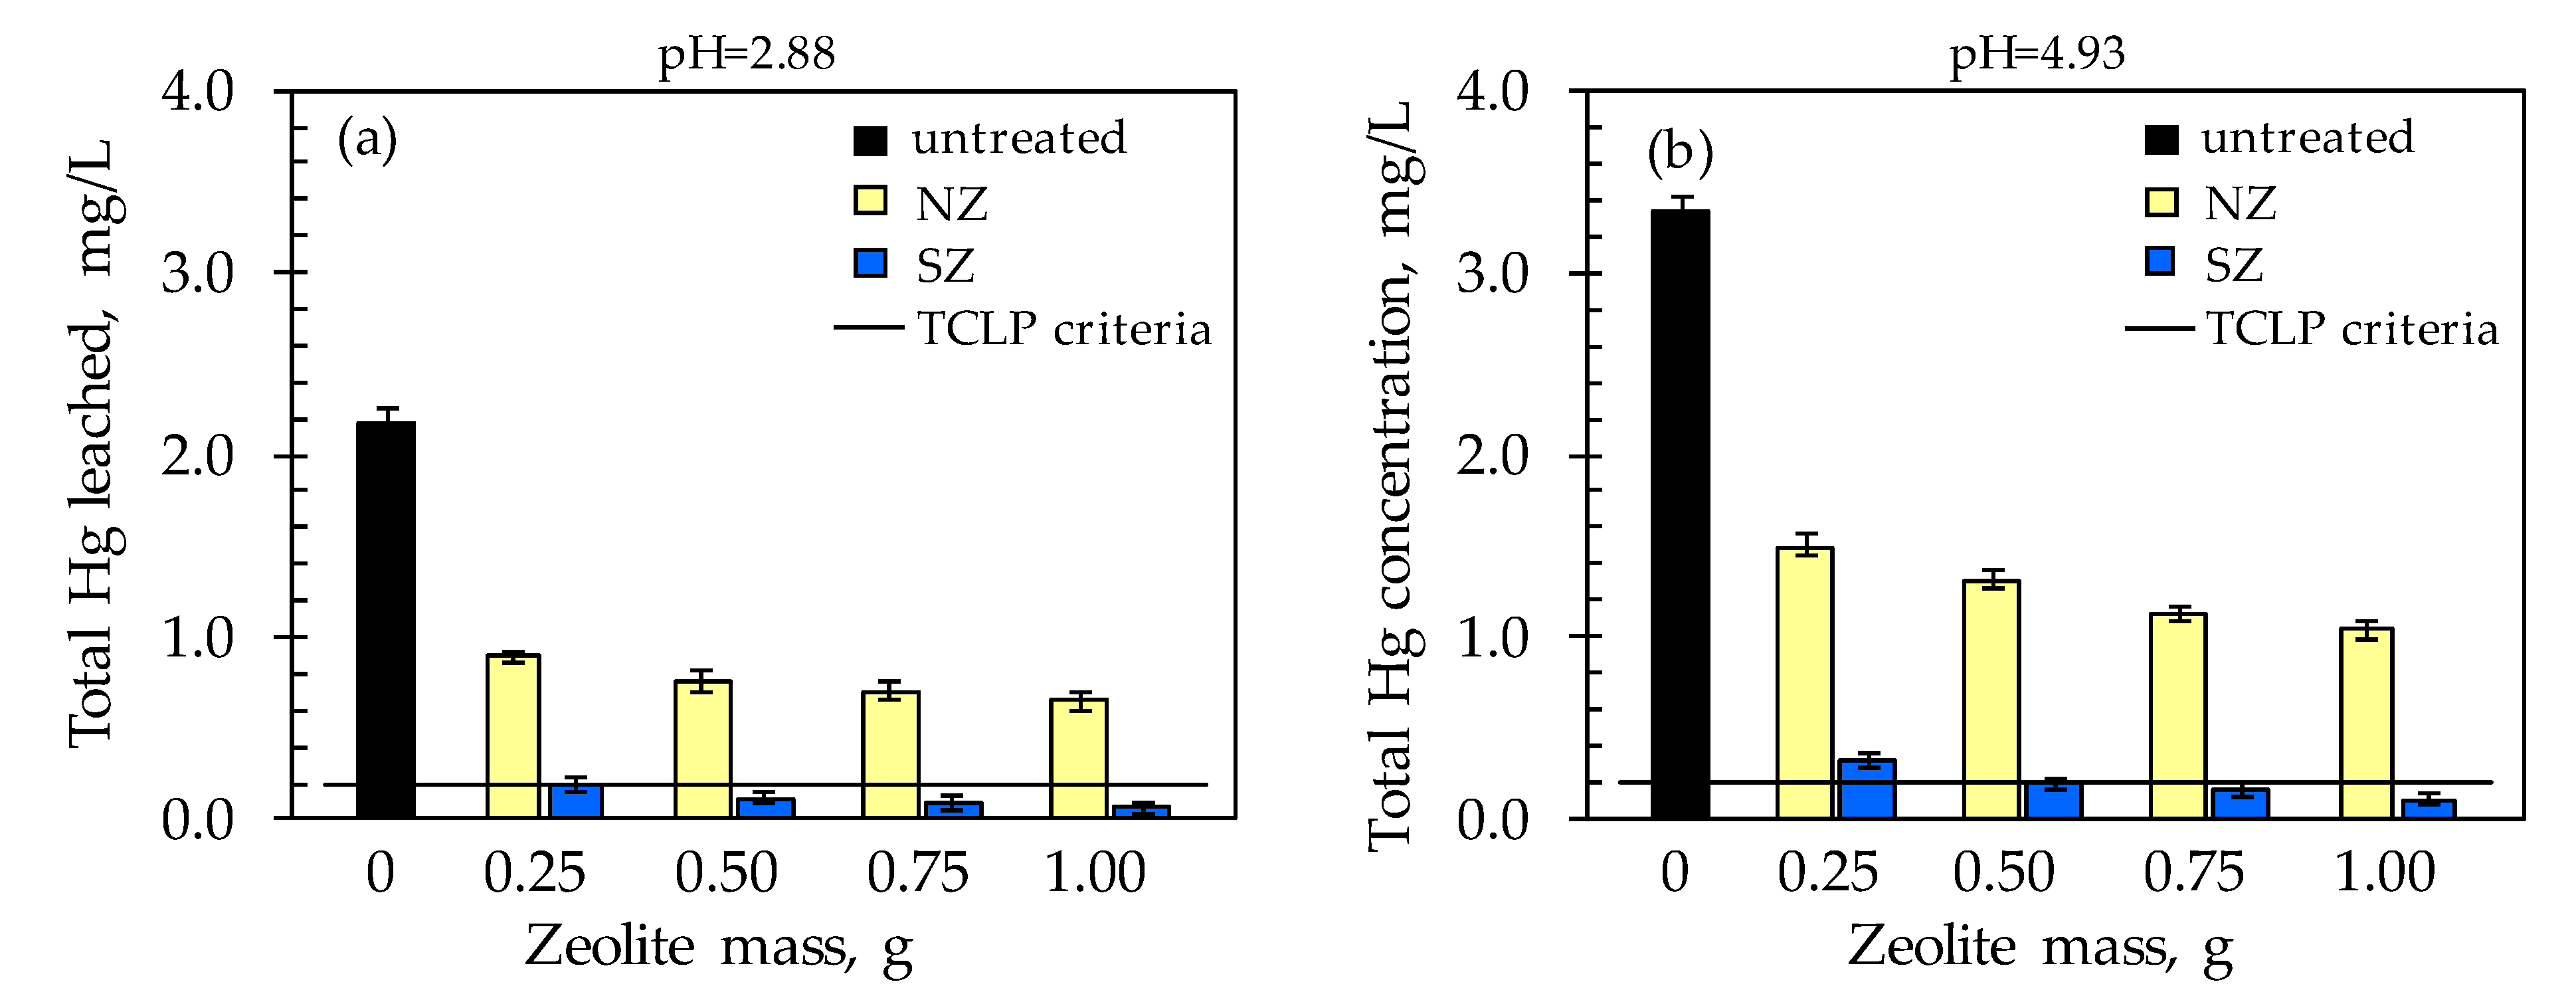
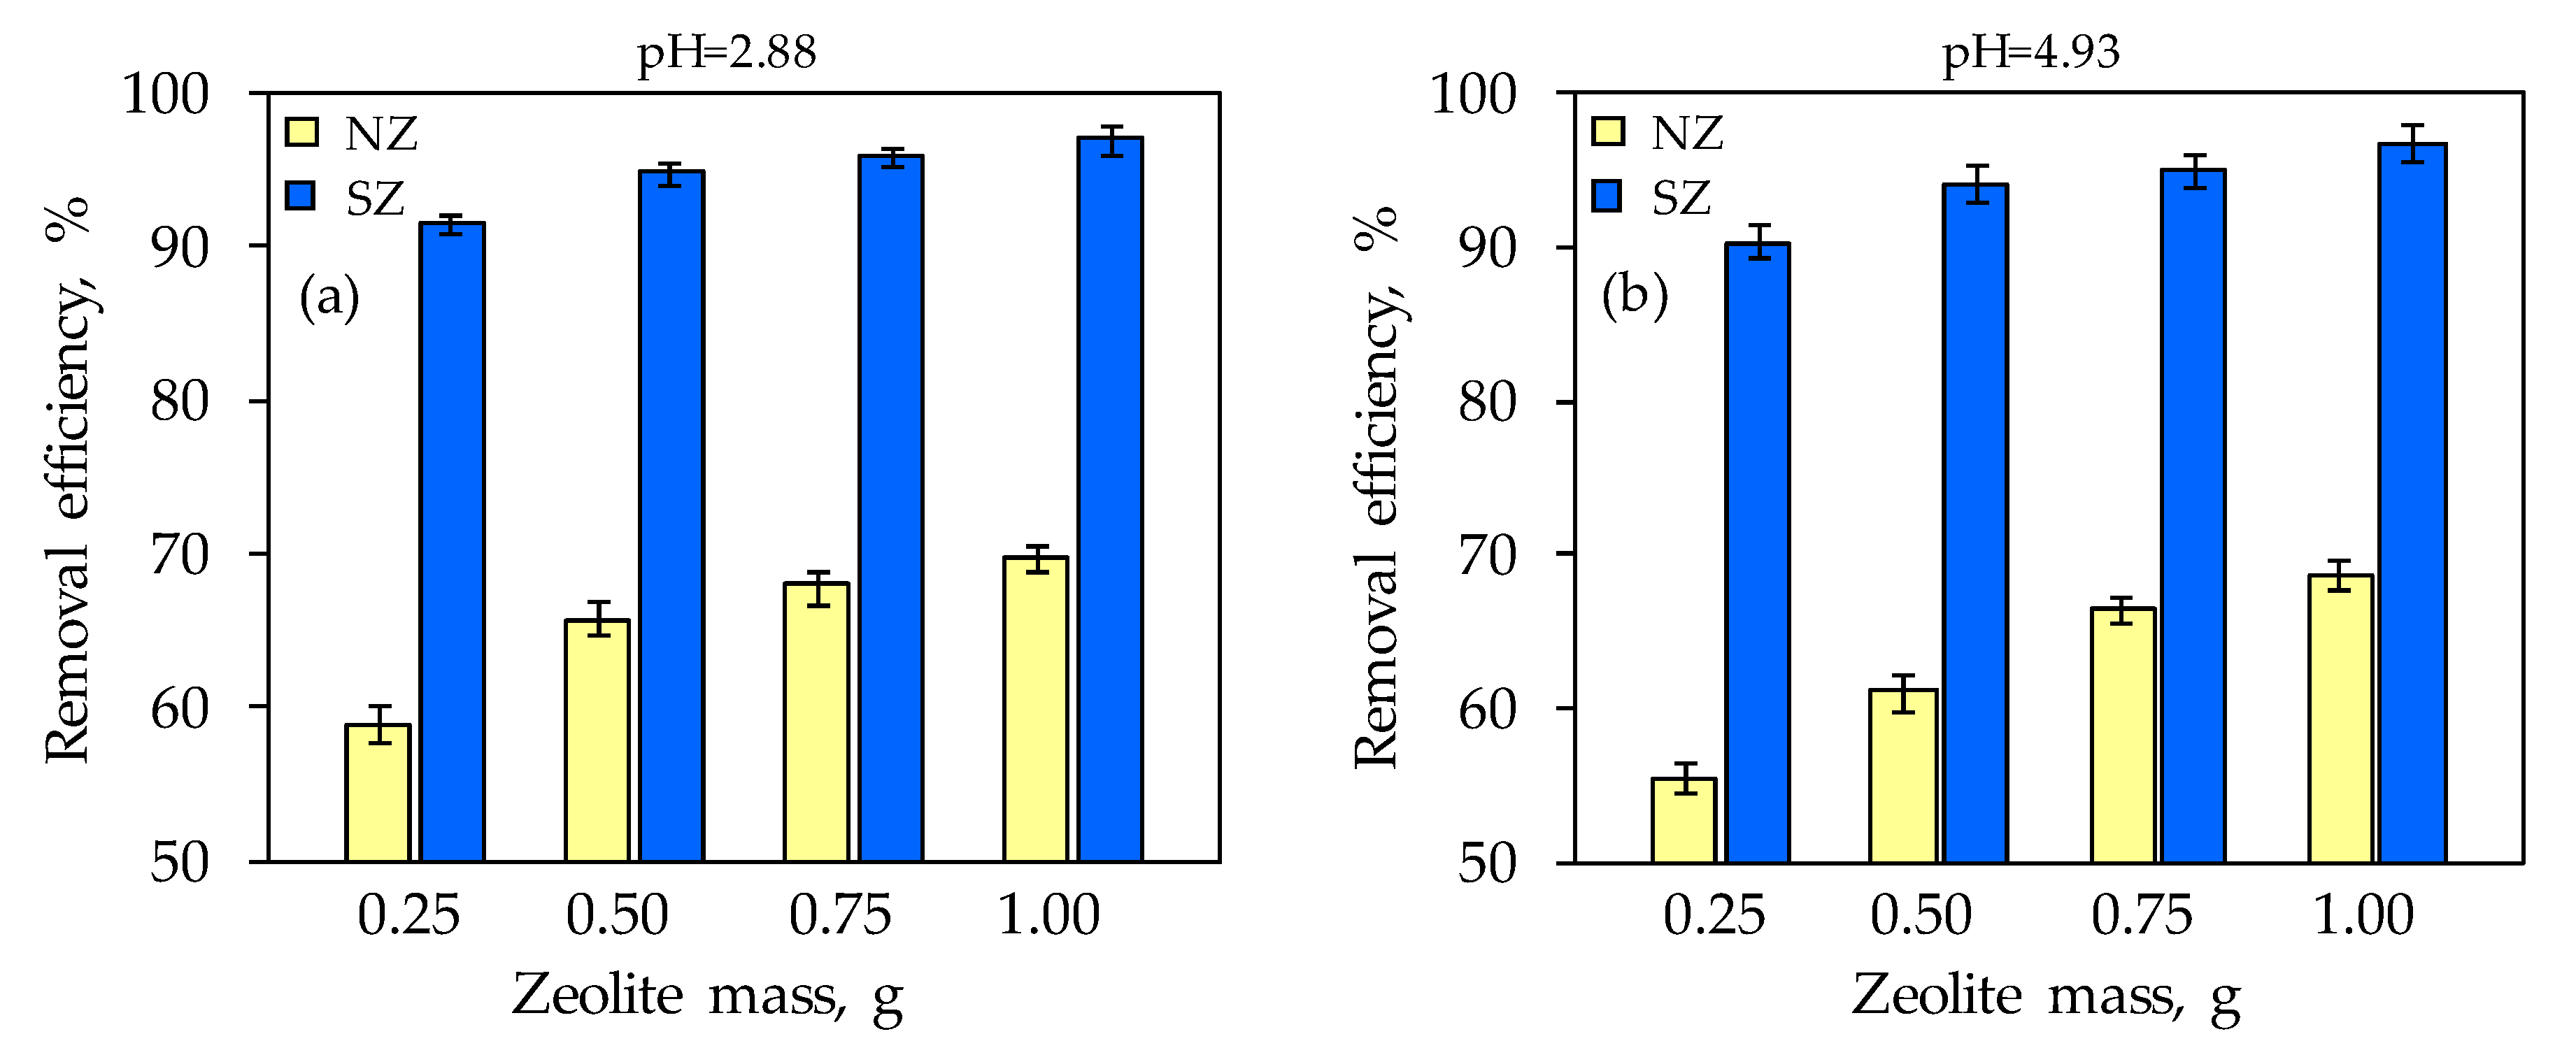
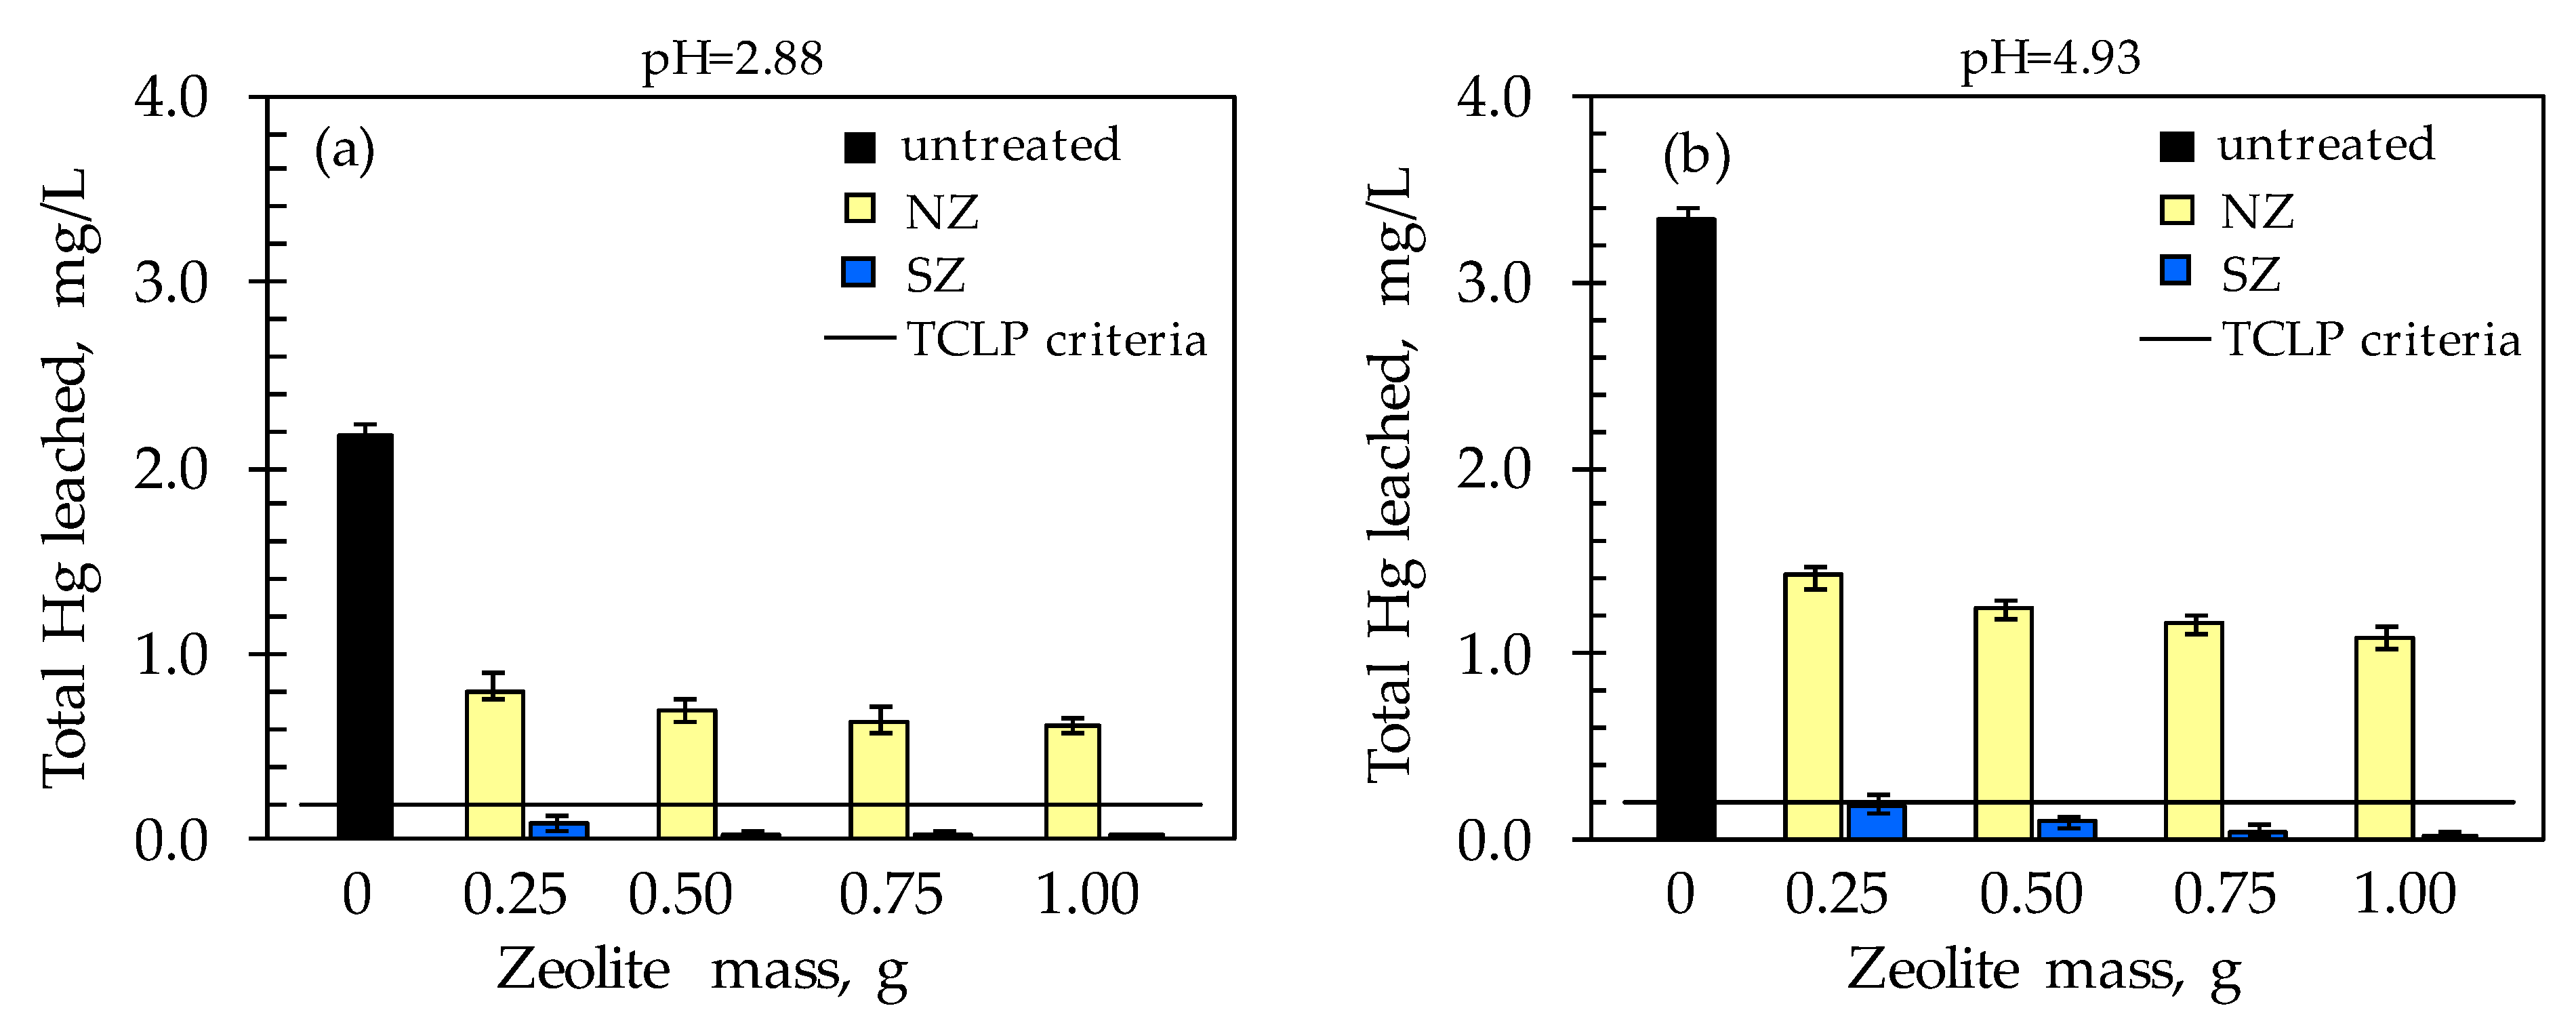
3.4. Mercury Leaching from the Mercury-Contaminated Soil and Its Sorption onto Natural and Sulfur-Impregnated Zeolite

Before implementing an often expensive and long-term soil remediation program, it is necessary to know the amount and form of mercury in the soil, as well as to conduct laboratory tests using both synthetic solutions and a real soil sample. For this purpose, prior to implementing the toxicity characteristic leaching procedure (TCLP), the total Hg content in the soil sample collected at the location of Frbejžene trate was determined in the amount of 1347 mg/kg. This indicates that the Idrija mine area is extremely polluted, and it would be desirable to apply an appropriate remediation program. Then, leaching experiments were carried out with raw soil at pH = 2.88 and pH = 4.93 according to the TCLP test as described in Section 2.3.2. The obtained leachates were then subjected to subsequent sorption, that is, treated with different dosages of NZ and SZ. A comparison of the total leached Hg from the raw soil at pH = 2.88 and pH = 4.93, with the residual Hg concentration after sorption onto NZ and SZ is shown in Figure 6. Figure 7 shows the removal efficiency of total leached Hg after subsequent sorption with different dosages of NZ and SZ at pH = 2.88 and pH = 4.93.
From Figure 6a,b, the higher total leached Hg concentration from raw soil at pH = 4.93 (3.345 mg/L) compared to pH = 2.88 (2.178 mg/L) is observed. This finding differs from the expected, since usually at lower pH, the solubility of the metal increases. However, in a soil sample, the presence of mineral components as well as organic matter, especially humic and fulvic acids, could affect the solubility of bound Hg. Unlike fulvic acids which are soluble under all pH conditions, co-precipitation of humic acids at pH < 3 occurs, while an increase in pH facilitates their dissolution [77,78]. At a pH = 2.88, dissolution of eventually present soil mineral components should also take place. However, a higher concentration of total leached Hg at pH = 4.93 indicates that dissolution of Hg from humic acids dominates. Therefore, it could be assumed that the binding of Hg to humic substances is predominant in the investigated soil. This further suggests that humic acids should be most responsible for the higher Hg retention in this soil at pH = 2.88.
The total leached Hg concentration from the raw soil at both pH values is above the prescribed value according to the TCLP criterion for Hg, which is 0.2 mg/L (black line in Figure 6). According to the TCLP test, raw soil is an extremely hazardous waste that needs adequate remediation or preventing the leaching of toxic Hg, and thus the spreading of pollution. On the other hand, after the implementation of subsequent sorption, which actually represents ex situ remediation, total Hg concentrations did not exceed 1.490 mg/L when NZ was used and 0.330 mg/L when SZ was used (Figure 6). A decrease in total residual Hg concentration is observed with an increasing zeolite dose, which is significantly more pronounced for SZ compared to NZ. The TCLP maximum concentration criterion of 0.2 mg/L was achieved exclusively for SZ with a minimum dose of 0.25 g at pH = 2.88 and 0.5 g at pH = 4.93. By linear interpolation of the prediction results of the SZ mass from Table 2, the SZ mass of 0.49 g for the Hg concentration of 2.178 mg/L (pH = 2.88) and 0.78 g for the concentration of 3.345 mg/L (pH = 4.93) should be sufficient to achieve a removal efficiency of 99.9%. Results shown in Figure 7 indicate that the removal efficiency increases with an increasing zeolite dose for both pH values and is in the range 55–70% for NZ and 90–97% for SZ. The results indicate that the SZ sample immediately achieved high efficiency even at the lowest dose, which could be attributed to the number of available active sites that differ compared to NZ due to the modification method. In addition, the results of minimum mass estimation based on mathematical modeling indicate that the prediction of minimum SZ mass has an acceptable correlation with the obtained results and that prediction and optimization is a good tool for minimum mass estimation to achieve the desired efficiency.
Leaching of Hg from raw soil samples with a simultaneous addition of various doses of NZ or SZ was carried out with the aim of simulating in situ remediation. Namely, the TCLP test was used to monitor Hg mobility in treated samples with NZ and SZ at pH = 2.88 and pH = 4.93. The TCLP test results of untreated and treated raw soil are compared in Figure 8, while Figure 9 compares the total leached Hg removal with the addition of NZ and SZ at both tested pH values.
Compared to the untreated sample, at both pHs, the mobility of total leached Hg was reduced with the addition of NZ, while a drastic reduction in mobility was noticed with SZ. At both pHs, total leached Hg concentrations did not exceed 1.420 mg/L in the soil sample with NZ addition, i.e., 0.189 mg/L with SZ addition (Figure 8). With an increase in NZ dose, the total leached Hg concentration slightly decreases, while a drastic decrease was observed even with the lowest SZ dose added. In relation to the TCLP test criterion (<0.2 mg Hg/L), only the soil sample treated with SZ meets this value even at the smallest dosage of 0.25 g at both pH values. The obtained results indicate that SZ is a promising material for in situ remediation of mercury-contaminated soil, since its minimum dose significantly reduces Hg leaching from contaminated soil at both examined pH values. The total removal of leached Hg increased with increasing zeolite dosage and is in the range of 57–72% for NZ, and 94–99% for SZ at both pHs. Unlike NZ, where a maximum removal efficiency of 72% is achieved at the highest dose, for SZ a minimum removal efficiency of 94% is achieved even at the lowest dose.
Namely, the sorption of mercury species from soil onto zeolites is presumably very complex and involves a multi-sorption mechanism. The most pronounced decrease in total leached Hg in the presence of the SZ can be a consequence of the formation of sparingly soluble HgS on the SZ surface, since it is well known that Hg exhibits a strong affinity for sulfur species. Moreover, the formation of HgS is desirable since it is the least toxic form of mercury due to its stability, low solubility, and relative immobility, which thus reduces the bioavailability of Hg for methylation in deeper soil layers. This once again confirms SZ as a preferential sorbent for Hg compared to NZ.
According to the aforementioned predicted SZ masses obtained by linear interpolation to achieve a removal efficiency of 99.9%, the results show that for the leached Hg concentration of 2.171 mg/L at pH = 2.88, an SZ mass of 0.5 g was sufficient, and for the leached Hg concentration of 3.345 mg/L, an SZ mass of 0.75 g was sufficient. The obtained results are in good agreement with the predicted ones, which indicates that by mathematical modeling, simulation, and verification of the results, the required mass of SZ can be reliably predicted to achieve the desired efficiency.
Comparing the results obtained by subsequent and simultaneous sorption on zeolites, slightly better removal efficiency can be observed using simultaneous sorption, that is, in situ remediation. Finally, this study has shown that the developed mathematical models are applicable for estimating the required amount of SZ for in situ remediation of mercury-contaminated soil in the area of the Idrija mine, Slovenia. A previous study confirmed that the SZ saturated with mercury at the end of its life can be safely left in the environment since Hg binds strongly to SZ [27]. Thus, SZ could be a potential option to reduce Hg leaching emissions, thereby reducing the negative impact on the entire ecosystem.

4. Conclusions

Modeling, simulation, and optimization of Hg(II) sorption equilibrium and kinetics data is an important tool in environmental engineering that enables the minimizing of zeolite consumption and contact time while simultaneously increasing sorption efficiency and zeolite utilization. Analysis of equilibrium and kinetic data indicated that physical and chemical sorption are responsible for Hg(II) uptake in NZ and SZ. It could be that physical sorption is probably more dominant for NZ, while chemical sorption is for SZ. The overall rate of mass transfer is controlled by intraparticle diffusion which is in accordance with the Vermeulen’s approximation that best describes the experimental results. Mathematical models for predicting the optimal zeolite mass and contact time required to remove 99.9% of Hg(II) were developed using the mass balance equation, the Brouers-Sotolongo isotherm, and the Vermeulen’s approximation. The results showed that optimization is a reliable tool for batch reactor design based on verification of the predicted parameters. In relation to the single-stage reactor, both two-stage designs contribute significantly to the reduction of the amount of zeolite, thereby the counter-current design takes the lead. For all proposed designs, the consumption savings is substantially higher for the SZ than for the NZ. Likewise, a significant saving on the SZ mass is achieved in the counter-current rather than in the cross-current design. Although the two-stage design has a higher investment cost compared to the single-stage design, the savings in mass and operating contact time in principle justify its application.
The TCLP results clearly showed that a higher pH favors the leaching of Hg from contaminated soil. Moreover, the tested pH of 4.93 corresponds to the real pH of rainwater, indicating that the leaching of Hg in real conditions takes place continuously. Therefore, the need for topsoil remediation is necessary in order to reduce/prevent this phenomenon. The results of subsequent and simultaneous sorption of leached Hg from raw soil at pH = 2.88 and pH = 4.93 showed that SZ was more effective in reducing Hg mobility than NZ. In addition, at a minimum SZ mass of 0.25 g, an extremely high removal efficiency of 94% is achieved with a reduction of the leached Hg concentration below the TCLP criterion of 0.2 mg/L, making SZ a promising material for in situ remediation of mercury-contaminated soils. This research could help reduce the risk of spreading extremely toxic mercury near the Idrija mine in Slovenia, primarily by performing in situ remediation with an optimal dose of environmentally acceptable SZ.

Author Contributions

Conceptualization, investigation, methodology, formal analysis, writing—original draft preparation M.U.; experimental analysis A.J.; writing—review and editing, M.U., A.J., I.N. and M.T. All authors have read and agreed to the published version of the manuscript.

Funding

This work has been supported by the bilateral Croatian-Slovenian project “Natural modified sorbents as materials for remediation of mercury contaminated environment” (2020–2023), founded by the Croatian Ministry of Science and Education and Slovenian Research Agency (ARRS).

Data Availability Statement

Not applicable.

Conflicts of Interest

The authors declare no conflict of interest.

Nomenclature

AASAtomic Absorption Spectrophotometer
B1sorbed Hg(II) concentration in the rapid step (mmol/L)
B2sorbed Hg(II) concentration in the slow step (mmol/L)
BTheat of sorption obtained from the Temkin isotherm (kJ/mol)
c1Hg(II) concentration after first stage (mmol/L
c2Hg(II) concentration after second stage (mmol/L)
ceequilibrium Hg(II) concentration (mmol/L)
cHg, raw soilconcentration of total leached Hg from raw soil (mg/L)
cHg, treated soilconcentration of total leached Hg from raw soil treated with zeolites (mg/L)
coinitial Hg(II) concentration (mmol/L)
dpzeolite particle diameter (cm)
DVintraparticle diffusion coefficient obtained from the Vermeulen’s approximation (cm2/min)
DWMdiffusion coefficient obtained from the Weber-Morris model (cm2/min)
Emean free sorption energy (kJ/mol)
Ithickness of the boundary layer (mmol/g)
ICP-ESinductively coupled plasma emission spectrometry
k1rate constant of the PFO (1/min)
k2rate constant of the PSO [g/(mmol∙min)]
kB1double exponential rapid rate constants (1/min)
kB2double exponential slow rate constants (1/min)
KBSBrouers-Sotolongo isotherm constant (L/mmol)
KDRDubinin-Raduskevich isotherm constant (mol2/kJ)
KFFreundlich constant (L/mmol)
KKKhan isotherm constant (L/mmol)
KLLangmuir constant (L/mmol)
KLFLangmuir-Freundlich isotherm constant (L/mmol)
KTTemkin isotherm equilibrium binding constant (L/mmol)
kWMWeber-Morris diffusion constant [mmol/(g∙min1/2)]
kWMWeber-Morris diffusion constant (cm2/min)
mzeolite mass (g)
m1zeolite mass in the first stage (g)
m2zeolite mass in the second stage (g)
nFFreundlich exponent constant indicative to the sorption intensity and surface heterogeneity (-)
NZnatural zeolite
PFOpseudo-first order kinetic model
PSOpseudo-second order kinetic model
q1amount of Hg(II) sorbed on zeolite in the first stage of the two-stage reactor (mmol/g)
q2amount of Hg(II) sorbed on zeolite in the second stage of the two-stage reactor (mmol/g)
qeamount of Hg(II) sorbed on zeolite in equilibrium (mmol/g)
qmmaximum sorption capacity obtained from the model
qtamount of Hg(II) sorbed on zeolites in time t (mmol/g)
Rgas constant [8.314 J/(mol∙K)]
roverall sorption rate [mmol/(g∙min)]
r1sorption rate of the rapid step [mmol/(g∙min)]
R1percentage of Hg(II) removal in the first stage (%)
r2sorption rate of the slow step [mmol/(g∙min)]
R2linear correlation coefficients
r2non-linear correlation coefficients
R2percentage of Hg(II) removal in the second stage (%)
RCrelative coefficient (%)
RFproportion of Hg(II) sorbed in rapid step (%)
RLLangmuir separation factor (-)
RMSEroot mean square error
rpzeolite particle radius (cm)
rpmrevolutions per minute
Rtotaltotal percentage of Hg(II9 removal in the first and second stages (%)
SEM-EDSscanning electron microscopy with energy dispersive X-ray spectroscopy
SFproportion of Hg(II) sorbed in slow step (%)
SZsulfur-impregnated zeolite
Tabsolute temperature (K)
ttime (min)
TCLPtoxicity characteristic leaching procedure
Vvolume of the solution (L) and m is the mass of zeolite (g)
XRPD X-ray powder diffraction
αesorption efficiency in equilibrium (%)
αE initial chemisorption rate of the Elovich model [mmol/(g·min)]
αleachremoval efficiency of leached Hg (%)
βE Elovich constant related to the extent of surface coverage (g/mmol)
βBSBrouers-Sotolongo isotherm parameter related with energy distribution and surface heterogeneity
βKKhan isotherm exponent
βLFLangmuir-Freundlich isotherm exponent (-)
βTTemkin constant
εPolany potential (kJ/mol)
χ2non-linear chi-square test

References

  1. Talabi, A.O.; Kayode, T.J. Groundwater Pollution and Remediation. J. Water Resour. Prot. 2019, 11, 1–19. [Google Scholar] [CrossRef] [Green Version]
  2. Tomiyama, S.; Igarashi, T. The potential threat of mine drainage to groundwater resources. Curr. Opin. Environ. Sci. Health 2022, 27, 100347. [Google Scholar] [CrossRef]
  3. Khobragade, K. Impact of Mining Activity on environment: An Overview. Int. J. Sci. Res. Public 2020, 10, 784–791. [Google Scholar] [CrossRef]
  4. Bavec, Š.; Gosar, M. Introduction to geochemical studies in the Idrija urban environment. In Environmental Influences of Mercury Ore Processing—Case Studies Selected at Slovenian, Mexican, Hungarian Group Meeting in Idrija in July 2012; Gosar, M., Dizdarevič, T., Miler, M., Eds.; Geological Survey of Slovenia & Idrija Mercury Mine, Ltd.: Ljubljana, Slovenia, 2012; pp. 28–34. [Google Scholar]
  5. Miklavčič, A.; Mazej, D.; Jaćimović, R.; Dizdarevič, T.; Horvat, M. Mercury in food items from the Idrija Mercury Mine area. Environ. Res. 2013, 125, 61–68. [Google Scholar] [CrossRef]
  6. Río Segade, S.; Dias, T.; Ramalhosa, E. Mercury methylation versus demethylation: Main processes involved. In Methylmercury: Formation, Sources and Health Effects; Clampet, A.P., Ed.; Nova Science Publishers, Inc.: New York, NY, USA, 2011; pp. 1–32. [Google Scholar]
  7. Gosar, M.; Teršić, T. Environmental geochemistry studies in the area of Idrija mercury mine, Slovenia. Environ. Geochem. Health 2012, 34, 27–41. [Google Scholar] [CrossRef]
  8. Teršič, T.; Biester, H.; Gosar, M. Leaching of mercury from soils at extremely contaminated historical roasting sites (Idrija area, Slovenia). Geoderma 2014, 226–227, 213–222. [Google Scholar] [CrossRef]
  9. Teršič, T.; Gosar, M.; Biester, H. Environmental impact of ancient small-scale mercury ore processing at Pšenk on soil (Idrija area, Slovenia). Appl. Geochem. 2011, 26, 1867–1876. [Google Scholar] [CrossRef]
  10. Teršič, T.; Gosar, M.; Biester, H. Distribution and speciation of mercury in soil in the area of an ancient mercury ore roasting site, Frbejžene trate (Idrija area, Slovenia). J. Geochem. Explor. 2011, 110, 136–145. [Google Scholar] [CrossRef]
  11. Randall, P.M.; Chattopadhyay, S. Mercury contaminated sediment sites—An evaluation of remedial options. Environ. Res. 2013, 125, 131–149. [Google Scholar] [CrossRef]
  12. O’Connor, D.; Hou, D.; Sik Ok, Y.; Mulder, J.; Duan, L.; Wu, Q.; Wang, S.; Tack, F.M.G.; Rinklebe, J. Mercury speciation, transformation, and transportation in soils, atmospheric flux, and implications for risk management: A critical review. Environ. Int. 2019, 126, 747–761. [Google Scholar] [CrossRef]
  13. Wang, L.; Hou, D.; Cao, Y.; Ok, Y.S.; Tack, F.M.G.; Rinklebe, J.; O’Connor, D. Remediation of mercury contaminated soil, water, and air: A review of emerging materials and innovative technologies. Environ. Int. 2020, 134, 105281. [Google Scholar] [CrossRef]
  14. Liu, L.; Li, W.; Song, W.; Guo, M. Remediation techniques for heavy metal-contaminated soils: Principles and applicability. Sci. Total Environ. 2018, 633, 206–219. [Google Scholar] [CrossRef]
  15. Xu, J.; Garcia Bravo, A.; Lagerkvist, A.; Bertilsson, S.; Sjöblom, R.; Kumpiene, J. Sources and remediation techniques for mercury contaminated soil. Environ. Int. 2015, 74, 42–53. [Google Scholar] [CrossRef]
  16. Liu, W.; Zhou, Y.; Hua, Y.; Peng, B.; Deng, M.; Yan, N.; Qu, Z. A sulfur-resistant CuS-modified active coke for mercury removal from municipal solid waste incineration flue gas. Environ. Sci. Pollut. Res. Int. 2019, 26, 24831–24839. [Google Scholar] [CrossRef]
  17. Abdelouahab-Reddam, Z.; Wahby, A.; El Mail, R.; Silvestre-Albero1, J.; Rodríguez-Reinoso, R.; Sepúlveda-Escribano, A. Activated Carbons Impregnated with Na2S and H2SO4: Texture, Surface Chemistry and Application to Mercury Removal from Aqueous Solutions. Adsorp. Sci. Technol. 2014, 32, 101–115. [Google Scholar] [CrossRef] [Green Version]
  18. Asasian, N.; Kaghazchi, T. Sulfurized activated carbons and their mercury adsorption/desorption behavior in aqueous phase. Int. J. Environ. Sci. Technol. 2015, 12, 2511–2522. [Google Scholar] [CrossRef] [Green Version]
  19. Silva, H.S.; Ruiz, S.V.; Granados, D.L.; Santángelo, J.M. Adsorption of Mercury (II) from Liquid Solutions Modified Activated Carbons. Mater. Res. 2010, 13, 129–134. [Google Scholar] [CrossRef]
  20. Tan, G.; Sun, W.; Xu, Y.; Wang, H.; Xu, N. Sorption of mercury (II) and atrazine by biochar, modified biochars and biochar based activated carbon in aqueous solution. Bioresour. Technol. 2016, 211, 727–735. [Google Scholar] [CrossRef]
  21. Yuan, C.-S.; Lin, H.-Y.; Wu, C.-H.; Liu, M.-H.; Hung, C.-H. Preparation of Sulfurized Powdered Activated Carbon from Waste Tires Using an Innovative Compositive Impregnation Process. J. Air Waste Manag. Assoc. 2004, 54, 862–870. [Google Scholar] [CrossRef] [Green Version]
  22. Kede, C.M.; Ndibewu, P.P.; Kalumba, M.M.; Panichev, N.A.; Ngomo, H.M.; Ketcha, J.M. Adsorption of Mercury(II) onto activated carbons derived from Theobroma cacao pod husk. S. Afr. J. Chem. 2015, 68, 226–235. [Google Scholar] [CrossRef]
  23. Habila, M.A.; AlOthman, Z.A.; Ghfar, A.A.; Al-Zaben, M.I.M.; Alothman, A.A.S.; Abdeltawab, A.A.; El-Marghany, A.; Sheikh, M. Phosphonium-based Ionic Liquid Modified Activated Carbon from Mixed Recyclable Waste for Mercury(II) Uptake. Molecules 2019, 24, 570. [Google Scholar] [CrossRef] [Green Version]
  24. Chojancki, A.; Chojancka, K.; Hoffmann, J.; Górecki, H. The application of natural zeolites for mercury removal: From laboratory tests to industrial scale. Miner. Eng. 2004, 17, 933–937. [Google Scholar] [CrossRef]
  25. Gebremedhin-Haile, T.; Olguín, M.T.; Solache-Ríos, M. Removal of mercury ions from mixed aqueous metal solutions by natural and modified zeolitic minerals. Water Air Soil Pollut. 2003, 148, 179–200. [Google Scholar] [CrossRef]
  26. Misealides, P.; Godelitsas, A. Removal of heavy metals from aqueous solutions using pretreated natural zeolitic materials: The case of mercury(II). Toxicol. Environ. Chem. 1995, 51, 21–29. [Google Scholar] [CrossRef]
  27. Ugrina, M.; Gaberšek, M.; Daković, A.; Nuić, I. Preparation and Characterization of the Sulfur-Impregnated Natural Zeolite Clinoptilolite for Hg(II) Removal from Aqueous Solutions. Processes 2021, 9, 217. [Google Scholar] [CrossRef]
  28. Praus, P.; Motáková, M.; Ritz, M. Montmorillonite ion exchanged by mercury (II). Acta Geodyn. Geomater. 2012, 9, 63–70. [Google Scholar]
  29. Brigatti, M.F.; Colonna, S.; Malferrari, D.; Medici, L.; Poppi, L. Mercury adsorption by montmorillonite and vermiculite: A combined XRD, TG-MS, and EXAFS study. Appl. Clay Sci. 2005, 28, 1–8. [Google Scholar] [CrossRef]
  30. Trakarnpruk, W.; Chirandorn, N. Treated Clay for Adsorption of Mercury(II) Ions. J. Sci. Res. Chula. Univ. 2005, 30, 137–150. [Google Scholar]
  31. Margeta, K.; Zabukovec Logar, N.; Šiljeg, M.; Farkaš, M. Natural Zeolites in Water Treatment—How Effective is Their Use. In Water Treatment; Elshorbagy, W., Chowdhury, R.K., Eds.; IntechOpen: London, UK, 2013; pp. 81–112. [Google Scholar] [CrossRef] [Green Version]
  32. Busca, G. Acidity and basicity of zeolites. A fundamental approach. Microporous Mesoporous Mater. 2017, 254, 3–16. [Google Scholar] [CrossRef]
  33. Fu, F.; Wang, Q. Removal of heavy metals from wastewaters: A review. J Environ. Manag. 2011, 92, 407–418. [Google Scholar] [CrossRef]
  34. Hu, X.; Xue, Y.; Liu, L.; Zeng, Y.; Long, L. Preparation and characterization of Na2S-modified biochar for nickel removal. Environ. Sci. Pollut. Res. 2018, 25, 9887–9895. [Google Scholar] [CrossRef]
  35. Wajima, T.; Sugawara, K. Adsorption behaviors of mercury from aqueous solution using sulfur-impregnated adsorbent developed from coal. Fuel Process. Technol. 2011, 92, 1322–1327. [Google Scholar] [CrossRef]
  36. Al-Ghouti, M.; Da’ana, D.; Abu-Dieyeh, M.; Khraisheh, M. Adsorptive removal of mercury from water by adsorbents derived from daze pits. Sci. Rep. 2019, 9, 15327–15340. [Google Scholar] [CrossRef] [Green Version]
  37. Gupta, A.; Vidyarthi, S.R. Enhanced sorption of mercury from compact fluorescent bulbs and contaminated water streams using functionalized multiwalled carbon nanotubes. J. Hazard. Mater. 2014, 275, 132–144. [Google Scholar] [CrossRef]
  38. Cai, J.H.; Jia, C.Q. Mercury Removal from Aqueous Solution Using Coke-Derived Sulfur-Impregnated Activated Carbons. Ind. Eng. Chem. Res. 2010, 49, 2716–2721. [Google Scholar] [CrossRef]
  39. Blais, J.F.; Djedidi, Z.; Ben Cheikh, R.; Tyagi, R.D.; Mercier, G. Metals Precipitation from Effluents: Review. Pract. Period. Hazard. Toxic Radioact. Waste Manag. 2008, 12, 135–149. [Google Scholar] [CrossRef]
  40. Torres, E. Biosorption: A Review of the Latest Advances. Processes 2020, 8, 1584. [Google Scholar] [CrossRef]
  41. Bazargan, A.; Shek, T.-H.; Hui, C.-W.; McKay, G. Optimising batch adsorbers for the removal of zinc from effluents using a sodium diimidoacetate ion exchange resin. Adsorption 2017, 23, 477–489. [Google Scholar] [CrossRef]
  42. Cooney, D.O. Adsorption Design for Wastewater Treatment; Lewis Publishers: Boca Raton, FL, USA, 1999. [Google Scholar]
  43. Di Martino, M.; Sannino, F.; Pirozzi, D. Removal of pesticide from wastewater: Contact time optimization for a two-stage batch stirred adsorber. J. Environ. Chem. Eng. 2015, 3, 365–372. [Google Scholar] [CrossRef]
  44. Pirozzi, D.; Sannino, F. Design of a multi-stage stirred adsorber using mesoporous metal oxides for herbicide removal from wastewaters. J. Environ. Chem. Eng. 2014, 2, 211–219. [Google Scholar] [CrossRef]
  45. Torres-Perez, J.; Huang, Y.; Bazargan, A.; Khoshand, A.; McKay, G. Two-stage optimization of Allura direct red dye removal by treated peanut hull waste. SN Appl. Sci. 2020, 2, 475. [Google Scholar] [CrossRef] [Green Version]
  46. Ugrina, M.; Vukojević Medvidović, N.; Daković, A. Characterization and environmental application of iron-modified zeolite from the Zlatokop deposit. Desalin. Water Treat. 2015, 53, 3557–3569. [Google Scholar] [CrossRef]
  47. USEPA. Method 1311: Toxicity Characteristic Leaching Procedure; US Environmental Protection Agency: Washington, DC, USA, 2004.
  48. Foo, K.Y.; Hameed, B.H. Insight into the modelling of adsorption isotherm systems, review. Chem. Eng. J. 2010, 156, 2–10. [Google Scholar] [CrossRef]
  49. Ayawei, N.; Ebelegi, A.N.; Wankasi, D. Modelling and interpretation of adsorption isotherms. J. Chem. 2017, 2017, 3039817. [Google Scholar] [CrossRef] [Green Version]
  50. Ramadoss, R.; Subramaniam, D. Removal of divalent nickel from aqueous solution using blue-green marine algae: Adsorption modeling and applicability of various isotherm models. Sep. Sci. Technol. 2019, 54, 943–961. [Google Scholar] [CrossRef]
  51. Langmuir, I. The constitution and fundamental properties of solids and liquids. J. Am. Chem. Soc. 1916, 38, 2221–2295. [Google Scholar] [CrossRef] [Green Version]
  52. Langmuir, I. The adsorption of gases on plane surfaces of glass, mica, and platinum. J. Am. Chem. Soc. 1918, 40, 1361–1403. [Google Scholar] [CrossRef] [Green Version]
  53. Freundlich, H.M.F. Uber die adsorption in losungen. Z. Phys. Chem. 1906, 57, 385–470. [Google Scholar] [CrossRef]
  54. Temkin, M.I.; Pyzhev, V. Kinetic of Ammonia Synthesis on Promoted Iron Catalyst. Acta Phys. Chem. 1940, 12, 327–356. [Google Scholar]
  55. Xu, H.; Zhu, S.; Xia, M.; Wang, F.; Ju, X. Three-dimension hierarchical composite via in-situ growth of Zn/Al layered double hydroxide plates onto polyaniline-wrapped carbon sphere for efficient naproxen removal. J. Hazard. Mater. 2022, 423, 127192. [Google Scholar] [CrossRef] [PubMed]
  56. Dubinin, M.M.; Radushkevich, L.V. The equation of the characteristic curve of activated charcoal. Dokl. Akad. Nauk Sssr. 1947, 55, 331–337. [Google Scholar]
  57. Radushkevich, L.V. Potential theory of sorption and structure of carbons. Zhurnal Fiz. Khimii 1949, 23, 1410–1420. [Google Scholar]
  58. Dubinin, M.M. The potential theory of adsorption of gases and vapors for adsorbents with energetically non-uniform surface. Chem. Rev. 1960, 60, 235–241. [Google Scholar] [CrossRef]
  59. Khan, A.R.; Ataullah, R.; Al–Haddad, A. Equilibrium adsorption studies of some aromatic pollutants from dilute aqueous solutions on activated carbon at different temperatures. J. Colloid Interface Sci. 1997, 194, 154–156. [Google Scholar] [CrossRef]
  60. Mozaffari Majd, M.; Kordzadeh-Kermani, V.; Ghalandari, V.; Askari, A.; Sillanpää, M. Adsorption isotherm models: A comprehensive and systematic review (2010−2020). Sci. Total Environ. 2022, 812, 151334. [Google Scholar] [CrossRef] [PubMed]
  61. Brouers, F.; Sotolongo, O.; Marquez, F.; Pirard, J.P. Microporous and heterogeneous surface adsorption isotherms arising from Levy distributions. Physica A 2005, 349, 271–282. [Google Scholar] [CrossRef]
  62. Kumar, K.V. Linear and non-linear regression analysis for the sorption kinetics of methylene blue onto activated carbon. J. Hazard. Mater. B 2006, 137, 1538–1544. [Google Scholar] [CrossRef] [PubMed]
  63. Kumar, D.; Gaur, J.P. Chemical reaction- and particle diffusion-based kinetic modeling of metal biosorption by a phormidium sp.-dominated cyanobacterial mat. Bioresour. Technol. 2011, 102, 633–640. [Google Scholar] [CrossRef]
  64. Elovich, S.Y.; Larinov, O.G. Theory of adsorption from solutions of non-electrolytes on solid (I) equation adsorption from solutions and the analysis of its simplest form, (II) verification of the equation of adsorption isotherm from solutions. Izvestiya Akademii Nauk. SSSR Otd. Khim. Nauk. 1962, 2, 209–216. [Google Scholar]
  65. Sparks, D.L. Kinetics of sorption/release reactions on natural particles. In Structure and Surface Reactions of Soil Particles; Huang, P.M., Senesi, N., Buffle, J., Eds.; John Wiley & Sons Ltd.: Chichester, UK, 1998; pp. 413–448. [Google Scholar]
  66. Xu, H.; Zhu, S.; Lu, K.; Jia, H.; Xia, M.; Wang, F. Preparation of hierarchically floral ZIF-8 derived carbon@polyaniline@Ni/Al layered double hydroxides composite with outstanding removal phenomenon for saccharin. Chem. Eng. J. 2022, 450, 138127. [Google Scholar] [CrossRef]
  67. Apiratikul, R.; Pavasant, P. Sorption of Cu2+, Cd2+, and Pb2+ using modified zeolite from coal fly ash. Chem. Eng. J. 2008, 144, 245–258. [Google Scholar] [CrossRef]
  68. Wilczak, A.; Keinath, T.M. Kinetics of sorption and desorption of copper(II) and lead(II) on activated carbon. Water Environ. Res. 1993, 65, 238–244. [Google Scholar] [CrossRef]
  69. Chiron, N.; Guilet, R.; Deydier, E. Adsorption of Cu(II) and Pb(II) onto a grafted silica: Isotherms and kinetic models. Water Res. 2003, 37, 3079–3086. [Google Scholar] [CrossRef] [PubMed]
  70. Tosun, I. Ammonium removal from aqueous solutions by clinoptilolite: Determination of isotherm and thermodynamic parameters and comparison of kinetics by the Double exponential model and conventional kinetic models. Int. J. Environ. Res. Public Health 2012, 9, 970–984. [Google Scholar] [CrossRef] [PubMed] [Green Version]
  71. Helferich, F. Ion Exchange; Mc Graw-Hill Inc.: New York, NY, USA, 1962; pp. 250–322. [Google Scholar]
  72. Vijayaraghavan, K.; Padmesh, T.V.N.; Palanivelu, K.; Velan, M. Biosorption of nickel(II) ions onto Sargassum wightii: Application of two-parameter and three-parameter isotherm models. J. Hazard. Mater. B1 2006, 33, 304–308. [Google Scholar] [CrossRef]
  73. Zhu, X.; Yang, R.; Gao, W.; Li, M. Sulfur-modified chitosan hydrogel as an adsorbent for removal of Hg(II) from effluents. Fibers Polym. 2017, 18, 1229–1234. [Google Scholar] [CrossRef]
  74. Kara, A.; Demirbel, E. Kinetic, Isotherm and Thermodynamic Analysis on Adsorption of Cr(VI) Ions from Aqueous Solutions by Synthesis and Characterization of Magnetic-Poly(divinylbenzene-vinylimidazole) Microbeads. Water Air Soil Pollut. 2012, 223, 2387–2403. [Google Scholar] [CrossRef] [Green Version]
  75. Mishima, K.; Du, X.; Miyamoto, N.; Kano, N.; Imaizumi, H. Experimental and Theoretical Studies on the Adsorption Mechanisms of Uranium (VI) Ions on Chitosan. J. Funct. Biomater. 2018, 9, 49. [Google Scholar] [CrossRef] [Green Version]
  76. Ugrina, M.; Čeru, T.; Nuić, I.; Trgo, M. Comparative Study of Mercury(II) Removal from Aqueous Solutions onto Natural and Iron-Modified Clinoptilolite Rich Zeolite. Processes 2020, 8, 1523. [Google Scholar] [CrossRef]
  77. Xu, J.; Kleja, D.B.; Biester, H.; Lagerkvist, A.; Kumpiene, J. Influence of particle size distribution, organic carbon, pH and chlorides on washing of mercury contaminated soil. Chemosphere 2014, 109, 99–105. [Google Scholar] [CrossRef] [Green Version]
  78. Yin, Y.; Allen, H.E.; Li, Y.; Huang, C.P.; Sanders, P.F. Adsorption of Mercury(II) by Soil: Effects of pH, Chloride, and Organic Matter. J. Environ. Qual. 1996, 25, 837–844. [Google Scholar] [CrossRef]
Figure 1. Comparison of experimental data with two and three parameter isotherm models for Hg(II) sorption onto: (a) NZ and (b) SZ.
Processes 11 00606 g001
Figure 2. Schematic diagram of two-stage cross-current flow batch sorption process.
Processes 11 00606 g002
Figure 3. Schematic diagram of two-stage counter-current flow batch sorption process.
Processes 11 00606 g003
Figure 4. Fitting of experimental data with different kinetic models for NZ and SZ.
Processes 11 00606 g004
Figure 5. Fitting of experimental data with the Weber-Morris model for NZ and SZ.
Processes 11 00606 g005
Figure 6. Comparison of the total leached Hg concentration according to the TCLP test with the residual Hg concentration after subsequent sorption onto NZ and SZ at: (a) pH = 2.88 and (b) pH = 4.93.
Processes 11 00606 g006
Figure 7. The Hg removal efficiency after subsequent sorption onto NZ and SZ at: (a) pH = 2.88 and (b) pH = 4.93.
Processes 11 00606 g007
Figure 8. TCLP results of total Hg leached concentration with simultaneous addition of various zeolite doses at: (a) pH = 2.88 and (b) pH = 4.93.
Processes 11 00606 g008
Figure 9. The total Hg leached removal with simultaneous addition of various zeolite doses at: (a) pH = 2.88 and (b) pH = 4.93.
Processes 11 00606 g009
Table 1. Two and three parameter isotherm models constants and error analysis for Hg(II) sorption onto NZ and SZ.
Isotherm ModelParametersNZSZ
qe (mmol/g)0.2821.024
Langmuirqm (mmol/g)
KL (L/mmol)
RL
r2
RMSE
χ2
0.325
0.761
0.279
0.996
6.322∙10−3
4.839∙10−5
1.227
1.710
0.168
0.998
0.026
1.669∙10−3
FreundlichKF (L/mmol)
nF
r2
RMSE
χ2
0.138
2.760
0.959
0.018
2.863∙10−3
0.673
2.848
0.960
0.102
0.018
TemkinKT (L/g)
βT
BT (kJ/mol)
r2
RMSE
χ2
12.157
40.586
0.061
0.983
0.011
2.269·10−4
31.882
11.643
0.213
0.971
0.094
2.131·10−4
Dubinin-Radushkevichqm (mmol/g)
E (kJ/mol)
KDR (mol2/kJ)
r2
RMSE
χ2
0.264
1.623
0.190
0.940
0.025
1.640∙10−3
1.017
2.711
0.068
0.991
0.041
8.334∙10−4
Langmuir-Freundlichqm (mmol/g)
KS (L/mmol)
βS
r2
RMSE
χ2
0.352
0.626
0.762
0.997
4.940∙10−3
2.128∙10−4
1.124
2.466
0.911
0.999
0.015
3.205∙10−4
Khanqm (mmol/g)
KK (L/mmol)
βK
r2
RMSE
χ2
0.271
1.001
0.929
0.995
6.044∙10−3
2.169∙10−4
1.010
1.326
0.847
0.994
9.012∙10−3
4.091∙10−4
Brouers-Sotolongoqm (mmol/g)
KBS (L/mmol)
βBS
r2
RMSE
χ2
0.297
0.627
0.738
0.998
3.492∙10−3
6.552∙10−5
1.025
1.558
0.950
0.999
0.011
4.776∙10−4
Table 2. Predicted NZ and SZ masses for 99.9% Hg(II) removal efficiency in a single-stage system for selected initial Hg(II) concentrations at a constant volume of 1 L.
co
[mmol/L]
ce × 102
[mmol/L]
NZSZ
mtotal
[g]
mtotal
[g]
0.4600.046717.30426.27
1.0000.100879.87443.40
1.9500.1951049.39458.90
3.0000.3001176.15469.39
4.0600.4061274.55477.04
5.1500.5151357.89483.25
6.1400.6141423.17487.98
8.2800.8281541.92496.34
10.1001.0101626.65502.14
12.2601.2261714.15508.04
Table 3. Calculated predicted intermediate Hg(II) concentration, c1 and minimum masses of NZ and SZ with 99.9% Hg(II) removal efficiency in two-stage cross-current flow batch system, based on different selected initial Hg(II) concentrations at a constant volume of 1 L.
co
[mmol/L]
c2 × 102
[mmol/L]
NZSZ
c1
[mmol/L]
m1
[g]
m2
[g]
mtotal
[g]
c1
[mmol/L]
m1
[g]
m2
[g]
mtotal
[g]
0.4600.0460.02141.5532.0673.610.01614.3514.4128.76
1.0000.1000.04552.2038.7590.950.03415.5014.6530.15
1.9500.1950.09062.2547.43109.680.06616.5415.0931.63
3.0000.3000.14070.4853.76124.240.10017.6415.1932.83
4.0600.4060.19077.5158.43135.940.14017.8815.9933.87
5.1500.5150.25880.0766.60146.670.17019.3415.4834.82
6.1400.6140.28090.7963.54154.330.20020.2215.4235.64
8.2800.8280.370102.4767.43169.900.28020.9916.3037.29
10.1001.0100.450110.6170.92181.530.34022.2416.4138.65
12.2601.2260.550118.8075.26194.060.41023.7316.5040.23
Table 4. Calculated predicted intermediate Hg(II) concentration, c1 and minimum masses of NZ and SZ with 99.9% Hg(II) removal efficiency in two-stage counter-current flow sorption system, based on different selected initial Hg(II) concentrations at a constant volume of 1 L.
co
[mmol/L]
c2 × 102
[mmol/L]
NZSZ
c1
[mmol/L]
mtotal
[g]
c1
[mmol/L]
mtotal
[g]
0.4600.0460.02538.320.01614.65
1.0000.1000.05547.420.03615.37
1.9500.1950.10857.300.07016.14
3.0000.3000.16965.030.11016.78
4.0600.4060.23171.310.15117.33
5.1500.5150.29676.840.19517.86
6.1400.6140.35781.330.24317.88
8.2800.8280.49189.920.32919.28
10.1001.0100.60896.460.41420.09
12.2601.2260.752103.530.52021.07
Table 5. The kinetic parameters and error analysis for Hg(II) sorption on NZ and SZ.
Kinetic Model/ParametersNZSZ
co [mmol/L]
qe [mmol/g]
3.941
0.176
6.085
0.235
7.917
0.277
5.982
0.542
8.166
0.727
10.164
0.859
Pseudo-first order model (PFO)
qm [mmol/g]
k1 [1/min]
r2
RMSE
χ2 × 10³

0.157
0.018
0.899
0.019
2.205

0.213
0.018
0.952
0.019
2.353

0.248
0.016
0.945
0.025
3.414

0.504
0.020
0.977
0.033
2.888

0.658
0.020
0.950
0.060
7.326

0.773
0.017
0.946
0.075
9.522
Pseudo-second order model (PSO)
qm [mmol/g]
k2 [g/(mmol∙min)]
r2
RMSE
χ2 × 10⁴

0.171
0.138
0.961
0.013
5.428

0.234
0.097
0.985
0.010
3.060

0.273
0.073
0.981
0.014
6.697

0.547
0.048
0.992
0.018
1.604

0.718
0.035
0.985
0.032
1.182

0.849
0.025
0.982
0.043
1.637
Elovich model
αE [mmol/(g·min)]
βE [g/mmol]
r2
RMSE
χ2 × 10⁴

0.016
37.736
0.989
0.017
7.925

0.017
26.247
0.982
0.011
4.717

0.018
22.523
0.979
0.019
7.637

0.050
11.507
0.971
0.033
30.080

0.063
8.718
0.980
0.026
19.020

0.062
7.236
0.972
0.030
14.230
Weber-Morris intra-particle
diffusion model
kWM1 [mmol/(g∙min1/2)]
DWM1 × 107 [cm2/min]
I
RC [%]
R2
kWM2 × 108 [mmol/(g∙min1/2)]
DWM2 [cm2/min]
R2


0.009
2.563
0.023
3.927
0.962
0.008
2.445
0.976


0.019
6.743
0.007
3.016
0.968
0.006
6.047
0.976


0.017
4.165
0.009
3.140
0.973
0.007
5.879
0.986


0.058
1.236
0.038
7.046
0.994
0.018
1.126
0.987


0.050
5.129
0.066
9.101
0.999
0.020
8.403
0.986


0.040
2.398
0.084
9.828
0.994
0.016
3.617
0.976
Double exponential model
qm [mmol/g]
kB1 [1/min]
B1 [mmol/L]
kB2 × 103 [1/min]
B2 [mmol/L]
r1 × 103 [mmol/(g∙min)]
r2 × 104 [mmol/(g∙min1/2)]
r × 103 [mmol/(g∙min1/2)]
RF [%]
SF [%]
r2
RMSE
χ2∙103

0.175
0.039
0.552
3.447
1.181
2.153
4.071
2.560
31.852
68.148
0.997
0.660
3.684

0.236
0.048
1.074
3.648
1.249
5.155
4.556
5.611
46.233
53.767
0.995
0.717
7.666

0.277
0.059
1.006
3.738
1.683
5.935
6.291
6.564
37.412
62.588
0.994
0.194
2.757

0.514
3.454
0.854
6.259
4.286
294.972
26.830
297.655
16.615
83.385
0.991
0.018
1.542

0.693
3.694
1.622
8.421
5.309
599.167
44.710
603.638
23.402
76.598
0.982
0.033
1.711

0.830
3.671
1.935
8.446
6.360
710.339
53.720
715.711
23.327
76.673
0.985
0.036
1.003
Vermeulen’s approximation
qm [mmol/g]
DV × 107 (cm2/min)
r2
RMSE
χ2 × 10⁴

0.176
5.391
0.987
0.119
1.485

0.235
5.981
0.988
0.162
1.134

0.277
6.352
0.993
0.185
1.008

0.542
5.677
0.992
0.398
0.541

0.727
6.801
0.992
0.519
0.726

0.858
8.184
0.994
0.598
0.857
Table 6. Calculated predicted t1, t2 and total contact time (t1 + t2) based on predefined optimal NZ masses to achieve 99.9% removal efficiency at a constant volume of 1 L for two-stage cross-current flow batch reactor.
co
[mmol/L]
c1
[mmol/L]
c2 × 102
[mmol/L]
m1
[g]
m2
[g]
mtotal
[g]
t1
[min]
t2
[min]
t1 + t2
[min]
0.4600.0210.04641.5532.0673.6122.719.4232.13
1.0000.0450.10052.2038.7590.9520.679.1729.84
1.9500.0900.19562.2547.43109.6819.818.4428.25
3.0000.1400.30070.4853.76124.2418.878.0626.93
4.0600.1900.40677.5158.43135.9417.947.8625.80
5.1500.2580.51580.0766.60146.6718.716.9825.69
6.1400.2800.61490.7963.54154.3315.857.9523.80
8.2800.3700.828102.4767.43169.9014.298.0222.31
10.1000.4501.010110.6170.92181.5313.447.9421.38
12.2600.5501.226118.8075.26194.0612.737.7420.46
Table 7. Calculated predicted t1, t2 and total contact time (t1 + t2) based on predefined optimal SZ masses to achieve 99.9% removal efficiency at a constant volume of 1 L for two-stage cross-current flow batch reactor.
co
[mmol/L]
c1
[mmol/L]
c2 × 102
[mmol/L]
m1
[g]
m2
[g]
mtotal
[g]
t1
[min]
t2
[min]
t1 + t2
[min]
0.4600.0160.04614.3514.4128.7773.4336.56109.99
1.0000.0340.10015.5014.6530.1571.6535.86107.51
1.9500.0660.19516.5415.0931.6370.7135.33106.04
3.0000.1000.30017.6415.1932.8367.7037.11104.81
4.0600.1400.40617.8815.9933.8769.0134.01103.02
5.1500.1700.51519.3415.4834.8261.6338.47100.10
6.1400.2000.61420.2215.4235.6458.5240.5999.11
8.2800.2800.82820.9916.3037.2958.3939.5297.91
10.1000.3401.01022.2416.4138.6554.0941.1295.21
12.2600.4101.22623.7316.5040.2349.2842.8192.09
Table 8. Calculated predicted t1, t2, and total contact time (t1 + t2) based on predefined optimal NZ masses to achieve 99.9% removal efficiency at a constant volume of 1 L for two-stage counter-current flow batch reactor.
co
[mmol/L]
c1
[mmol/L]
c2 × 102
[mmol/L]
m1 = m2
[g]
1st Stage
t1
[min]
2nd Stage
t2
[min]
t1 + t2
[min]
0.4600.0250.04638.3222.117.1929.30
1.0000.0550.10047.4220.706.7527.45
1.9500.1080.19557.3019.316.3425.64
3.0000.1690.30065.0318.276.0424.31
4.0600.2310.40671.3117.455.8123.26
5.1500.2960.51576.8416.755.6122.37
6.1400.3570.61481.3316.195.4621.65
8.2800.4910.82889.9215.155.1820.33
10.1000.6081.01096.4614.394.9719.36
12.2600.7521.226103.5313.614.7618.37
Table 9. Calculated predicted t1, t2, and total contact time (t1 + t2) based on predefined optimal SZ masses to achieve 99.9% removal efficiency at a constant volume of 1 L for two-stage counter-current flow batch reactor.
co
[mmol/L]
c1
[mmol/L]
c2 × 102
[mmol/L]
m1 = m2
[g]
1st Stage
t1
[min]
2nd Stage
t2
[min]
t1 + t2
[min]
0.4600.0160.04614.6569.6637.36107.02
1.0000.0360.10015.3771.0334.51105.54
1.9500.0700.19516.1471.4331.67103.10
3.0000.1100.30016.7871.4030.27101.67
4.0600.1510.40617.3370.7929.29100.08
5.1500.1950.51517.8670.6429.45100.09
6.1400.2430.61417.8874.0031.29105.29
8.2800.3290.82819.2867.4628.8696.32
10.1000.4141.01020.0964.6628.1492.80
12.2600.5201.22621.0760.9127.0887.99
Table 10. Comparison of predicted and experimentally obtained values of total removal efficiency obtained for both stages of Hg(II) sorption on SZ in a two-stage cross-current flow batch reactor for selected different initial concentrations.
co
[mmol/L]
c1
[mmol/L]
c2 × 102
[mmol/L]
Total Removal
[%]
Percentage Deviation
[%]
ModelExp.ModelExp.ModelExp.
0.4600.0160.0310.0460.97899.9097.872.03
1.0000.0340.0520.1000.89199.9099.110.79
1.9500.0660.0930.1950.82199.9099.580.32
3.0000.1000.1410.3001.01999.9099.660.24
4.0600.1400.2080.4060.90899.9099.780.12
5.1500.1700.2140.5151.47099.9099.710.19
6.1400.2000.2940.6141.51099.9099.750.15
8.2800.2800.3360.8282.04099.9099.750.15
10.1000.3400.4411.0102.75099.9099.730.17
12.2600.4100.4971.2262.86199.9099.770.13
Table 11. Comparison of predicted and experimentally obtained values of total removal efficiency obtained for both stages of Hg(II) sorption on SZ in a two-stage counter-current flow batch reactor for selected different initial concentrations.
co
[mmol/L]
c1
[mmol/L]
c2 × 102
[mmol/L]
Total Removal
[%]
Percentage Deviation
[%]
ModelExp.ModelExp.ModelExp.
0.4600.0160.0190.0460.95299.9097.931.97
1.0000.0360.0390.1000.85999.9099.140.76
1.9500.0700.0760.1950.94899.9099.510.39
3.0000.1100.1510.3000.96699.9099.680.22
4.0600.1510.1930.4060.71399.9099.820.08
5.1500.1950.2260.5151.64099.9099.680.22
6.1400.2430.2690.6141.32199.9099.780.12
8.2800.3290.3630.8281.93899.9099.770.13
10.1000.4140.4281.0102.20699.9099.780.12
12.2600.5200.5321.2262.43399.9099.800.10
Disclaimer/Publisher’s Note: The statements, opinions and data contained in all publications are solely those of the individual author(s) and contributor(s) and not of MDPI and/or the editor(s). MDPI and/or the editor(s) disclaim responsibility for any injury to people or property resulting from any ideas, methods, instructions or products referred to in the content.

