Article

Land Use/Land Cover Change Detection and NDVI Estimation in Pakistan’s Southern Punjab Province

1
School of Agricultural Engineering, Jiangsu University, Zhenjiang 212013, China
2
School of Energy & Environment, Power Engineering & Engineering Thermophysics, Southeast University, Nanjing 210009, China
3
Department of Earth Sciences, Faculty of Sciences and Techniques, Abdelmalek Essaadi University, Tangier 90000, Morocco
4
Department of Agriculture, Nutrition and Human Ecology, College of Agriculture and Human Sciences, Prairie View A & M University, Prairie View, TX 77446, USA
5
Department of Environmental Sciences, COMSATS University Islamabad, Vehari Campus, Islamabad 61100, Pakistan
6
Agricultural Research, Education and Extension Organization, Agricultural Engineering Research Institute, Karaj P.O. Box 31585-845, Alborz, Iran
7
School of Transportation, Southeast University, Nanjing 210009, China
8
Agricultural Engineering Department, Faculty of Agriculture, Mansoura University, Mansoura 35516, Egypt
*
Author to whom correspondence should be addressed.
These authors contributed equally to this work and shared first authorship.
Sustainability 2023, 15(4), 3572; https://doi.org/10.3390/su15043572
Submission received: 11 January 2023 / Revised: 7 February 2023 / Accepted: 14 February 2023 / Published: 15 February 2023

Abstract

:
Land use/land cover (LULC) changes are among the most significant human-caused global variations affecting the natural environment and ecosystems. Pakistan’s LULC patterns have undergone huge changes since the 1900s, with no clear mitigation plan. This paper aims to determine LULC and normalized difference vegetation index (NDVI) changes as well as their causes in Pakistan’s Southern Punjab province over four different periods (2000, 2007, 2014, and 2021). Landsat-based images of 30 m × 30 m spatial resolution were used to detect LULC changes, while NDVI dynamics were calculated using Modis Product MOD13Q1 (Tiles: h24 v5, h24 v6) at a resolution of 250 m. The iterative self-organizing (ISO) cluster method (object meta-clustering using the minimal distance center approach) was used to quantify the LULC changes in this research because of its straightforward approach that requires minimal human intervention. The accuracy assessment and the Kappa coefficient were calculated to assess the efficacy of results derived from LULC changes. Our findings revealed considerable changes in settlements, forests, and barren land in Southern Punjab. Compared to 2000, while forest cover had reduced by 31.03%, settlement had increased by 14.52% in 2021. Similarly, forest land had rapidly been converted into barren land. For example, barren land had increased by 12.87% in 2021 compared to 2000. The analysis showed that forests were reduced by 31.03%, while settlements and barren land increased by 14.52% and 12.87%, respectively, over the twenty year period in Southern Punjab. The forest area had decreased to 4.36% by 2021. It shows that 31.03% of forest land had been converted to urban land, barren ground, and farmland. Land that was formerly utilized for vegetation had been converted into urban land due to the expansion of infrastructure and the commercial sector in Southern Punjab. Consequently, proper monitoring of LULC changes is required. Furthermore, relevant agencies, governments, and policymakers must focus on land management development. Finally, the current study provides an overall scenario of how LULC trends are evolving over the study region, which aids in land use planning and management.

1. Introduction

Land is a vital component of the natural environment and ecosystem worldwide [1,2]. However, its resources are limited due to population and agricultural growth demands [3,4,5]. Land cover (LC) refers to the physical properties of the earth’s surface that are either natural or man-made, such as water bodies and vegetation cover [6]. On the other hand, land use (LU) refers to human activity on the earth’s surface, such as infrastructure construction and agricultural cropping [7,8]. In recent years, human activities have significantly impacted land use/land cover (LULC) [9,10,11,12,13,14]. In addition, LULC investigation has the potential to greatly impact natural resource management [15]. In recent years, accurate and sufficient information regarding LULC has become vital for determining the social, economic, and environmental repercussions of such changes and for understanding those repercussions [16,17,18].
Nowadays, rapid urban population growth strains urban infrastructure, resulting in a low people-to-land ratio and, as a result, land degradation [19]. Recently, it has become necessary to evaluate changes in LULC to carry out appropriate planning and ensure natural resources are protected in various ways by utilizing geospatial technology [20]. Since LULC is an essential and dynamic component for understanding the links between human activities, it is also required to promote ecological change [21]. LULC change has become a crucial component of the current research for monitoring ecological changes and natural resources’ management [22,23].
The LULC change analysis has been found to address issues such as changes in environmental services, urban growth, and watershed features. These and other research areas have been supported by evidence that LULC change analysis has played a significant role in addressing these issues [24,25,26]. LULC change detection is extremely important for achieving the most thorough understanding of the connections and dynamics between natural processes and human activities [27,28]. LULC change analysis has also been utilized in research on LULC changes effects caused by suburban and urban expansion, natural disasters, and insect infestations on plant cover [29,30,31,32].
In the fields of hydrometeorology, climate change, and the environment, remote sensing (RS) and geographic information system (GIS) have been applied to a variety of different purposes [33,34]. While RS provides high-resolution spatial data, GIS offers distinct tools for the more effective management of the environment and ecosystems [35,36]. Spatial studies of urban patterns, planning, and variation at global, regional, and local scales have benefitted in recent years from collecting various information from RS data. This information was collected and analyzed using RS data over several years [37,38]. In addition, RS data enabled local environmental studies as well as LULC change management and protection at the global, regional, and local scales [39]. Some techniques used and applied to observe LULC changes include RS data, cross-correlation analysis, image differencing, post-classification comparison (PCC), object pixel-based classification in LULC change mapping, and image fusion-based LULC change detection [40,41]. Utilizing multi-spectral RS data, the LULC change analysis is a technique that is frequently utilized to quantify LULC changes [42]. Multi-spectral and multi-temporal RS satellite data have provided several research opportunities, including investigating LULC patterns [43]. Several Landsat images, including those from the Landsat Operational Land Imager (OLI), Thermal Infrared Sensor (TIRS), Enhanced Thematic Mapper Plus (ETM+), Thematic Mapper (TM), and Multi-Spectral Scanner (MSS), have been used to study LULC changes [44,45]. These images can also provide regular crop information and different agriculture or environmental indices [46,47].
Scientists around the globe are interested in assessing LULC patterns and change detection because they recognize the land resources’ significance for environmental sustainability [48,49,50,51,52,53]. Moreover, LULC transformation becomes more problematic in unplanned, dynamic locations such as urban settlements in developing countries [54]. Land cover change patterns’ examination over the past 30 years and future land use change prediction are required to understand how LULC change affects the Earth’s surface [55]. Satellite imaging and remote sensing data are typically the primary sources of investigating LULC trends and changes at a larger scale [56,57]. A few researchers have examined LULC variations in different parts of Pakistan [47,48,58]. In contrast, LULC change varies with time, geographical location, slope, and altitude. Using the greatest likelihood approach and Landsat data, Hussain et al. [47] discovered a 4.5% increase in settlements and a decrease in vegetation cover area between 2000 and 2020 in the Okara district of Punjab, Pakistan. Khan et al. [58] found vegetation cover decreased by 7.17% between 1990 and 2019 in the Khyber Pakhtunkhwa (KPK) districts of Mardan and Charsadda, Pakistan. In contrast, barren land and urban development increased by 5.5% and 2.23%, respectively. Another study by Khan et al. [48] determined that a vast area of grassland and agricultural land in Islamabad, Pakistan, was replaced by barren land between 1993 and 2018 when it was examined using Landsat images.
In the past few years, the normalized difference vegetation index (NDVI) has been generally used for defining the spatiotemporal properties of LULC [31,59]. The polar-orbiting Moderate Resolution Imaging Spectroradiometer sensor (MODIS) makes monitoring and assessing vegetation and environmental indicators possible. Advanced Very-High-Resolution Radiometer (AVHRR) sensor data cannot match the spatial and radiometric resolution of MODIS-derived data, which results in an improved radiometric, spatial, and spectral illustration of surface vegetation conditions [60,61]. The NDVI time series is significant among the frequently used datasets in monitoring vegetation changes [62,63,64].
Land use assessment, land development, and ecological sustainability at all scales—rural, urban, and regional—require regular updates to the LULC. Climate change regularly impacts farmers in Pakistan, such as high or low temperatures, droughts, and floods (e.g., recent flood, August–September, 2022) because agriculture is their sole source of income. Due to poor LULC management over the past few years, Pakistan has seen a significant fluctuation in LULC trends [65]. More than 39 million people live in southern Punjab, the most productive agricultural area. It is well-known for its natural beauty and fertile farmland where various crops are grown. It comprises 16 districts (Bahawalnagar, Bahawalpur, Bhakkar, Dear Ghazi Khan, Jhang Khanewal, Layyah, Lodhran, Multan, Muzaffargarh, Pakpattan, Rahimyar Khan, Rajanpur, Sahiwal, Toba Tek Singh, Vehari). District-wise LULC studies exist in the literature. Hussain [66] determined LULC changes in Lodhran, Multan, and Vehari districts using Landsat satellite images. Naeem et al. [67] examined LULC detection in the Multan district from 1990 to 2020. The studies of Hussain et al. [68] and Hussain et al. [30] evaluated LULC patterns in Lodhran and Multan districts, respectively. Ahsen et al. [69] investigated LULC change in Multan District. Similarly, LULC change detection was observed in Okara district by Hussain et al. [48]. Hussain et al. [70] recently determined LULC changes in two districts (Multan and Vehari) of South Punjab. Additionally, several researchers conducted an accuracy assessment and used the Kappa coefficient to analyze the findings produced from the satellite images [67,70].
Based on the intensive literature review discussed above, LULC change detection in South Punjab was only analyzed by considering 1–3 districts. To the best of our knowledge, no study is reported in the literature that covers the complete South Punjab, which includes 16 districts. The research region has a wide variety of topography. Dera Ghazi (D.G.) Khan is situated in the area that divides the Indus River from the Koh-e-Suleman mountain range. Muzaffargarh and Layyah are on the eastern bank of the Indus River, whereas D.G. Khan is on the western side. Rahimyar Khan lies on the eastern margin of the Indus River, whereas Multan and Bahawalpur are on the eastern bank of the Chenab River. The districts of D.G. Khan and Muzaffargarh are the most susceptible to severe flooding induced by heavy rains. For instance, Layyah and Multan, located in Sindh Sagar-Doab, a region between the Indus and Jhelum Rivers, feature deserts with a hot temperature. In the last several decades, the southern part of Punjab has faced both drought risks and floods, making it the most at risk area in the country. The current study used the latest data (satellite images) from 2000 to 2021 to identify the LULC change. Most studies in the literature used supervised classification methods to identify LULC changes over the studied region. Alternatively, iterative self-organizing (ISO) cluster, an unsupervised classification method, was chosen in this study for LULC classification. The ISO cluster method was selected because of its straightforward approach that requires minimal human intervention. Thus, the objectives of the current study are to:
(1)
Create LULC maps for Southern Punjab, Pakistan, which includes 16 districts, for the years 2000, 2007, 2014, and 2021;
(2)
Identify LULC changes between 2000 and 2021;
(3)
Calculate the normalized difference vegetation index (NDVI) to examine vegetation status.

2. Study Area and Dataset

2.1. Study Area

South Punjab’s history and politics are intertwined. Figure 1 depicts the South Punjab region, which includes 16 districts. This region has been inhabited since at least 200 BC. This region has long been significant in terms of geography and politics. South Punjab provides most of Punjab’s economic resources. In total, 39.14 million people call South Punjab home. The average household size in the region is 6.56. People in urban regions comprise 23% of the total population, while those in rural areas represent 77%. A total of 116,518 km2 (57% of Punjab’s total land) and 36% of its population dwell in the South Punjab region (PBS 2022). There is a productive plateau with agricultural fields watered by canals, tube wells, and rain, although most of the terrain is flat. It is just on the brink of the monsoon climate, which is why it is so popular. Summers are hot and humid, yet the weather varies drastically from summer to winter. A typical summer day on plains is 30 degrees Celsius, whereas a typical winter day is 10 degrees Celsius. The annual average rainfall is 22.18 millimeters [30,69].
Agriculture is the province of Punjab’s primary source of income and employment, notably in its southern portion. Historically, the majority of the province was desert and unsuitable for settlement. However, once a massive network of irrigation canals utilizing the water of the Indus tributaries was developed in the early 20th century, its nature changed. The entire province was included in the settlement area, which had previously only included the northern and northeastern portions. As a result, nearly three-quarters of the province’s fertile land is now irrigated. Cotton and wheat are the most important crops. Fruits, vegetables, oilseeds, pulses, millet, rice, sugarcane, and corn are among the planted crops (maize). There is a massive production of cattle and poultry. Punjab is home to over half of Pakistan’s population as well as the majority of the country’s major cities, including Lahore, Faisalabad, Rawalpindi, Multan, and Gujranwala. Due to high population density, the geographical area of this province is continually changing, including the loss of huge agricultural fields, water bodies, and forest regions for urban expansion and development [71].

2.2. Data Collection

Landsat-based images of 30 m × 30 m spatial resolution covering the Southern Punjab were obtained for the year 2000 of Landsat 5 (TM), 2007 of Landsat 5 (TM), 2014 of Landsat 8 (OLI-TIRS), and 2021 of 8 (OLI-TIRS). These images were obtained from the United States Geological Survey (USGS) website (https://earthexplorer.usgs.gov, accessed on 27 October 2022) to determine LULC changes (January 2000–December 2021). The images were used for the months of August, October, and November because in these months, Landsat images were found to be proper and precise. In addition, cloud-free Landsat images were selected for the data collection to ensure accuracy. Alternately, if clouds fully or partly obscure the field, the data will not be correct. Table 1 provides summary of collected Landsat data.
MODIS is the instrument aboard the NASA’s Terra and Aqua satellites. NASA launched Terra MODIS and Aqua in December 1999 and May 2002, respectively. MODIS views the entire Earth’s surface every one to two days, obtaining data in 36 spectral bands with wavelengths ranging from 0.4 to 14.385 μm. The MODIS imagery has a spatial resolution of 250 m, 500 m, and 1 km. Over twenty years, Modis Product MOD13Q1 (tiles: h24 v5, h24 v6) at resolution of 250 meters was obtained to map and monitor the NDVI changes (January 2000–December 2021). As a result, 16 sets of MODIS images were obtained from the United States National Aeronautics and Space Administration’s (NASA’s) website (https://lpdaac.usgs.gov/tools/data-pool/, accessed on 14 October 2022). Table 2 provides a description of MODIS data.

3. Adopted Methodology

3.1. Data Pre-Processing

Data are commonly used to pre-process Landsat images for radiometric correction, layer stacking, and mosaicking using software ERDAS imagine 15 [72]. Image enhancement algorithms are generally used to remove the stripping lines in the images of the ETM+ as well as to enhance the quality of an image, and a new enhanced image is produced using the software ERDAS imagine 15 [73]. Minimum mappable unit (1:25,000) was kept during each step of various LULC classifications and maps. The subsetting process was conducted using the extract by mask tool in Arc GIS 10.8 software of the image based on the study area. Several steps were performed, including composite band, copy raster, mosaic to new raster, and extract by mask to pre-process satellite images. This procedure was carried out using ArcMap. The copy raster has image backgrounds that have been removed, leaving a transparent background. Furthermore, an image enhancement technique was chosen for histogram equalization. For Landsat images, an image mosaic tool was used to create a new raster, which was used to create a single accurate research area aerial.

3.2. Data Classification

For LULC classification, an iterative self-organizing (ISO) cluster, an unsupervised classification method, was chosen. ISO cluster method, known as ISO Data Analysis Techniques A (ISODATA), is frequently used in remote sensing applications. It is based on object meta-clustering using the minimal distance center approach. Indeed, it was selected in this research because of its straightforward approach that requires minimal human intervention [74,75]. The ISO cluster classification requires parameters such as the initial clustering center and the number of categories. For our research, LULC classification was achieved with a 0.97 convergence threshold and 50% iterations [45]. To assist the ISO algorithm, more results were refined by seeking farmers’ opinions considering various LULC classes in the study area. Furthermore, two visual interpretations of satellite images were performed: false-color composite and natural color. A “natural” rendering is provided by a “false-color composite”, for example, for Landsat 5, it is provided by 7, 4, and 2 bands. Tamouk et al. [76] characterized healthy vegetation as vibrant green, grasslands as green, barren soils as pink, oranges and browns as dry forest areas, water as blue, and urban areas as varying concentrations of magenta. Bands 4, 3, and 2 of Landsat 8 provide natural color repetitions similar to what the human eye perceives. Unhealthy vegetation appears darker, whereas desirable growth is green. Water seems gray or black, while urban features are pale and white [76,77]. Eva et al. [78] investigated the effects of combining multiple land cover types into a single land cover class. Within the scope of this research, several distinct categories were distinguished, including water, forests, cropland, barren lands, and settlements. Equation (1) was used to find the area of each class, and Equation (2) was utilized to compute the area percentage.
Area   ( ha ) = ( Counted   Pixels ) × ( Pixel   size ) 2 10 4
Area   ( % ) = Area Total   Area × 100

3.3. Post-Classification Change Detection

This study used ArcGIS 10.8 and Google Earth Pro tools to analyze and classify satellite images from 2000 to 2021 based on satellite and actual geographical land utilization to detect LULC changes. For this purpose, we conducted accuracy assessments to evaluate the classified images and LULC changes.

3.4. Accuracy Assessment

The classification accuracy of satellite images can be assessed by calculating overall accuracy and Kappa Coefficient (K). The overall accuracy can be determined by estimating user and producer accuracy [67,70]. User accuracy is used to quantify the probability that a classified pixel matches the land cover class of its actual geographical position. The classification accuracy of actual land cover types is evaluated by producer accuracy, which is quantified by gap errors. About 50 random ground control points (GCPs) were created for each year, i.e., 2000, 2007, 2014, and 2021, and the minimum allowance distance set was 30 m for each class. The total accuracy of the classification of satellite images is determined by comparing how each pixel is classed against the actual land cover produced from their combined baseline data [79,80,81]. The coefficient K was utilized as an indicator of consistency between predicted results and actuality [80] or to determine if the numbers included in an input dataset reflect a considerably best improvement [82].
For example, in 2000, in the classified satellite image, water body’s correct points were 9; the row total was 10 and the column total was 9. The user and producer accuracies were estimated to be 90% and 100%, respectively. On the other hand, the total number of samples was 50, total number of correct samples was 44, and errors were 6 in the classified satellite image of 2000. The overall accuracy and coefficient K were found to be 88% and 85%, respectively. The calculation of accuracy assessment indices for the complete study period (2000–2021) is presented in the Results section.

3.5. Normalized Difference Vegetation Index (NDVI)

The spectral features of vegetation, such as its ability to absorb visible light and photosynthetic energy, are considered in NDVI assessment. NDVI is a plant health assessment based on how the plant absorbs and reflects light at specific frequencies. The NDVI is an excellent indicator of vegetative growth conditions and vegetative cover degree. If a region is vegetated, its NDVI value is a positive number that increases as the vegetation cover improve [83].
The methodology of current study to perform pre- and post-processing of dataset is shown in Figure 2. MODIS data were obtained in HDF (Hierarchical Data Format). Subsequently, it was reprojected from the original sinusoidal projection to geographic projection (WGS84 datum). Then, stacking, mosaicking, and subsetting to AOI were performed in ArcMap 10.8. Likewise, NDVI matrices were calculated using an ArcMap spatial analysis tool (using a raster calculator) according to Equation (3). After processing all the data, maps for the years 2000, 2007, 2014, and 2021 were developed.
NDVI = NIR RED NIR + RED
where NIR is the near-infrared band, and RED is the red band. These indices have characteristic values between −1 and 1 [84]. NIR is reflected by leaves in plants, while chlorophyll absorbs it. If NDVI is high, it indicates that vegetation is abundant. Alternatively, if NDVI is low, there is little or no vegetation potential. Extremely low NDVI values (below 0.1) correlate to bare rock, sand, or snow regions. High levels imply temperate and tropical rainforests (0.2 to 0.3), whereas moderate values depict shrubs and grasslands (0.6 to 0.8).

4. Study Results

4.1. LULC Change Analysis

The ISO cluster unsupervised classification technique was used to generate the LULC map presented in Figure 3, which covers 2000–2021 and includes intervals of seven years. Table 3 and Figure 3 and Figure 4 exhibit the results of the performed LULC adjustments. In 2000, water accounted for 2.06% of the total area. The fall in water area was approximately 1.95% in 2007, but by 2014, it was increased to 3.63%. Since then, it has undergone a substantial decrease, and as of 2021, it only accounted for 3.081% of the entire area (Table 3 and Figure 3). The total area covered by forest shrunk by 31.03% between 2000 and 2021. According to Table 2, over the first seven years, it was about 35.39% of the total land area, but that rate plummeted to approximately 4.36% during the subsequent thirteen years.
On the other hand, despite the rapid growth of settlements, only 8.80% of the total land area was occupied by them in 2000. In 2007, an increase of around 8.90% in settlement led to a total of 17.71%. It increased by 6.81% over the next seven years and then declined by 1.20% over the following seven years, for a total growth of 23.32% in the area in 2021. After twenty years, the amount of land occupied by settlements increased to about 14.52%. Over the past 20 years, barren land appears to have rapidly increased. In 2000, 33.15% of the barren land was unusable for agriculture. After seven years, the figure reached 41.39% in 2007. The subsequent seven years showed a decline of 0.84%, while the subsequent seven years showed a growth of 5.47%; this accounted for 46.02% of the entire area. Table 3 makes it easy to understand how the LULC has been modified over the last 20 years across the whole region. It can be perceived from Table 3 that following a period of 20 years, the changes in the areas of water, cropland, forest, settlements, and barren land were estimated to be 1.02%, 2.63%, −31.03%, 14.52%, and 12.87%, respectively. In addition, Figure 4 shows LULC dynamics from 2000 to 2021 for Southern Punjab, Pakistan, which also supports and validates our results mentioned above.
Figure 5 and Table 4 indicate LULC area transfer change in the studied area from 2000 to 2021. From 2000 to 2007, water, cropland, and forest decreased considerably by −131.0 km2, −14,505.7 km2, and −7034.1 km2, respectively, while the areas of settlements (11,259.1 km2) and barren land (10,411.6 km2) were significantly raised. Moreover, a fall in forest (−29,143.5 km2) and barren land (−1067.2 km2) was observed in 2007–2014 (Table 4). From 2014–2021, areas of water (−688.7 km2), cropland (−1591.0 km2), forest (−3055.2 km2), and settlements (−1477.9 km2) were drastically reduced and shifted into barren land (6813.2 km2). The net changes in water, cropland, forest, settlements, and barren land from 2000 to 2021 were found to be 1303.1 km2, 3370.9 km2, −39,232.8 km2, 18,401.5 km2, and 16,157.6 km2, respectively. The dynamics as mentioned above (%) in LULC for each class can also be observed in Figure 5.

4.2. Accuracy Measurement
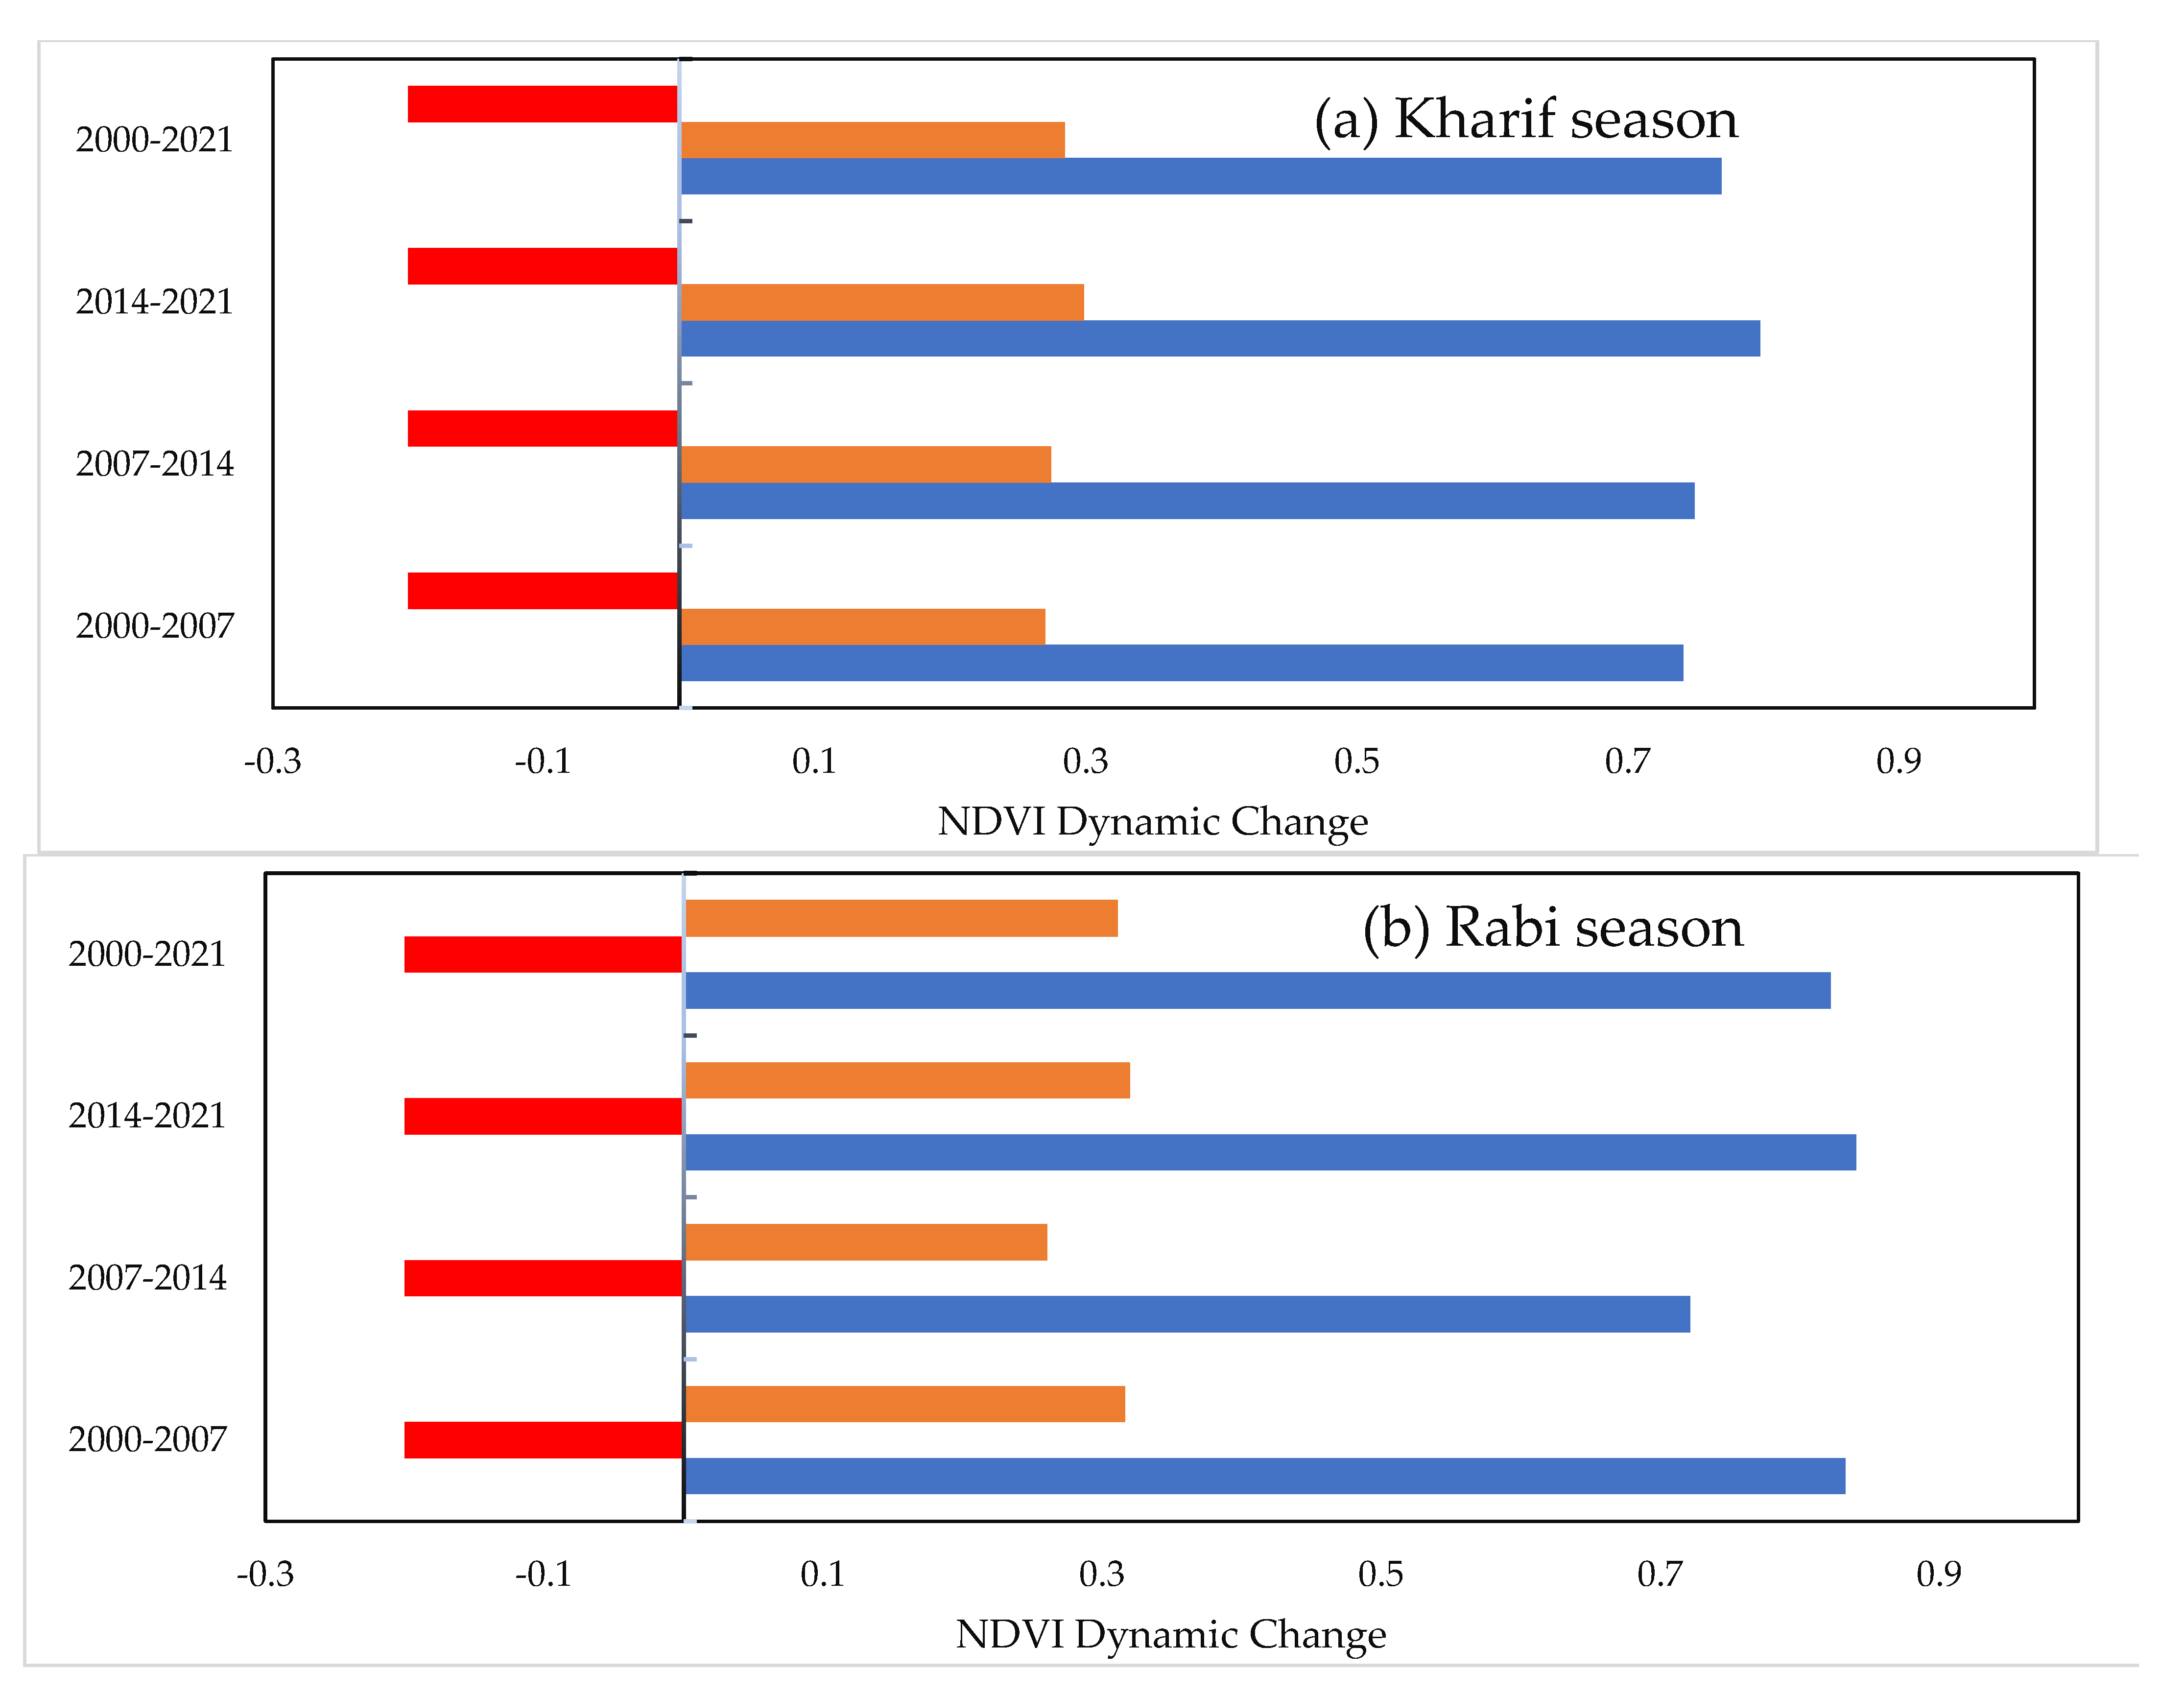
Data accuracy assessment is an important part of processing and analyzing remote sensing data. It determines the veracity of the produced data for a user [85]. The user, producer, overall accuracies, and coefficient K were calculated for each classification (a = water; b = cropland; c = forest; d = settlements; e = barren land) from the years 2000 to 2021 to investigate the quality of satellite images used in this study. The calculation of accuracy assessment indices for the complete study period (2000–2021) is presented in Table 5.

4.3. NDVI Analysis

Figure 6 and Figure 7 show NDVI changes in 2000, 2007, 2014, and 2021 during the Rabi and Kharif seasons. In 2000, NDVI values ranged from −0.2 to +0.74. They altered in 2014 (minimum −0.2 and highest +0.79). NDVI values varied throughout 2021 (−0.2 to +0.76), as observed in Table 5. The most productive areas have the highest NDVI values, such as vegetation and forest. However, lower NDVI values indicate less productive regions, such as barren land, water, and towns. Forested areas have a larger NDVI value than barren land, which may influence the vegetation greenness observed by satellites throughout the study region. It can be observed in Table 5 that the NDVI for the Rabi seasons in 2014 was found to be considerably different from the NDVI in 2000. On the other hand, the NDVI decreased by 0.03% in the Kharif seasons in 2021 compared to 2014 (Table 6). Additionally, Figure 8 indicates the NDVI dynamics for 2000–2021 in Southern Punjab. Figure 8a shows the variation in the NDVI for the Kharif season, while seasonal variation during the Rabi season can be found in Figure 8b. It can be perceived from Figure 8 that blue indicates a higher NDVI value; the orange color shows a moderate value, while the lowest NDVI value is displayed by red. The NDVI guides the partition of distinct classes based on a single performance in conditions of crest trends and phonological periods inside a particular agro-ecosystem.
According to Ahmad [86], the NDVI is a useful vegetation indicator because it is steady enough to allow detailed comparisons of seasonal and inter-annual variations in plant growth and activity. With the NDVI, various sources of multiplicative noise (irradiance variations, cloud shadows, air attenuation, and some topography changes) are reduced because of its rationing approach. The NDVI is used to determine the vegetation variations [68]. Since there is less water available, vegetative areas have shrunk significantly. With respect to these changes, our natural ecology and biodiversity have suffered, and additional growth might result in various environmental problems. The enhancement of agricultural production could improve the lives of our inhabitants [30,70].

5. Discussion

The livelihoods of rural farmers totally depend on agricultural activities that directly depend on the natural temperature, but changes in natural temperature cause less rain, a shortage of irrigation water, and drought that directly affect the agricultural activities and agricultural yield. The Southern Punjab faces rising temperature, less irrigation water, and low rainfall. Farmers are aware of these climatic changes and are adapting strategies to cope with the effects but require support from government. The results revealed that the vegetation fraction gives a more grounded positive connection with the NDVI, but settlements and barren land areas show a negative relationship between the NDVI and LULC during these 21 years. Several studies have been conducted at the local, national, and global levels on LULC change. Most of these research studies have focused on the developed areas of China, Europe, and the United States [16,28,87,88]. Pakistan is one of the most significant exceptions to the fact that many Asian countries, especially at the local and national levels, have not yet been thoroughly studied [47]. These researches seriously influence the world’s capacity to manage and monitor Earth’s resources properly.
South Punjab is a major agricultural region, contributing much to the national economy. It is the primary economic driver in Punjab. In light of increasing competition for scarce water resources on a national and regional scale and the challenges posed by climate change, there is presently a heated dispute over the path Punjab agriculture should pursue to revitalize and contribute to the country. Khalil [89] investigated LULC classification for the Okara district of Pakistan. LULC changes across time were determined using a mix of SAR (Synthetic Aperture Radar) and supervised classification methods. Since this study was completed in 2016, it has been demonstrated that four separate LULC classes may be categorized as cropland, settlements, water, and barren land. Researchers have generated LULC maps at the global, national, and local levels for various environmental purposes in recent years.
Due to its geographical location and topographical characteristics, the study region is particularly susceptible to natural disasters [90]. Settlements, vegetation, agriculture, and water sources changed significantly throughout the study duration (2000–2021). For the most part, there were very few human settlements when the area was first occupied. Rapid population expansion and urbanization have led to increased settlements, such as housing developments, structures, and highways, among other things [16,91,92].
Hadeel et al. [93] used supervised classification to show how remote sensing and GIS can be used to detect changes in LULC. This methodology was used in Northern Australia to map land cover and compare objective-oriented and pixel-based assessment strategies [94].
However, several articles have described the use of supervised classification to detect land cover changes, including in Tirupati, India [95]; Egypt’s western Nile delta [56]; and South America [78]. Recently, Naeem et al. [67] and Hussain et al. [70] successfully identified LULC changes and NDVI estimation in Southern Punjab using the districts of Multan, Lodhran, and Vehari. Our study used 16 districts (Figure 1) of Southern Punjab to examine more accurate LULC changes and vegetation. The current study classified LULC into five categories and changes detected from 2000 to 2021 for each class, water, cropland, forest, settlements and barren land, were found to be 1.02%, 2.63%, −31.03%, 14.52%, and 12.87%, respectively. The LULC change detection was found to be of a similar pattern to those of the studies of Naeem et al. [67] and Hussain et al. [70] with less variation due to periodic differences. These studies show that rapid LULC changes are taking place at national and local levels in Pakistan.
The rapidly increasing population and declining rate of agricultural land/per capita is becoming a major concern for food security. Scientifically and systematically documenting LUCC over the past several decades is important for understanding the consequences of these changes for human welfare [96,97,98,99,100,101]. According to the findings of spatial and non-spatial studies of forest area changes, LULC has been influenced by various causes during the time [102,103,104,105]. Poverty, overcrowding, illegal deforestation, agricultural land expansion, and a lack of effective legislation and policy execution have all contributed to the decline in forest cover [106,107]. Our study showed that the forest area in Southern Punjab reduced by −31.03% between 2000 and 2021. As a result of the severe shrinkage in agricultural land [108], barren land has risen sharply from 2000 to 2021 and change detection was found to be 14.52%. Cropland declined by 11.47% between 2000 and 2007 but expanded by 14.10% between 2008 and 2021. The number of settlements increased by 14.51% between 2000 and 2021. This study indicated that the NDVI improved during the Kharif season from 0.74 to 0.77 and declined during the Rabi season from 0.83 to 0.82 (Table 4 and Figure 5). To better understand cropping trends in the area, it is beneficial to determine crop distribution patterns in terms of crop yield. Seasonal data may be extracted from NDVI time series using thresholds that assume a phonological event that begins when NDVI values exceed a preset threshold [109,110].
In Islamabad’s watershed, Butt et al. [111] investigated LULC changes using supervised classification from 1992 to 2012. According to the literature, there are five types of LULC: vegetative area, urban area, agricultural, aquatic bodies, and bare soil. Furthermore, vegetation and water bodies reduced dramatically from 74.3% to 38.2% compared to metropolitan areas, barren land, and motorways. Hussain et al. [68] reported that cropland and forest conversion to roads and human settlements reduced bare soil and vegetation by 5.2% between 1977 and 2017 in the Lodhran district of Pakistan. Due to rapid urbanization, the district of Lodhran is spreading haphazardly. Many cities’ current infrastructures are being degraded as population growth outpaces the available resources for urban development. These cities have several challenges, including incompatible LU and a poisonous environment. According to Hussain et al. [48], the Okara district’s settlements increased by 3778 hectares (4.5%) between 2000 and 2020. Several factors contribute to the expansion of urban areas; considerable changes have occurred in older urban areas. From 2000 to 2020, Okara district had many LULC changes, with the usage of vegetative land continually decreasing. The LULC changes have a profound influence on the topography and ecology of the study area. Ali et al. [23] revealed that the settlements had grown slower than Multan district’s population area. Migration from rural to urban areas is primarily responsible for the rise in metropolitan areas, which has increased the strain on natural resources and spurred vegetation growth in urban areas. According to Manzoor et al. [112], significant urbanization is taking place in metropolitan areas, leaving an information gap in LULC development at local and regional levels, including in Pakistan. One of the key causes for the weak performance of different regional and urban planning entities has been identified as a lack of technical skills and the inability to precisely, rapidly, and efficiently investigate the growth of urban areas [92].
Our findings suggest that expanding infrastructure and commercial sectors affects vegetated regions. The research findings could be applied in the planning and management sectors to help policymakers work effectively and sustainably. The most significant LULC changes have occurred along routes connecting regions to major and minor cities. This research also found that additional residential areas and associated projects might be built on roadways, including along the Sahiwal, Multan, Bahawalnagar, and Jhang roads. Our findings also indicated that the major cities of Multan, Jhang, DG khan, Sahiwal, and Rajanpur would expand in the next years, resulting in a rise in overpopulation and congestion on the major city roadways. This scenario will have altered, but at the same time, it will have perilous effects in other cities due to linked issues, such as overpopulation, lack of services, traffic congestion, and increased crime. Financial globalization will affect LULC due to the pressure exerted by changing the functionality of the research area and its significance in the biosphere. For current LULC management, federal and state governments must educate and train both proposers and related experts in cutting-edge techniques such as RS and GIS.

6. Conclusions

This study aimed to determine LULC change and estimate the vegetative index (NDVI) from 2000 to 2021 in Southern Punjab. For this purpose, Landsat-based images of 30 m × 30 m spatial resolution covering the studied region were used to determine LULC change for the years 2000 of Landsat 5 (TM), 2007 of Landsat 5 (TM), 2014 of Landsat 8 (OLI-TIRS) and 2021 of 8 (OLI-TIRS), while Modis Product MOD13Q1 (tiles: h24 v5, h24 v6) at a resolution of 250 meters from 2000 to 2021 were used to estimate the NDVI changes in the study region. The result demonstrated that changes in LULC significantly negatively influenced the land and ecology of Southern Punjab. Increased urbanization affects forest depletion. In the study region, the forest cover was reduced from 4,475,612.79 ha (35.39%) in 2000 to 552,331.20 ha (4.36%) in 2021. In 2000, 8.80% of the area was occupied by settlers, but in 2021, that number had climbed to 23.20% in Southern Punjab. According to our findings, forest land was turned into urban land (highways, link roads, commercial land, and residential houses) and the NDVI dynamics from 2000 to 2021 in Southern Punjab varied significantly and land was converted into non-vegetative areas. It was determined that the population increased due to settlement growth, whereas the barren land percentage in the study region increased to 13.13%. Changes in LULC can be attributed largely to an increase in population in rural areas and a subsequent relocation to urban areas. The agricultural sector is primarily focused on obtaining food for the increasing population, which means that governmental capacity is lacking to support mitigation. Providing an appropriate role for agriculture in modern discussions is essential to achieving Southern Punjab’s most significant mitigation potential. Our findings suggest that the development of infrastructure and commercial areas have impacted vegetative regions. This research will assist the government, agencies, and land policymakers in guiding effective land monitoring and policy making.
Various recommendations are given below about the LULC design for future use in Southern Punjab.
According to the current research, rapid population growth and urban road construction will cause the urban area to expand in the coming years. Multiple factors, including overcrowding, traffic pressure, roadworks, and inadequate infrastructure, will change but, equally, will have devastating effects on Southern Punjab. It is suggested that residents be incentivized to construct outside of the city by offering incentives along the Sahiwal, Multan, Jhang, Bahawalpur, and DG Khan roads. Using RS/GIS tools and data, the current LULC map should be revised. This will give stakeholders a consistent and accurate LULC map and contribute to the success of policy employment initiatives. The government should employ the abilities of RS and GIS technology for mapping to provide adequate and reliable spatial information and data that are useful to develop the effective management and monitoring of LULC changes in Pakistan.

Author Contributions

Conceptualization, Y.H. and A.R.; data curation, A.R., N.R.S. and M.Z.; formal analysis, A.R., N.R.S. and S.A.; funding acquisition, Y.H.; methodology, A.R., N.R.S. and M.Z.; project administration, Y.H. and H.D.; software, A.R., N.R.S., S.A. and M.Z.; supervision, Y.H.; validation, R.L.R. and A.E.; visualization, S.A. and R.L.R.; writing—original draft, Y.H. and A.R.; writing—review and editing, R.L.R., S.H., H.D. and A.E. All authors have read and agreed to the published version of the manuscript.

Funding

This research was funded by the Key R & D Program of Jiangsu Provincial Government (BE2021340) and the Priority Academic Program Development of Jiangsu Higher Education Institutions (PAPD-2018-87).

Institutional Review Board Statement

Not applicable.

Informed Consent Statement

Not applicable.

Data Availability Statement

Data are available on reasonable request.

Acknowledgments

We are thankful to the editor and anonymous reviewers for their suggestions to improve the quality of this article.

Conflicts of Interest

The authors declare no conflict of interest.

References

  1. Long, H. Theorizing land use transitions: A human geography perspective. Habitat Int. 2022, 128, 102669. [Google Scholar] [CrossRef]
  2. Roy, P.S.; Ramachandran, R.M.; Paul, O.; Thakur, P.K.; Ravan, S.; Behera, M.D.; Sarangi, C.; Kanawade, V.P. Anthropogenic land use and land cover changes—A review on its environmental consequences and climate change. J. Indian Soc. Remote Sens. 2022, 50, 1615–1640. [Google Scholar] [CrossRef]
  3. Löbmann, M.T.; Maring, L.; Prokop, G.; Brils, J.; Bender, J.; Bispo, A.; Helming, K. Systems knowledge for sustainable soil and land management. Sci. Total. Environ. 2022, 822, 153389. [Google Scholar] [CrossRef] [PubMed]
  4. Hammad, H.M.; Abbas, F.; Saeed, S.; Fahad, S.; Cerdà, A.; Farhad, W.; Bernardo, C.C.; Nasim, W.; Mubeen, M.; Bakhat, H.F. Offsetting land degradation through nitrogen and water management during maize cultivation under arid conditions. Land Degrad. Dev. 2018, 29, 1366–1375. [Google Scholar] [CrossRef]
  5. Sahana, M.; Ahmed, R.; Sajjad, H. Analyzing land surface temperature distribution in response to land use/land cover change using split window algorithm and spectral radiance model in Sundarban Biosphere Reserve, India. Model. Earth Syst. Environ. 2016, 2, 81. [Google Scholar] [CrossRef] [Green Version]
  6. Naz, A.; Rasheed, H. Modeling the Rice Land Suitability Using GIS and Multi-Criteria Decision Analysis Approach in Sindh, Pakistan. J. Basic Appl. Sci. 2017, 13, 26–33. [Google Scholar] [CrossRef]
  7. Romaguera, M.; Vaughan, R.; Ettema, J.; Izquierdo-Verdiguier, E.; Hecker, C.; van der Meer, F. Detecting geothermal anomalies and evaluating LST geothermal component by combining thermal remote sensing time series and land surface model data. Remote Sens. Environ. 2018, 204, 534–552. [Google Scholar] [CrossRef]
  8. Kidane, M.; Tolessa, T.; Bezie, A.; Kessete, N.; Endrias, M. Evaluating the impacts of climate and land use/land cover (LU/LC) dynamics on the hydrological responses of the upper Blue nile in the central Highlands of Ethiopia. Spatial Info. Res. 2019, 27, 151–167. [Google Scholar] [CrossRef]
  9. Chaudhary, S.; Pandey, A.C. Multiple indices based drought analysis by using long term climatic variables over a part of Koel river basin, India. Spat. Inf. Res. 2019, 28, 273–285. [Google Scholar] [CrossRef]
  10. Imran, M.A.; Ali, A.; Ashfaq, M.; Hassan, S.; Culas, R.; Ma, C. Impact of Climate Smart Agriculture (CSA) Practices on Cotton Production and Livelihood of Farmers in Punjab, Pakistan. Sustainability 2018, 10, 2101. [Google Scholar] [CrossRef] [Green Version]
  11. Usman, M.; Liedl, R.; Shahid, M.A.; Abbas, A. Land use/land cover classification and its change detection using multi-temporal MODIS NDVI data. J. Geogr. Sci. 2015, 25, 1479–1506. [Google Scholar] [CrossRef]
  12. Forkel, M.; Carvalhais, N.; Verbesselt, J.; Mahecha, M.D.; Neigh, C.S.R.; Reichstein, M. Trend Change Detection in NDVI Time Series: Effects of Inter-Annual Variability and Methodology. Remote Sens. 2013, 5, 2113–2144. [Google Scholar] [CrossRef] [Green Version]
  13. Cheema, M.; Bastiaanssen, W. Land use and land cover classification in the irrigated Indus Basin using growth phenology information from satellite data to support water management analysis. Agric. Water Manag. 2010, 97, 1541–1552. [Google Scholar] [CrossRef]
  14. Ahmed, J.; Ahmed, M.; Laghari, A.; Lohana, W.; Ali, S.; Fatmi, Z. Public private mix model in enhancing tuberculosis case detection in District Thatta, Sindh, Pakistan. J. Pak. Med. Assoc. 2009, 59, 82. [Google Scholar]
  15. Kantakumar, L.N.; Neelamsetti, P. Multi-temporal land use classification using hybrid approach. Egypt. J. Rem. Sens. Space Sci. 2015, 18, 289–295. [Google Scholar] [CrossRef] [Green Version]
  16. Athick, A.M.A.; Shankar, K.; Naqvi, H.R. Data on time series analysis of land surface temperature variation in response to vegetation indices in twelve Wereda of Ethiopia using mono window, split window algorithm and spectral radiance model. Data Brief 2019, 27, 104773. [Google Scholar] [CrossRef]
  17. Jia, K.; Liang, S.; Wei, X.; Yao, Y.; Su, Y.; Jiang, B.; Wang, X. Land Cover Classification of Landsat Data with Phenological Features Extracted from Time Series MODIS NDVI Data. Remote Sens. 2014, 6, 11518–11532. [Google Scholar] [CrossRef] [Green Version]
  18. Sateesh, K.; Sandip, G. Land Use and Land Cover Mapping using Digital Classification Technique in Tikamgarh District, Madhya Pradesh, India using Remote Sensing. Int. J. Geomat. Geosci. 2011, 2, 519. Available online: https://www.indianjournals.com/ijor.aspx?target=ijor:ijggs&volume=2&issue=2&article=015 (accessed on 21 December 2022).
  19. Sheikh, A.B.; Parvez, S.; Ikram, M.; Baber, H. Land Suitability Assessment for Maize Crop in Okara District using GIS Techniques. Int. J. Life Sci. Res. 2017, 5, 37–44. Available online: https://www.researchpublish.com/upload/book/LAND%20SUITABILITY%20ASSESSMENT-4526.pdf (accessed on 23 December 2022).
  20. Kumar, P.; Husain, A.; Singh, R.B.; Kumar, M. Impact of land cover change on land surface temperature: A case study of Spiti Valley. J. Mt. Sci. 2018, 15, 1658–1670. [Google Scholar] [CrossRef]
  21. Sabagh, A.E.; Hossain, A.; Islam, M.S.; Iqbal, M.A.; Fahad, S.; Ratnasekera, D.; Llanes, A. Consequences and mitigation strategies of heat stress for sustainability of soybean (Glycine max L. Merr.) production under the changing climate. In Plant Stress Physiology; IntechOpen: London, UK, 2020. [Google Scholar] [CrossRef]
  22. Khan, I.; Javed, T.; Khan, A.; Lei, H.; Muhammad, I.; Ali, I.; Huo, X. Impact assessment of land use change on surface temperature and agricultural productivity in Peshawar-Pakistan. Environ. Sci. Pollut. Res. 2019, 26, 33076–33085. [Google Scholar] [CrossRef]
  23. Ali, A.; Khalid, A.; Butt, M.A.; Mehmood, R.; Mahmood, S.A.; Sami, J.; Ali, F. Towards a remote sensing and GIS-based technique to study population and urban growth: A case study of multan. Adv. Rem. Sens. 2018, 7, 245. [Google Scholar] [CrossRef] [Green Version]
  24. Gilani, H.; Shrestha, H.L.; Murthy, M.; Phuntso, P.; Pradhan, S.; Bajracharya, B.; Shrestha, B. Decadal land cover change dynamics in Bhutan. J. Environ. Manag. 2015, 148, 91–100. [Google Scholar] [CrossRef]
  25. Sultana, S.R.; Ali, A.; Ahmad, A.; Mubeen, M.; Zia-Ul-Haq, M.; Ahmad, S.; Ercisli, S.; Jaafar, H.Z.E. Normalized Difference Vegetation Index as a Tool for Wheat Yield Estimation: A Case Study from Faisalabad, Pakistan. Sci. World J. 2014, 2014, 1–8. [Google Scholar] [CrossRef] [PubMed] [Green Version]
  26. Tan, K.C.; Lim, H.S.; MatJafri, M.Z.; Abdullah, K. Landsat data to evaluate urban expansion and determine land use/land cover changes in Penang Island, Malaysia. Environ. Earth Sci. 2010, 60, 1509–1521. [Google Scholar] [CrossRef]
  27. Safder, Q. Assessment of Urbanization and Urban Sprawl Analysis through Remote Sensing and GIS: A Case Study of Faisalabad, Punjab, Pakistan. Int. J. Acad. Res. Bus. Soc. Sci. 2019, 9. [Google Scholar] [CrossRef] [PubMed]
  28. Athick, A.M.A.; Shankar, K. Data on land use and land cover changes in Adama Wereda, Ethiopia, on ETM+, TM and OLI- TIRS landsat sensor using PCC and CDM techniques. Data Brief 2019, 24, 103880. [Google Scholar] [CrossRef] [PubMed]
  29. Verburg, P.H.; van Eck, J.R.R.; de Nijs, T.C.M.; Dijst, M.J.; Schot, P. Determinants of Land-Use Change Patterns in the Netherlands. Environ. Plan. B: Plan. Des. 2004, 31, 125–150. [Google Scholar] [CrossRef] [Green Version]
  30. Hussain, S.; Mubeen, M.; Akram, W.; Ahmad, A.; Habib-Ur-Rahman, M.; Ghaffar, A.; Amin, A.; Awais, M.; Farid, H.U.; Farooq, A.; et al. Study of land cover/land use changes using RS and GIS: A case study of Multan district, Pakistan. Environ. Monit. Assess. 2019, 192, 2. [Google Scholar] [CrossRef]
  31. Xu, L.; Li, B.; Yuan, Y.; Gao, X.; Zhang, T.; Sun, Q. Detecting Different Types of Directional Land Cover Changes Using MODIS NDVI Time Series Dataset. Remote Sens. 2016, 8, 495. [Google Scholar] [CrossRef] [Green Version]
  32. Sroka, W.; Dudek, M.; Wojewodzic, T.; Król, K. Generational Changes in Agriculture: The Influence of Farm Characteristics and Socio-Economic Factors. Agriculture 2019, 9, 264. [Google Scholar] [CrossRef] [Green Version]
  33. Liaqut, A.; Younes, I.; Sadaf, R.; Zafar, H. Impact of urbanization growth on land surface temperature using remote sensing and GIS: A case study of Gujranwala city, Punjab, Pakistan. Int. J. Eco. Environ. Geol. 2019, 44–49. [Google Scholar] [CrossRef]
  34. Sarfo, A.K.; Karuppannan, S. Application of Geospatial Technologies in the COVID-19 Fight of Ghana. Trans. Indian Natl. Acad. Eng. 2020, 5, 193–204. [Google Scholar] [CrossRef]
  35. Ibharim, N.A.; Mustapha, M.A.; Lihan, T.; Mazlan, A.G. Mapping mangrove changes in the Matang Mangrove Forest using multi temporal satellite imageries. Ocean Coast. Manag. 2015, 114, 64–76. [Google Scholar] [CrossRef]
  36. Mukherjee, S.; Rizvi, S.S.; Biswas, G.; Paswan, A.K.; Vaiphei, S.P.; Warsi, T.; Mitran, T. Aquatic Eco-systems Under Influence of Climate Change and Anthropogenic Activities: Potential Threats and Its Mitigation Strategies. Hydrogeochem. Aquat. Ecosyst. 2023, 11, 307–331. [Google Scholar] [CrossRef]
  37. Yuan, X.; Li, L.; Chen, X.; Shi, H. Effects of Precipitation Intensity and Temperature on NDVI-Based Grass Change over Northern China during the Period from 1982 to 2011. Remote Sens. 2015, 7, 10164–10183. [Google Scholar] [CrossRef] [Green Version]
  38. Pal, S.; Ziaul, S. Detection of land use and land cover change and land surface temperature in English Bazar urban centre. Egypt. J. Remote Sens. Space Sci. 2017, 20, 125–145. [Google Scholar] [CrossRef] [Green Version]
  39. Kharazmi, R.; Tavili, A.; Rahdari, M.R.; Chaban, L.; Panidi, E.; Rodrigo-Comino, J. Monitoring and assessment of seasonal land cover changes using remote sensing: A 30-year (1987–2016) case study of Hamoun Wetland, Iran. Environ. Monit. Assess. 2018, 190, 356. [Google Scholar] [CrossRef]
  40. Yang, Z.; Zhang, Z.; Zhang, T.; Fahad, S.; Cui, K.; Nie, L.; Peng, S.; Huang, J. The Effect of Season-Long Temperature Increases on Rice Cultivars Grown in the Central and Southern Regions of China. Front. Plant Sci. 2017, 8, 1908. [Google Scholar] [CrossRef] [Green Version]
  41. Birhanu, A.; Masih, I.; van der Zaag, P.; Nyssen, J.; Cai, X. Impacts of land use and land cover changes on hydrology of the Gumara catchment, Ethiopia. Phys. Chem. Earth, Parts A/B/C 2019, 112, 165–174. [Google Scholar] [CrossRef]
  42. Fahad, S.; Ihsan, M.Z.; Khaliq, A.; Daur, I.; Saud, S.; Alzamanan, S.; Nasim, W.; Abdullah, M.; Khan, I.A.; Wu, C.; et al. Consequences of high temperature under changing climate optima for rice pollen characteristics-concepts and perspectives. Arch. Agron. Soil Sci. 2018, 64, 1473–1488. [Google Scholar] [CrossRef]
  43. Namugize, J.N.; Jewitt, G.; Graham, M. Effects of land use and land cover changes on water quality in the uMngeni river catchment, South Africa. Phys. Chem. Earth Parts A/B/C 2018, 105, 247–264. [Google Scholar] [CrossRef]
  44. Sajid, M.; Mohsin, M.; Mobeen, M.; Rehman, A.; Rafique, A.; Rauf, M.; Ali, G. Spatio-Temporal Analysis of Land Use Change and its Driving Factors in Layyah, Punjab, Pakistan. Nucleus 2023, 60, 15–23. [Google Scholar]
  45. Kiptala, J.; Mohamed, Y.; Mul, M.; Cheema, M.; Van der Zaag, P. Land use and land cover classification using phenological variability from MODIS vegetation in the Upper Pangani River Basin, Eastern Africa. Phys. Chem. Earth, Parts A/B/C 2013, 66, 112–122. [Google Scholar] [CrossRef]
  46. Zoungrana, B.J.; Conrad, C.; Thiel, M.; Amekudzi, L.K.; Da, E.D. MODIS NDVI trends and fractional land cover change for improved assessments of vegetation degradation in Burkina Faso, West Africa. J. Arid Environ. 2018, 153, 66–75. [Google Scholar] [CrossRef]
  47. Akhtar, F.; Awan, U.K.; Tischbein, B.; Liaqat, U.W. A phenology based geo-informatics approach to map land use and land cover (2003–2013) by spatial segregation of large heterogenic river basins. Appl. Geogr. 2017, 88, 48–61. [Google Scholar] [CrossRef]
  48. Hussain, S.; Mubeen, M.; Karuppannan, S. Land use and land cover (LULC) change analysis using TM, ETM+ and OLI Landsat images in district of Okara, Punjab, Pakistan. Phys. Chem. Earth Parts A/B/C 2022, 126, 103117. [Google Scholar] [CrossRef]
  49. Khan, M.S.; Ullah, S.; Sun, T.; Rehman, A.U.; Chen, L. Land-Use/Land-Cover Changes and Its Contribution to Urban Heat Island: A Case Study of Islamabad, Pakistan. Sustainability 2020, 12, 3861. [Google Scholar] [CrossRef]
  50. Chaves, M.E.D.; Picoli, M.C.A.; Sanches, I.D. Recent Applications of Landsat 8/OLI and Sentinel-2/MSI for Land Use and Land Cover Mapping: A Systematic Review. Remote Sens. 2020, 12, 3062. [Google Scholar] [CrossRef]
  51. Riggio, J.; Kija, H.; Masenga, E.; Mbwilo, F.; Van de Perre, F.; Caro, T. Sensitivity of Africa’s larger mammals to humans. J. Nat. Conserv. 2018, 43, 136–145. [Google Scholar] [CrossRef]
  52. Sikarwar, A.; Chattopadhyay, A. Change in Land Use-Land Cover and Population Dynamics: Atown-Level Study of Ahmedabad City Sub-District of Gujarat. Int. J. Geomat. Geosci. 2016, 7, 225–234. Available online: https://www.academia.edu/download/53442229/My_paper_IJGGS.pdf (accessed on 19 December 2022).
  53. Xiubin, L. A review of the international researches on land use/land cover change. Acta Geogr. Sin. Chin. Ed. 1996, 51, 558–565. [Google Scholar]
  54. Jain, A.; Saini, V.; Kohli, D.V. Edible Transgenic Plant Vaccines for Different Diseases. Curr. Pharm. Biotechnol. 2013, 14, 594–614. [Google Scholar] [CrossRef]
  55. Ojima, D.S.; Galvin, K.A.; Turner, B.L. The Global Impact of Land-Use Change. Bioscience 1994, 44, 300–304. [Google Scholar] [CrossRef]
  56. Abd El-Kawy, O.R.; Rød, J.K.; Ismail, H.A.; Suliman, A.S. Land use and land cover change detection in the western Nile delta of Egypt using remote sensing data. Appl. Geogr. 2011, 31, 483–494. [Google Scholar] [CrossRef]
  57. Aplin, P.; Atkinson, P.M.; Curran, P.J. Fine Spatial Resolution Simulated Satellite Sensor Imagery for Land Cover Mapping in the United Kingdom. Remote Sens. Environ. 1999, 68, 206–216. [Google Scholar] [CrossRef]
  58. Khan, R.; Li, H.; Basir, M.; Chen, Y.L.; Sajjad, M.M.; Haq, I.U.; Ullah, B.; Arif, M.; Hassan, W. Monitoring land use land cover changes and its impacts on land surface temperature over Mardan and Charsadda Districts, Khyber Pakhtunkhwa (KP), Pakistan. Environ. Monit. Assess. 2022, 194, 1–22. [Google Scholar] [CrossRef]
  59. Weng, Q. Thermal infrared remote sensing for urban climate and environmental studies: Methods, applications, and trends. ISPRS J. Photogramm. Remote Sens. 2009, 64, 335–344. [Google Scholar] [CrossRef]
  60. Wu, W. The Generalized Difference Vegetation Index (GDVI) for Dryland Characterization. Remote Sens. 2014, 6, 1211–1233. [Google Scholar] [CrossRef] [Green Version]
  61. Huete, A.; Didan, K.; Miura, T.; Rodriguez, E.P.; Gao, X.; Ferreira, L.G. Overview of the radiometric and biophysical performance of the MODIS vegetation indices. Remote Sens. Environ. 2002, 83, 195–213. [Google Scholar] [CrossRef]
  62. Huete, A.R. A soil-adjusted vegetation index (SAVI). Remote Sens. Environ. 1988, 25, 295–309. [Google Scholar] [CrossRef]
  63. Qi, J.; Chehbouni, A.; Huete, A.R.; Kerr, Y.H.; Sorooshian, S. A modified soil adjusted vegetation index. Remote Sens. Environ. 1994, 48, 119–126. [Google Scholar] [CrossRef]
  64. Rondeaux, G.; Steven, M.; Baret, F. Optimization of soil-adjusted vegetation indices. Remote Sens. Environ. 1996, 55, 95–107. [Google Scholar] [CrossRef]
  65. Scanlon, T.M.; Albertson, J.D.; Caylor, K.K.; Williams, C.A. Determining land surface fractional cover from NDVI and rainfall time series for a savanna ecosystem. Remote Sens. Environ. 2002, 82, 376–388. [Google Scholar] [CrossRef]
  66. Hussain, S. Land Use/Land Cover Classification by Using Satellite NDVI Tool for Sustainable Water and Climate Change in Southern Punjab. Master’s Thesis, COMSATS University Islamabad, Islamabad, Pakistan, 2018. [Google Scholar] [CrossRef]
  67. Naeem, M.; Farid, H.U.; Madni, M.A.; Ahsen, R.; Khan, Z.M.; Dilshad, A.; Shahzad, H. Remotely sensed image interpretation for assessment of land use land cover changes and settlement impact on allocated irrigation water in Multan, Pakistan. Environ. Monit. Assess. 2022, 194, 1–18. [Google Scholar] [CrossRef]
  68. Hussain, S.; Mubeen, M.; Ahmad, A.; Akram, W.; Hammad, H.M.; Ali, M.; Masood, N.; Amin, A.; Farid, H.U.; Sultana, S.R.; et al. Using GIS tools to detect the land use/land cover changes during forty years in Lodhran District of Pakistan. Environ. Sci. Pollut. Res. 2019, 27, 39676–39692. [Google Scholar] [CrossRef]
  69. Ahsen, R.; Khan, Z.M.; Farid, H.U.; Shakoor, A.; Ali, I. Estimation of cropped area and irrigation water requirement using Remote Sensing and GIS. J. Anim. Plant Sci. 2020, 30. [Google Scholar] [CrossRef] [Green Version]
  70. Hussain, S.; Mubeen, M.; Ahmad, A.; Majeed, H.; Qaisrani, S.A.; Hammad, H.M.; Amjad, M.; Ahmad, I.; Fahad, S.; Ahmad, N.; et al. Assessment of land use/land cover changes and its effect on land surface temperature using remote sensing techniques in Southern Punjab, Pakistan. Environ. Sci. Pollut. Res. 2022, 1–17. [Google Scholar] [CrossRef]
  71. Hossain, M.S.; Arshad, M.; Qian, L.; Kächele, H.; Khan, I.; Islam, D.I.; Mahboob, M.G. Climate change impacts on farmland value in Bangladesh. Ecol. Indic. 2020, 112, 106181. [Google Scholar] [CrossRef]
  72. Rahman, M.T.U.; Tabassum, F.; Rasheduzzaman, M.; Saba, H.; Sarkar, L.; Ferdous, J.; Uddin, S.Z.; Islam, A.Z.M.Z. Temporal dynamics of land use/land cover change and its prediction using CA-ANN model for southwestern coastal Bangladesh. Environ. Monit. Assess. 2017, 189, 565. [Google Scholar] [CrossRef] [PubMed]
  73. Rani, M.; Kumar, P.; Pandey, P.C.; Srivastava, P.K.; Chaudhary, B.; Tomar, V.; Mandal, V.P. Multi-temporal NDVI and surface temperature analysis for Urban Heat Island inbuilt surrounding of sub-humid region: A case study of two geographical regions. Remote Sens. Appl. Soc. Environ. 2018, 10, 163–172. [Google Scholar] [CrossRef]
  74. Nuthammachot, N.; Stratoulias, D. Use of SAR and Optical Satellite Data for Land Use and Land Cover Classification in the Songkhla Lake Basin, Thailand. Int. J. Appl. Eng. Res. 2017, 12, 14358–14364. Available online: https://www.ripublication.com/ijaer17/ijaerv12n24_50.pdf (accessed on 8 December 2022).
  75. Lucas, R.; Rowlands, A.; Brown, A.; Keyworth, S.; Bunting, P. Rule-based classification of multi-temporal satellite imagery for habitat and agricultural land cover mapping. ISPRS J. Photogramm. Remote Sens. 2007, 62, 165–185. [Google Scholar] [CrossRef]
  76. Tamouk, J.; Lotfi, N.; Farmanbar, M. Satellite image classification methods and Landsat 5TM Bands. arXiv 2013, arXiv:1308.1801. [Google Scholar]
  77. Elhag, M. Consideration of Landsat-8 Spectral Band Combination in Typical Mediterranean Forest Classification in Halkidiki, Greece. Open Geosci. 2017, 9, 468–479. [Google Scholar] [CrossRef]
  78. Eva, H.D.; Belward, A.S.; De Miranda, E.E.; Di Bella, C.M.; Gond, V.; Huber, O.; Jones, S.; Sgrenzaroli, M.; Fritz, S. A land cover map of South America. Glob. Change Biol. 2004, 10, 731–744. [Google Scholar] [CrossRef] [Green Version]
  79. Rwanga, S.S.; Ndambuki, J.M. Accuracy Assessment of Land Use/Land Cover Classification Using Remote Sensing and GIS. Int. J. Geosci. 2017, 8, 611–622. [Google Scholar] [CrossRef] [Green Version]
  80. Congalton, R.G. A review of assessing the accuracy of classifications of remotely sensed data. Remote Sens. Environ. 1991, 37, 35–46. [Google Scholar] [CrossRef]
  81. Holtz, T.S.U. Introductory Digital Image Processing: A Remote Sensing Perspective, Third Edition. Environ. Eng. Geosci. 2007, 13, 89–90. [Google Scholar] [CrossRef]
  82. Jensen, J.R.; Cowen, D.C. Remote Sensing of Urban/Suburban Infrastructure and Socio-Economic Attributes. Photogramm. Eng. Remote Sens. 1999, 65, 611–622. [Google Scholar] [CrossRef]
  83. Faisal, B.M.R.; Rahman, H.; Sharifee, N.H.; Sultana, N.; Islam, M.I.; Habib, S.M.A.; Ahammad, T. Integrated Application of Remote Sensing and GIS in Crop Information System—A Case Study on Aman Rice Production Forecasting Using MODIS-NDVI in Bangladesh. Agriengineering 2020, 2, 264–279. [Google Scholar] [CrossRef]
  84. Morshed, S.R.M.R.; Fattah, A.; Rimi, A.A.; Haque, N. Surface temperature dynamics in response to land cover transformation. J. Civ. Eng. Sci. Technol. 2020, 11, 94–110. [Google Scholar] [CrossRef]
  85. Fung, T.; LeDrew, E. For Change Detection using Various Accuracy. Photogramm. Eng. Remote Sens. 1988, 54, 1449–1454. Available online: http://www.asprs.org/wp-content/uploads/pers/1988journal/oct/1988_oct_1449-1454.pdf (accessed on 20 December 2022).
  86. Ahmad, F. A review of remote sensing data change detection algorithms: Comparison of Faisalabad and Multan Districts, Punjab Province, Pakistan. J. Geogr. Reg. Plan. 2012, 5, 236–251. [Google Scholar] [CrossRef]
  87. Chen, J.; Theller, L.; Gitau, M.W.; Engel, B.A.; Harbor, J.M. Urbanization impacts on surface runoff of the contiguous United States. J. Environ. Manag. 2017, 187, 470–481. [Google Scholar] [CrossRef]
  88. Ayele, G.T.; Tebeje, A.K.; Demissie, S.S.; Belete, M.A.; Jemberrie, M.A.; Teshome, W.M.; Mengistu, D.T.; Teshale, E.Z. Time Series Land Cover Mapping and Change Detection Analysis Using Geographic Information System and Remote Sensing, Northern Ethiopia. Air Soil Water Res. 2018, 11. [Google Scholar] [CrossRef] [Green Version]
  89. Khalil, R.Z.; Haque, S.U. InSAR coherence-based land cover classification of Okara, Pakistan. Egypt. J. Remote Sens. Space Sci. 2018, 21, S23–S28. [Google Scholar] [CrossRef]
  90. Alam, E.; Collins, A.E. Cyclone disaster vulnerability and response experiences in coastal Bangladesh. Disasters 2010, 34, 931–954. [Google Scholar] [CrossRef] [PubMed]
  91. Tian, Y.; Tsendbazar, N.-E.; van Leeuwen, E.; Fensholt, R.; Herold, M. A global analysis of multifaceted urbanization patterns using Earth Observation data from 1975 to 2015. Landsc. Urban Plan. 2021, 219, 104316. [Google Scholar] [CrossRef]
  92. Hussain, S.; Karuppannan, S. Land use/land cover changes and their impact on land surface temperature using remote sensing technique in district Khanewal, Punjab Pakistan. Geol. Ecol. Landsc. 2021, 1–13. [Google Scholar] [CrossRef]
  93. Hadeel, A.; Jabbar, M.; Chen, X. Application of remote sensing and GIS to the study of land use/cover change and urbanization expansion in Basrah province, southern Iraq. Geo-Spat. Inf. Sci. 2009, 12, 135–141. [Google Scholar] [CrossRef]
  94. Whiteside, T.; Ahmad, W. A comparison of object-oriented and pixel-based classification methods for mapping land cover in northern Australia. In Proceedings of the SSC2005 Spatial Intelligence, Innovation and Praxis: The National Biennial Conference of the Spatial Sciences Institute, Melbourne, Australia, 12–16 September 2005; pp. 1225–1231. [Google Scholar]
  95. Mallupattu, P.K.; Reddy, J.R.S. Analysis of Land Use/Land Cover Changes Using Remote Sensing Data and GIS at an Urban Area, Tirupati, India. Sci. World J. 2013, 2013, 1–6. [Google Scholar] [CrossRef] [Green Version]
  96. Rai, R.; Zhang, Y.; Paudel, B.; Li, S.; Khanal, N.R. A Synthesis of Studies on Land Use and Land Cover Dynamics during 1930–2015 in Bangladesh. Sustainability 2017, 9, 1866. [Google Scholar] [CrossRef] [Green Version]
  97. Chatterjee, N.; Mukhopadhyay, R.; Mitra, D. Decadal Changes in Shoreline Patterns in Sundarbans, India. Available online: http://drs.nio.org/drs/handle/2264/4847 (accessed on 19 December 2022).
  98. Mukhopadhyay, S.; Biswas, H.; De, T.; Jana, T. Fluxes of nutrients from the tropical River Hooghly at the land–ocean boundary of Sundarbans, NE Coast of Bay of Bengal, India. J. Mar. Syst. 2006, 62, 9–21. [Google Scholar] [CrossRef]
  99. Alam, M.; Furukawa, Y.; Sarker, S.K.; Ahmed, R. Sustainability of Sal (Shorea robusta) forest in Bangladesh: Past, present and future actions. Int. For. Rev. 2008, 10, 29–37. [Google Scholar] [CrossRef]
  100. Abdullah, H.M.; Mahboob, M.G.; Rahman, M.M.; Ahmed, T. Monitoring natural Sal forest cover in Modhupur, Bangladesh using temporal Landsat imagery during 1972–2015. Int. J. Environ. 2015, 5, 1–7. [Google Scholar]
  101. Masum, K.M.; Alam, M.S.; Al Mamun, M.M.A. Ecological and economical significance of homestead forest to the household of the offshore island in Bangladesh. J. For. Res. 2008, 19, 307–310. [Google Scholar] [CrossRef]
  102. Mondal, S.H.; Debnath, P. Spatial and temporal changes of Sundarbans reserve forest in Bangladesh. Environ. Nat. Resour. J. 2017, 15, 51–61. [Google Scholar]
  103. Ahammad, R. Recent trends in forest and livelihood relationships of rural communities in the Chittagong Hill Tracts region, Bangladesh. Doctoral Dissertation, Charles Darwin University, Casuarina, Australia, 2019. [Google Scholar] [CrossRef]
  104. Hasan, M.N.; Hossain, M.S.; Islam, M.R.; Bari, M.A.; Karim, D.; Rahman, M.Z. Trends in the Availability of Agricultural Land in Bangladesh; Soil Resource Development Institute (SERDI); Ministry of Agriculture, Bangladesh: Dhaka, Bangladesh, 2013. Available online: http://fpmu.gov.bd/agridrupal/sites/default/files/Trends-in-the-availability-of-agricultural-land-in-Bangladesh-SRDI-Supported-by-NFPCSP-FAO.pdf (accessed on 8 December 2022).
  105. Biswas, S.R.; Choudhury, J.K. Forests and forest management practices in Bangladesh: The question of sustainability. Int. For. Rev. 2007, 9, 627–640. [Google Scholar] [CrossRef]
  106. Hansen, M.C.; Potapov, P.V.; Moore, R.; Hancher, M.; Turubanova, S.A.; Tyukavina, A.; Thau, D.; Stehman, S.V.; Goetz, S.J.; Loveland, T.R.; et al. High-resolution global maps of 21st-century forest cover change. Science 2013, 342, 850–853. [Google Scholar] [CrossRef] [Green Version]
  107. Hanewinkel, M.; Cullmann, D.A.; Schelhaas, M.-J.; Nabuurs, G.-J.; Zimmermann, N.E. Climate change may cause severe loss in the economic value of European forest land. Nat. Clim. Change 2013, 3, 203–207. [Google Scholar] [CrossRef]
  108. Chakravarty, S.; Ghosh, S.K.; Suresh, C.P.; Dey, A.N.; Shukla, G. Deforestation: Causes, effects and control strategies. Glob. Perspect. Sustain. For. Manag. 2012, 1, 1–26. [Google Scholar] [CrossRef] [Green Version]
  109. Jönsson, P.; Eklundh, L. TIMESAT—A program for analyzing time-series of satellite sensor data. Comput. Geosci. 2004, 30, 833–845. [Google Scholar] [CrossRef] [Green Version]
  110. Reed, B.E.; Arunachalam, S.; Thomas, B. Removal of lead and cadmium from aqueous waste streams using granular activated carbon (GAC) columns. Environ. Prog. 1994, 13, 60–64. [Google Scholar] [CrossRef]
  111. Butt, A.; Shabbir, R.; Ahmad, S.S.; Aziz, N. Land use change mapping and analysis using Remote Sensing and GIS: A case study of Simly watershed, Islamabad, Pakistan. Egypt. J. Remote Sens. Space Sci. 2015, 18, 251–259. [Google Scholar] [CrossRef] [Green Version]
  112. Manzoor, S.A.; Malik, A.; Zubair, M.; Griffiths, G.; Lukac, M. Linking Social Perception and Provision of Ecosystem Services in a Sprawling Urban Landscape: A Case Study of Multan, Pakistan. Sustainability 2019, 11, 654. [Google Scholar] [CrossRef] [Green Version]
Figure 1. Geographical location of Southern Punjab, Pakistan (study area).
Sustainability 15 03572 g001
Figure 2. Flow chart of methodology for current study.
Sustainability 15 03572 g002
Figure 3. LULC maps for the years 2000, 2007, 2014, and 2021 for Southern Punjab, Pakistan.
Sustainability 15 03572 g003
Figure 4. LULC dynamics during the period of 2000–2021 for Southern Punjab, Pakistan.
Sustainability 15 03572 g004
Figure 5. LULC area transfer plot between 2000 and 2021 (From left to right, the histogram of different land types, respectively, represents four time periods: 2000–2007; 2007–2014; 2014–2021; 2000–2021).
Sustainability 15 03572 g005
Figure 6. NDVI changes in Kharif season from the years 2000 to 2021 for Southern Punjab, Pakistan.
Sustainability 15 03572 g006
Figure 7. NDVI changes in Rabi season from the years 2000 to 2021 for Southern Punjab, Pakistan.
Sustainability 15 03572 g007
Figure 8. NDVI changes from 2000 to 2021 in Kharif and Rabi seasons for Southern Punjab, Pakistan (blue indicates a higher NDVI; orange shows a moderate NDVI, red displays the lowest NDVI value).
Sustainability 15 03572 g008
Table 1. Landsat data for LULC changes’ calculations.
Access DateAcquisitionSatelliteSensorBand UsedPath/RowResolution
(m)
Cloud Cover
(%)
25/05/202206/11/2000Landsat 5TM1,2,3,4,5,7149/39, 149/40, 150/38 to 150/41, 151/38 to 151/41300
25/05/202228/11/2007Landsat 5TM1,2,3,4,5,7149/39, 149/40, 150/38 to 150/41, 151/38 to 151/41300
28/06/202225/08/2014Landsat 8OLI-TIRS1,2,3,4,5,6,7,9149/39, 149/40, 150/38 to 150/41, 151/38 to 151/41300
28/06/202215/10/2021Landsat 8OLI-TIRS1,2,3,4,5,6,7,9149/39, 149/40, 150/38 to 150/41, 151/38 to 151/41300
Table 2. Description of Modis MOD13Q1 (Tiles: h24 v5, h24 v6) for NDVI changes’ calculations.
SDS NameDescriptionUnitsData TypeValid RangeScale
Factor
250 m 16 days NDVI16 day NDVINDVI16-bit signed integer−2000 to 10,0000.0001
250 m 16 days EVI16 day EVIEVI16-bit signed integer−2000 to 10,0000.0001
250 m 16 days VI QualityVI quality indicatorsBit Field16-bit unsigned integer0 to 65,534N/A
250 m 16 days red reflectanceSurface Reflectance Band 1N/A16-bit signed integer0 to 10,0000.0001
250 m 16 days NIR reflectanceSurface Reflectance Band 2N/A16-bit signed integer0 to 10,0000.0001
250 m 16 days blue reflectanceSurface Reflectance Band 3N/A16-bit signed integer0 to 10,0000.0001
250 m 16 days MIR reflectanceSurface Reflectance Band 7N/A16-bit signed integer0 to 10,0000.0001
250 m 16 days view zenith angleView zenith angle of VI PixelDegree16-bit signed integer0 to 18,0000.01
250 m 16 days sun zenith angleSun zenith angle of VI pixelDegree16-bit signed integer0 to 18,0000.01
250 m 16 days relative azimuth angleRelative azimuth angle of VI pixelDegree16-bit signed integer−18,000 to 18,0000.01
250 m 16 days composite day of the yearDay of year VI pixelJulian day16-bit signed integer1 to 366N/A
250 m 16 days pixel reliabilityQuality reliability of VI pixelRank8-bit signed integer0 to 3N/A
Table 3. LULC area changes from 2000 to 2021.
Land Use20002007201420212000–2021
Area
(Km2)
Area
(%)
Area
(Km2)
Area
(%)
Area
(Km2)
Area
(%)
Area
(Km2)
Area
(%)
Change
(%)
Water2601.052.062470.081.954592.903.633904.153.081.02
Cropland26,024.4120.5811,518.719.1130,98624.5029,39523.212.63
Forest44,756.1335.3937,722.0329.838578.516.785523.314.36−31.03
Settlements11,132.01818.8022,391.1417.7131,01124.5229,53423.3214.52
Barren Land41,925.3733.1552,337.0141.3951,27040.5558,27646.0212.87
Total Area126,438.98100126,438.98100.00126,438.98100126,438.981000.00
Table 4. Land use area changes from 2000–2021 (km2) for Southern Punjab, Pakistan.
Land Use2000–20072007–20142014–20212000–2021
Water−131.02122.8−688.71303.1
Cropland−14,505.719,467.5−1591.03370.9
Forest−7034.1−29,143.5−3055.2−39,232.8
Settlements11,259.18620.3−1477.918,401.5
Barren Land10,411.6−1067.26813.216,157.6
Table 5. Results of accuracy assessment indices for the current study.
YearUser Accuracy (%)Producer Accuracy (%)Overall
Accuracy
Coefficient K
abcdeabcde(%)(%)
20009010080908010076.9288.88100808885
2007100907010010010081.8188.8887.51008682.76
201490100808010010076.9210088.8890.99087.5
2021100100757510010071.4310010010090.6388.24
Here, a = water; b = cropland; c = forest; d = settlements; e = barren land.
Table 6. Calculated NDVI for Kharif and Rabi Season (2000 to 2021) in Southern Punjab, Pakistan.
YearsKharif SeasonRabi Season
High ValueLow ValueMean ValueHigh ValueLow ValueMean Value
20000.7406−0.20.27030.8328−0.20.3164
20070.7491−0.20.27450.7215−0.20.2607
20140.7975−0.20.29870.8404−0.20.3202
20210.769−0.20.28450.8223−0.20.3111
Disclaimer/Publisher’s Note: The statements, opinions and data contained in all publications are solely those of the individual author(s) and contributor(s) and not of MDPI and/or the editor(s). MDPI and/or the editor(s) disclaim responsibility for any injury to people or property resulting from any ideas, methods, instructions or products referred to in the content.

