Article

Potentially Harmful Elements Associated with Dust of Mosques: Pollution Status, Sources, and Human Health Risks

1
Department of Geosciences, College of Petroleum Engineering & Geosciences, King Fahd University of Petroleum & Minerals, Dhahran 31261, Saudi Arabia
2
Department of Environmental Sciences, Faculty of Meteorology, Environment and Arid Land Agriculture, King Abdulaziz University, P.O. Box 80208, Jeddah 21589, Saudi Arabia
3
Department of Physics, College of Engineering and Physics, King Fahd University of Petroleum & Minerals, Dhahran 31261, Saudi Arabia
4
Environmental Chemistry and Analytical Laboratories Section, Center for Environment and Marine Studies, Research Institute, King Fahd University of Petroleum and Minerals, Dhahran 31261, Saudi Arabia
5
Air Pollution Research Department, Environment and Climate Change Research Institute, National Research Centre, El Behooth Str., Dokki, Giza 12622, Egypt
*
Author to whom correspondence should be addressed.
Int. J. Environ. Res. Public Health 2023, 20(3), 2687; https://doi.org/10.3390/ijerph20032687
Submission received: 19 December 2022 / Revised: 7 January 2023 / Accepted: 16 January 2023 / Published: 2 February 2023
(This article belongs to the Special Issue Air Pollution in Urban Areas)

Abstract

:
Potentially harmful elements (PHEs) associated with dust generated from anthropogenic sources can be transported into mosques and deposited on the filters of the air-conditioners (AC); thereby, children and adults are exposed to such PHEs while visiting mosques. Data dealing with the assessment of PHEs pollution and its human health risk in mosques dust in Saudi Arabia are scarce. Therefore, this work aims to examine the levels and pollution status of PHEs in AC filter dust (ACFD) of mosques and their associated human health risk in three Saudi cities: Jubail, Jeddah, and Dammam metropolitan. A similar concentration pattern of PHEs is observed in three cities’ mosques with noticeably higher concentrations than both global crustal and local background values for Zn, Cu, Pb, As, and Cd only. Except for Fe, Al, and Mn, the highest PHEs concentrations were found in Jeddah (1407 mg/kg), followed by Dammam (1239 mg/kg) and Jubail (1103 mg/kg). High PHEs’ concentrations were also recorded in mosques located near workshops and suburban areas compared to urban areas. Based on the spatial pattern, enrichment factor, geo-accumulation index, pollution load index, and ecological risk values, Jubail, Jeddah, and Dammam have shown moderate pollution levels of Cd, As, Pb, and Zn. On the other hand, Cu. Zn, Cu, Cr, Pb, Ni, As, and Cd had degrees of enrichment levels that varied from significantly enriched to extremely highly enriched in the ACFD of the three cities. Heavy pollution is found in Jubail, which posed a higher potential ecological risk than in Jeddah and Dammam. Cd presents the highest ecological risk factors (ER) in the three cities. Carcinogenic and non-carcinogenic risks for children and adults follow the order: Jeddah > Dammam > Jubail, and the ingestion pathway was the main route for exposure. Carcinogenic and con-carcinogenic risks in the mosques of the various studied cities were generally within the acceptable range.

1. Introduction

Air quality is one of the major safety and environmental challenges due to its significant contributions to the high global mortality rate [1,2,3]. In particular, indoor air quality is a major concern in urban areas due to the high risks of people’s exposure, proximity to various sources of pollution, and toxic dust [4]. Dust may consist of geologic materials, vehicle emissions, worn car parts, suspended particles from roads, contaminated soil, and airborne particles [5]. Dust may also contain heterogeneous mixtures of harmful chemical-based air pollutants such as polycyclic aromatic hydrocarbons (PAHs), heavy metals, and micro-aerosols that may cause serious environmental and public health problems [6]. Moreover, particulate matters (PMs) are considered serious indoor air-pollutant because of their small size (i.e., PM10 and PM2.5) and the potential for carrying dangerous heavy metals originating from the exhaust and non-exhaust emissions [7,8]. Heavy metals remain one of the major environmental contaminants largely owing to their toxicity, non-biodegradability, and persistence in the environment [9,10,11]. The extent or level of heavy metal concentration in dust or PM can be assessed by investigating four risk indicators from the sample PM or dust [5]. These include the pollution load index, the geo-accumulation and sensitivity contamination factors, potential ecological risks, and enrichment factors.
The levels, sources, and the index of the ecological risks of heavy metals associated with road dust in India were investigated in the work of Suryawanshi et al. [12]. The results of their study showed that the dust samples were significantly polluted with zinc and lead. In another study, the authors reported high levels of Cd, Cu, Pb, and Zn in equipment dust at seven different playgrounds in Hong Kong due to the proximity to commercial and workshop activities [13]. Additionally, extreme concentrations of Cr, Cu, and Zn were found in ground dust samples in 89 playgrounds [14]. Meanwhile, Fe was found at high levels in the dust of 10 pre-schools in Malaysia [15]. Several approaches have been adopted to identify the sources and types of heavy metal concentration [16].
Several investigations were reported on the safety of air quality in different provinces of Saudi Arabia. These studies focused on the distribution, concentration, and exposure to toxic heavy metals and particulate matter [17]. Moreover, the health and/or ecological risks in different functional areas of Saudi Arabia have been investigated. Some of the functional areas that have been assessed include traffic areas, parking areas, urban areas, industrial, and workshop areas. The level of contamination by heavy metals is largely determined by traffic density, seasonal changes, meteorological conditions, workshop activities, and dust storms [17,18,19,20].
Heavy metal contamination together with its health implications was assessed in the particles in classrooms at the primary schools located in urban, and suburban, areas of Jeddah, Saudi Arabia [21]. For instance, Fe, Mn, and Zn were the dominant heavy metals in the samples studied. Other studies revealed that the traffic density in Riyadh, Saudi Arabia is the major cause of the presence of lead in the atmosphere [22,23]. In another research study, the concentration of heavy metals was assessed at King Faisal University (KFU) campus in the Eastern Province [24]. The study concluded that anthropogenic sources, particularly vehicular movement, largely contributed to the heavy metal contamination and the elimination of leaded gasoline reduced the level of lead in the Eastern Province of Saudi Arabia. It is clear from the above that most of the local studies have mainly focused on heavy metal and PMs’ contamination in ambient air quality associated with traffic, workshops, and urban areas, however, none of these studies have assessed the levels of potentially harmful metals deposited on mosques’ AC filters.
Saudi Arabia is a highly populated Muslim country, where people frequently perform their five daily prayers in mosques. Mosques in Islam are built mainly for the regular five times daily prayers for the congregation. In fact, they are used not only for regular prayers but also for special events such as Friday prayers and night prayers during the month of fasting (Ramadan), when the mosques remain open and people would stay longer. The average temperatures in the Eastern and Western provinces of Saudi Arabia range from 26 to 48 °C during March–October and from 18 to 28 °C from November to February, while the relative humidity could reach up to 65% during the summer [25]. These high temperatures and humidity make worshipers in mosques rely on air conditioning (AC) units to cool down the temperature and reduce humidity in mosques. Maintaining AC units through the periodic cleaning of their filters could play a significant role in improving air quality in mosques. However, many of the mosques were built near anthropogenic activities such as roads, workshops, and small industrial facilities which may lead to the escape of harmful pollutants from AC filters and degrade the indoor air quality of these mosques. Suspended particulate matter that has penetrated from the outdoors to the indoor environment, through doors, ventilation systems, windows, and AC filters for fresh air, in addition to the particulate dust raised from indoor sources and resident activities can be deposited and settled on the AC filter. Consequently, particles that have settled on the AC filter will represent all the exposed particles in the interior environment. Therefore, evaluating the pollution levels and health risks of the different pollutants in the settled dust of AC filters is very significant in enhancing our understanding of these pollutants in the indoor environment. In this study, we investigate the pollution status, sources, and human health risks of potentially harmful elements (PHEs) associated with the AC filter dust (ACFD) of mosques, located in urban, suburban, residential, and workshop areas, within the eastern and western regions of Saudi Arabia.

2. Materials and Methods
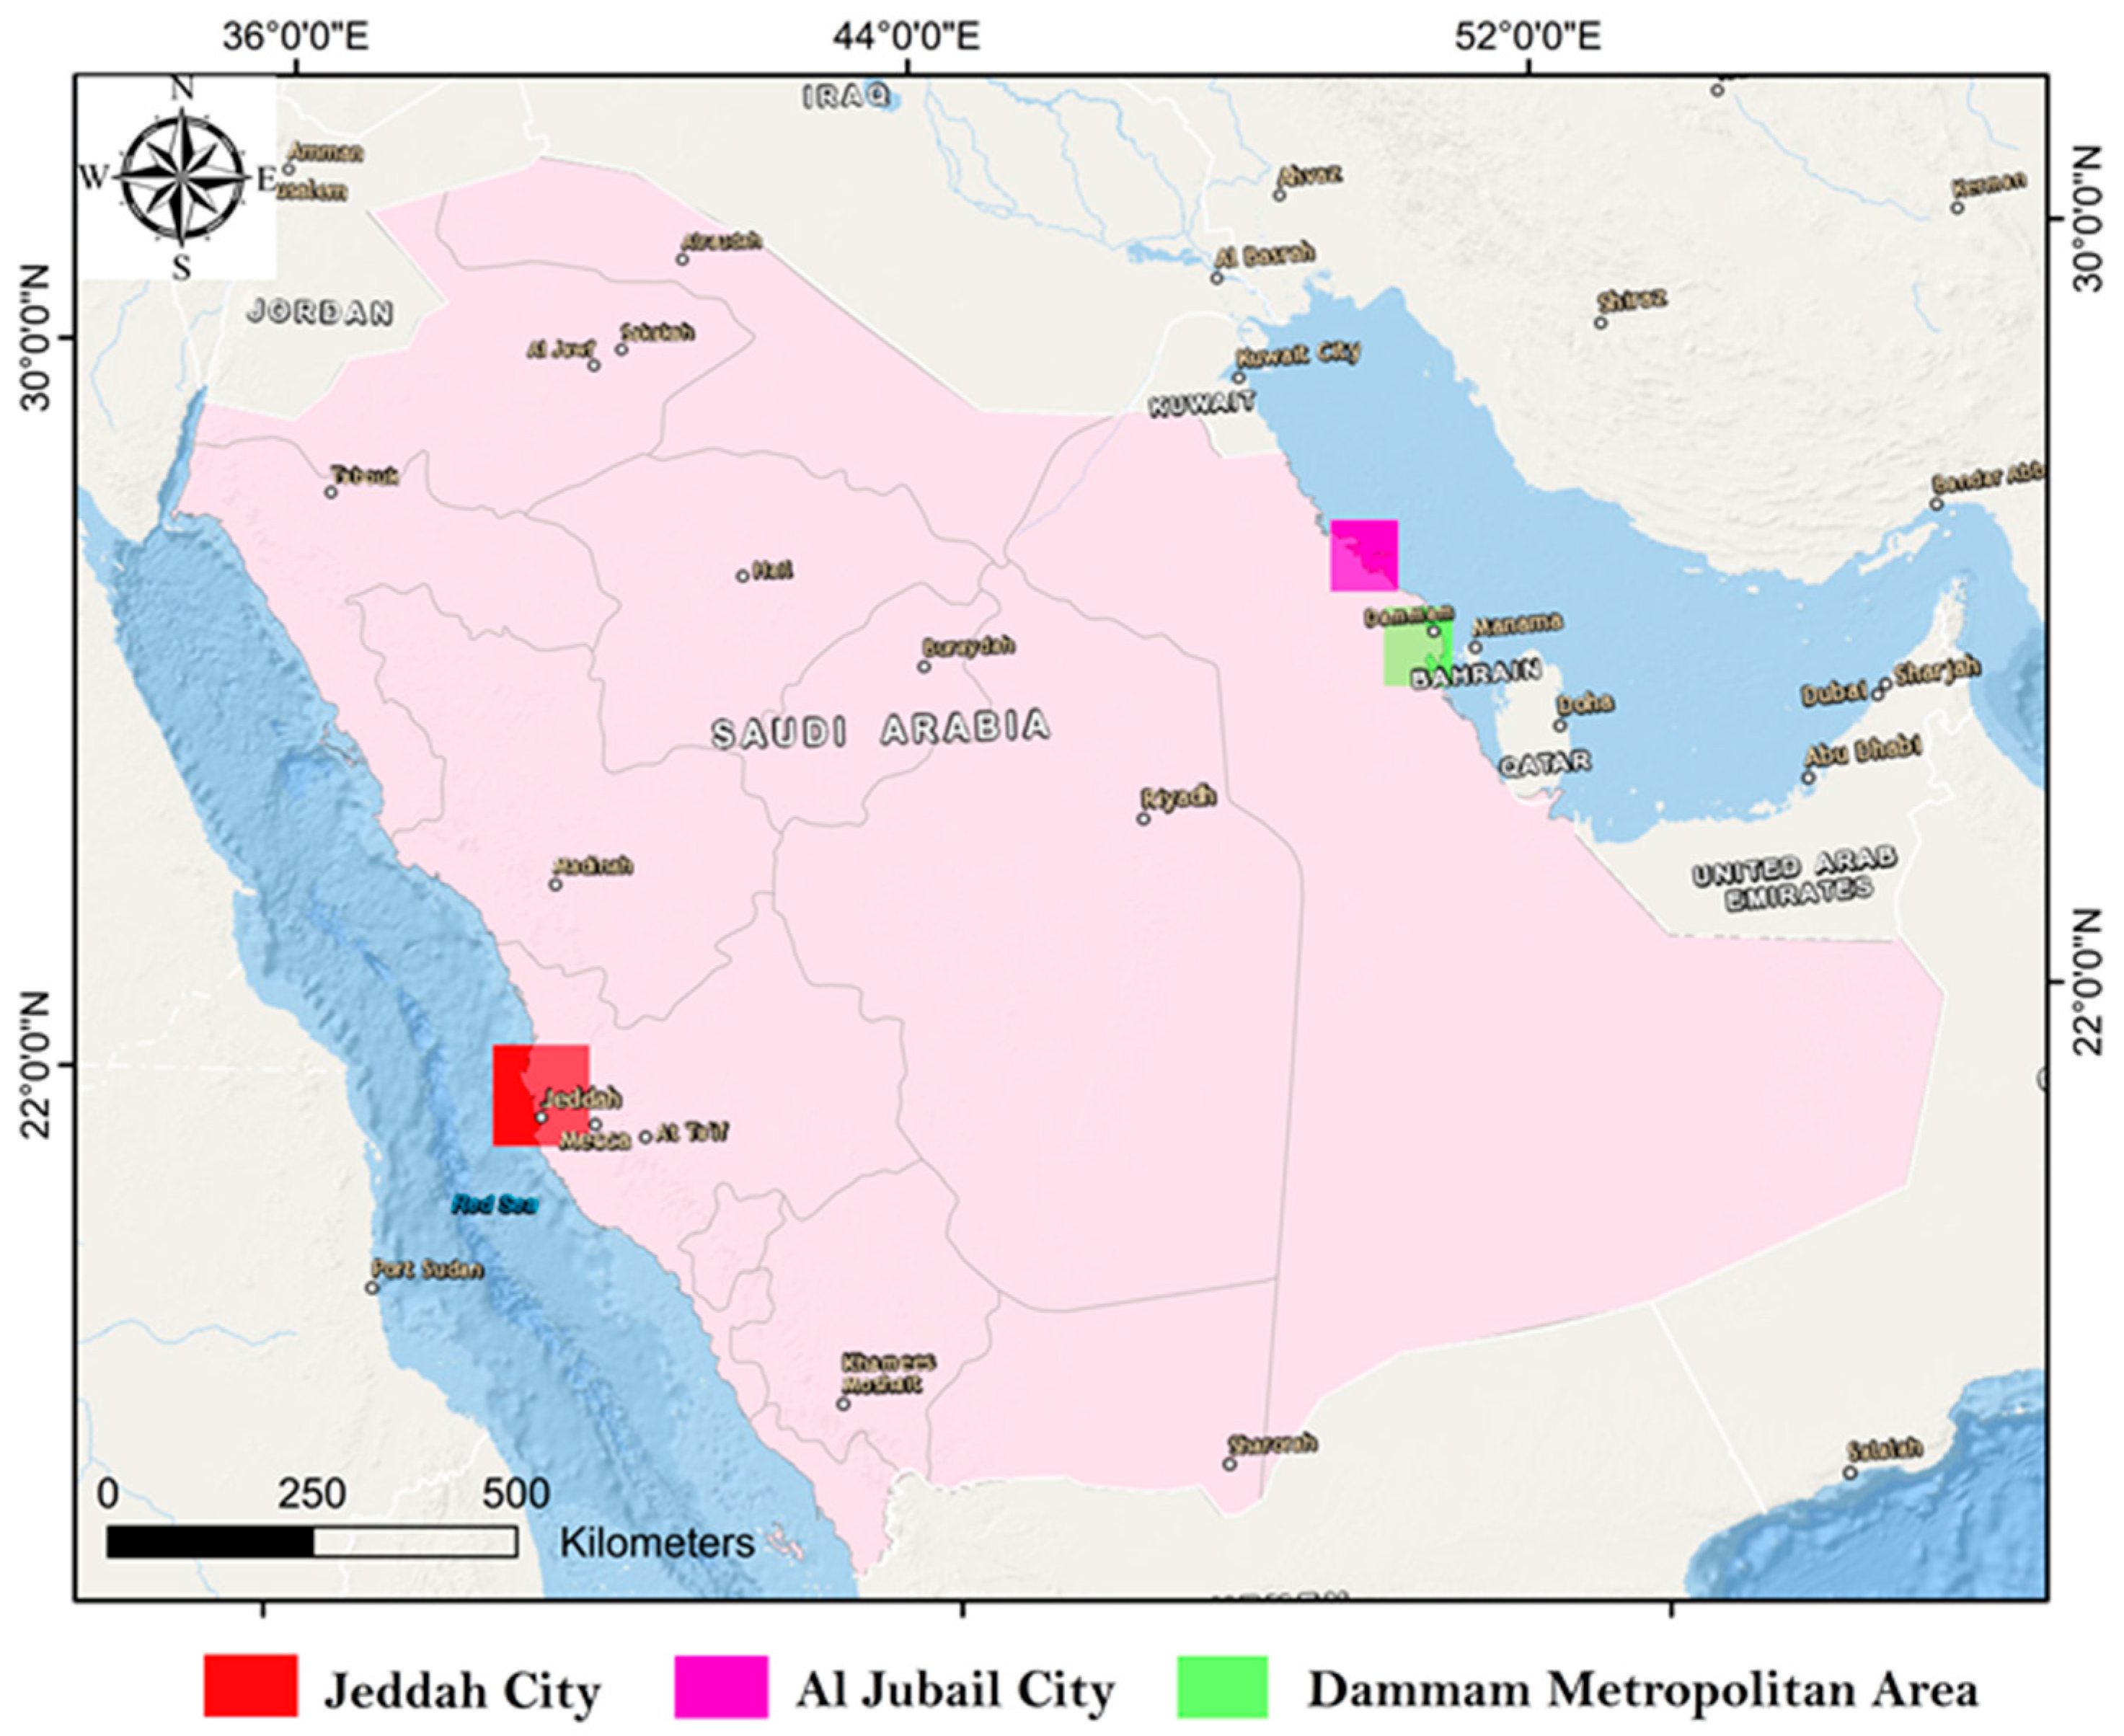
2.1. Study Area

Saudi Arabia is a relatively large country with an area of about 2.15 M km2 and a population of about 36.33 M [26]. In recent years, oil mining activities have increased in various parts of the kingdom thus forcing the government to increase its expenditure in implementing its comprehensive plans. As such, cities across the kingdom have witnessed massive workshop developments, intensive agricultural activities, and an increase in population. In this work, we have focused on three highly populated regions in Saudi Arabia, namely, Jeddah and Jubail cities, and the Dammam Metropolitan area which includes Dammam, Khobar, and Dhahran cities (Figure 1).
Jeddah city (latitude 29.21° N and longitude 39.7° E) is located in the western region of Saudi Arabia (Figure 1), near the eastern coastline of the Red Sea. Jeddah’s current population is about 3.5 million and it accounts for 10% of the entire population of Saudi Arabia. Due to its location along the coastline, Jeddah hosts one of the largest seaports on the Red Sea. The city is also considered the main gateway to the Holy city of Mecca [27], therefore, Jeddah has attracted economic and tourism activities, which have consequently led it to be considered an international economic and trading city. Jeddah’s climate is estimated to be hot desert-like with an average temperature of 28 °C; in summer, the temperature can reach up to 45 °C. The city has rainfall on an annual basis with an average of 61 mm precipitation [28].
Jubail city (latitude 27.39° N and longitude at 49. 70° E) is located in the eastern region of Saudi Arabia (Figure 1), on the Arabian Gulf (AG). Jubail’s current population is about 684,531 and it occupies a landmass of 1016 km2 [29]. Jubail hosts some of the largest petrochemical companies in the world and about 172,273 workshops and industrial firms. Apart from the petrochemical plants, the city is also a hub for plastic and fertilizer manufacturers as well as oil- and gas-based ventures. Climatically, Jubail’s summers are arid and long, while winters are dry and cool. Over the course of the year, the temperature varies from 10 to 45 °C. The city has minimal rainfall on an annual basis with an average of 5 mm precipitation [30].
The Dammam metropolitan area (latitude 26.42° N and longitude at 50.08° E) is the largest area in the Eastern Province of Saudi Arabia (Figure 1). The metropolitan area population is about 1,305,000 and it occupies a landmass of 2800 km2 [31]. It lies on the west coast of the AG and forms a larger metropolitan and industrial complex with Dammam, Khobar, and Dhahran cities. The summers in Dammam are long, hot, humid, and arid; while the winters are cool, dry, and windy; and it is mostly clear year-round. Over the year, the temperature typically varies from 11 to 43 °C. The area has minimal rainfall on an annual basis with an average of 5 mm precipitation [32].

2.2. Sample Collection and Preparation

Air-conditioner filter dust (ACFD) samples, which represent the whole of the exposed particles which have infiltrated from the exterior to interior environment as well as being emitted from indoor activities, were collected from mosques in urban, suburban, residential, and workshop areas, located in Jubail and Jeddah cities and the Dammam metropolitan area, Saudi Arabia (Figure 1). ACFD samples of mosques in the three different cities were mostly collected during 2021. Only 6 samples were collected from Jeddah in 2020. The dust samples were collected from the AC filters of the different mosques after the extensive use of the ACs during the hot weather, from mid-spring to mid-autumn season (7 months). A plastic brush, clean polythene sheets, and airtight polyethylene bags were utilized for the collection of the ACFD samples. The deposited dust on ACF materials was removed in a closed room to ensure proper collection of the deposited dust samples on the filters. In addition, the ACFD particles were trapped slowly due to the small size of the deposited particles on the ACFD that tend to resuspend with ease [33]. The collected ACFD samples were stored in clean, labeled polyethylene bags, transported to the lab, and air-dried at room temperature, and thereafter the coarse impurities were separated using a 1.0 mm mesh nylon sieve. The residue of the dust samples was homogenized, sieved via a 38-μm sieve size, and preserved in small self-sealing plastic bags for PHEs analysis.

2.3. Sampling Analysis

The digestion of the sample was carried out following the USEPA 3050 B modified method [34]. About 0.200 mg of the ACFD sample was digested in 5 mL of aqua regia (3:1 ultrapure HCl: HNO3) in a 50 mL digestion polypropylene tube at 95 °C on a hot block for two hours. Later, 3 mL, of 30% hydrogen peroxide was added in portions and further heated for half an hour. The resulting digested solution was filtered, and the volume was increased to 50 mL with 1% HNO3 solution.
The analysis of PHEs was carried out following USEPA method 6010 [35] on a Perkin Elmer DV 8000 Dual View inductively coupled optical emission spectrometer (ICP-OES). The calibration standards were prepared from CPI mixed standards from 10.0 μg/L to 1000 µg/L concentration. The samples were further diluted appropriately in 1% nitric acid in case the concentration of the analyte exceeded the calibration range. For quality assurance over a batch of 20 samples, 2 samples were duplicated (10%) and 1 sample was spiked, and a spiked duplicate (5%), and analyzed. The relative percent difference was <10% for the duplicate samples and recoveries of the spiked samples were between 92% to 106%. To validate the analysis, a NIST-certified reference material (CRM) 2702 was also digested and analyzed with these samples. The recovery of the NIST CRM was 88% to 104%.

2.4. Pollution Characteristics

Various contamination indices including Enrichment factors (EFs), Geo-accumulation index (Igeo), Contamination factor (Cf), Contamination degree (Cd), Pollution load index (PLI), and Potential ecological risk assessment were used to assess the contamination levels of the PHEs associated with the ACFD of the mosques.

2.4.1. Enrichment Factors (EFs)

The enrichment factors (EFs) are a parameter used to examine the level of the anthropogenic effect of PHEs in samples to distinguish between the anthropogenic origins of PHEs and their natural sources [36,37]. Enrichment factors for PHEs in the ACFD of mosques were calculated using Equation (1):
EF = ( C n / C ref ) sample ( B n / B ref ) background
where Cn and Bn are the concentration of the target PHEs in the ACFD sample and background (crustal and local soil), respectively. Cref and Bref are the concentration of the reference PHEs in the ACFD sample and background, respectively. Elements such as Al, Fe, Mn, Ti, and Zr, commonly conventional tracers, are usually selected as reference elements in the calculation of EFs for PHEs to detach their anthropogenic sources from their natural origin [38,39]. Although Fe is naturally abundant and has very little effect from anthropogenic sources [40,41], Al is selected as the reference element in EF calculation in the present study. The concentrations of the background PHEs values are taken from the continental crust composition [42,43,44] and the local background soil values [45]. The degree of PHEs enrichment is classified into six pollution classes as shown in Table S1 (Supplementary Materials).

2.4.2. Geo-Accumulation Index (Igeo)

The Geo-accumulation index (Igeo) is used to determine the contamination levels by comparing the values of PHEs measured in the ACFD to the background values [46,47]. It evaluates the PHEs pollution in terms of several enrichment classes as listed in Table S1. Igeo for mosque dust was calculated using Equation (2):
I geo = log 2   ( C n 1 . 5 B n   )
where Cn is the measured concentration of the PHEs in the ACFD samples and Bn is the PHEs geochemical background value in the earth’s crust and local background soil values. The concentrations of the background PHEs values are taken from the continental crust composition [42,43,44] and local background soil values [45]. The constant 1.5 was used to reduce the impact of probable differences in the background values due to lithological variation in the sediments [48].

2.4.3. Contamination Factor (Cf) and Contamination Degree (Cd)

The contamination factor (Cf) and contamination degree (Cd) [39] is used to assess the contamination level of PHEs in dust [49]. The Cf index was computed as the ratio of the element value in the ACFD sample to its background concentrations (Equation (3)) [50]:
C f = ( C n   Sample ) ( C n   Background )
Meanwhile, the Cd was calculated using Equation (4) which considers the sum of Cf for PHEs in the ACFD samples:
C d = C f
The four categories of Cf and Cd are listed in Table S1 [51,52].

2.4.4. Pollution Load Index (PLI)

The pollution load index (PLI) is used to evaluate the co-contamination of multiple PHEs and can suggest pollution trends over time and make a comparison among different regions [53,54] and can be calculated using Equation (5) [55,56]:
PLI = ( C f 1 × C f 2 × C f 3 × C f 4 × × C n ) ( 1 n )
where CF is the contamination factor calculated as described in Equation (3) and n is the number of measured PHEs in the ACFD samples. PLI category standards are listed in Table S1 [53,57,58].

2.4.5. Potential Ecological Risk Assessment

The potential ecological risk index [59] is used to estimate the potential ecological risk for the environment [60]. This index is widely used in contamination evaluations involving a large number of elements [61,62]. The potential ecological risk factor (ER) for the given element was calculated using Equation (6) [63]:
ER = C n C b TRF
where Cn is the concentration of the target elements in the ACFD samples, Cb is the background (crustal and local soil) value of the target elements, and TRF is the toxic response factors for the elements which are: As (10), Cd (30), Cr (2), Cu (5), Ni (5), Mn (1), Pb (5), and Zn (1) [59,62,64]. The potential toxicity risk index (ERI) is the sum of the individual ER values (Equation (7)) and is used to evaluate the contamination that is generated by all the measured PHEs simultaneously in the ACFD samples. The values of the ER and ERI grading standard are listed in Table S1.
ERI = ER

2.5. Human Health Risk Assessment

The health risk assessment models [65] are used to assess the non-carcinogenic and carcinogenic health risks for children and adults exposed to PHEs associated with the ACFD of the mosques. During prayers or gatherings in mosques, people are exposed to PHEs via three base exposure routes including direct hand–mouth ingestion, nasal–oral inhalation, and dermal contact. The sum of the risks estimated from these three exposure routes gives the total non-carcinogenic or carcinogenic health risks for this element.
Based on the models set by [65], the average daily dose (ADD) (mg kg−1 day−1) for children and adults exposed to PHEs in the ACFD of mosques via the ingestion (ADDing), inhalation (ADDinh), and dermal (ADDdermal) pathways are calculated in (Equations (8)–(10)):
ADD ing = (   C × IngR × EF × ED   ) ( BW × AT ) × 10 - 6
ADD inh = (   C × InhR × EF × ED   ) ( PEF × BW × AT )
ADD dermal = (   C × SA × AF × ABF × EF × ED   ) ( BW × AT ) × 10 - 6
After calculating the ADD, the potentially non-carcinogenic risks of PHEs in the mosques’ ACFD were evaluated by computing the hazard quotient (HQ) (Equations (11)–(13)) and hazard index (HI) (Equation (14)). The incremental lifetime cancer risk (ILCR) and the cancer risks (CR) are calculated using Equations (15)–(18) [66,67]:
HQ ing = ADD ing R f D
HQ inh = ADD inh R f D
HQ dermal = ADD dermal R f D
Hazard   index   ( HI ) = HQ ing + HQ inh + HQ dermal
ILCR ing = C × { CSF ingestion × ( BW 70 ) 3 } ×   IngR   ×   EF   ×   ED BW   ×   AT   × 10 6    
ILCR inh = C   × { CSF inhalation × ( BW 70 ) 3 } ×   InhR   ×   EF   × ED BW   ×   AT   ×   PEF  
ILCR dermal = C   × { CSF dermal × ( BW 70 ) 3 } ×   SA   ×   AF   ×   ABF   ×   EF   ×   ED BW   ×   AT   × 10 6    
Carcinogenic   risk   ( CR ) = ILCR ingestion + ILCR inhalation + ILCR dermal
where RfD is the reference dose in mg kg−1 day−1 [68], an assessment of the highest allowable risks to humans via daily exposure by considering a sensitive group (children) during a lifetime. HQi is the hazard quotient for a single route. HI is the hazards index, non-carcinogenic risk from the different routes, and equal to the sum of HQi for different exposure routes. The ILCRing, ILCRinh, and ILCRdermal are the incremental lifetime cancer risks by ingestion, inhalation, and dermal contact, respectively. C refers to the concentration of the PHEs (mg kg−1) in the ACFD in mosques. CSF is the carcinogenic slope factor (mg/kg/day). BW is the body weight (kg). AT is the average life span (years). EF is the exposure frequency (day/year). ED is the exposure duration (years). InhR is the inhalation rate (m3/day). IngR is the ingestion rate (mg/day). SA is the dermal surface exposure (cm2). AF is the dermal adherence factor (mg/cm2/h). ABF is the dermal absorption factor and PEF is the particle emission factor (m3/kg). The complete information regarding the values of exposure factors for children and adults used are listed in Tables S1–S3.
There is an insignificant non-carcinogenic risk when HQ and HI ≤ 1, whereas the probability that non-carcinogenic risk occurs when HQ and HI >1 [65,69]. Likewise, ILCR and CR values from 1 × 10⁻⁶ to 1 × 10⁻⁴ can be regarded as an acceptable or tolerable level, values above 1 × 10⁻⁴ are likely to be unacceptable (potentially high risk), values below 1 × 10⁻⁶ indicate no significant health hazard [46,55,65,66,70].

3. Results and Discussion

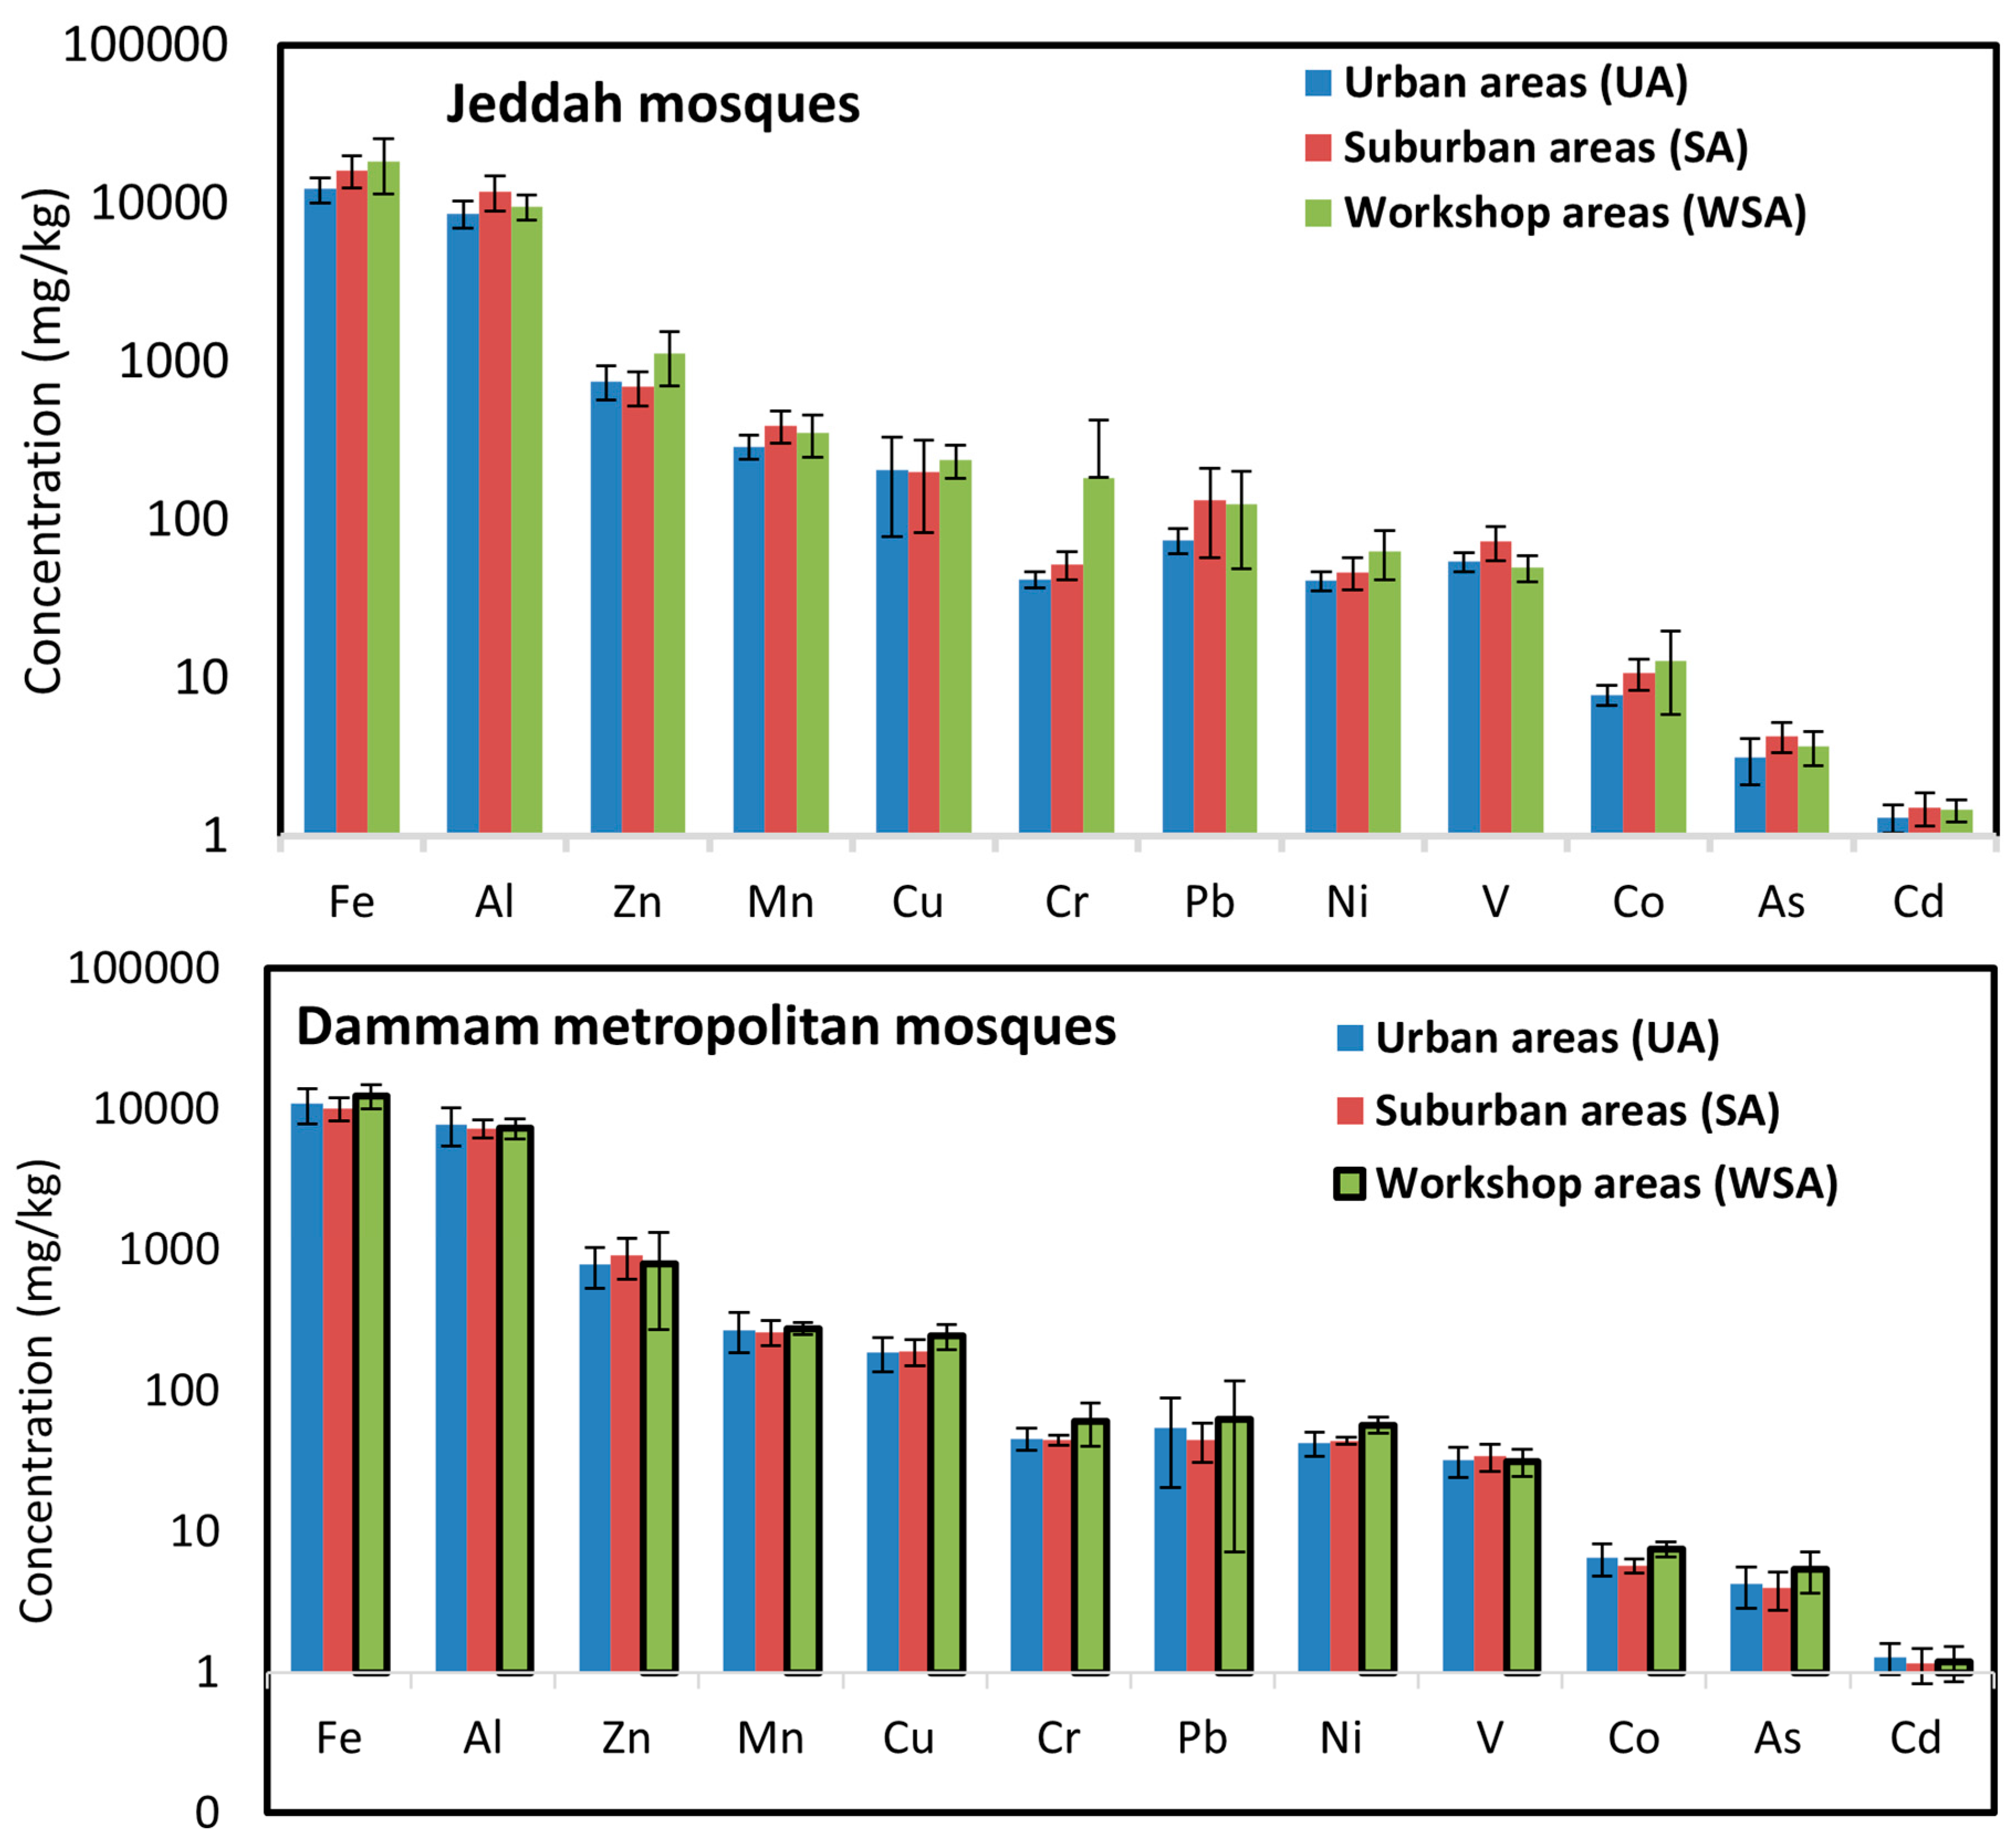
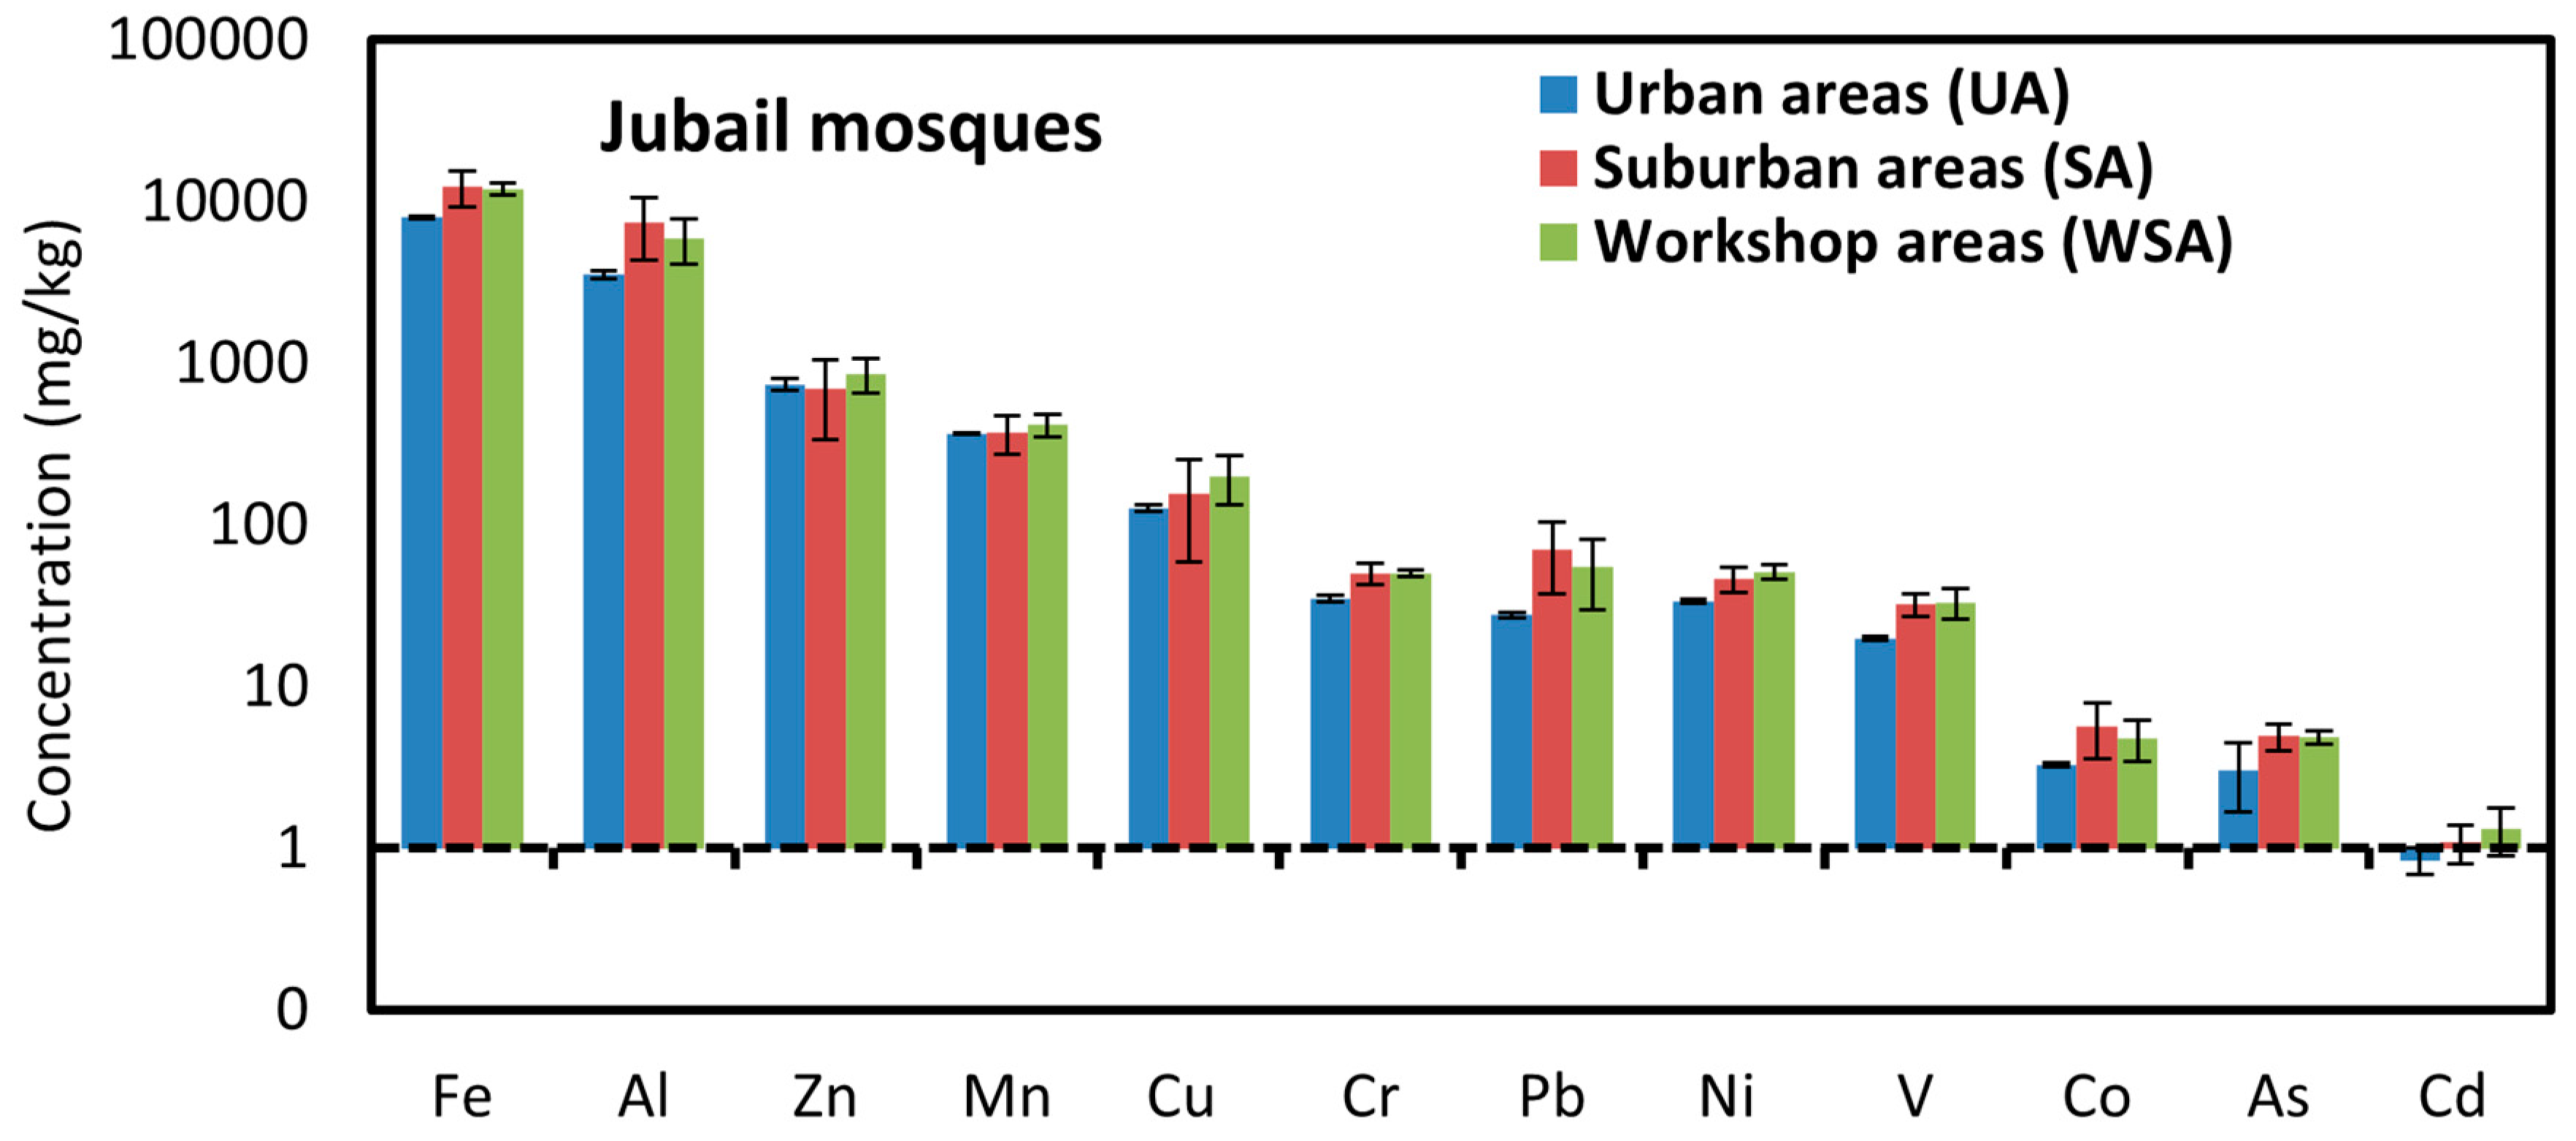
3.1. Concentrations and Distribution of PHEs in ACFD of Mosques

The summary of descriptive statistics on the PHEs concentrations in the ACFD collected from different mosques located in Jubail and Jeddah cities and the Dammam metropolitan area is showed in Table 1. The variations in the standard deviation (SD) and coefficient of variance (CV) for PHEs in the ACFD of the different mosques were observed across the three studied cities. Based on CV values, the variability was classified into four classes: CV values lower than 20% were considered low, CV values that ranged from 21 to 50% were regarded as moderate, the CV values that ranged from 51 to 100% were considered high, and CV values above 100% were deemed extremely high [71]. In the present study, the low CV values for the PHEs in the ACFD suggest a homogenous distribution and dominance of definite types of pollution sources, whereas the moderate to high CV values indicate a heterogeneous PHEs distribution and a notable diversity in the pollutant sources [72,73]. Generally, Cr has extremely high variability in the ACFD of Jeddah mosques (JEMs), Pb is highly variable in the ACFD of JEMs and Jubail mosques (JUMs) as well as the Dammam metropolitan area mosques (DMMs), and Mn and Cr in JUMs and Ni in JEMs are low in variability. Moderate variability is typical for the remaining PHEs in the ACFD of the studied cities’ mosques (Table 1).
Overall, the sequences of the mean concentrations of the PHEs in the ACFD of mosques in each city are as follows: Fe > Al >Zn > Mn > Cu > Pb > Cr > Ni > V > Co > As > Cd in both JUMs and DMMs and Fe > Al > Zn > Mn > Cu > Pb > Cr > V > Ni > Co > As > Cd in JEMs. According to the results, Fe and Al concentrations are the highest in the studied cities’ mosques, whereas As and Cd are the lowest levels. Both Fe and Al are abundant elements in the earth’s crust and are found in the soil [74,75], therefore the highest concentration of these two elements in the ACFD of mosques of the studied cites might suggest that their occurrence could be from natural sources (local soil). Except for Fe, Al, and Mn which are considered crustal elements, the highest total concentrations of the other nine elements (∑Zn, Cu, Cr, Pb, Ni, V, Co, As, and Cd) were found in the ACFD of JEMs followed by DMMs and JUMs. Moreover, the mean values for the total nine elements concentrations were in the following order: 1407 mg/kg (JEMs) > 1239 mg/kg (DMMs) > 1103 mg/kg (JUMs), indicating that these PHEs that accumulated in the ACFD of mosques probably derived from anthropogenic outdoor sources near the mosques, such as vehicular traffic, construction and, destruction activity, waste disposal [76], and the variations in PHEs concentrations of mosques’ dust depends on the intensity of their sources emission in the outdoor surrounding environment, since there are no direct emission sources for these PHEs in the indoor environment. Dust in the indoor environment is a mixture of indoor aerosols, and soil/dust tracked in by foot traffic and ventilation [77]. Outdoor dust/soil contributes up to 45% of the elemental load in indoor dust [78]. Outdoor dust is affected by vehicular traffic emissions such as the wear and tear of tires, diesel fuel and gasoline, lubricating oil grease, bearings’ wear, engine parts, and brake emissions, particularly from high-density traffic areas, and is the main source of elements such as Cd, Cu, Zn, and Ni in indoor environments in that area [79]. It is well known that PHEs’ sources in the indoor environment are natural and anthropogenic, therefore the relatively higher levels of anthropogenic PHEs in the ACFD of JEMs and DMMs than those found in JUMs may likely be attributed to the high population density of these cities with high traffic density and indicates that traffic emissions have made large contributions to PHEs’ pollution [80,81].
The PHEs’ mean concentrations in the ACFD of mosques in the different cities exceeded the global crustal background values [42,43,44] only for Zn, Cu, Pb, As, and Cd. Their mean concentration levels were 10.9, 2.9, 4.1, 2.4, and 5.5 times (JUMs), 11.9, 3.8, 4.3, 2.5, and 6.1 times (DMMs), and 11.9, 3.9, 8.8, 2.1, and 7.2 times (JEMs) higher than those in the global crustal background, respectively (Table 1). Compared with local background soil values in Saudi Arabia, the mean concentration levels of Zn, Cu, Cr, Pb, Ni, As, and Cd in JUMs, DMMs, and JEMs, and both V and Co in DMMs and JEMs only exceeded the local background soil values which were reported in a rural area in Saudi Arabia [45]. The average concentrations of Zn, Cu, Cr, Pb, Ni, As, and Cd were approximately 9.4, 7.9, 1.8, 3.4, 2.0, 1.9, and 2.7 times (JUMs), 10.3, 10.3, 1.2, 3.6, 2.2, 2.0, and 3.0 times (DMMs), and 10.3, 10.6, 2.1, 7.3, 2.3, 1.7, and 3.6 times (JEMs) higher than their concentrations in the local background soil values, respectively. These results indicate that these PHEs in the ACFD of these mosques were strongly affected by anthropogenic sources [62,82,83] and accumulated in varied degrees.
From the comparison of selected measured PHEs, such as Cd, Co, Cu, Pb, and Zn concentrations in the ACFD of mosques in the studied cities with their maximum permissible concentrations (MPC): 3 (Cd), 30 (Co), 100 (Cu), 1500 (Mn), 100 (Pb), and 300 (Zn) mg/kg in soil [84], only Pb in JEMs’ indoor dust and both Cu and Zn in JEMs, DMMs, and JUMs were higher than the MPC and thus might pose significant human health threats [85]. So far, data concerning PHEs associated with mosques’ dust are scarce not only in Saudi Arabia but also around the world. Accordingly, the PHEs’ patterns and levels in the ACFD of JEMs, DMMs, and JUMs were compared with those found in indoor dust from different cities around the world (Table 2). There is a unanimous agreement that As, Co, and Cd are the lowest concentrations PHEs, whereas Al, Fe, Mn, and Zn are the maximum concentrations in indoor dust. The PHEs concentrations in the ACFD of JEMs, DMMs, and JUMs were lower/higher or similar to those found in indoor dust of other cities in the world (Table 2). The observed variations in the PHEs’ concentrations in indoor dust among these cities around the world augment the concept that these PHEs contamination in the indoor environment can be associated with exterior anthropogenic sources diversities such as urbanization activities, traffic density, economic growth, the types of fuels used in different cities, beside the indoor sources such as fuel combustion and smoking, the proximity to the main streets, and the rate of dust infiltration from the outdoor to the indoor environment.
The spatial variations of PHEs concentrations in the ACFD collected from mosques in the different functional areas in Jubail and Jeddah cities and the Dammam metropolitan area is shown in Figure 2. The concentrations of all PHEs (except Al, Fe, and Mn) in the ACFD of mosques located in workshop areas (WSA) and suburban areas (SA) were relatively higher than those found in urban areas (UA). Moreover, the mean concentrations of the total nine anthropogenic elements (∑As, Cd, Co, Cr, Cu, Ni, Pb, V, and Zn) in WSA, SA, and UA mosques, respectively, were 1257, 1060, and 994 mg/kg in Jubail, 1268, 1283, and 1165 mg/kg in Dammam metropolitan area, and 1812, 1221, and 1188 mg/kg in Jeddah.
These results indicate that the pattern of the spatial distribution of PHEs concentrations in the ACFD was possibly related to exterior local anthropogenic sources that were found along/near or in the area surrounding the mosques. Moreover, the measured concentration gradient of indoor PHEs between UA, SA, and WSA mosques is not consistent with a single point source in each city but is more likely to be interpreted by local vehicular density in the streets around the sampling sites.
With regard to mosques, the origin of indoor PHEs emissions was similar, as there are no activities in the investigated mosques in the three studied cities. Therefore, the differences in PHEs levels associated with the ACFD in the various mosques are largely related to outdoor sources of PHEs. Infiltration of exterior particulate-bound PHEs emitted from nearby vehicular traffic into mosques may be the principal origin of PHEs in the mosques’ indoor dust. The high emissions from the vehicular density and the maintenance car activities in WSA, beside the heavy traffic along highways roads that run neighboring SA mosques beside building construction and demolition activities as well as waste disposal [33] lead to an increase in the levels of PHEs in the outdoor dust, and consequently accumulation in mosques indoor dust of WSA and SA. Auto repair activities and mechanic workshops are one of the main sources of the increase in the PHEs levels in dust [67,100,101]. Soils quality of automobile workshops was rated as seriously contaminated with PHEs, since several activities such as the servicing of vehicle engines, panel beating of vehicle bodies and scraping of old vehicle bodies, spraying of vehicles, and greasing and oiling of car parts lead to an increase in the contamination by Cd, Cr, Pb, and Zn [68]. Activities such as the repair and/or charging of batteries, in an automobile mechanic village in Ibadan, Nigeria, are known to be sources of Zn and Cd [102].
The relative contribution of the individual PHE to the ∑PHEs concentrations in the ACFD of JUMs, DMMs, and JEMs is shown in Figure 3. The distributions of the PHEs in the ACFD of UA, SA, and WSA mosques of Jubail and Jeddah cities and Dammam metropolitan area were similar, with the highest contribution for Al, Fe, Mn, and Zn and the lowest for As, Cd, and Co (Figure 3a). Generally, the spatial variations in the individual PHE distributions concentration in indoor dust, of JUMs, DMMs, and JEMs were quite similar. They follow the decreasing pattern: Fe > Al > Zn > Mn > Cu > Pb > Cr > Ni > V > Co > As and Cd (Figure 3b). This similarity in the PHEs distribution highlights that PHEs in the ACFD of the different mosques do share a common source, and maybe traffic emissions around the mosques are the predominant sources of PHEs. The traffic exhausts, lubricating oil residues, tire wear, asphalt, and brake lining wear are well-known anthropogenic sources of PHEs [37,70,103,104].

3.2. PHEs Pollution Characteristics in ACFD of Mosques

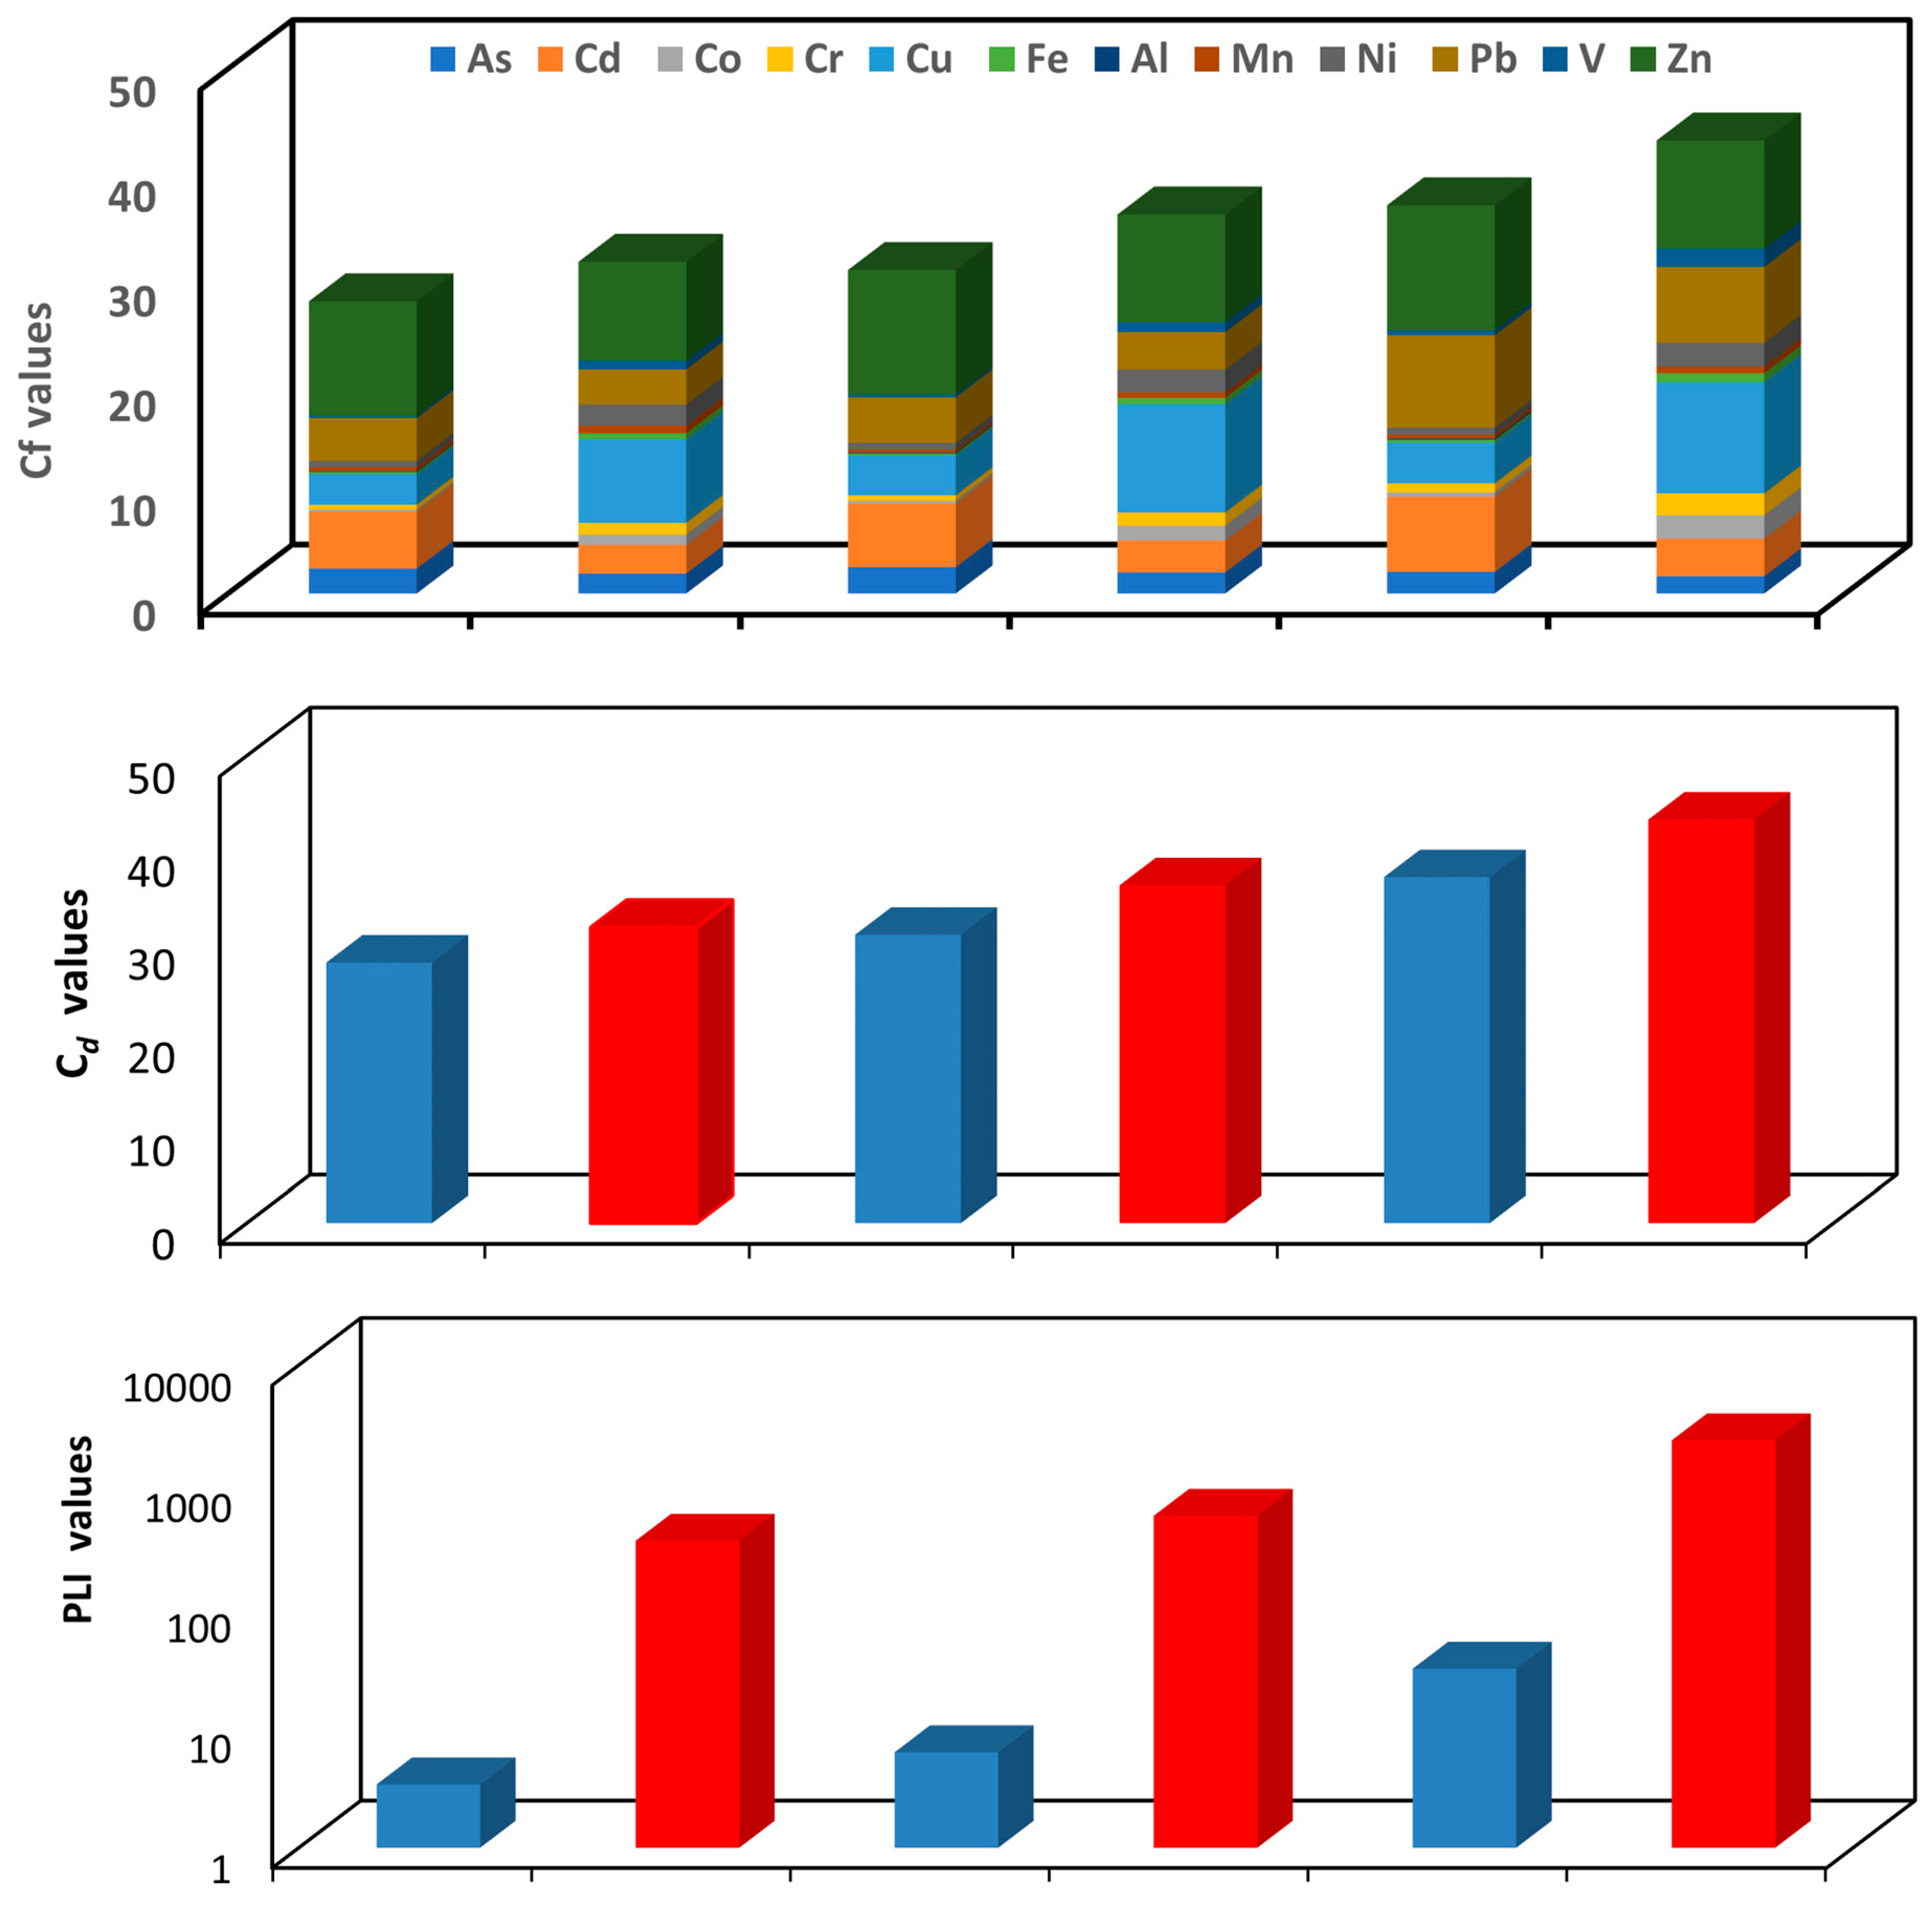
3.2.1. Contamination Factors (Cf) and Degree of Contamination (Cd)

Based on the global crustal and the local background soil data, the calculated contamination factors (Cf) for the PHEs in the ACFD of JUMs, DMMs, and JEMs are shown in Figure 4 and Table S4. They varied from low to very high contamination depending on the classification criteria of Cf (Table S5). The calculated CF values for Fe and Mn in the JUMs, DMMs, and JEMs (based on the global crustal and local background soil data), V, Co, Ni, and Cr in both JUMs and DMMs (based on the global crustal date), and V in both JUMs and DMMs (based on the local background soil data) were lower than one, implying low contamination and their origin from soil and resuspended dust. The Cf values of As and Cu in the JUMs and As in the DMMs and JEMs (based on the global crustal data) and As, Cd, Co, Cr, and Ni in the JUMs, As, Cd, Co, Cr, and Ni in the DMMs and As, Co, Cr, Ni, and V in the JEMs (based on the local background data) were between one and three, indicating moderate contamination. The Cf values of Cd and Pb in the JUMs, Cu, and Pb in the DMMs and Cu in the JEMs (based on the global crustal data) and Pb in both JUMs and DMMs and Cd in the JEMs (based on the local background soil data) were between three and six, suggesting considerable contamination. The Cf values of Zn in the JUMs, DMMs, and JEMs and Pb in JEMs (based on the global crustal and the local background soil data), Cu in the JUMs, DMMs, and JEMs (based on the local background soil data) and Cd in both DMMs and JEMs (based on the global crustal data) were higher than six, implying very high contamination. In general, the results of Cf evaluation indicated that the Cf values for PHEs in the ACFD of the different JUMs, DMMs, and JEMs had a large variation, with the highest Zn, Pb, Cd, and Cu values. The average concentrations of Zn, Cu, Pb, and Cd, respectively, were 9.4, 7.9, 3.4, and 2.7 times (JUMs), 10.3, 10.3, 3.6, and 3.0 times (DMMs), and 10.3, 10.6, 7.3, and 3.6 times (JEMs) higher than their concentrations in the local background data. Moreover, they were 10.9, 2.9, 4.1, and 5.5 times (JUMs), 11.9, 3.8, 4.3, and 6.1 times (DMMS) and 11.9, 3.9, 8.8, and 7.2 times (JEMs) higher than those in the crustal background data, respectively. Hence, it could be confirmed that the pollution of Cd, Cu, Pb, and Zn was notably influenced by anthropogenic activities.
The degree of contamination (Cd) analysis of PHEs in the ACFD of the JUMs, DMMs, and JEMs is shown in Figure 4 and Table S4. They varied from a moderate to a strong degree of contamination to a very strong degree of contamination depending on the classification criteria of Cd (Table S5). Very high degrees of pollution were noticed in JEMs (based on the global crustal and the local background soil data) and in DMMs (based on the local background soil data), whilst a moderate to a strong degree of contamination was found in the JUMs (based on the global crustal and the local background soil data) and in DMMs (based on the global crustal data). The Cd values were 27.9 and 31.6 (JUMs), 30.9 and 36.1 (DMMs), and 37.0 and 43.2 (JEMs) based on the global crustal and local background soil data, respectively. The highest degree of contamination of indoor dust of JEMs than those in both DMMs and JUMs by PHEs may be due to the higher traffic density, which is the main source of these metals in the study areas, in the area around the JEMs than the areas around the DMMs and JUMs.

3.2.2. Pollution Load Index (PLI)

To assess the cumulative contamination load impact by ∑PHEs, the pollution load index (PLI) was calculated. The calculated PLI for the total PHEs in the ACFD of JUMs, DMMs, and JEMs are represented graphically in Figure 4 and listed in Table S4. Depending on the classification criteria of PLI (Table S5), the PLI values in the ACFD collected from all mosques indicated the presence of a cumulative pollution load of PHEs. The highest PLI values were found in JEMs followed by DMMs, and JUMs. The PLI values were 3.35 and 349.9 (JUMs), 6.2 and 563.5 (DMMs), and 30.5 and 2378.5 (JEMs) based on the global crustal and the local background soil data, respectively, suggesting a high pollution load (heavy contamination) of PHEs in all studied mosques. This variety of PHEs pollution levels between the mosques located in the three studied cities almost reflected the effect of anthropogenic activities. Therefore, the highest pollution load of all PHEs in the Jeddah mosques could be due to the impact of high traffic emissions around them. Previous studies have concluded that car emissions are the major source of heavy metals in interior dust [21,105,106,107].

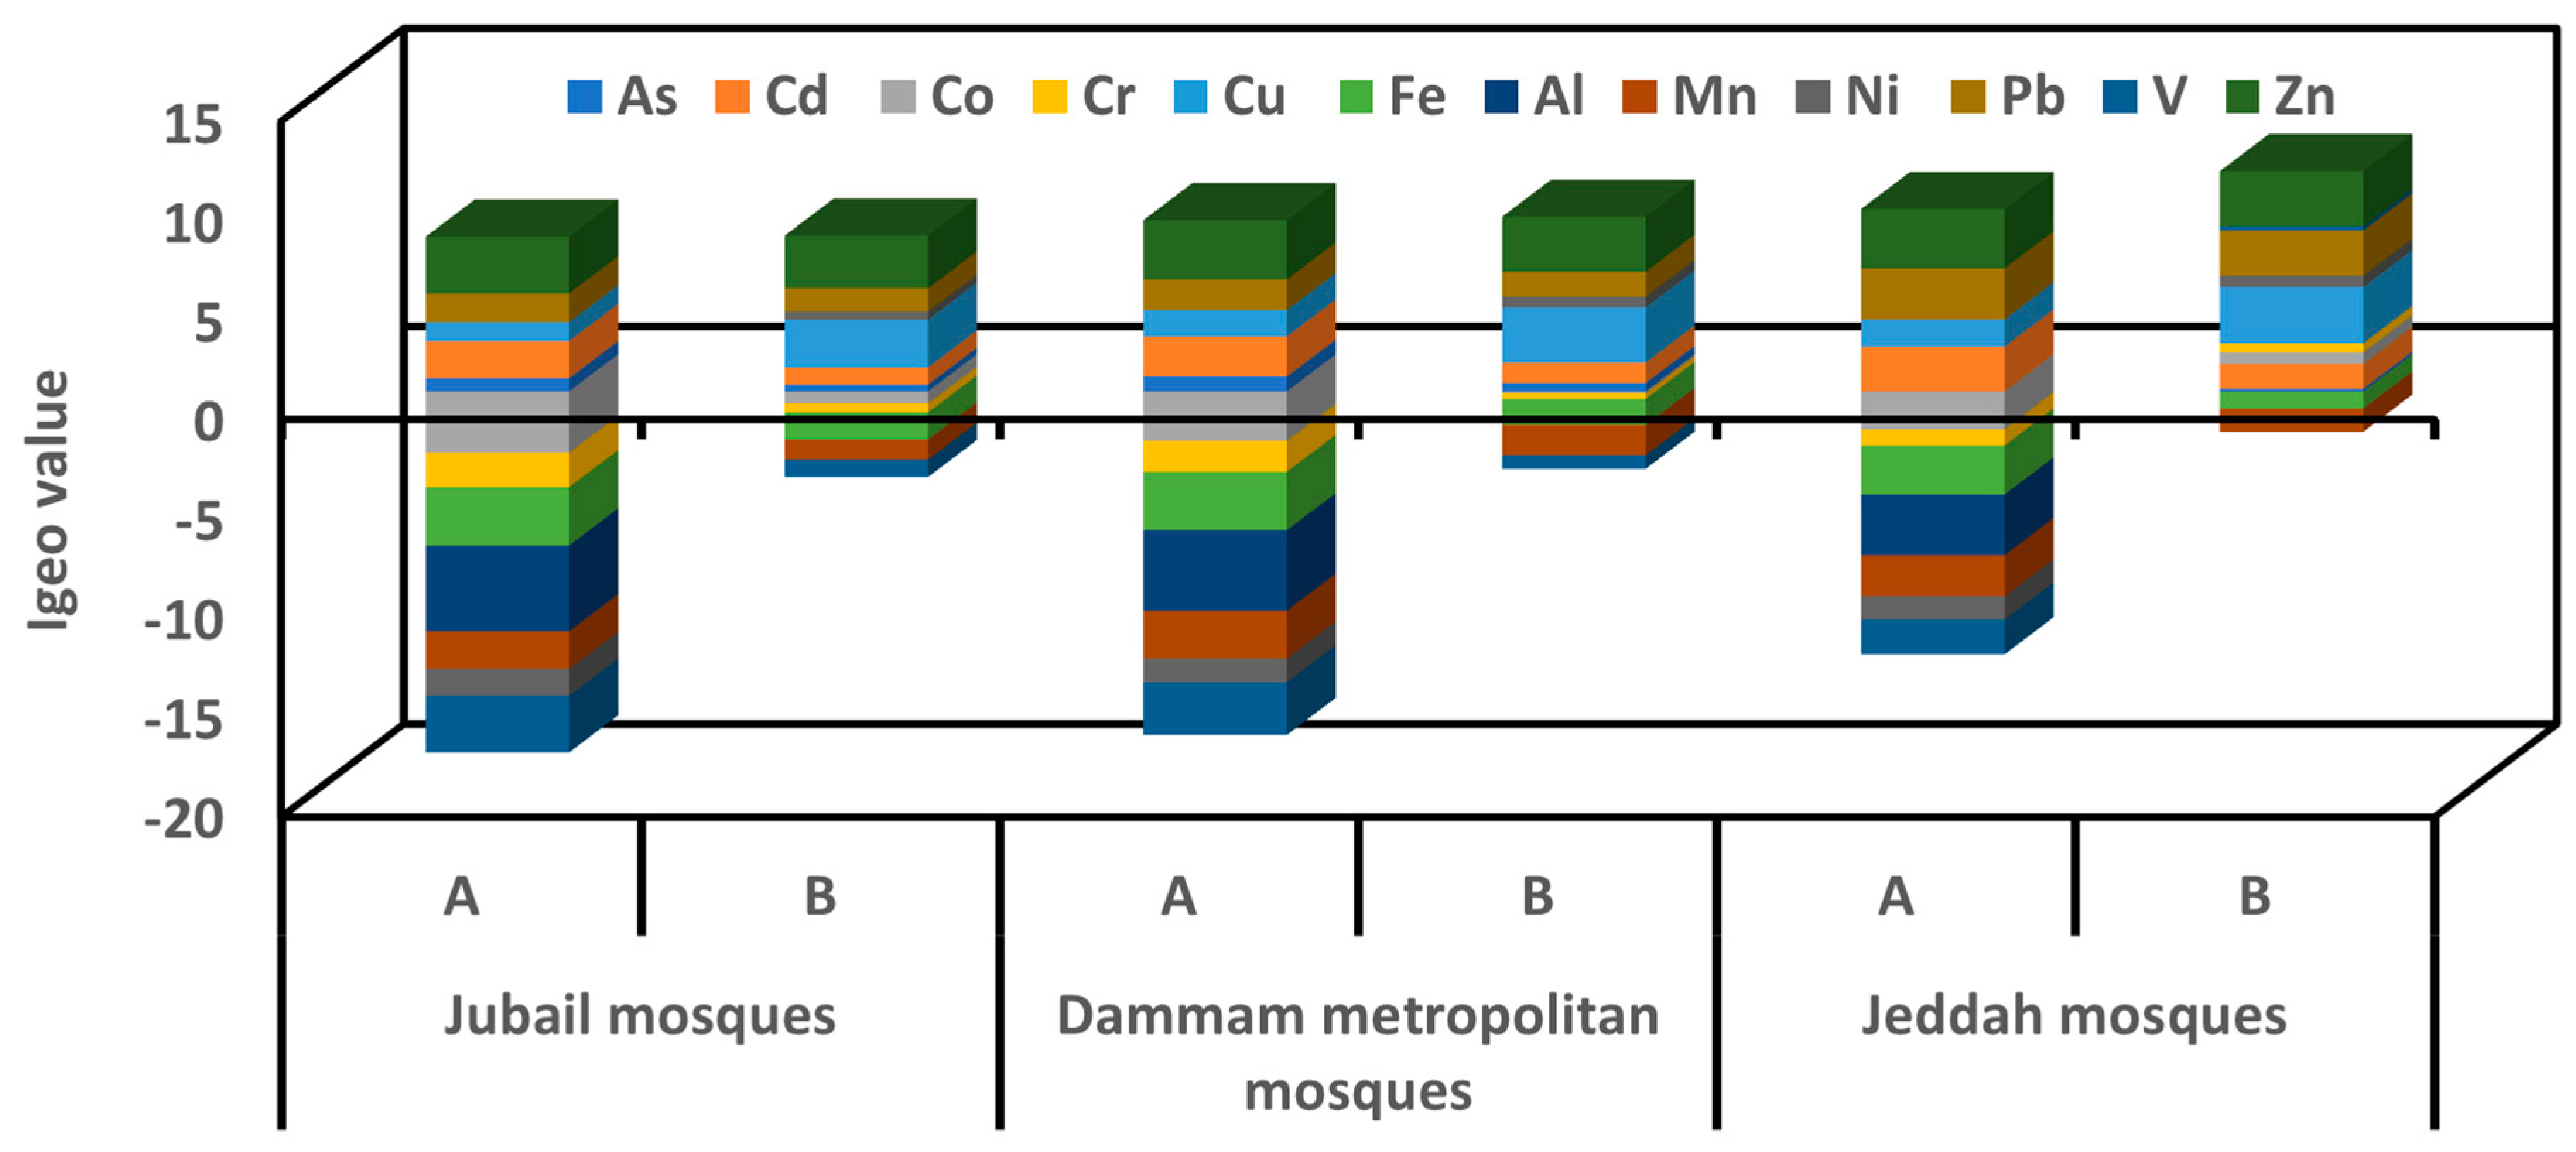
3.2.3. Geo-Accumulation Index (Igeo)

The Igeo values for the PHEs in the ACFD of the JUMs, DMMs, and JEMs are calculated and interpreted based on the global crustal and the local background soil data and are shown in Figure 4 and Table S4. The highest Igeo values were found for Cd, Cu, Pb, and Zn whereas the lowest values were found for Co, Cr, Fe, Mn, Ni, and V. According to the criteria of pollution based on Igeo value (Table S5), the ACFD was unpolluted (based on the global crustal and the local background soil data) by Fe and Mn in the JUMs, DMMs, and JEMs, by Co, Cr, and V in both JUMs and DMMs (based on the global crustal and the local background soil data), Co, Cr, Ni and V in the JEMs (based on the global crustal data), Ni in both JUMs and DMMs (based on the global crustal data). The ACFD was uncontaminated to moderately contaminated by As (based on the global crustal and the local background soil data) in the JUMs, DMMs, and JEMs, Cu in the JUMs (based on the global crustal data), Cd and Ni (based on the local background soil data) in both JUMs and DMMs, and Co, Cr, Ni, and V (based on the local background soil data) in the JEMs; moderately contaminated by Cd and Pb in JUMs, Cd, Cu, and Pb in the DMMs, and Cu in the JEMs (based on the global crustal data) and Pb in both DMMs and JUMs and Cd in the JEMs (based on the local background soil data); and moderately polluted by Zn (based on the global crustal and the local background soil data) in the JUMs, DMMs, and JEMs, Cu (based on the local background soil data) in the JUMs, DMMs, and JEMs and Cd and Pb (based on the global crustal data) in the JEMs. High Igeo values for Zn, Cd, Cu, and Pb in the ACFD of the different studied mosques can be attributed to the increase in the outdoor emissions of these elements that are released from exterior anthropogenic sources, consequently, the increase in their content in indoor dust of mosques. High levels of metal pollution arise not only from growing socio-economic activities that include traffic density but also from the insufficient adequate disposal protocols for many spent products such as paint, oil, grease, fuel, and tires [108,109].

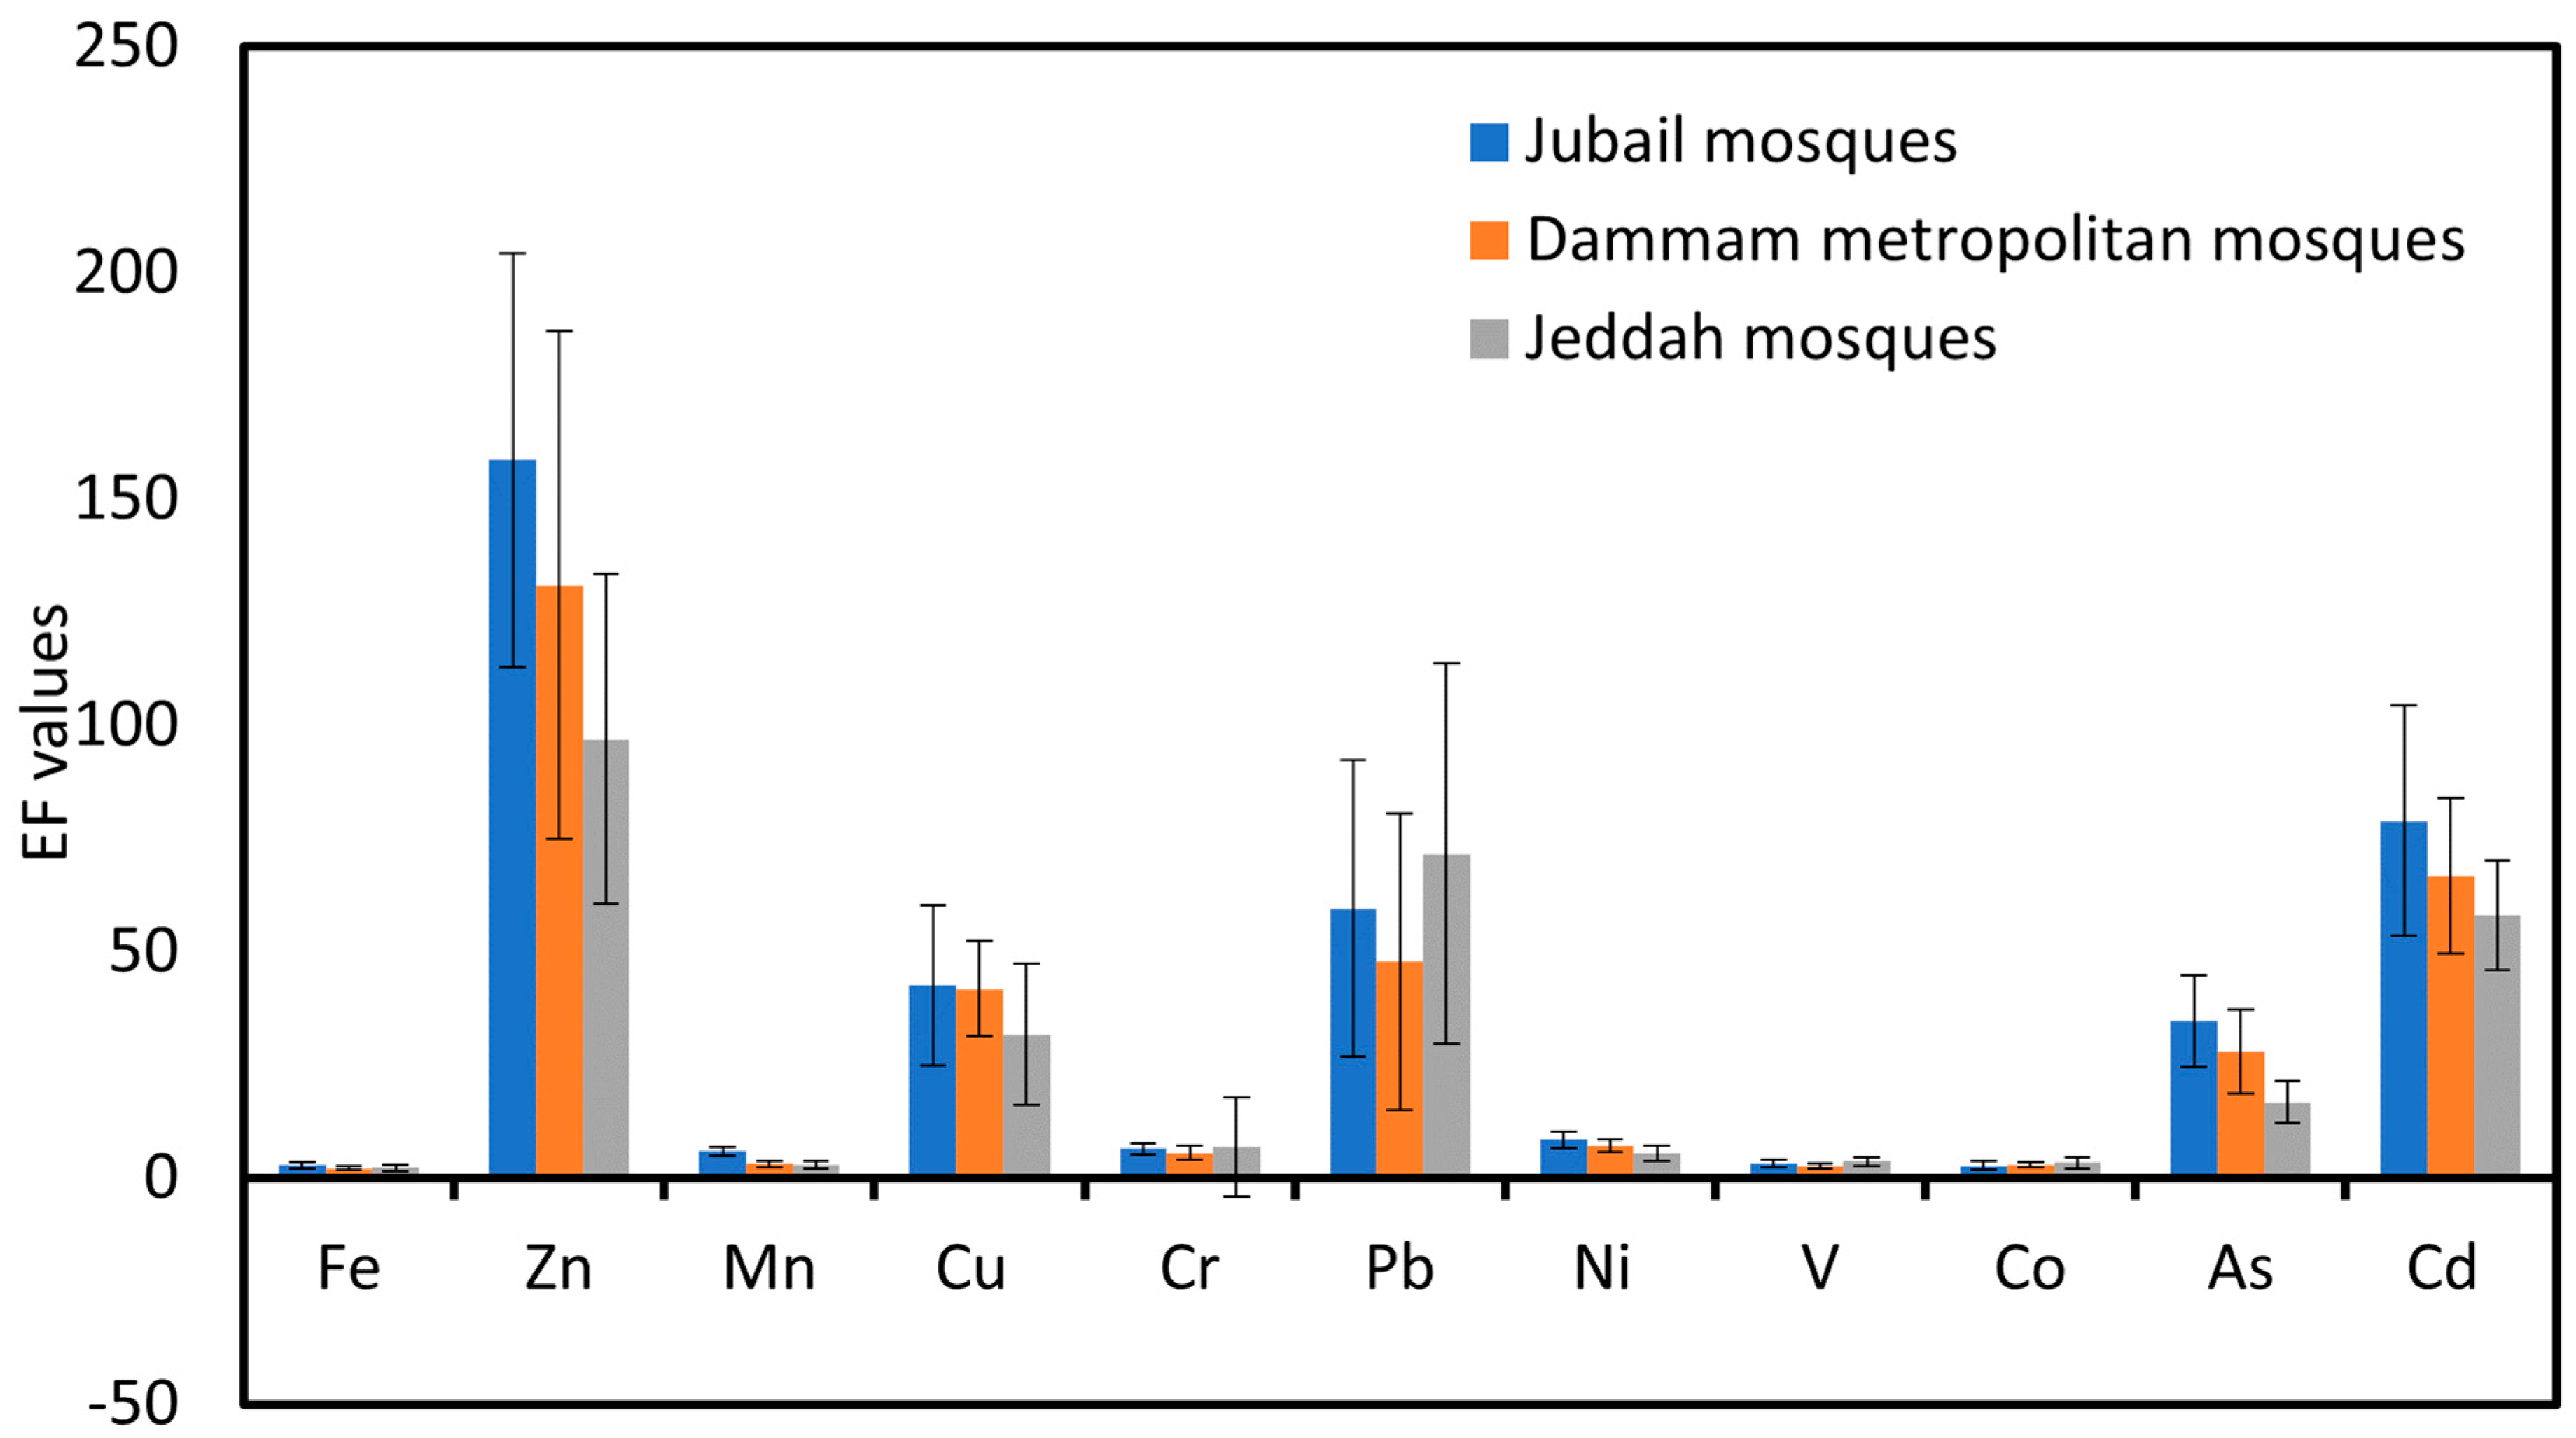
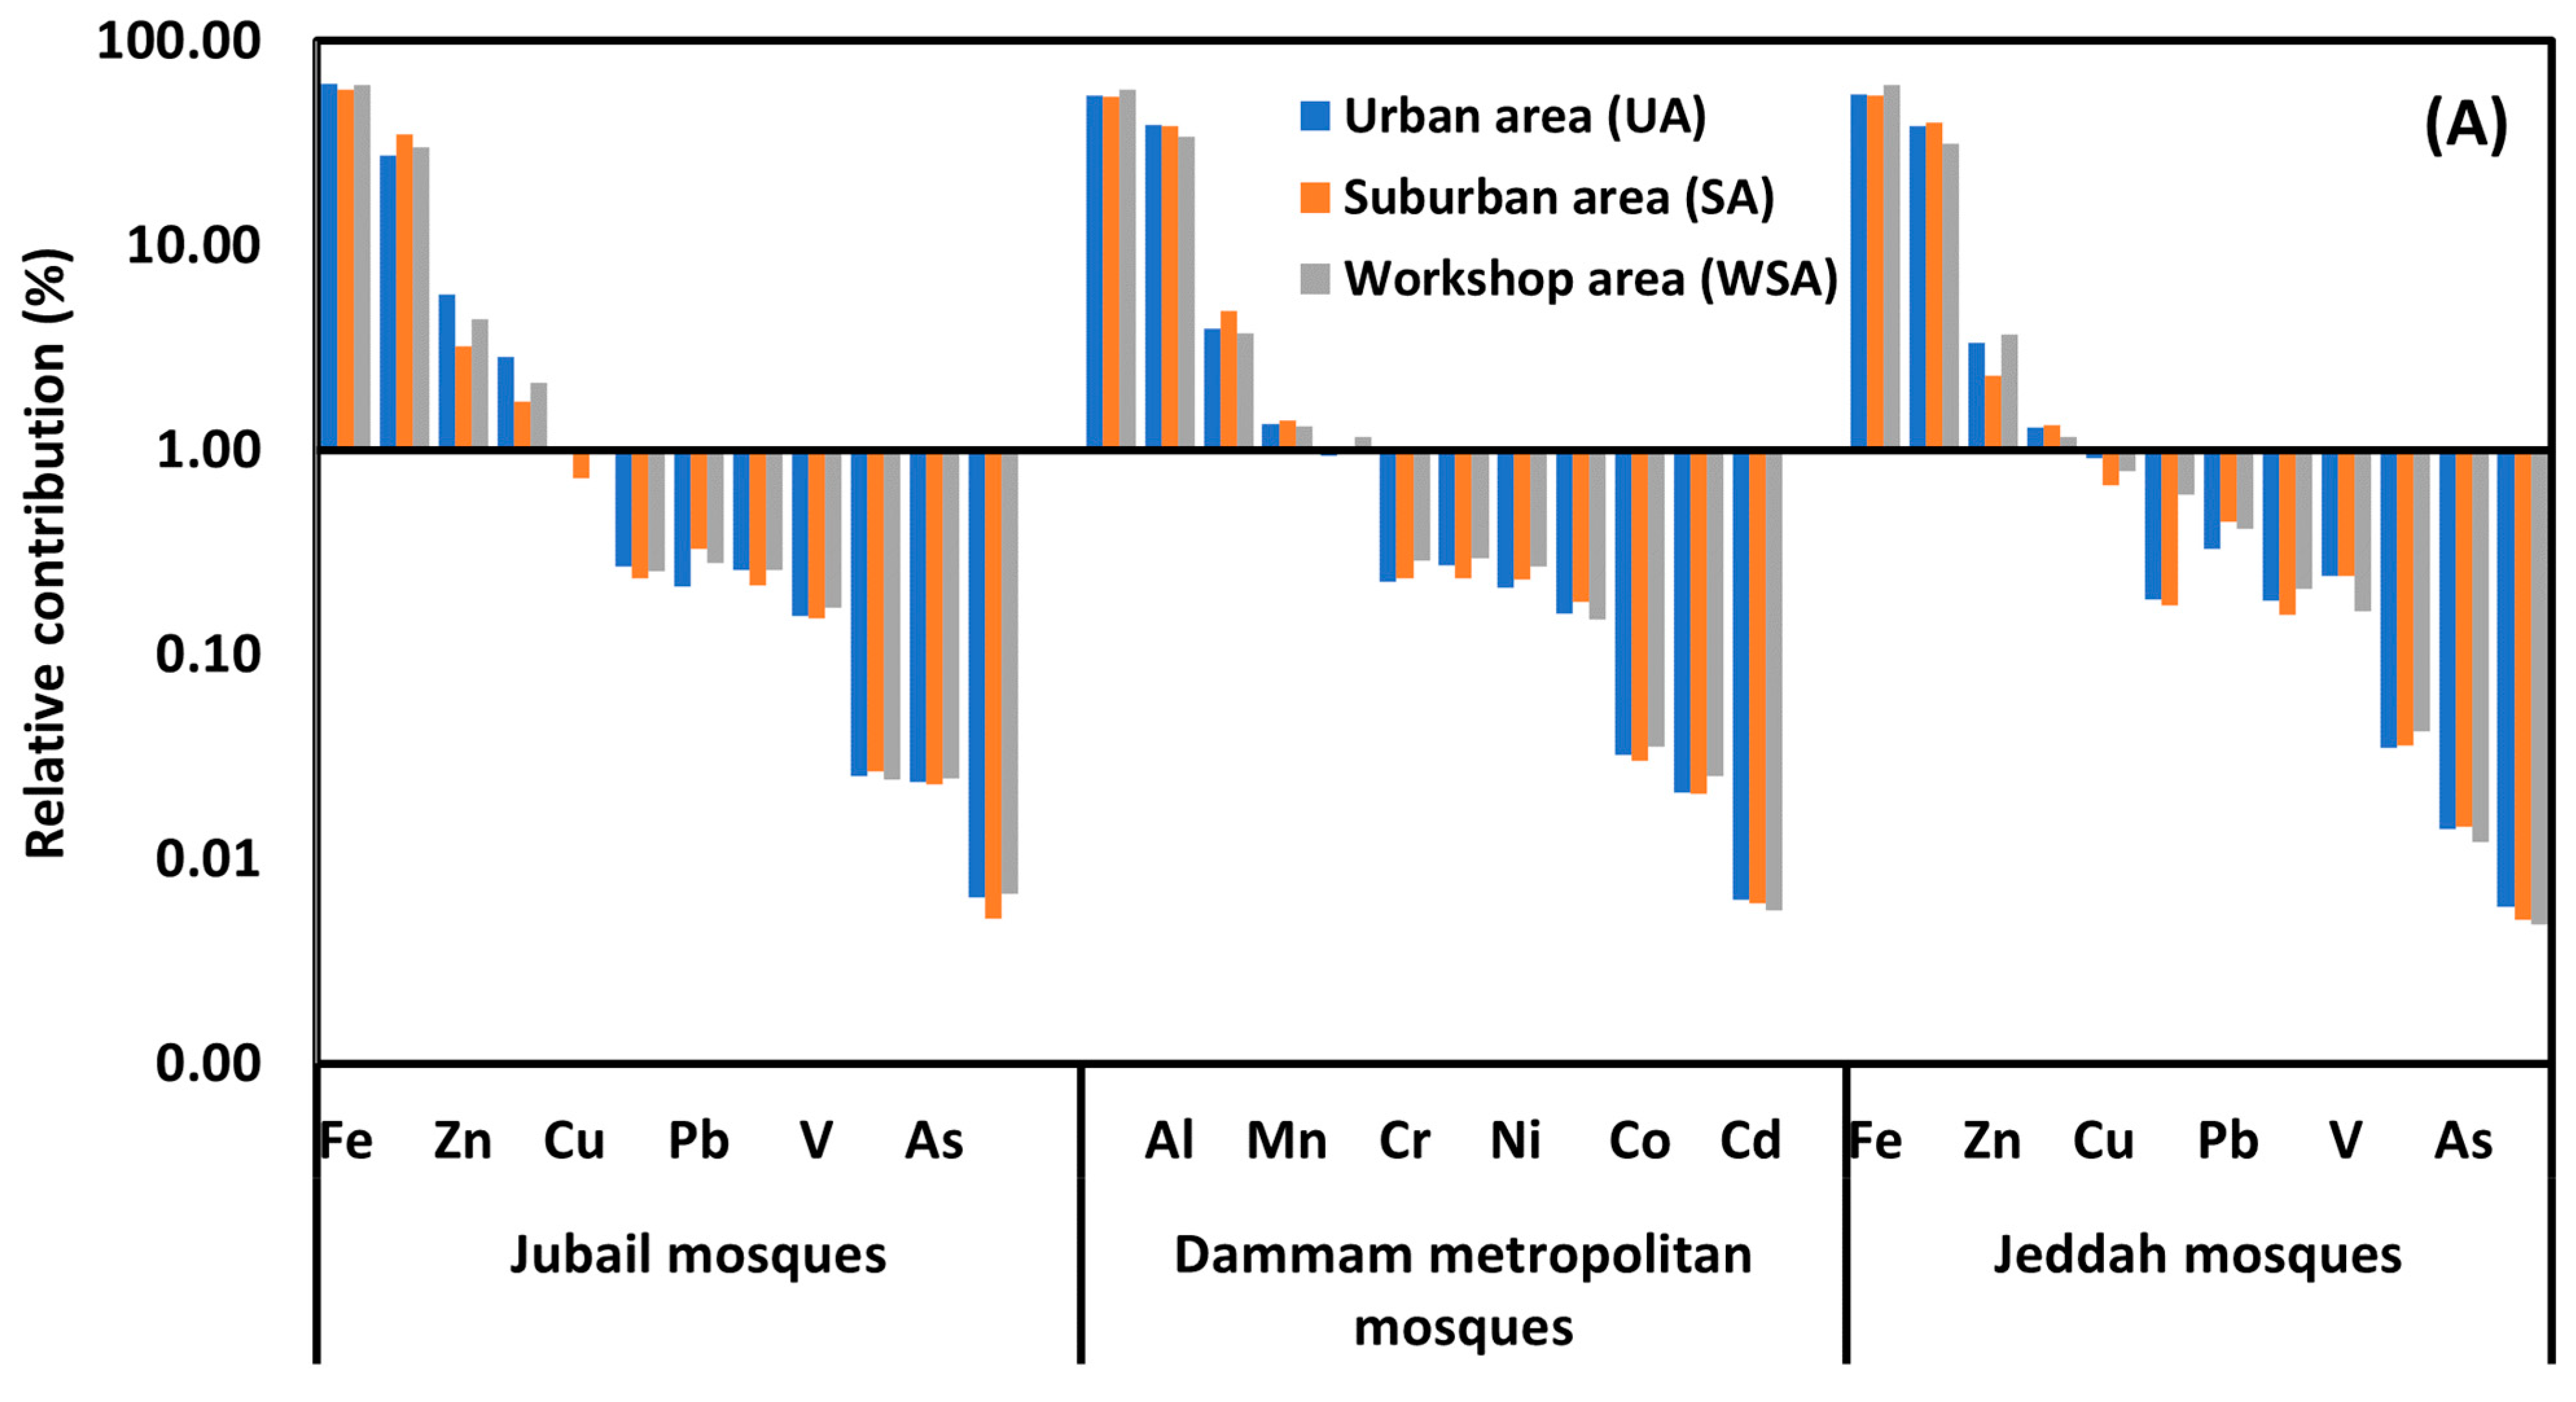
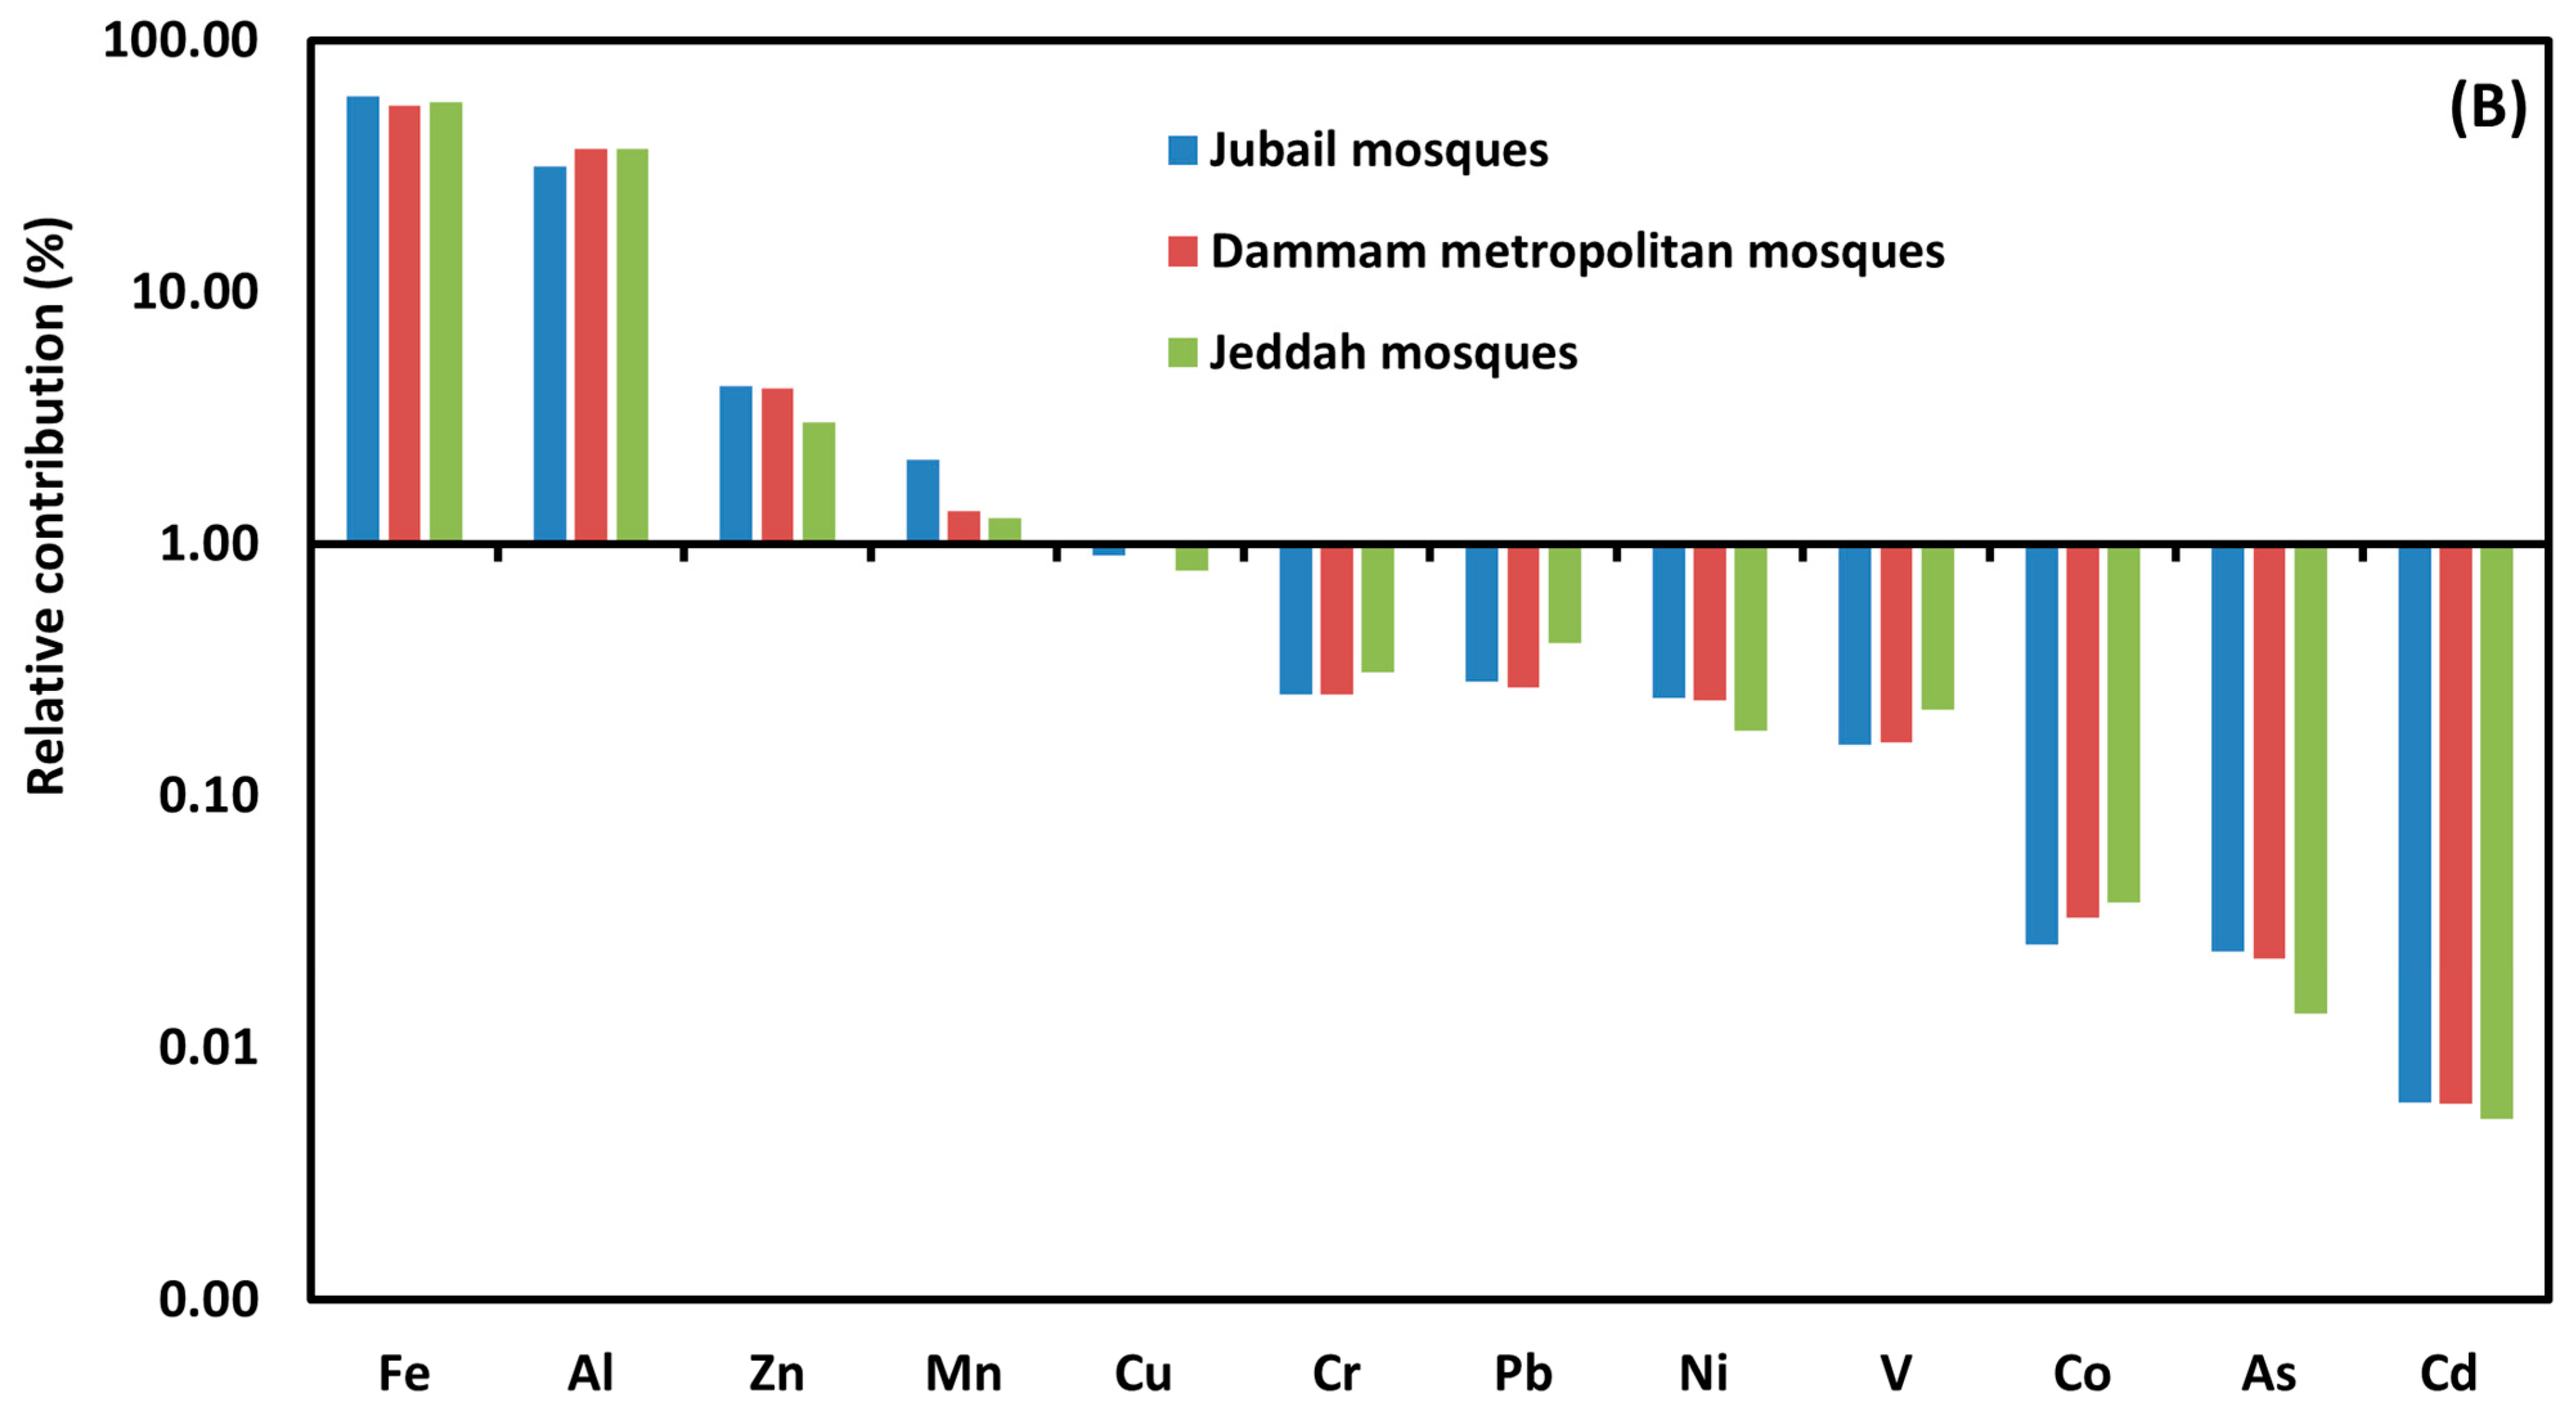
3.2.4. Enrichment Factor (EF)

The calculated enrichment factors (EFs) for measured PHEs in the ACFD of the JUMs, DMMs, and JEMs are represented graphically in Figure 5. The degree of enrichment varied from moderate to extreme enrichment according to the classification criteria of the EF values (Table S5). The mean EF values of PHEs in the ACFD displayed the following decreasing trend: Zn > Cd > Pb > Cu > As > Ni > Cr > Mn > V > Fe > Co in the JUMs, Zn > Cd > Pb > Cu > As > Ni > Cr > Mn > V > Co > Fe in the DMMs, and Zn > Pb > Cd > Cu > As > Cr > Ni > V > Co > Mn > Fe in the JEMs (Figure 5). Based on the calculated EF values for the PHEs in the ACFD of the JUMs, DMMs, and JEMs and their classification criteria, the EF values ranging from two to five (moderate enrichment) were found for Co, Fe, and V in JUMs, DMMs, and JEMs, and Mn in both DMMs and JEMs. EF values from 5 to 20 were detected for Mn in the JUMs, As in the JEMs, and both Cr and Ni in the JUMs, DMMs, and JEMs, suggesting that they were significantly enriched, whilst values from 20 to 40 were found for Cu in the JEMs and As in both JUMs and DMMs, indicating they were strongly enriched. Moreover, EF values higher than 40 were recorded for Cu in both JUMs and DMMs and Zn, Pb, and Cd in the JUMs, DMMs, and JEMs, suggesting that they were extremely enriched. These results indicated that the seven PHEs (As, Cd, Cr, Cu, Pb, Ni, and Zn) in the ACFD of the JUMs, DMMs, and JEMs had degrees of enrichment levels that varied from significantly to extremely highly enriched, indicating that the origin and the accumulation of these PHEs in the ACFD of these mosques was almost completely influenced by the exterior anthropogenic sources. Anthropogenic PHEs such as As, Cd, Cr, Cu, Ni, Pb, and Zn are mainly released from traffic emissions, fossil fuel combustion [21,83,97,110,111,112,113,114,115], greasing oil, and tire wear and tear [75]. Moreover, the corrosive process of the wearing down of the wares, walls, batteries, street safety barriers, lamps, and railings under the effect of weather conditions may lead to an increase in the release of PHEs such as Cd, Cr, Cu, and Zn in urban dust [89,116,117,118,119]. Although Pb was phased out in Saudi Arabia in 2011 [120], it was discovered as extremely enriched in the ACFD-collected samples from all mosques of the three studied cities. This indicates that the historical contamination of Pb can persist in the local environment as a fraction of traffic-produced street dust with its long half-life [21,45,121,122], and can also be resuspended [123,124].

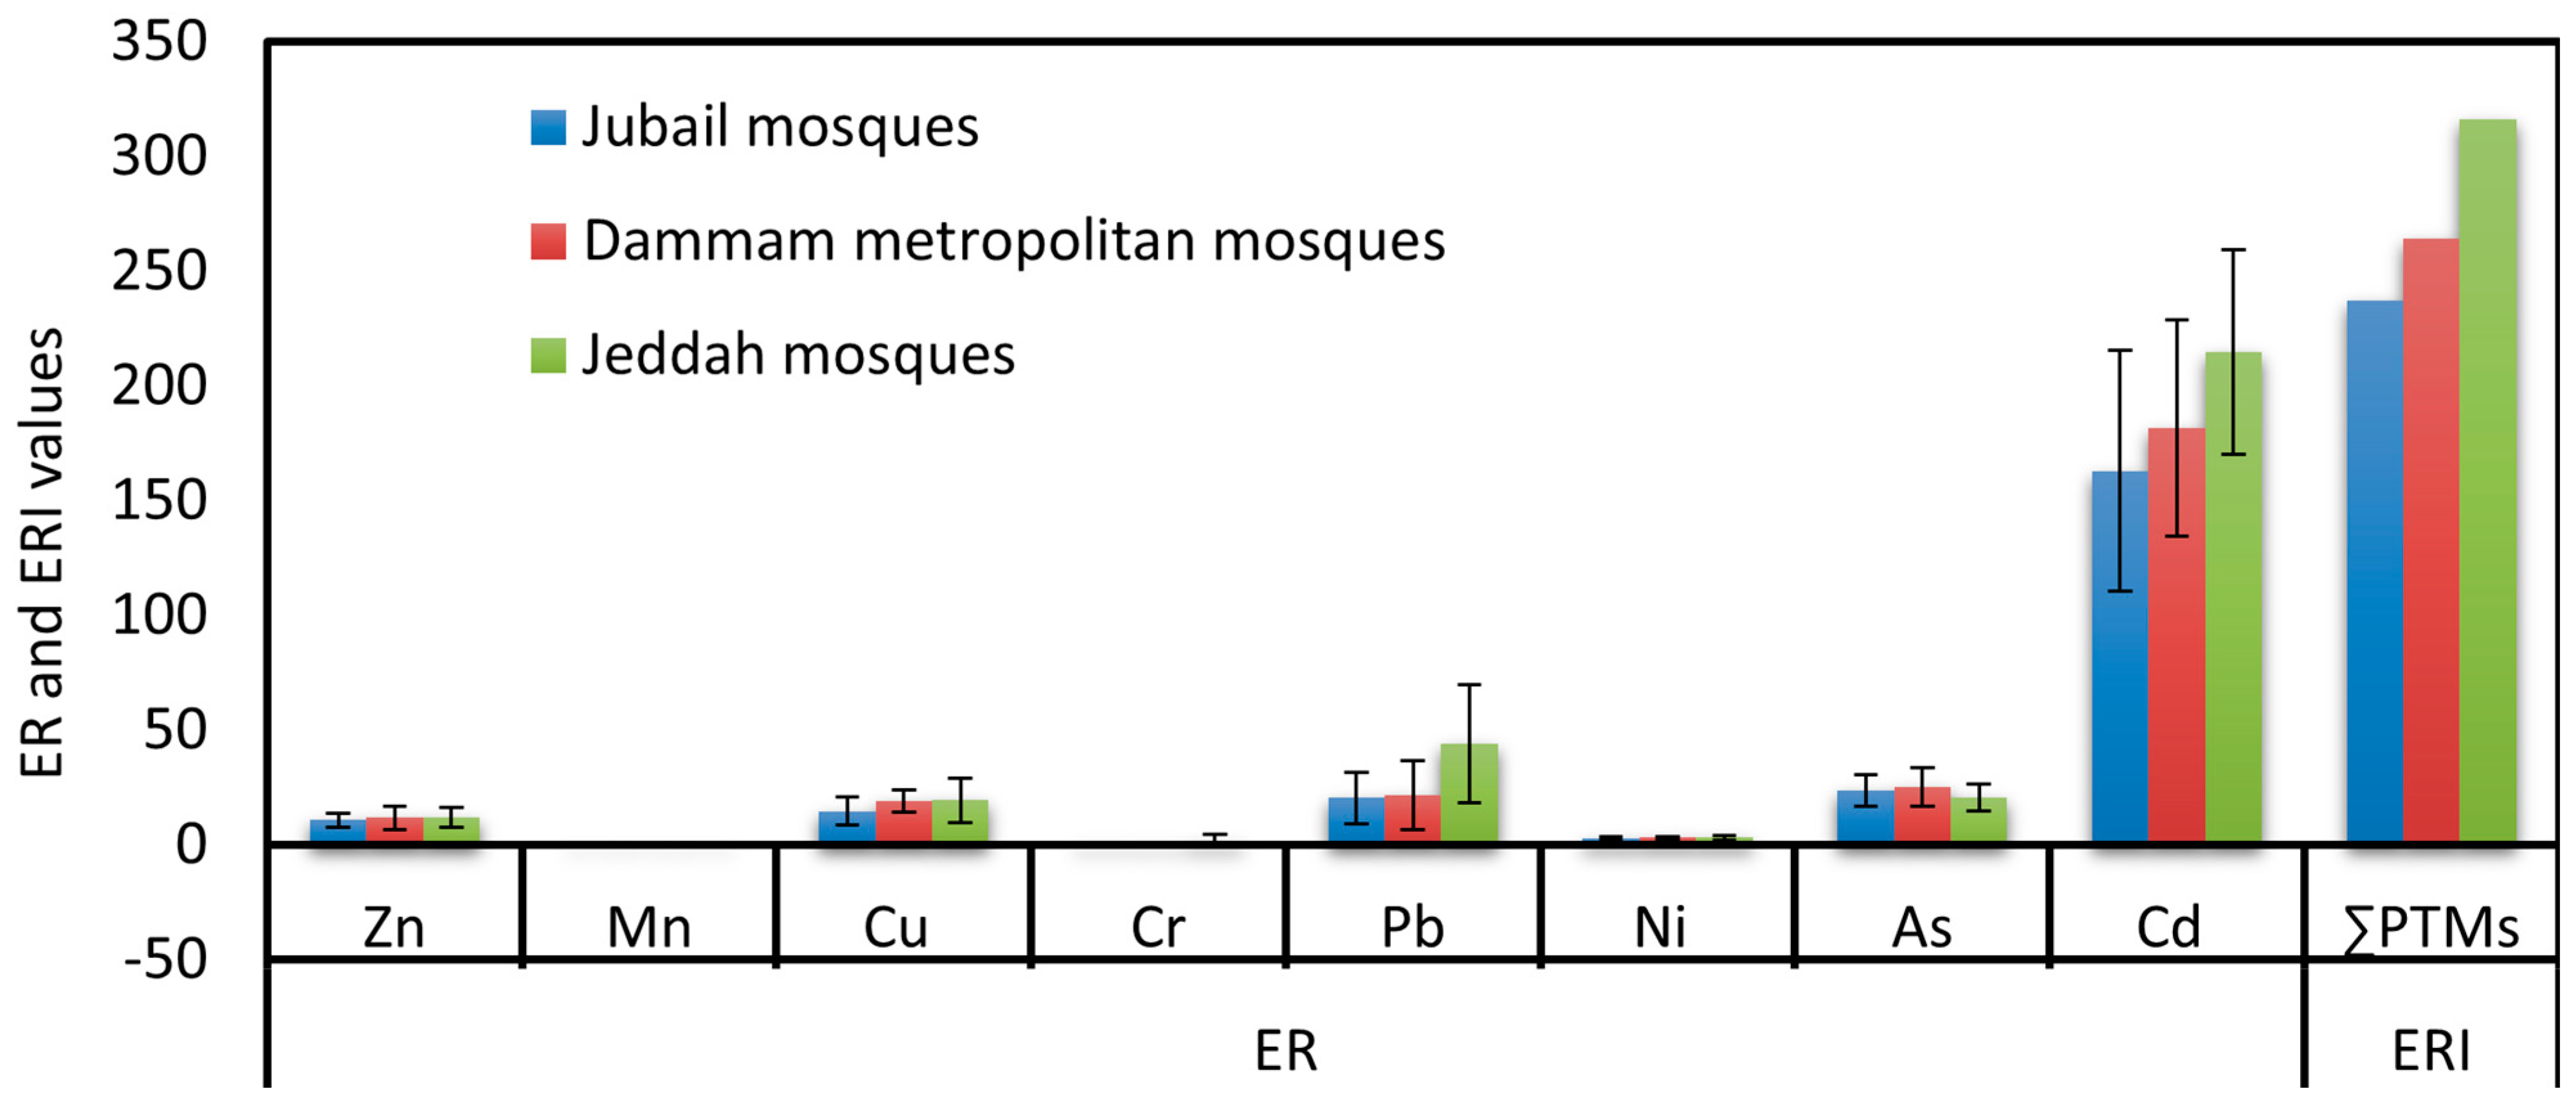
3.2.5. Ecological Risk Assessment

The potential ecological risk factors (ER) for As, Cd, Cr, Cu, Mn, Ni, Pb, and Zn in the ACFD of the JUMs, DMMs, and JEMs were calculated and shown in Figure 6. The pattern of ER values in descending order was Cd > As > Pb > Cu > Zn > Ni > Cr > and Mn in both JUMs and DMMs and Cd > Pb > As > Cu > Zn > Ni > Cr > Mn in JEMs. The highest ER values were 163.1, 181.7, and 214.7 for Cd, 23.9, 25.3, and 20.7 for As, and 20.5, 21.7, and 44.1 for Pb in the JUMs, DMMs, and JEMs, respectively. Depending on the classification criteria of ER (Table S5), As, Cr, Cu, Mn, Ni, and Zn in the JUMs, DMMs, and JEMs and Pb in both JUMs and DMMs showed lower ecological risk (ER < 40). ER values of 40 ≤ ER < 80 were found for Pb in the JEMs, indicating a moderate risk to the ecological environment. On the other hand, Cd showed a higher risk to the ecological environment.

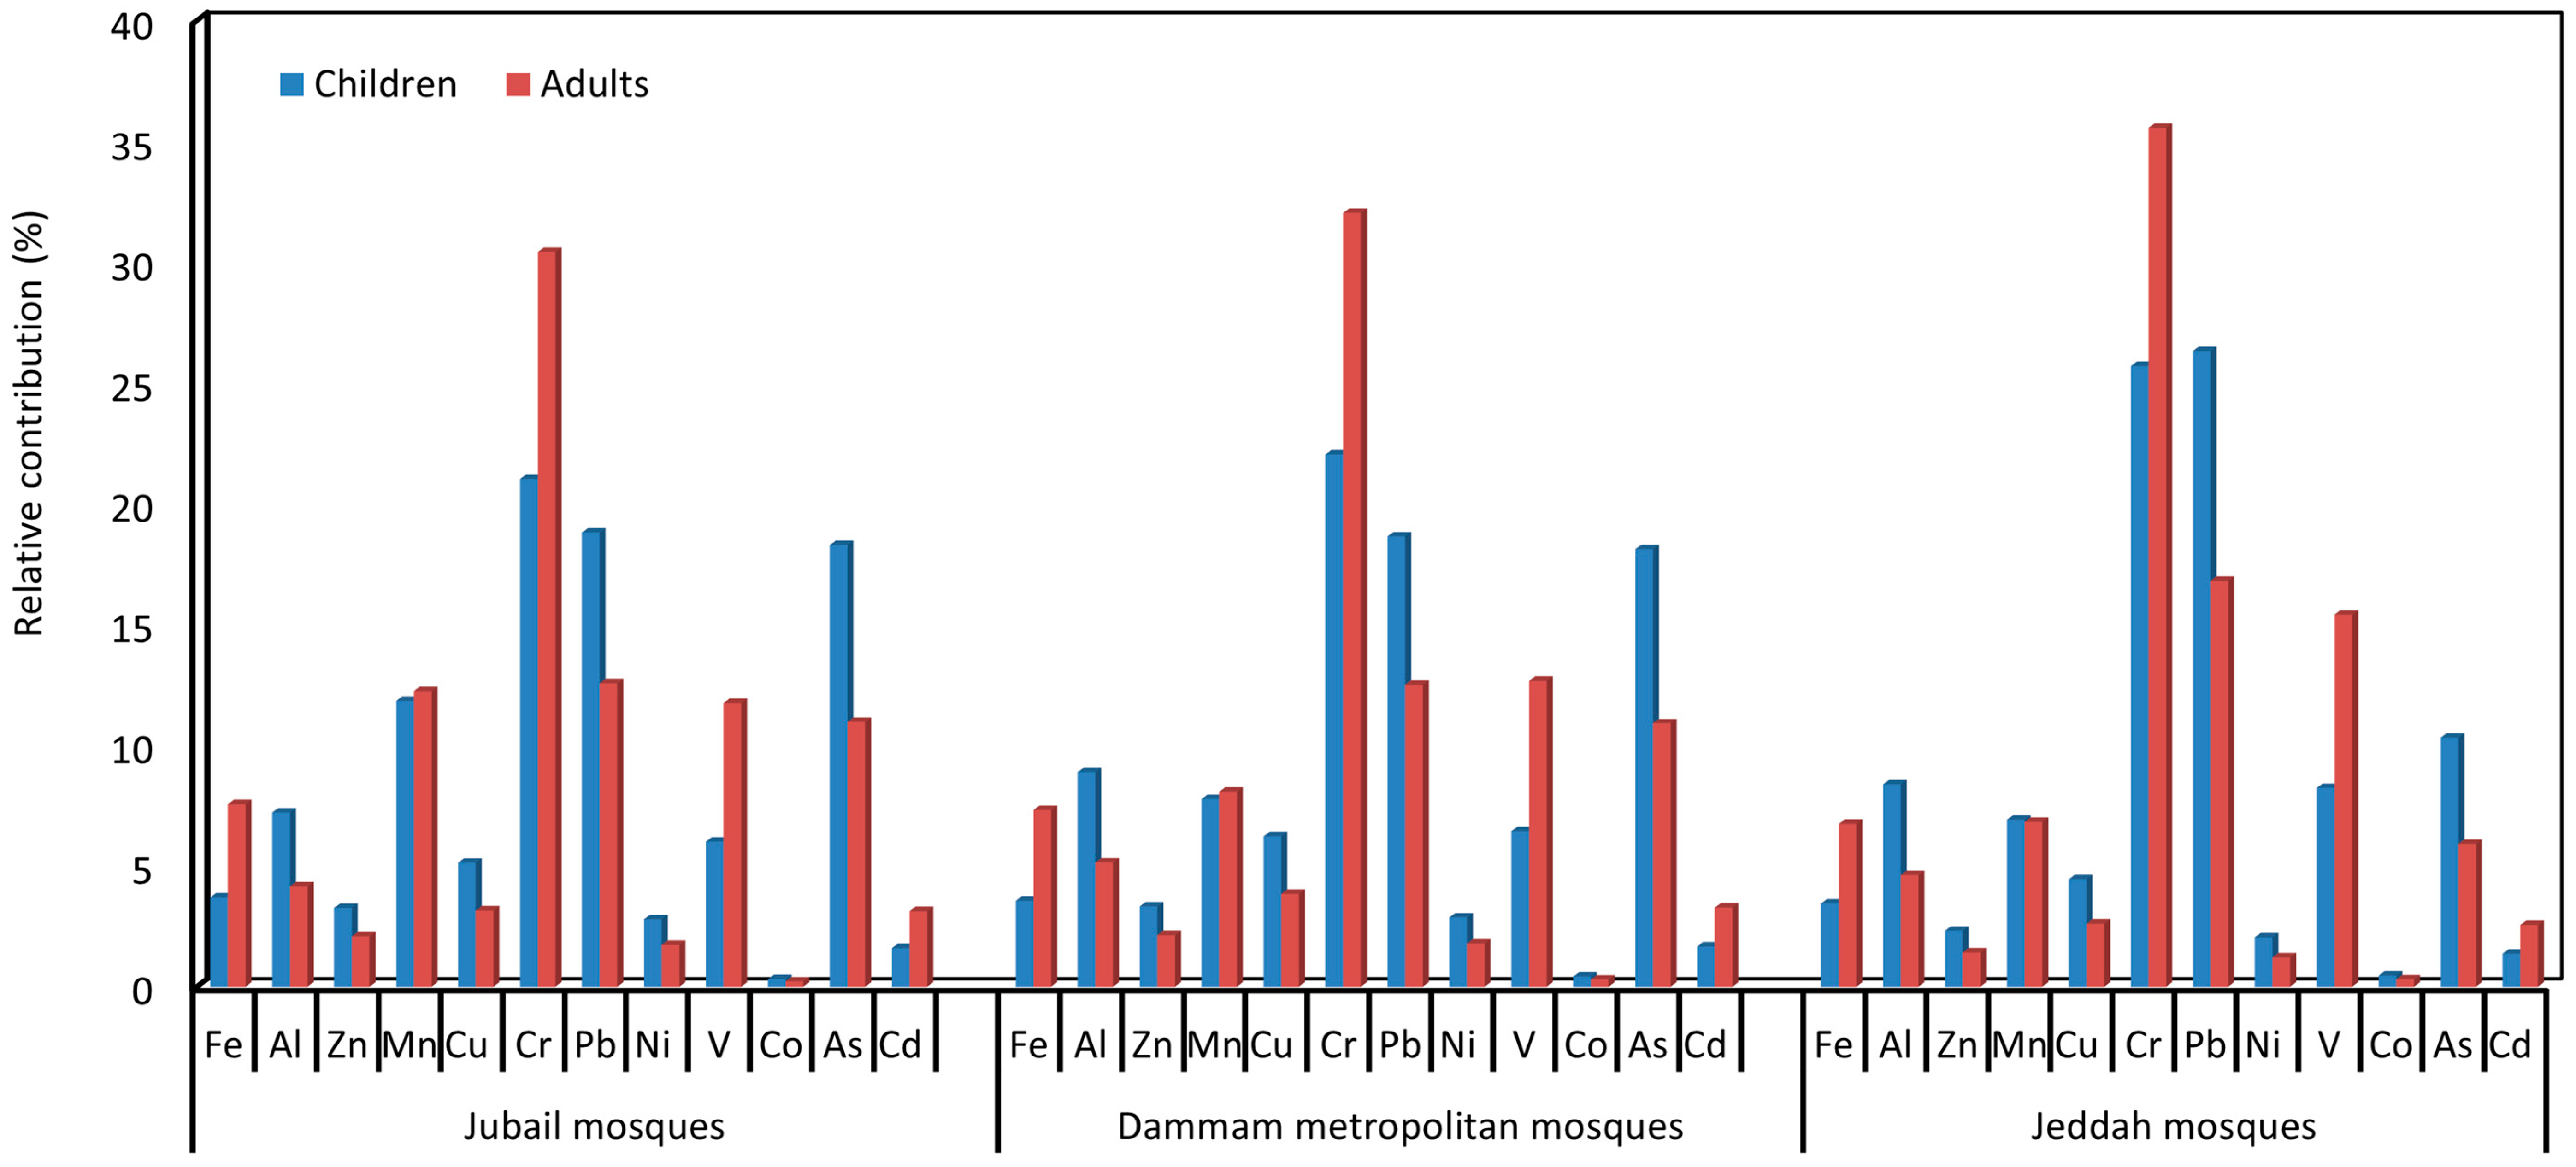
3.3. Human Health Risk Evaluation

To assess the health risks for children and adults from exposure to PHEs associated with the ACFD of the JUMs, DMMs, and JEMs mosques, the carcinogenic and non-carcinogenic health risks for both children and adults were calculated via the direct hand–mouth ingestion, nasal–oral inhalation, and dermal contact. The results were evaluated based on the computed values of the hazard quotients (HQs: HQing, HQinh., HQdermal), hazard index (HI, (∑exposure routes)), incremental lifetime cancer risk (ILCR), and cancer risk (CR, (∑exposure routes)).

3.3.1. Non-Carcinogenic Risk

Based on the concentrations of PHEs associated with the ACFD of the various JUMs, DMMs, and JEMs in Table 1 and the values of exposure factors for children and adults (Tables S1–S3), the HQing, HQinh, HQdermal, and HI for both children and adults exposed to PHEs were computed and listed in Table 3, Table 4 and Table 5. The values of HQ suggest that HQing was most likely to pose a non-cancer risk of more than both HQdermal and HQinh. The values of HQing, HQinh, and HI for children were, respectively, 9.1, 1.48, and 5.2 (JUMs), and 9.2, 2.8, and 5.5 (DMMs) and 9.4, 2.8, and 5.0 (JEMs) times more than that of adult in the JUMs, DMMs, and JEMs, whereas HQdermal for adults were 2.1 (JUMs), 2.0 (DMMs), and 2.0 (JEMs) times more than that of children. The increased tendency of children to ingest dust-associated PHEs possibly due to their crawling and hand-to-mouth movements [125,126] led to an increase in the HQing and HI values for children more than those for adults; this is consistent with previous research findings [21,67].
The percentage risk contributions of HQing, HQinh, and HQdermal to the HI for the total elements (∑PHEs) were 93.2, 2.8, and 4.0% (JUMs), 93.6, 2.4, and 4.0% (DMMs), and 93.2, 2.3%, and 4.5% (JEMs) for the children, respectively. Similarly, the risk contributions of HQing, HQinh, and HQdermal to the HI for adults were 52.3, 5.3, and 42.5 in JUMs, 52.7, 4.6, and 42.7% in DMMs, 50.0, 4.2, and 45.9% in JEMs, respectively. Accordingly, ingestion for both adults and children was the main exposure pathway of PHEs associated with the ACFD of the JUMs, DMMs, and JEMs, which is similar to the findings of numerous previous studies [21,127,128].
According to USEPA (2011), it is well known that the HQs ≥ 1 indicate an unsafe risk (harmful health effects), whereas HQs < 1 suggest an acceptable hazard level. Based on the exposure to PTEs concentrations for children and adults in the JUMs, DMMs, and JEMs, HQing, HQinh, HQdermal, and HI values for the individual PTE and ∑PTEs were within the safe level (<1) and indicate that there was no non-carcinogenic risk via the various exposure routes (Table 3, Table 4 and Table 5). With regard to the contribution of HI for the individual PHE to the ∑HI for the total measured PHEs (Figure 7), Cr, As, and Pb represent the most predominant elements for children, accounting for 21.0%, 18.3%, and 18.6% (JUMs), 22.4%, 18.1%, and 18.6% (DMMs) and 25.7%, 10.3%, and 26.3% (JEMs) of the values of ∑HI, respectively. Meanwhile, for adults, Cr, Mn, and Pb in JUMs, V, Cr, and Pb in both DMMs and JEMs were the dominant elements, accounting for 30.4%, 12.2, and 12.6% (JUMs), 12.7%, 32.0%, and 12.5% (DMMs) and 15.4%, 35.6%, and 16.8% (JEMs) of the values of ƩHI, respectively. As a result, the probable non-carcinogenic risk from exposure to V, Cr, Mn, As, and Pb, in the indoor dust of JUMs, DMMs, and JEMs cannot be neglected, since any further increase in the anthropogenic activities may raise their contamination levels and hence the health risk. Consequently, PHEs require more continuous and periodic studies in the indoor environment of mosques.

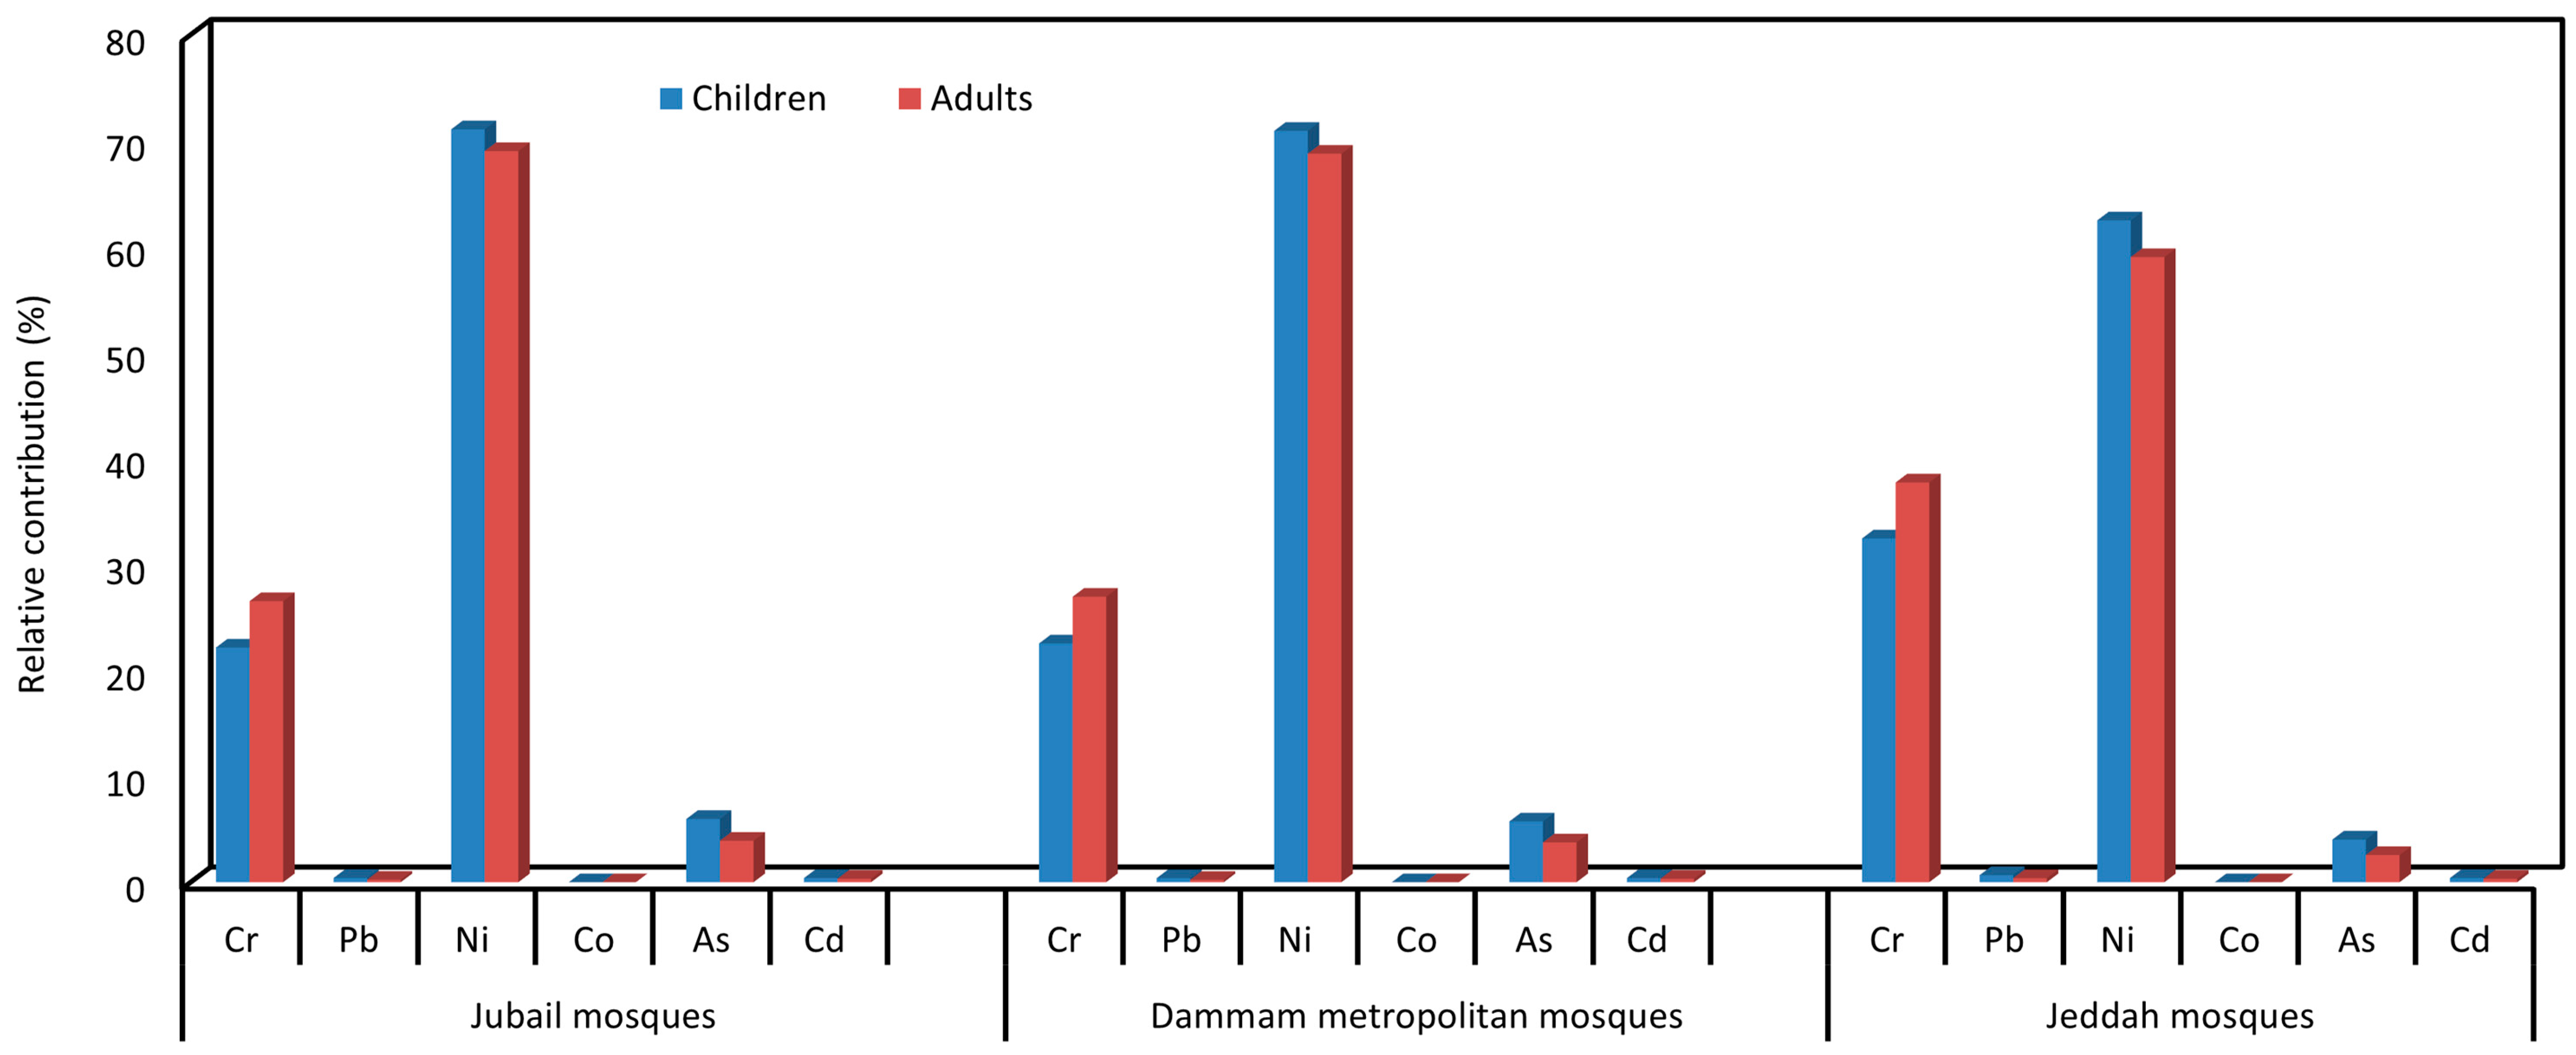
3.3.2. Carcinogenic Risk

Among the measured twelve PHEs, ILCRs for six PHEs (As, Cd, Co, Cr, Ni, and Pb) in the ACFD of JUMs, DMMs, and JEMs were selected and considered in order to assess carcinogenic risk [129] for children and adults. The calculated ILCRs (ILCing, ILCRinh, ILCRdermal) and total cancer risk (CR = ∑ILCRing + ILCRinh + ILCRdermal) are listed in Table 3, Table 4 and Table 5. ILCRing was higher for children than for adults and vice versa for ILCRinh, ILCRdermal, and CR in JUMs, DMMs, and JEMs. The ILCRing for children was 1.4 times more than that for adults, whereas ILCRinh and ILCRdermal for adults were 2.4 and 13.7 times more than that of children in the various mosques. Moreover, the CR for adults was 1.3 times more than that for children, confirming that the exposure to indoor mosques dust can cause more potential health risks for adults than for children. The sequence of ILCRs and CR for children and adults from the exposure to ∑ individual and ∑PHEs in the ACFD of the different mosques was JEMs > DMMs > JUMs. This difference in cancer risks among the mosques of the three different cities suggested the considerable effects of source emissions of PHEs on the health risk. Based on the exposure pathways for children and adults, ILCRs values decreased in the following order: ingestion > dermal contact > inhalation in JUMs, DMMs, and JEMs. The risk contributions of ILCRing, ILCRinh, and ILCRdermal to the CR from the exposure of total measured elements (ƩPHEs) in mosques, respectively, were 95.8, 0.1, and 4.1% (JUMs), 95.8, 0.1, and 4.1% (DMMs), and 95.5, 0.1, and 4.4% (JEMs) for the children and 55.0, 0.1, and 44.9% (JUMs), 54.9, 0.1, and 45.0% (DMMs), and 53.3, 0.1, and 46.6% (JEMs) for adults. Accordingly, ingestion for both adults and children was the main exposure pathway of PHEs associated with the ACFD of the JUMs, DMMs, and JEMs, followed by the dermal and inhalation pathways. This is in agreement with previous studies which reported that the non-dietary ingestion and dermal pathways were responsible for most of the total CR [21,67,75,89,93,127].
Based on the CR values for the individual PHE, Ni concentrations in the ACFD of mosques displayed higher carcinogenic risks compared with other elements for both children and adults, representing 71.1%, 70.9%, and 62.5% (children) and 69.1%, 68.8%, and 59.0% (adults) of the ∑CR for the ∑PTEs in the JUMs, DMMs, and JEMs, respectively (Figure 8). Higher contributions of Ni to cancer risk were also reported in the indoor dust of Jeddah [21]. The values of ILCRing, ILCRinh, ILCRdermal, and CR for the individual PTEs and ∑PHEs in the mosques of the three studied cities (Table 3, Table 4 and Table 5) were lower and/or within the acceptable level (1 × 10⁻⁶ to 1 × 10⁻⁴) [130].
Although the present study deduced that there are no serious non-carcinogenic and carcinogenic risks from exposure to PHEs in mosques’ dust through the different exposure pathways, PHEs exposure can cause serious health effects [71,131,132] by their accumulation in body tissues [133,134], even their HI values at safe levels [131,132]. Accordingly, it can be proposed that PHEs associated with mosques’ dust evaluation should be conducted regularly to ensure lower health risks. The output of the present study may give the initial indication of the risk from PHEs exposure in Saudi Arabian mosques.
In order to minimize the effects of PHEs’ pollution and keep the indoor air quality of the mosques, some precautions and recommendations need to be implemented. These are to keep both doors and windows of the mosques firmly closed especially on windy days, regular cleaning, and the maintenance of the ventilation system, impose a shoes-taking-off strategy, use the slush scraper/dust-adsorbing carpet at the main entrances of the indoor environments [94], and use of wet wiping instead of dry wiping methods to clean up the dust from indoor environments [135].

4. Conclusions

In the present study, the concentrations of potentially harmful elements (PHEs) were determined in dust collected from the AC filters of the mosques in three cities of Saudi Arabia. The concentrations of all selected PHEs were found to follow the following order: Fe > Al > Zn > Mn > Cu > Pb > Cr > Ni > V > Co > As > Cd. The total concentrations of all the PHEs in the ACDF of mosques were found to be higher than the background concentration in three cities and following the order of JEM > DMM > JUM, (1407, 1239, 1103 mg/kg), respectively, reflecting the influence of urbanization activities, traffic density, and economic growth on airborne pollution.
The average concentrations of As, Cd, Cr, Cu, Ni, Pb, and Zn were higher than the local soil concentration in these mosques indicating that anthropogenic sources affected the air quality and Pb, Cu, and Zn exceeded the permissible limits. Similarly, the concentrations of the crustal elements (Fe, Al, and Mn) were also found to be higher than the local background concentrations. The spatial distribution of non-crustal elements at different locations of the mosques generally follows the order WSA > SA > UA (1446, 1188, 1113 mg/kg, respectively). Although it is not consistent, it is however correlated with the local population and traffic density.
Based on the pollution-load index classification criteria and cumulative load impact in comparison with the global crustal and local background soil data showed a high pollution load of PHE in all the mosques and were found in the order JEM > DMM > JUM (2378.5, 563.5, and 349.9 PLI based on local background concentration). The highest pollution load of all the PHEs in Jeddah and Dammam may be due to high traffic emissions around the mosques.
The Igeo accumulation Index based on global crustal and local background indicated that the highest values were found for Cd, Cu, Pb, and Zn (2.25, 2.82, 2.56, and 2.99, respectively) and were lowest for Co, Cr, Fe, Mn, Ni, and V (−3.06, −1.73, −2.94, −2.39, −1.36, and −2.84, respectively). Based on the Igeo index compared to global crustal and local background data, the ACFD were categorized as unpolluted by Fe, Mn, Co, Cr, and V; uncontaminated to moderately contaminated by As, and Cu; moderately contaminated by Cd, Cu, and Pb; and moderately contaminated by Zn at various locations.
The most important findings of this study are the ecological risk assessment, human health risk, and carcinogenic risk evaluation. The highest ER value was calculated for Cd, As, and Pb in JUM, DMM, and JEM, respectively. Based on the ecological risk criteria, Cd was found to have a very high potential for ecological risk, while Pb had a moderate risk. The higher ERI was found in JEM whereas the lowest value was observed in JUM. The non-carcinogenic health risks of the ACFD on children and adults were evaluated for ingestion, inhalation, and dermal contact, and it was estimated that ingestion for both adult and children was the main exposure pathway of PHEs associated with the ACFD of the JUMs, DMMs, and JEMs. The ILCRing for children was 1.4 times higher than that of adults, whereas ILCRinh and ILCRdermal for adults were 2.4 and 13.7 times higher than that of children in the various mosques. The CR for adults was 1.3 times higher than that for children, confirming that exposure to indoor mosques dust can cause more potential health risks for adults than for children. This difference in cancer risks among the mosques of the three cities suggested the considerable effects of source emissions of PHEs on health risk.
To improve indoor air quality and to protect human exposure to various pollutants, an efficient AC filter with regular cleaning and maintenance or having positive pressure inside the mosque is recommended. Moreover, keeping the door closed or an intermediary lobby between the main entrances and the mosques’ prayer halls can reduce the chances of allowing outdoor air to enter the mosques.

Supplementary Materials

The following supporting information can be downloaded at: https://www.mdpi.com/article/10.3390/ijerph20032687/s1, Table S1: Values of risk parameters used for calculating HQs and ILCRs for children and adults exposed to PHEs associated with ACFD of mosques; Table S2: Reference Doses (RfD, mg kg−1 day−1) of different PHEs used to calculate HQs; Table S3: Carcinogenic Slope Factor (CSF, (mg kg−1 day−1)−1) of different PTEs used to calculate CR [19]; Table S4: Geo-accumulation index (Igeo), contamination factor (Cf), degree of contamination (Cd) and pollution load index (PLI) of PHEs in ACFD of Jubail, Dammam metropolitan and Jeddah mosques; Table S5: Classification values and qualitative description of enrichment factor, geo-accumulation index, contamination factor, and ecological risk indices. Refs [136,137,138,139,140,141,142,143,144,145,146,147,148,149,150,151,152,153,154,155,156,157,158] are cited in Supplementary Materials.

Author Contributions

Conceptualization, A.F., M.A.A. and M.I.K.; methodology, A.F. and A.M.S.; software, A.F. and M.I.K.; validation, A.F., M.A.-E., B.T., M.A.A. and M.I.K.; formal analysis, M.A.A. and M.I.K.; samples collection, M.A.-E., M.A.A., M.I.K. and M.Y.A.S.; resources, A.F. and B.T.; data curation, A.F.; writing—original draft preparation, A.F., B.T., A.M.S. and M.I.K.; writing—review and editing, A.F., B.T., A.M.S., M.A.A. and M.I.K.; supervision, A.F. and B.T.; project administration, A.F. and B.T.; funding acquisition, A.F., B.T. and M.A.A. All authors have read and agreed to the published version of the manuscript.

Funding

This work is funded King Fahd University of Petroleum and Minerals (KFUPM), Dhahran, Saudi Arabia.

Institutional Review Board Statement

Not applicable.

Informed Consent Statement

Not applicable.

Data Availability Statement

The data that support the findings of this study are available on request from the corresponding author.

Acknowledgments

The authors wish to acknowledge the support provided by King Fahd University of Petroleum and Minerals (KFUPM), Dhahran, Saudi Arabia.

Conflicts of Interest

The authors declare no conflict of interest.

References

  1. Derwent, R.G.; Hjellbrekke, A.-G. Air Pollution by Ozone Across Europe. In Urban Air Quality in Europe; Viana, M., Ed.; The Handbook of Environmental Chemistry; Springer: Berlin/Heidelberg, Germany, 2013; pp. 55–73. [Google Scholar]
  2. Landrigan, P.J.; Fuller, R.; Acosta, N.J.; Adeyi, O.; Arnold, R.; Baldé, A.B.; Zhong, M. The Lancet Commission on Pollution and Health. Lancet 2018, 391, 462–512. [Google Scholar] [CrossRef] [PubMed]
  3. Cohen, A.J.; Brauer, M.; Burnett, R.; Anderson, H.R.; Frostad, J.; Estep, K.; Balakrishnan, K.; Brunekreef, B.; Dandona, L.; Dandona, R.; et al. Estimates and 25-Year Trends of the Global Burden of Disease Attributable to Ambient Air Pollution: An Analysis of Data from the Global Burden of Diseases Study 2015. Lancet 2017, 389, 1907–1918. [Google Scholar] [CrossRef] [PubMed]
  4. Men, C.; Liu, R.; Xu, F.; Wang, Q.; Guo, L.; Shen, Z. Pollution Characteristics, Risk Assessment, and Source Apportionment of Heavy Metals in Road Dust in Beijing, China. Sci. Total Environ. 2018, 612, 138–147. [Google Scholar] [CrossRef] [PubMed]
  5. Dytłow, S.; Górka-Kostrubiec, B. Concentration of Heavy Metals in Street Dust: An Implication of Using Different Geochemical Background Data in Estimating the Level of Heavy Metal Pollution. Environ. Geochem. Health 2021, 43, 521–535. [Google Scholar] [CrossRef] [PubMed]
  6. Hanfi, M.Y.; Yarmoshenko, I.V. Health Risk Assessment Quantification from Heavy Metals Contamination in the Urban Soil and Urban Surface Deposited Sediment. J. Taibah Univ. Sci. 2020, 14, 285–293. [Google Scholar] [CrossRef]
  7. Moryani, H.T.; Kong, S.; Du, J.; Bao, J. Health Risk Assessment of Heavy Metals Accumulated on PM2.5 Fractioned Road Dust from Two Cities of Pakistan. Int. J. Environ. Res. Public Health 2020, 17, 7124. [Google Scholar] [CrossRef]
  8. Du, Y.; Gao, B.; Zhou, H.; Ju, X.; Hao, H.; Yin, S. Health Risk Assessment of Heavy Metals in Road Dusts in Urban Parks of Beijing, China. Procedia Environ. Sci. 2013, 18, 299–309. [Google Scholar] [CrossRef]
  9. Men, C.; Liu, R.; Wang, Q.; Guo, L.; Miao, Y.; Shen, Z. Uncertainty Analysis in Source Apportionment of Heavy Metals in Road Dust Based on Positive Matrix Factorization Model and Geographic Information System. Sci. Total Environ. 2019, 652, 27–39. [Google Scholar] [CrossRef]
  10. Faheem; Bao, J.; Zheng, H.; Tufail, H.; Irshad, S.; Du, J. Adsorption-Assisted Decontamination of Hg(Ii) from Aqueous Solution by Multi-Functionalized Corncob-Derived Biochar. RSC Adv. 2018, 8, 38425–38435. [Google Scholar] [CrossRef]
  11. Jancsek-Turóczi, B.; Hoffer, A.; Nyírő-Kósa, I.; Gelencsér, A. Sampling, and Characterization of Resuspended and Respirable Road Dust. J. Aerosol Sci. 2013, 65, 69–76. [Google Scholar] [CrossRef] [Green Version]
  12. Suryawanshi, P.V.; Rajaram, B.S.; Bhanarkar, A.D.; Chalapati Rao, C.V. Determining heavy metal contamination of road dust in Delhi, India. Atmosfera 2016, 29, 221–234. [Google Scholar] [CrossRef]
  13. Jin, Y.; O’Connor, D.; Ok, Y.S.; Tsang, D.C.W.; Liu, A.; Hou, D. Assessment of Sources of Heavy Metals in Soil and Dust at Children’s Playgrounds in Beijing Using GIS and Multivariate Statistical Analysis. Environ. Int. 2019, 124, 320–328. [Google Scholar] [CrossRef]
  14. Järup, L. Hazards of Heavy Metal Contamination. Br. Med. Bull. 2003, 68, 167–182. [Google Scholar] [CrossRef] [PubMed]
  15. Jaishankar, M.; Mathew, B.B.; Shah, M.S.; Krishna Murthy, T.P.; Sangeetha Gowda, K.R. Biosorption of Few Heavy Metal Ions Using Agricultural Wastes. J. Environ. Pollut. Hum. Health 2014, 2, 1–6. [Google Scholar]
  16. O’Connor, D.; Hou, D.; Ye, J.; Zhang, Y.; Ok, Y.S.; Song, Y.; Coulon, F.; Peng, T.; Tian, L. Lead-Based Paint Remains a Major Public Health Concern: A Critical Review of Global Production, Trade, Use, Exposure, Health Risk, and Implications. Environ. Int. 2018, 121, 85–101. [Google Scholar] [CrossRef]
  17. Alharbi, B.; Shareef, M.M.; Husain, T. Study of Chemical Characteristics of Particulate Matter Concentrations in Riyadh, Saudi Arabia. Atmos. Pollut. Res. 2015, 6, 88–98. [Google Scholar] [CrossRef]
  18. Alharbi, B.H.; Maghrabi, A.; Tapper, N. The march 2009 dust event in Saudi Arabia: Precursor and supportive environment. Bull. Am. Meteorol. Soc. 2013, 94, 515–528. [Google Scholar] [CrossRef]
  19. Alghamdi, M.A.; Hassan, S.K.; Alzahrani, N.A.; Al Sharif, M.Y.; Khoder, M.I. Classroom Dust-Bound Polycyclic Aromatic Hydrocarbons in Jeddah Primary Schools, Saudi Arabia: Level, Characteristics and Health Risk Assessment. Int. J. Environ. Res. Public Health 2020, 17, 2779. [Google Scholar] [CrossRef] [PubMed]
  20. Khoder, M.I.; Alghamdi, M.A.; Shiboob, M.H. Heavy metal distribution in street dust of urban and industrial areas in Jeddah, Saudi Arabia. J. King Abdelaziz Univ. Meteorol. Environ. Arid. Land Agric. Sci. 2012, 23, 55–75. [Google Scholar] [CrossRef]
  21. Alghamdi, M.A.; Hassan, S.K.; Alzahrani, N.A.; Almehmadi, F.M.; Khoder, M.I. Risk assessment and Zhengto classroom heavy metals particles in Jeddah, Saudi Arabia. Int. J. Environ. Res. Public Health 2019, 16, 5017. [Google Scholar] [CrossRef]
  22. El-Shobokshy, M.S. A preliminary analysis of the inhalable particulate lead in the ambient atmosphere of the city of Riyadh, Saudi Arabia. Atmos. Environ. 1984, 18, 2125–2130. [Google Scholar] [CrossRef]
  23. Al-Saleh, I.A.; Taylor, A. Lead concentration in the atmosphere and soil of Riyadh, Saudi Arabia. Sci. Total Environ. 1994, 141, 261–267. [Google Scholar] [CrossRef]
  24. El-Sergany, M.; El-Sharkawy, M. Heavy Metal Contamination of Airborne Dust in the Environment of Two Main Cities in the Eastern Province of Saudi Arabia. J. King Abdulaziz Univ. Environ. Arid L. Agric. Sci. 2011, 22, 135–148. [Google Scholar] [CrossRef]
  25. Khobar Climate, Weather by Month, Average Temperature (Saudi Arabia)—Weather Spark. Available online: https://weatherspark.com/y/104952/Average-Weather-in-Khobar-Saudi-Arabia-Year-Round (accessed on 2 December 2022).
  26. Saudi Arabia Statistics (2023)—Global Media Insight. Available online: https://www.globalmediainsight.com/blog/saudi-arabia-population-statistics/ (accessed on 2 December 2022).
  27. Azzam, A.; Ali, A.B. Urban Sprawl in Wadi Goes Watershed (Jeddah City/Western Saudi Arabia) and Its Impact on Vulnerability and Flood Hazards. Available online: https://www.scirp.org/journal/paperinformation.aspx?paperid=93222 (accessed on 15 May 2019).
  28. Alqurashi, A.; Kumar, L. An Assessment of the Impact of Urbanization and Land Use Changes in the Fast-Growing Cities of Saudi Arabia. Geocarto Int. 2019, 34, 78–97. [Google Scholar] [CrossRef]
  29. Saudi Arabia Population (2022)—Worldometer. Available online: https://www.worldometers.info/world-population/saudi-arabia-population/ (accessed on 2 December 2022).
  30. Al Jubayl Climate, Weather by Month, Average Temperature (Saudi Arabia)—Weather Spark. Available online: https://weatherspark.com/y/104798/Average-Weather-in-Al-Jubayl-Saudi-Arabia-Year-Round (accessed on 2 December 2022).
  31. Ad-Dammam, Saudi Arabia Metro Area Population 1950–2022. Available online: https://www.macrotrends.net/cities/22416/ad-dammam/population (accessed on 2 December 2022).
  32. Dammam Climate, Weather by Month, Average Temperature (Saudi Arabia)—Weather Spark. Available online: https://weatherspark.com/y/104953/Average-Weather-in-Dammam-Saudi-Arabia-Year-Round (accessed on 2 December 2022).
  33. Ali, M.U.; Liu, G.; Yousaf, B.; Abbas, Q.; Ullah, H.; Munir, M.A.M.; Zhang, H. Compositional characteristics of black-carbon and nanoparticles in air-conditioner dust from an inhabitable industrial metropolis. J. Clean. Prod. 2018, 180, 34–42. [Google Scholar] [CrossRef]
  34. USEPA. Method 3050 B: Acid Digestion of Sediments, Sludges, and Soils; Revision 2; USEPA: Washington, DC, USA, 1996.
  35. USEPA. Method 6010 C: Inductively Coupled Plasma—Atomic Emission Spectroscopy; Revision 3; USEPA: Washington, DC, USA, 2007.
  36. Okedeyi, O.O.; Dube, S.; Awofolu, O.R.; Nindi, M.M. Assessing the enrichment of heavy metals in surface soil and plant (Digitariaeriantha) around coal-fired power plants in South Africa. Environ. Sci. Pollut. Res.-Int. 2014, 21, 4686–4696. [Google Scholar] [CrossRef]
  37. Li, H.H.; Chen, L.J.; Yu, L.; Guo, Z.B.; Shan, C.Q.; Lin, J.Q.; Gu, Y.G.; Yang, Z.B.; Yang, Y.X.; Shao, J.R. Pollution characteristics and risk assessment of human exposure to oral bioaccessibility of heavy metals via urban street dust from different functional areas in Chengdu, China. Sci. Total Environ. 2017, 586, 1076–1084. [Google Scholar] [CrossRef]
  38. Mediolla, L.; Domingues, M.; Sandoval, M.G. Environmental assessment of and active tailings pile in the State of Mexico (central Mexico). Res. J. Environ. Sci. 2018, 2, 197–208. [Google Scholar]
  39. Neto, J.A.B.; Gingele, F.X.; Leipe, T.; Brehme, I. Spatial distribution of heavy metals in surficial sediments from Guanabara Bay: Rio de Janeiro, Brazil. Environ. Geol. 2006, 49, 1051–1063. [Google Scholar] [CrossRef]
  40. Adimalla, N.; Qian, H.; Wang, H. Assessment of heavy metal (HM) contamination in agricultural soil lands in northern Telangana, India: An approach of spatial distribution and multivariate statistical analysis. Environ. Monit. Assess. 2019, 191, 246. [Google Scholar] [CrossRef]
  41. Jiang, H.-H.; Cai, L.-M.; Wen, H.-H.; Hu, G.-C.; Chen, L.-G.; Luo, J. An integrated approach to quantifying ecological and human health risks from different sources of soil heavy metals. Sci. Total Environ. 2020, 701, 134466. [Google Scholar] [CrossRef] [PubMed]
  42. Taylor, S.R. Abundance of chemical elements in the continental crust: A New Table. Geochim. Cosmochim. Acta 1964, 28, 1273–1285. [Google Scholar] [CrossRef]
  43. Taylor, S.R.; McLennan, S.M. The Continental Crust: Its Composition and Evolution; Blackwell Scientific Publications: Oxford, UK, 1985. [Google Scholar]
  44. Bradl, H. Heavy Metals in the Environment. Interface [Heavy Metals in the Environment. Interface]. Sci. Technol. 2005, 6, 269. [Google Scholar]
  45. Shabbaj, I.I.; Alghamdi, M.A.; Shamy, M.; Hassan, S.K.; Alsharif, M.M.; Khoder, M.I. Risk assessment and implication of human exposure to road dust heavy metals in Jeddah, Saudi Arabia. Int. J. Environ. Res. Public Health 2018, 15, 36. [Google Scholar] [CrossRef] [PubMed]
  46. Wei, X.; Gao, B.; Wang, P.; Zhou, H.; Lu, J. Pollution characteristics and health risk assessment of heavy metals in street dusts from different functional areas in Beijing, China. Ecotoxicol. Environ. Saf. 2015, 112, 186–192. [Google Scholar] [CrossRef]
  47. Xiao, H.; Shahab, A.; Xi, B.; Chang, Q.; You, S.; Li, J.; Sun, X.; Huang, H.; Li, X. Heavy metal pollution, ecological risk, spatial distribution, and source identification in 551 sediments of the Lijiang River, China. Environ. Pollut. 2021, 269, 116189. [Google Scholar] [CrossRef]
  48. Lu, X.; Li, L.Y.; Wang, L.; Lei, K.; Huang, J.; Zhai, Y. Contamination assessment of mercury and arsenic in roadway dust from Baoji, China. Atmos. Environ. 2009, 43, 2489–2496. [Google Scholar] [CrossRef]
  49. Rastmanesh, F.; Safaie, S.; Zarasvandi, A.; Edraki, M. Heavy metal enrichment and ecological risk assessment of surface sediments in Khorramabad River, West Iran. Environ. Monit. Assess. 2018, 190, 273. [Google Scholar] [CrossRef] [PubMed]
  50. Guillén, M.T.; Delgado, J.; Albanese, S.; Nieto, J.M.; Lima, A.; De Vivo, B. Environmental geochemical mapping of Huelva municipality soils (SW Spain) as a tool to determine background and baseline values. J. Geochem. Explore. 2011, 109, 59–69. [Google Scholar] [CrossRef]
  51. Mmolawa, K.B.; Likuku, A.S.; Gaboutloeloe, G.K. Assessment of heavy metal pollution in soils along major roadside areas in Botswana. Afr. J. Environ. Sci. Technol. 2011, 5, 186–196. [Google Scholar]
  52. Yaylalı-Abanuz, G. Heavy metal contamination of surface soil around Gebze industrial area, Turkey. Microchem. J. 2011, 99, 82–92. [Google Scholar] [CrossRef]
  53. Tomlinson, D.L.; Wilson, J.G.; Harris, C.R.; Jeffrey, D.W. Problems in the assessment of heavy-metal levels in estuaries and the formation of a pollution index. Helgoländer Meeresunters. 1980, 33, 566–575. [Google Scholar] [CrossRef]
  54. Mandour, A.; El-Sayed, M.K.; El-Gamal, A.A.; Khadr, A.M.; Elshazly, A. Temporal distribution of trace metals pollution load index in the Nile Delta coastal surface sediments. Mar. Pollut. Bull. 2021, 167, 112290. [Google Scholar] [CrossRef] [PubMed]
  55. Gope, M.; Masto, R.E.; George, J.; Balachandran, S. Tracing source, distribution and health risk of potentially harmful elements (PHEs) in street dust of Durgapur, India. Ecotoxicol. Environ. Saf. 2018, 154, 280–293. [Google Scholar] [CrossRef]
  56. Wahab, M.I.A.; Razak, W.M.A.A.; Sahani, M.; Khan, M.F. Characteristics and health effect of HMs on non-exhaust road dusts in Kuala Lumpur. Sci. Total Environ. 2020, 703, 135535. [Google Scholar] [CrossRef]
  57. Wang, B.; Xia, D.; Yu, Y.; Jia, J.; Xu, S. Magnetic records of heavy metal pollution in urban topsoil in Lanzhou. China. Chin. Sci. Bull. 2012, 58, 384–395. [Google Scholar] [CrossRef]
  58. Rinklebea, J.; Antoniadis, V.; Shaheena, S.M.; Roschef, O.; Altermann, M. Health risk assessment of potentially toxic elements in soils along the Central Elbe River, Germany. Environ. Int. 2019, 126, 76–88. [Google Scholar] [CrossRef]
  59. Hakanson, L. An ecological risk index for aquatic pollution control. A sedimentological approach. Water Res. 1980, 14, 975–1001. [Google Scholar] [CrossRef]
  60. Yi, Y.; Yang, Z.; Zhang, S. Ecological risk assessment of heavy metals in sediment and human health risk assessment of heavy metals in fishes in the middle and lower reaches of the Yangtze River basin. Environ Pollut. 2011, 159, 2575–2585. [Google Scholar] [CrossRef]
  61. Mazurek, R.; Kowalska, J.; Gąsiorek, M.; Zadrożny, P.; J´ozefowska, A.; Zaleski, T.; Orłowska, K. Assessment of heavy metals contamination in surface layers of Roztocze National Park Forest soils (SE Poland) by indices of pollution. Chemosphere 2017, 168, 839–850. [Google Scholar] [CrossRef]
  62. Odediran, E.T.; Adeniran, J.A.; Yusuf, R.O.; Abdulraheem, K.A.; Adesina, O.A.; Sonibare, J.A.; Du, M. Contamination levels, health risks and source apportionment of potentially toxic elements in road dusts of a densely populated African City. Environ. Nanotechnol. Monit. Manag. 2021, 15, 100445. [Google Scholar] [CrossRef]
  63. Yuan, G.-L.; Sun, T.-H.; Han, P.; Li, J.; Lang, X.-X. Source identification and ecological risk assessment of heavy metals in topsoil using environmental geochemical mapping: Typical urban renewal area in Beijing, China. J. Geochem. Explor. 2014, 136, 40–47. [Google Scholar] [CrossRef]
  64. Guo, W.; Liu, X.; Liu, Z.; Li, G. Pollution and potential ecological risk evaluation of heavy metals in the sediments around Dongjiang Harbor, Tianjin. Procedia. Environ. Sci. 2010, 2, 729–736. [Google Scholar] [CrossRef]
  65. United States Environmental Protection Agency (USEPA). Exposure Factors Handbook Edition; EPA/600/ R-09/052F; National Center for Environmental Assessment, Office of Research and Development, U.S. Environmental Protection Agency: Washington, DC, USA, 2011.
  66. United States Environmental Protection Agency (USEPA). Risk Assessment Guidance for Superfund: Human Health Evaluation Manual (Part A); EPA/540/1-89/002; Office of Emergency and Remedial Response: Washington, DC, USA, 1989; Volume I.
  67. Al-Harbi, M.; Alhajri, I.; Whalen, J.K. Characteristics and health risk assessment of heavy metal contamination from dust collected on household HVAC air filters. Chemosphere 2021, 277, 130276. [Google Scholar] [CrossRef]
  68. United States Environmental Protection Agency (USEPA). Reference Dose (RfD): Description and Use in Health Risk Assessments; Background Document 1 A; Integrated Risk Information System (IRIS): Washington, DC, USA, 1993.
  69. Zhang, H.; Mao, Z.; Huang, K.; Wang, X.; Cheng, L.; Zeng, L.; Zeng, L.; Zhou, Y.; Jing, T. Multiple exposure pathways and health risk assessment of heavy metal(loid)s for children living in fourth- tier cities in Hubei Province. Environ. Int. 2019, 129, 517–524. [Google Scholar] [CrossRef] [PubMed]
  70. Islam, A.R.M.T.; Islam, H.M.T.; Mia, M.U.; Khan, R.; Habib, M.A.; Bodrud-Doza, M.; Siddique, M.A.B.; Chu, R. Co-distribution, possible origins, status and potential health risk of trace elements in surface water sources from six major river basin, Bangladesh. Chemosphere 2020, 249, 126180. [Google Scholar] [CrossRef]
  71. Phil-Eze, P.O. Variability of Soil Properties Related to Vegetation Cover in a Tropical Rainforest Variability of Soil Properties Related to Vegetation Cover in a Tropical Rainforest Landscape. Afr. J. Geogr. Reg. Plan. 2019, 6, 1–8. [Google Scholar]
  72. Karim, Z.; Qureshi, B.A. Health Risk Assessment of Heavy Metals in Urban Soil of Karachi, Pakistan. Hum. Ecol. Risk Assess. J. 2014, 20, 658–667. [Google Scholar] [CrossRef]
  73. Yongming, H.; Peixuan, D.; Junji, C.; Posmentier, E.S. Multivariate analysis of heavy metal contamination in urban dusts of Xi’an. Cent. China 2006, 355, 176–186. [Google Scholar]
  74. Al-Awadhi, J.M.; Aldhafiri, B.T. Heavy metal concentrations in roadside-deposited sediments in Kuwait City. Arabian J. Geosci. 2016, 9, 535. [Google Scholar] [CrossRef]
  75. Albar, H.M.S.A.; Ali, N.; Eqani, S.A.M.A.S.; Alhakamy, N.A.; Nazar, E.; Rashid, M.I.; Shahzad, K.; Ismail, I.M.I. Trace metals in different socioeconomic indoor residential settings, implications for human health via dust exposure. Ecotoxicol. Environ. Saf. 2020, 189, 109927. [Google Scholar] [CrossRef]
  76. Ali, M.U.; Liu, G.; Yousaf, B.; Abbas, Q.; Ullah, H.; Munir, M.A.M.; Fu, B. Pollution characteristics and human health risks of potentially (eco) toxic elements (PTEs) in road dust from metropolitan area of Hefei, China. Chemosphere 2017, 181, 111–121. [Google Scholar] [CrossRef]
  77. Butte, W.; Heinzow, B. Pollutants in house dust as indicators of indoor contamination. Rev. Environ. Contam. Toxicol. 2002, 175, 1–46. [Google Scholar]
  78. Trowbridge, P.R.; Burmaster, D.E. A parametric distribution for the fraction of outdoor soil in indoor dust. Soil Sediment Contam. 1997, 6, 161–168. [Google Scholar] [CrossRef]
  79. Li, X.; Poon, C.S.; Liu, P.S. Heavy metal contamination of urban soils and street dusts in Hong Kong. Appl. Geochem. 2001, 16, 1361–1368. [Google Scholar] [CrossRef]
  80. Saeedi, M.; Li, L.Y.; Salmanzadeh, M. Heavy metals, and polycyclic aromatic hydrocarbons: Pollution and ecological risk assessment in street dust of Tehran. J. Hazard. Mater. 2012, 227, 9–17. [Google Scholar] [CrossRef] [PubMed]
  81. Sareban, V.H.; Saeb, S. Heavy metal contamination in street precip- itated dust in Tabriz City, Iran, and its ecological risk. Biosci. Biotech. Res. Comm. 2018, 11, 291–299. [Google Scholar] [CrossRef]
  82. Kosheleva, N.E.; Vlasov, D.V.; Korlyakov, I.D.; Kasimov, N.S. Contamination of urban soils with heavy metals in Moscow as affected by building development. Sci. Total Environ. 2018, 636, 854–863. [Google Scholar] [CrossRef]
  83. Zhao, K.; Fu, W.; Qiu, Q.; Ye, Z.; Li, Y.; Tunney, H.; Qian, X. Spatial patterns of potentially hazardous metals in paddy soils in a typical electrical waste dismantling area and their pollution characteristics. Geoderma 2019, 337, 453–462. [Google Scholar] [CrossRef]
  84. Kabata-Pendias, A. Trace Elements in Soils and Plants; CRC Press: Boca Raton, FL, USA, 2010. [Google Scholar]
  85. Bali, A.S.; Sidhu, G.P.S. Heavy Metal Contamination Indices and Ecological Risk Assessment Index to Assess Metal Pollution Status in Different Soils, Hms in the Environment; Elsevier: Amsterdam, The Netherlands, 2021; pp. 87–98. [Google Scholar]
  86. Gabersek, M.; Gosar, M. Towards a holistic approach to the geochemistry of solid inorganic particles in the urban environment. Sci. Total Environ. 2021, 763, 144214. [Google Scholar] [CrossRef]
  87. Al Hejami, A.; Davis, M.; Prete, D.; Lu, J.; Wang, S. Heavy metals in indoor settled dusts in Toronto, Canada. Sci. Total Environ. 2020, 703, 134895. [Google Scholar] [CrossRef]
  88. Yangbing, L.; Fengman, F.; Yuesheng, L.; Yue, W.; Ying, K.; Minghong, W. Heavy metal contamination and health risks of indoor dust around Xinqiao Mining Area, Tongling, China. Hum. Ecol. Risk Assess. 2020, 26, 46–56. [Google Scholar]
  89. Rehman, A.; Liu, G.; Yousaf, B.; Zia-ur-Rehman, M.; Ali, M.U.; Rashid, M.S.; Farooq, M.R.; Javed, Z. Characterizing Pollution Indices and Children Health Risk Assessment of Potentially Toxic Metal(Oid)s in School Dust of Lahore, Pakistan. Ecotoxicol. Environ. Saf. 2020, 190, 110059. [Google Scholar] [CrossRef]
  90. Yadav, I.; Devi, N.; Singh, V.; Li, J.; Zhang, G. Spatial distribution, source analysis, and health risk assessment of heavy metals contamination in house dust and surface soil from four major cities of Nepal. Chemosphere 2019, 2018, 1100–1113. [Google Scholar] [CrossRef] [PubMed]
  91. Moghtaderi, M.; Ashraf, M.; Moghtaderi, T.; Teshnizi, S.; Nabavizadeh, S. Heavy metal concentration in classroom dust samples and its relationship with childhood asthma: A study from Shiraz, Islamic Republic of Iran. East. Mediterr. Health J. 2020, 26, 594–601. [Google Scholar] [CrossRef]
  92. Mahfouz, M.; Yigiterhan, O.; Elnaiem, A.; Hassan, H.; Alfoldy, B. Elemental compositions of particulate matter retained on air condition unit’s filters at Greater Doha, Qatar. Environ. Geochem. Health 2019, 41, 2533–2548. [Google Scholar] [CrossRef]
  93. Iwegbue, C.; Obi, G.; Emoyan, O.; Odali, E.; Egobueze, F.; Tesi, G.; Nwajei, G.; Martincigh, B. Characterization of metals in indoor dusts from electronic workshops, cybercafe s and offices in southern Nigeria: Implications for on-site human exposure. Ecotoxicol. Environ. Saf. 2018, 159, 342–353. [Google Scholar] [CrossRef]
  94. Doyi, I.N.Y.; Isley, C.F.; Soltani, N.S.; Taylor, M.P. Human Exposure and Risk Associated with Trace Element Concentrations in Indoor Dust from Australian Homes. Environ. Int. 2019, 133, 105125. [Google Scholar] [CrossRef] [PubMed]
  95. Arar, S.; Al-Hunaiti, A.; Masad, M.; Maragkidou, A.; Wraith, D.; Hussein, T. Elemental contamination in indoor floor dust and its correlation with PAHs, fungi, and Gramþ/- bacteria. Int. J. Environ. Res. Public Health 2019, 16, 3552. [Google Scholar] [CrossRef]
  96. Plumejeaud, S.; Reis, A.; Tassistro, V.; Patinha, C.; Noack, Y.; Orsiere, T. Potentially harmful elements in house dust from Estarreja, Portugal: Characterization and genotoxicity of the bioaccessible fraction. Environ. Geochem. Health 2018, 40, 127–144. [Google Scholar] [CrossRef]
  97. Moghtaderi, T.; Aminiyan, M.; Alamdar, R.; Moghtaderi, M. Index-based evaluation of pollution characteristics and health risk of potentially toxic metals in schools dust of Shiraz megacity, SW Iran. Hum. Ecol. Risk Assess. 2019, 25, 410–437. [Google Scholar] [CrossRef]
  98. El-Mubarak, A.H.; Rushdi, A.I.; Al-Mutlaq, K.F.; Al Mdawi, F.Z.; Al-Hazmi, K.; Dumenden, R.S.; Pascu, R.A. Polycyclic aromatic hydrocarbons, and trace metals in mosque’s carpet dust of Riyadh, Saudi Arabia, and their health risk implications. Environ. Sci. Pollut. Res. 2016, 23, 21273–21287. [Google Scholar] [CrossRef]
  99. Gad, A.; Saleh, A.; Farhat, H.; Dawood, Y.H.; Abd El Bakey, S.M. Spatial Distribution, Contamination Levels, and Health Risk Assessment of Potentially Toxic Elements in Household Dust in Cairo City, Egypt. Toxics 2022, 10, 466. [Google Scholar] [CrossRef]
  100. Rabe, J.M.; Agbaji, E.B.; Zakka, Y.; Muhammed, H.M.; Rabe, A.M. Assessment of Contaminated Soil with Some Heavy Metals in Selected Auto Repair Shops in Katsina North Western, Nigeria. J. Waste Manag. Xenobiotics. 2018, 1, 100–113. [Google Scholar]
  101. Eluyera, I.M.; Tukura, B.W. Assessment of Heavy Metals in Soil of Automobile Workshops in Federal Capital Territory Abuja, Nigeria. IOSR J. Environ. Sci. Toxicol. Food Technol. 2020, 14, 4955. [Google Scholar]
  102. Adelekan, A.B.; Abegunde, K.D. Heavy metals contamination of soil and groundwater at automobile mechanic villages in Ibadan, Nigeria. Int. J. Phys. Sci. 2011, 6, 1045–1058. [Google Scholar]
  103. Shaltout, A.A.; Hassan, S.K.; Karydas, A.G.; Harfouche, M.; Abd-Elkader, O.H.; Kregsamer, P.; Wobrauschek, P.; Streli, C. EDXRF analysis of suspended particulate matter (S P M) from residential and industrial areas in Cairo, Egypt. X-ray Spectrom. 2018, 47, 223–230. [Google Scholar] [CrossRef]
  104. Shi, G.; Chen, Z.; Xu, S.; Zhang, J.; Wang, L.; Bi, C.; Teng, J. Potentially toxic metal contamination of urban soils and roadside dust in Shanghai, China. Environ. Pollut. 2008, 156, 251–260. [Google Scholar] [CrossRef] [PubMed]
  105. Tahir, N.M.; Chee, P.S.; Jaafar, M. Determination of heavy metals content in soils and indoor dusts from nurseries in Dungun, Terengganu Malaysian. J. Anal. Sci. 2007, 11, 280–286. [Google Scholar]
  106. Tan, S.Y.; Praveena, S.M.; Abidin, E.Z.; Cheema, M.S. A review of heavy metals in indoor dust and its human health-risk implications. Rev. Environ. Health 2016, 31, 447–456. [Google Scholar] [CrossRef] [PubMed]
  107. Al-Rajhi, M.A.; Seaward, M.R.D.; Al-Aamer, A.S. Metal Levels in Indoor and Outdoor Dust in Riyadh, Saudi Arabia. Environ. Int. 1996, 22, 315–324. [Google Scholar] [CrossRef]
  108. Chen, L.; Zeng, F.; Luo, D.; Cui, K. Study of the distribution characteristics of phthalate esters in road dust of the city. Acta Sci. Circumstantiae. 2005, 25, 409–413. [Google Scholar]
  109. Aiman, U.; Mahmood, A.; Waheed, S.; Malik, R.N. Enrichment, Geo-Accumulation and Risk Surveillance of Toxic Metals for Different Environmental Compartments from Mehmood Booti Dumping Site, Lahore City, Pakistan. Chemosphere 2016, 144, 2229–2237. [Google Scholar] [CrossRef] [PubMed]
  110. Zhao, G.; Zhang, R.; Han, Y.; Meng, J.; Qiao, Q.; Li, H. Pollution Characteristics, Spatial Distribution, and Source Identification of Heavy Metals in Road Dust in a Central Eastern City in China: A Comprehensive Survey. Environ. Monit. Assess. 2021, 193, 796. [Google Scholar] [CrossRef]
  111. Patel, D.K.; Jain, M.K. Contamination and Health Risk Assessment of Potentially Harmful Elements Associated with Roadside Dust in Dhanbad India. Stoch. Environ. Res. Risk Assess. 2022, 36, 389–407. [Google Scholar] [CrossRef]
  112. Mondal, S.; Singh, G.; Jain, M.K. Spatio-Temporal Variation of Air Pollutants around the Coal Mining Areas of Jharia Coalfield, India. Environ. Monit. Assess. 2020, 192, 405. [Google Scholar] [CrossRef]
  113. Bourliva, A.; Kantiranis, N.; Papadopoulou, L.; Aidona, E.; Christophoridis, C.; Kollias, P.; Evgenakis, M.; Fytianos, K. Seasonal and Spatial Variations of Magnetic Susceptibility and Potentially Toxic Elements (PTEs) in Road Dusts of Thessaloniki City, Greece: A One-Year Monitoring Period. Sci. Total Environ. 2018, 639, 417–427. [Google Scholar] [CrossRef]
  114. Wang, Y.; Li, Q.; Zhang, P.; O’Connor, D.; Varma, R.S.; Yu, M.; Hou, D. One-Pot Green Synthesis of Bimetallic Hollow Palladium-Platinum Nanotubes for Enhanced Catalytic Reduction of p-Nitrophenol. J. Colloid Interface Sci. 2019, 539, 161–167. [Google Scholar] [CrossRef]
  115. Al-Taani, A.A.; Nazzal, Y.; Howari, F.M. Assessment of Heavy Metals in Roadside Dust along the Abu Dhabi–Al Ain National Highway, UAE. Environ. Earth Sci. 2019, 78, 411. [Google Scholar] [CrossRef]
  116. Bernardino, C.A.R.; Mahler, C.F.; Santelli, R.E.; Freire, A.S.; Braz, B.F.; Novo, L.A.B. Metal Accumulation in Roadside Soils of Rio de Janeiro, Brazil: Impact of Traffic Volume, Road Age, and Urbanization Level. Environ. Monit. Assess. 2019, 191, 156. [Google Scholar] [CrossRef]
  117. Novo, L.A.B.; Onishi, V.C.; Bernardino, C.A.R.; da Silva, E.F. Metal Bioaccumulation by Plants in Roadside Soils: Perspectives for Bioindication and Phytoremediation. In Enhancing Cleanup of Environmental Pollutants: Volume 1: Biological Approaches; Anjum, N.A., Gill, S.S., Tuteja, N., Eds.; Springer International Publishing: Cham, Switzerland, 2017; pp. 215–230. ISBN 978-3-319-55426-6. [Google Scholar]
  118. Trujillo-González, J.M.; Torres-Mora, M.A.; Keesstra, S.; Brevik, E.C.; Jiménez-Ballesta, R. Heavy Metal Accumulation Related to Population Density in Road Dust Samples Taken from Urban Sites under Different Land Uses. Sci. Total Environ. 2016, 553, 636–642. [Google Scholar] [CrossRef]
  119. Kamani, H.; Ashrafi, S.D.; Isazadeh, S.; Jaafari, J.; Hoseini, M.; Mostafapour, F.K.; Bazrafshan, E.; Nazmara, S.; Mahvi, A.H. Heavy Metal Contamination in Street Dusts with Various Land Uses in Zahedan, Iran. Bull. Environ. Contam. Toxicol. 2015, 94, 382–386. [Google Scholar] [CrossRef]
  120. Aburas, H.M.; Zytoon, M.A.; Abdulsalam, M.I. Atmospheric Lead in PM2.5 after Leaded Gasoline Phase-out in Jeddah City, Saudi Arabia. CLEAN–Soil. Air. Water 2011, 39, 711–719. [Google Scholar] [CrossRef]
  121. Khodeir, M.; Shamy, M.; Alghamdi, M.; Zhong, M.; Sun, H.; Costa, M.; Chen, L.-C.; Maciejczyk, P. Source apportionment and elemental composition of PM2.5 and PM10 in Jeddah City, Saudi Arabia. Atmos. Pollut. Res. 2012, 3, 331–340. [Google Scholar] [CrossRef] [PubMed]
  122. Lim, C.C.; Thurston, G.D.; Shamy, M.; Alghamdi, M.; Khoder, M.; Mohorjy, A.M.; Al Khalaf, A.K.; Brocato, J.; Chen, L.C.; Costa, M. Temporal variation of fine and coarse particulate matter sources in Jeddah, Saudi Arabia. J. Air Waste Manag. Assoc. 2018, 68, 123–138. [Google Scholar] [CrossRef] [PubMed]
  123. Nematollahi, M.J.; Dehdaran, S.; Moore, F.; Keshavarzi, B. Potentially Toxic Elements and Polycyclic Aromatic Hydrocarbons in Street Dust of Yazd, a Central Capital City in Iran: Contamination Level, Source Identification, and Ecological–Health Risk Assessment. Environ. Geochem. Health 2021, 43, 485–519. [Google Scholar] [CrossRef] [PubMed]
  124. Wang, X.; Liu, E.; Lin, Q.; Liu, L.; Yuan, H.; Li, Z. Occurrence, Sources and Health Risks of Toxic Metal(Loid)s in Road Dust from a Mega City (Nanjing) in China. Environ. Pollut. 2020, 263, 114518. [Google Scholar] [CrossRef] [PubMed]
  125. Habil, M.; Massey, D.D.; Taneja, A. Exposure of Children Studying in Schools of India to PM Levels and Metal Contamination: Sources and Their Identification. Air. Qual. Atmos. Health 2013, 6, 575–587. [Google Scholar] [CrossRef]
  126. Latif, M.T.; Yong, S.M.; Saad, A.; Mohamad, N.; Baharudin, N.H.; Mokhtar, M.B.; Tahir, N.M. Composition of Heavy Metals in Indoor Dust and Their Possible Exposure: A Case Study of Preschool Children in Malaysia. Air. Qual. Atmos. Health 2014, 7, 181–193. [Google Scholar] [CrossRef]
  127. Olujimi, O.; Steiner, O.; Goessler, W. Pollution Indexing and Health Risk Assessments of Trace Elements in Indoor Dusts from Classrooms, Living Rooms and Offices in Ogun State, Nigeria. J. Afr. Earth Sci. 2015, 101, 396–404. [Google Scholar] [CrossRef]
  128. Victor, O.; Kingsley Chukwuemeka, P.-I.; Eucharia Oluchi, N. Heavy Metals Contents, and Health Risk Assessment of Classroom Corner Dusts in Selected Public Primary Schools in Rivers State, Nigeria. JEPHH 2018, 6, 138–147. [Google Scholar] [CrossRef]
  129. Li, N.; Han, W.; Tang, J.; Bian, J.; Sun, S.; Song, T. Pollution characteristics and human health risks of elements in road dust in Changchun, China. Int. J. Environ. Res. Public Health 2018, 15, 1843. [Google Scholar] [CrossRef]
  130. United States Environmental Protection Agency (USEPA). Supplemental Guidance for Developing Soil Screening Levels for Superfund Sites; OSWER 9355/4-24; Office of Emergency and Remedial Response: Washington, DC, USA, 2002.
  131. He, K.; Wang, S.; Zhang, J. Blood lead levels of children and its trend in China. Sci. Total Environ. 2009, 407, 3986–3993. [Google Scholar] [CrossRef]
  132. Cheng, H.; Hu, Y. Lead (Pb) Isotopic Fingerprinting and Its Applications in Lead Pollution Studies in China: A Review. Environ. Pollut. 2010, 158, 1134–1146. [Google Scholar] [CrossRef] [PubMed]
  133. Banerjee, A.D.K. Heavy Metal Levels and Solid Phase Speciation in Street Dusts of Delhi, India. Environ. Pollut. 2003, 123, 95–105. [Google Scholar] [CrossRef]
  134. Aelion, C.M.; Davis, H.T.; McDermott, S.; Lawson, A.B. Metal Concentrations in Rural Topsoil in South Carolina: Potential for Human Health Impact. Sci. Total Environ. 2008, 402, 149–156. [Google Scholar] [CrossRef]
  135. Hunt, A.; Johnson, D.; Griffith, D. Mass transfer of soil indoors by track-in on footwear. Sci. Total Environ. 2006, 370, 360–371. [Google Scholar] [CrossRef]
  136. United States Environmental Protection Agency (USEPA). Supplemental Guidance for Developing Soil Screening Levels for Superfund Sites; Office of Solid Waste and Emergency Response (OSWER): Washington, DC, USA, 2011.
  137. Gope, M.; Masto, R.E.; George, J.; Hoque, R.R.; Balachandran, S. Bioavailability and health risk of some potentially toxic elements (Cd, Cu, Pb, and Zn) in street dust of Asansol, India. Ecotoxicol. Environ. Saf. 2017, 138, 231–241. [Google Scholar] [CrossRef]
  138. Peng, C.; Chen, W.; Liao, X.; Wang, M.; Ouyang, Z.; Jiao, W.; Bai, Y. Polycyclic aromatic hydrocarbons in urban soils of Beijing: Status, sources, distribution, and potential risk. Environ. Pollut. 2011, 159, 802–808. [Google Scholar] [CrossRef] [PubMed]
  139. Zheng, N.; Liu, J.; Wang, Q.; Liang, Z. Health risk assessment of heavy metal exposure to street dust in the zinc smelting district, Northeast of China. Sci. Total Environ. 2010, 408, 726–733. [Google Scholar] [CrossRef]
  140. ESAG. Environmental Site Assessment Guideline; DB11/T656–2009; Adelaide Airport: Adelaide, Australia, 2009. (In Chinese)
  141. United States Environmental Protection Agency (USEPA). Child-Specific Exposure Factors Handbook; EPA-600-P-00e002B; National Center for Environmental Assessment: Washington, DC, USA, 2002.
  142. United States Environmental Protection Agency (USEPA). Risk Assessment Guidance for Superfund: Volume III—Part A, Process for Conducting Probabilistic Risk Assessment; EPA540-R-02-002; U.S. Environmental Protection Agency: Washington, DC, USA, 2001.
  143. Hu, X.; Zhang, Y.; Luo, J.; Wang, T.J.; Lian, H.Z.; Ding, Z.H. Bioaccessibility and health risk of arsenic, mercury and other metals in urban street dusts from a mega-city, Nanjing, China. Environ. Pollut. 2011, 159, 1215–1221. [Google Scholar] [CrossRef] [PubMed]
  144. Lu, X.; Wang, L.; Li, L.Y.; Lei, K.; Huang, L.; Kang, D. Multivariate statistical analysis of heavy metals in street dust of Baoji NW China. J. Hazard. Mater. 2010, 173, 744–749. [Google Scholar] [CrossRef] [PubMed]
  145. USEPA. Risk Assessment Guidance for Superfund. Volume I: Human Health Evaluation Manual (Part E, Supplemental Guidance for Dermal Risk Assessment); EPA/540/R/99; USEPA: Washington, DC, USA, 2004.
  146. Li, R.Z.; Zhou, A.J.; Tong, F.; Wu, Y.D.; Zhang, P.; Yu, J. Distribution of metals in urban dusts of Hefei and health risk assessment. Chin. J. Environ. Sci. 2011, 32, 2661–2668. [Google Scholar]
  147. Zheng, X.; Zhao, W.; Yan, X.; Shu, T.; Xiong, Q.; Chen, F. Pollution characteristics and health risk assessment of airborne heavy metals collected from Beijing Bus Stations. Int. J. Environ. Res. Public Health 2015, 12, 9658–9671. [Google Scholar] [CrossRef] [Green Version]
  148. Kamunda, C.; Mathuthu, M.; Madhuku, M. Health risk assessment of heavy metals in soils from Witwatersrand Gold Mining Basin, South Africa. Int. J. Environ. Res. Public Health 2016, 13, 663. [Google Scholar] [CrossRef]
  149. Liu, Y.; Lei, S.; Chen, X. Assessment of heavy metal pollution and human health risk in urban soils of a coal mining city in East China. Hum. Ecol. Risk Assess. Int. J. 2016, 22, 1359–1374. [Google Scholar] [CrossRef]
  150. Adimalla, N. Heavy metals contamination in urban surface soils of Medak province, India, and its risk assessment and spatial distribution. Environ. Geochem. Health 2019, 42, 59–75. [Google Scholar] [CrossRef]
  151. Huang, S.L.; Li, Q.; Xu, D.S. Heavy metal pollution in Suzhou urban soils and its health risk assessment. Adv. Mater. Res. 2012, 534, 244–248. [Google Scholar] [CrossRef]
  152. Lu, X.; Zhang, X.; Li, L.Y.; Chen, H. Assessment of metals pollution and health risk in dust from nursery schools in Xi’an, China. Environ. Res. 2014, 128, 27–34. [Google Scholar] [CrossRef]
  153. Pavilonis, B.; Grassman, J.; Johnson, G.; Diaz, Y.; Caravanos, J. Characterization and risk of exposure to elements from artisanal gold mining operations in the Bolivian Andes. Environ. Res. 2017, 154, 1–9. [Google Scholar] [CrossRef]
  154. Bello, S.; Muhammad, B.G.; Bature, B. Total excess lifetime cancer risk estimation from enhanced heavy metals concentrations resulting from tailings in Katsina Steel Rolling Mill, Nigeria. J. Mater. Sci. Eng. 2017, 6, 338. [Google Scholar]
  155. Johnbull, O.; Abbassi, B.; Zytner, R.G. Risk assessment of heavy metals in soil based on the geographic information system-Kriging technique in Anka, Nigeria. Environ. Eng. Res. 2019, 24, 150–158. [Google Scholar] [CrossRef]
  156. Zhang, J.; Hua, P.; Krebs, P. Influences of land use and antecedent dry-weather period on pollution level and ecological risk of heavy metals in road-deposited sediment. Environ. Pollut. 2017, 228, 158–168. [Google Scholar] [CrossRef] [PubMed]
  157. Liu, E.; Wang, X.; Liu, H.; Liang, M.; Zhu, Y.; Li, Z. Chemical speciation, pollution and ecological risk of toxic metals in readily washed off road dust in a megacity (Nanjing), China. Ecotoxicol. Environ. Saf. 2019, 173, 381–392. [Google Scholar] [CrossRef] [PubMed]
  158. Mohammadi, A.; Hajizadeh, Y.; Taghipour, H.; Arani, A.M.; Mokhtari, M.; Fallahzadeh, H. Assessment of metals in agricultural soil of surrounding areas of Urmia Lake, northwest Iran: A preliminary ecological risk assessment and source identification. Hum. Ecol. Risk Assess. 2018, 24, 2070–2087. [Google Scholar] [CrossRef]
Figure 1. Map of Saudi Arabia illustrating the cities of Jeddah, Jubail, and Dammam.
Ijerph 20 02687 g001
Figure 2. The concentrations of PHEs in ACFD of mosques located in different cities are based on function areas (urban areas-UA; suburban areas-SA; workshop areas-WSA).
Ijerph 20 02687 g002aIjerph 20 02687 g002b
Figure 3. Relative contribution (%) of each PHE to ∑PHEs concentrations in ACFD of mosques located in different functional areas of Jubail and Jeddah cities and Dammam metropolitan area (A), and in ACFD of Jubail, Jeddah and Dammam metropolitan area mosques (B).
Ijerph 20 02687 g003aIjerph 20 02687 g003b
Figure 4. Contamination factor (Cf), degree of contamination (Cd), pollution load index (PLI), and geo-accumulation index (Igeo) of PHEs in ACFD of Jubail, Dammam metropolitan, and Jeddah mosques: Based on the global crustal data (A) and local background soil data (B).
Ijerph 20 02687 g004aIjerph 20 02687 g004b
Figure 5. Enrichment factors analysis (EFs) of PHEs in ACFD of Jubail, Dammam metropolitan, and Jeddah mosques.
Ijerph 20 02687 g005
Figure 6. Variation of potential ecological risks for PHEs in ACFD of Jubail, Dammam metropolitan, and Jeddah mosques.
Ijerph 20 02687 g006
Figure 7. Relative contribution of the individual PHE hazard index (HI) to ∑HI for total PHEs in Jubail, Dammam metropolitan, and Jeddah mosques for children and adults.
Ijerph 20 02687 g007
Figure 8. Relative contribution of the individual PHE cancer risk (CR) to ∑CR for total PHEs in Jubail, Dammam metropolitan, and Jeddah mosques for children and adults.
Ijerph 20 02687 g008
Table 1. Descriptive statistics of PHEs content in ACFD of the mosques in Jubail, Dammam metropolitan, and Jeddah cities.
City FeAlZnMnCuCrPbNiVCoAsCd
JubailMinimum (mg/kg)7831.03368.5362.2270.795.333.526.632.419.63.22.20.7
Maximum (mg/kg)15,006.011,005.51065.1478.0273.657.397.555.740.88.16.01.7
Median (mg/kg)11,116.04932.5768.1370.0131.747.133.845.528.34.14.61.0
Arithmetical mean (AM) (mg/kg)10,797.95662.8764.1386.0160.945.151.243.728.54.64.31.1
Geometrical mean (GM) (mg/kg)10,503.15248.4731.8381.1150.244.344.842.827.64.44.11.0
Standard deviation (SD)2679.32519.5219.864.367.38.628.19.37.81.71.30.3
Standard Error (SE)893.1839.873.321.422.42.99.43.12.60.60.40.1
Coefficient of variation (CV, %)24.844.528.816.741.819.155.021.327.336.129.432.1
95% confidence limit value (C95%UCL)12,857.07598.0932.9435.4212.651.772.850.834.55.95.31.4
Dammam metropolitanMinimum (mg/kg)6611.04063.5365.0143.3109.336.127.929.117.24.02.40.8
Maximum (mg/kg)17,356.011,305.51672.1401.8340.599.0171.968.443.88.87.61.8
Median (mg/kg)11,426.07675.5781.0284.1222.947.740.046.233.86.44.61.2
Arithmetical mean (AM) (mg/kg)11,138.27469.0832.3271.5208.650.654.348.132.76.64.51.2
Geometrical mean (GM) (mg/kg)10,871.97303.7765.8265.2202.049.247.147.231.86.44.31.2
Standard deviation (SD)2540.41556.0357.057.552.814.337.19.27.21.31.50.3
Standard Error (SE)598.8366.884.213.612.53.48.72.21.70.30.40.1
Coefficient of variation (CV, %)22.820.842.921.225.328.268.319.121.920.033.425.8
95% confidence limit value (C95%UCL)12,401.58077.51009.9300.1234.957.772.752.636.27.25.31.4
JeddahMinimum (mg/kg)7911.05318.5464.0186.7123.337.060.731.340.75.41.31.0
Maximum (mg/kg)29,246.016,055.51774.1530.8514.6668.8298.391.195.424.65.82.1
Median (mg/kg)14,496.09992.5751.7320.2173.647.084.041.558.79.03.61.4
Arithmetical mean (AM) (mg/kg)15,508.110,129.1835.7347.0214.484.8110.249.360.110.33.71.4
Geometrical mean (GM) (mg/kg)14,824.19815.4789.4335.3196.658.297.647.458.29.73.61.4
Standard deviation (SD)5000.62628.9314.093.0106.0134.264.715.715.84.21.00.3
Standard Error (SE)1066.1560.566.919.822.628.613.83.33.40.90.20.1
Coefficient of variation (CV, %)32.226.037.626.849.5158.358.731.826.341.327.920.8
95% confidence limit value (C95%UCL)17,725.211,294.7974.9388.2261.4144.3138.956.367.112.24.21.6
Crustal background value [42,43]56,300.082,300.070.0950.055.0100.012.575.0135.025.01.80.2
Local background soil value [45]18,500.0-81.0520.020.241.015.222.034.94.62.30.4
Table 2. Comparison of the PHEs concentrations (mg/kg) in the ACFD from mosques in Saudi Arabia with indoor dust from other different cities of the world.
LocationConcentrationFeAlZnMnCuPbCrNiAsCoVCdReference
Saudi Arabia (Jubail)Average10,797.95662.8764.1386.0160.951.245.143.74.34.628.51.1Present study
Median11,116.04932.5768.1370.0131.733.847.145.54.64.128.31.0
Saudi Arabia (Dammam metropolitan)Average11,138.27469.0832.3271.5208.654.350.648.14.56.632.71.2Present study
Median11,426.07675.5781.0284.1222.940.047.746.24.66.433.81.2
Saudi Arabia (Jeddah)Average15,508.110,129.1835.7347.0214.4110.284.849.33.710.360.11.4Present study
Median14,496.09992.5751.7320.2173.684.047.041.53.69.058.71.4
KuwaitAverage14,45312,697784.0441.0209.0158.090.056.013.012.5 Al-Harbi et al. [67]
Slovenia (Maribor)Median--716.0306.0140.069.065.038.04.16.217.01.2Gabersek and Gosar [86]
Canada (Toronto)Median--386.058.0136.036.042.023.0---1.7Al Hejami et al. [87]
China (Tongling)Average27,111.2-978.9-323.1279.262.352.7-4.3-5.1Yangbing et al. [88]
Pakistan (Lahore)Average--1053.0-116.0230.0194.053.67.5-36.75.2Rehman et al. [89]
Nepal (viz. Kathmandu, Pokhara, Birgunj, and Biratnagar)Median838.0-1260.01650.0275.0233.0231.0122.03.028.1-1.8Yadav et al. [90]
Iran (Shiraz)Average16,945.5-258.8288.940.0258.8172.850.12.86.4-1.0Moghtaderi et al. [91]
Saudi Arabia (Jeddah)Average--524.0270.0126.0-61.443.2-10.7-0.9Albar et al. [75]
Qatar (Doha city)Average20,50419,812824.3369.8192.965.391.868.77.212.352.10.7Mahfouz et al. [92]
Saudi Arabia (Jeddah)Average8752.0-343.0392.088.0121.040.036.08.08.143.92.1Alghamdi et al. [21]
Nigeria (southern Nigeria)Median11,3005430.01110.0161.0161.0207.040.125.3-3.8-3.8Iwegbue et al. [93]
Australia (Sydney)Average--1876.0220.0272.0299.090.050.917.6-- Doyi et al. [94]
Jordan (Jordanian)Average8400.0700.04500.0-500.0-90.040.0-2.0-5.0Arar et al. [95]
Portugal (Estarreja)Mean-11,5002090.0188.0311.0380.063.013.013.05.118.01.4Plumejeaud et al. [96]
Iran (Shiraz Shiraz megacity)Average--233.3-40.0258.9172.850.12.86.4-1.0Moghtaderi et al. [97]
Saudi Arabia (Riyadh)Average--94.490.071.824.827.020.3-2.015.4-El-Mubarak et al. [98]
Egypt (Cairo)Average20,818.09092.0419.0425.0116.699.348.630.14.09.045.71.0Gad et al. [99]
Table 3. Summary of hazard quotients (HQ), hazard index (HI), incremental lifetime cancer risk (ILCR), and cancer risk (CR) of PHEs in ACFD collected samples from Jubail mosques via non-dietary ingestion, inhalation, and dermal contact exposure pathways.
Non-Cancer RisksChildrenAdults
PHEsHQingHQinhHQdermalHIHQingHQinhHQdermalHI
Fe1.8 × 10−31.9 × 10−33.4 × 10−4 4.0 × 10−31.9 × 10−4 6.9 × 10⁻⁴ 7.0 × 10⁻⁴ 1.6 × 10⁻³
Al7.9 × 10−34.4 × 10−71.3 × 10−57.9 × 10−38.4 × 10−4 1.6 × 10−72.6 × 10−58.7 × 10⁻⁴
Zn3.5 × 10−39.9 × 10−82.8 × 10−53.6 × 10−33.8 × 10−4 3.6 × 10−85.8 × 10−54.4 × 10⁻⁴
Mn1.1 × 10−2 1.1 × 10−34.7 × 10−4 1.3 × 10⁻² 1.2 × 10−33.8 × 10−4 9.5 × 10⁻⁴ 2.6 × 10⁻³
Cu5.6 × 10−31.6 × 10−73.0 × 10−55.6 × 10−36.0 × 10−4 5.6 × 10−86.1 × 10−56.6 × 10⁻⁴
Cr2.1 × 10−2 6.1 × 10−52.0 × 10−32.3 × 10⁻² 2.2 × 10−32.2 × 10−54.1 × 10−36.3 × 10−3
Pb2.0 × 10−2 5.7 × 10−72.2 × 10−4 2.1 × 10⁻² 2.2 × 10−32.0 × 10−74.4 × 10⁻⁴ 2.6 × 10⁻³
Ni3.0 × 10−38.3 × 10−81.8 × 10−53.1 × 10−33.2 × 10−4 3.0 × 10−83.7 × 10−53.6 × 10⁻⁴
V5.7 × 10−31.6 × 10−79.1 × 10−4 6.6 × 10−36.1 × 10−4 5.7 × 10−81.8 × 10−32.5 × 10⁻³
Co3.2 × 10−4 3.1 × 10−56.4 × 10−73.5 × 10⁻⁴ 3.4 × 10−51.1 × 10−51.3 × 10−64.7 × 10−5
As2.0 × 10−2 5.6 × 10−77.8 × 10−52.0 × 10⁻² 2.1 × 10−32.0 × 10−71.6 × 10⁻⁴ 2.3 × 10⁻³
Cd1.5 × 10−34.2 × 10−82.4 × 10−4 1.8 × 10−31.6 × 10−4 1.5 × 10−84.9 × 10−4 6.5 × 10⁻⁴
Total1.0 × 10−13.1 × 10−34.3 × 10−31.1 × 10−11.1 × 10−2 1.1 × 10−38.9 × 10−32.1 × 10⁻²
Cancer RisksChildrenAdults
PHEsILCRingILCRinhILCRdermalCRILCRingILCRinhILCRdermalCR
Cr1.27 × 10−62.97 × 10−98.09 × 10−81.4 × 10−69.10 × 10−77.18 × 10−91.11 × 10−62.0 × 10⁻⁶
Pb2.44 × 10−83.37 × 10−123.90 × 10−112.4 × 10−81.75 × 10−88.15 × 10−125.33 × 10−101.8 × 10⁻⁸
Ni4.17 × 10−65.76 × 10−111.67 × 10−74.3 × 10−62.99 × 10−61.39 × 10−102.28 × 10−65.3 × 10−6
Co 7.08 × 10⁻¹¹ 7.1 × 10⁻¹¹ 1.71 × 10⁻¹⁰ 1.7 × 10⁻¹⁰
As3.62 × 10−71.01 × 10−112.89 × 10−93.6 × 10−72.59 × 10−72.44 × 10−113.95 × 10−83.0 × 10−7
Cd2.32 × 10−86.49 × 10−135.95 × 10−102.4 × 10−81.66 × 10−81.57 × 10−128.13 × 10−92.5 × 10−8
Total5.9 × 10−63.1 × 10−92.5 × 10−76.1 × 10−64.2 × 10−67.5 × 10−93.4 × 10−67.6 × 10⁻⁶
Table 4. Summary of hazard quotients (HQ), hazard index (HI), incremental lifetime cancer risk (ILCR), and cancer risk (CR) of PHEs in ACFD collected samples from Dammam metropolitan mosques via non-dietary ingestion, inhalation, and dermal contact exposure pathways.
Non-Cancer RisksChildrenAdults
PHEsHQingHQinhHQdermalHIHQingHQinhHQdermalHI
Fe1.8 × 10−32.0 × 10−33.5 × 10−4 4.2 × 10−32.0 × 10−4 7.1 × 10⁻⁴ 7.2 × 10⁻⁴ 1.6 × 10⁻³
Al1.0 × 10−25.8 × 10−71.7 × 10−51.0 × 10−21.1 × 10−32.1 × 10−73.4 × 10−51.1 × 10⁻³
Zn3.9 × 10−31.1 × 10−73.1 × 10−53.9 × 10−34.1 × 10−4 3.9 × 10−86.3 × 10−54.8 × 10⁻⁴
Mn8.0 × 10−37.4 × 10⁻⁴ 3.3 × 10⁻⁴ 9.1 × 10−38.6 × 10−4 2.7 × 10⁻⁴ 6.7 × 10⁻⁴ 1.8 × 10⁻³
Cu7.2 × 10−32.0 × 10−73.9 × 10−57.3 × 10−37.8 × 10−4 7.3 × 10−87.9 × 10−58.5 × 10⁻⁴
Cr2.3 × 10−26.9 × 10−52.2 × 10−32.6 × 10−22.5 × 10−32.5 × 10−54.6 × 10−37.1 × 10⁻³
Pb2.2 × 10−26.0 × 10−72.3 × 10−4 2.2 × 10−22.3 × 10−32.2 × 10−74.7 × 10−4 2.8 × 10⁻³
Ni3.3 × 10−39.1 × 10−82.0 × 10−53.4 × 10−33.6 × 10−4 3.3 × 10−84.0 × 10−54.0 × 10⁻⁴
V6.5 × 10−31.8 × 10−71.0 × 10−37.5 × 10−36.9 × 10−4 6.5 × 10−82.1 × 10−32.8 × 10⁻³
Co4.6 × 10−4 4.5 × 10−59.1 × 10−75.0 × 10⁻⁴ 4.9 × 10−51.6 × 10−51.9 × 10−66.7 × 10−5
As2.1 × 10−25.9 × 10−78.2 × 10−52.1 × 10−22.3 × 10−32.1 × 10−71.7 × 10−4 2.4 × 10⁻³
Cd1.7 × 10−34.7 × 10−82.7 × 10−4 2.0 × 10−31.8 × 10−4 1.7 × 10−85.5 × 10−4 7.3 × 10⁻⁴
Total1.1 × 10−12.8 × 10−34.7 × 10−31.2 × 10−11.2 × 10−21.0 × 10−39.5 × 10−32.2 × 10⁻²
Cancer RisksChildrenAdults
PHEsILCRingILCRinhILCRdermalCRILCRingILCRinhILCRdermalCR
Cr1.42 × 10−63.34 × 10−99.07 × 10−81.5 × 10−61.02 × 10−68.05 × 10−91.24 × 10−62.3 × 10⁻⁶
Pb2.59 × 10−83.58 × 10−124.14 × 10−112.6 × 10−81.86 × 10−88.64 × 10−125.65 × 10−101.9 × 10⁻⁸
Ni4.59 × 10−66.34 × 10−111.83 × 10−74.8 × 10−63.29 × 10−61.53 × 10−102.50 × 10−65.8 × 10−6
Co 1.01 × 10⁻¹⁰ 1.0 × 10⁻¹⁰ 2.44 × 10⁻¹⁰ 2.4 × 10⁻¹⁰
As3.83 × 10−71.07 × 10−113.06 × 10−93.9 × 10−72.75 × 10−72.59 × 10−114.18 × 10−83.2 × 10−7
Cd2.59 × 10−87.22 × 10−136.63 × 10−102.7 × 10−81.85 × 10−81.74 × 10−129.06 × 10−92.8 × 10−8
Total6.5 × 10−63.5 × 10−92.8 × 10−76.7 × 10−64.6 × 10−68.5 × 10−93.8 × 10−68.4 × 10⁻⁶
Table 5. Summary of hazard quotients (HQ), hazard index (HI), incremental lifetime cancer risk (ILCR), and cancer risk (CR) of PHEs in ACFD collected samples from Jeddah mosques via non-dietary ingestion, inhalation, and dermal contact exposure pathways.
Non-Cancer RisksChildrenAdults
PHEsHQingHQinhHQdermalHIHQingHQinhHQdermalHI
Fe2.6 × 10−32.7 × 10−34.9 × 10−4 5.8 × 10−32.7 × 10−4 9.9 × 10⁻⁴ 1.0 × 10−32.3 × 10−3
Al1.4 × 10−27.9 × 10−72.3 × 10−51.4 × 10−21.5 × 10−32.8 × 10−74.6 × 10−51.6 × 10⁻³
Zn3.9 × 10−31.1 × 10−73.1 × 10−53.9 × 10−34.1 × 10−4 3.9 × 10−86.3 × 10−54.8 × 10⁻⁴
Mn1.0 × 10−29.5 × 10⁻⁴ 4.2 × 10⁻⁴ 1.2 × 10−21.1 × 10−33.4 × 10⁻⁴ 8.5 × 10⁻⁴ 2.3 × 10⁻³
Cu7.4 × 10−32.1 × 10−74.0 × 10−57.5 × 10−38.0 × 10−4 7.5 × 10−88.1 × 10−58.8 × 10⁻⁴
Cr3.9 × 10−21.2 × 10⁻⁴ 3.8 × 10−34.3 × 10−24.2 × 10−34.2 × 10−57.7 × 10−31.2 × 10−2
Pb4.4 × 10−21.2 × 10−64.7 × 10−4 4.4 × 10−24.7 × 10−34.4 × 10−79.5 × 10−4 5.6 × 10⁻³
Ni3.4 × 10−39.3 × 10−82.0 × 10−53.4 × 10−33.7 × 10−4 3.4 × 10−84.1 × 10−54.1 × 10⁻⁴
V1.2 × 10−23.3 × 10−71.9 × 10−31.4 × 10−21.3 × 10−31.2 × 10−73.9 × 10−35.2 × 10⁻³
Co7.1 × 10−4 7.0 × 10−51.4 × 10−67.8 × 10⁻⁴ 7.6 × 10−52.5 × 10−52.9 × 10−61.0 × 10−4
As1.7 × 10−24.8 × 10−76.7 × 10−51.7 × 10−21.8 × 10−31.7 × 10−71.4 × 10−4 2.0 × 10⁻³
Cd2.0 × 10−35.6 × 10−83.2 × 10−4 2.3 × 10−32.1 × 10−4 2.0 × 10−86.5 × 10−4 8.6 × 10⁻⁴
Total1.6 × 10−13.9 × 10−37.6 × 10−31.7 × 10−11.7 × 10−21.4 × 10−31.5 × 10−23.4 × 10⁻²
Cancer RisksChildrenAdults
PHEsILCRingILCRinhILCRdermalCRILCRingILCRinhILCRdermalCR
Cr2.39 × 10−65.59 × 10−91.52 × 10−72.5 × 10−61.71 × 10−61.35 × 10−82.08 × 10−63.8 × 10⁻⁶
Pb5.26 × 10−87.26 × 10−128.40 × 10−115.3 × 10−83.77 × 10−81.75 × 10−111.15 × 10−93.9 × 10−8
Ni4.71 × 10−66.51 × 10−111.88 × 10−74.9 × 10−63.38 × 10−61.57 × 10−102.57 × 10−65.9 × 10−6
Co 1.58 × 10⁻¹⁰ 1.6 × 10⁻¹⁰ 3.82 × 10⁻¹⁰ 3.8 × 10⁻¹⁰
As3.14 × 10−78.77 × 10−122.51 × 10−93.2 × 10−72.25 × 10−72.12 × 10−113.42 × 10−82.6 × 10−7
Cd3.06 × 10−88.54 × 10−137.83 × 10−103.1 × 10−82.19 × 10−82.06 × 10−121.07 × 10−83.3 × 10−8
Total7.5 × 10−65.8 × 10−93.4 × 10−77.8 × 10−65.4 × 10−61.4 × 10−84.7 × 10−61.0 × 10⁻⁵
Disclaimer/Publisher’s Note: The statements, opinions and data contained in all publications are solely those of the individual author(s) and contributor(s) and not of MDPI and/or the editor(s). MDPI and/or the editor(s) disclaim responsibility for any injury to people or property resulting from any ideas, methods, instructions or products referred to in the content.

