
Three-Dimensional Digitization of Archaeological Sites—The Use Case of the Palace of Knossos

 , ,
, ,  ,
,  and
and 
Abstract
1. Introduction
2. Related Work
2.1. Three-Dimensional Reconstruction Technologies for Heritage Sites
2.2. Three-Dimensional Reconstruction in the Gaming Industry
2.3. Virtual Exhibitions for Heritage Sites
2.4. This Work
3. Design and Method
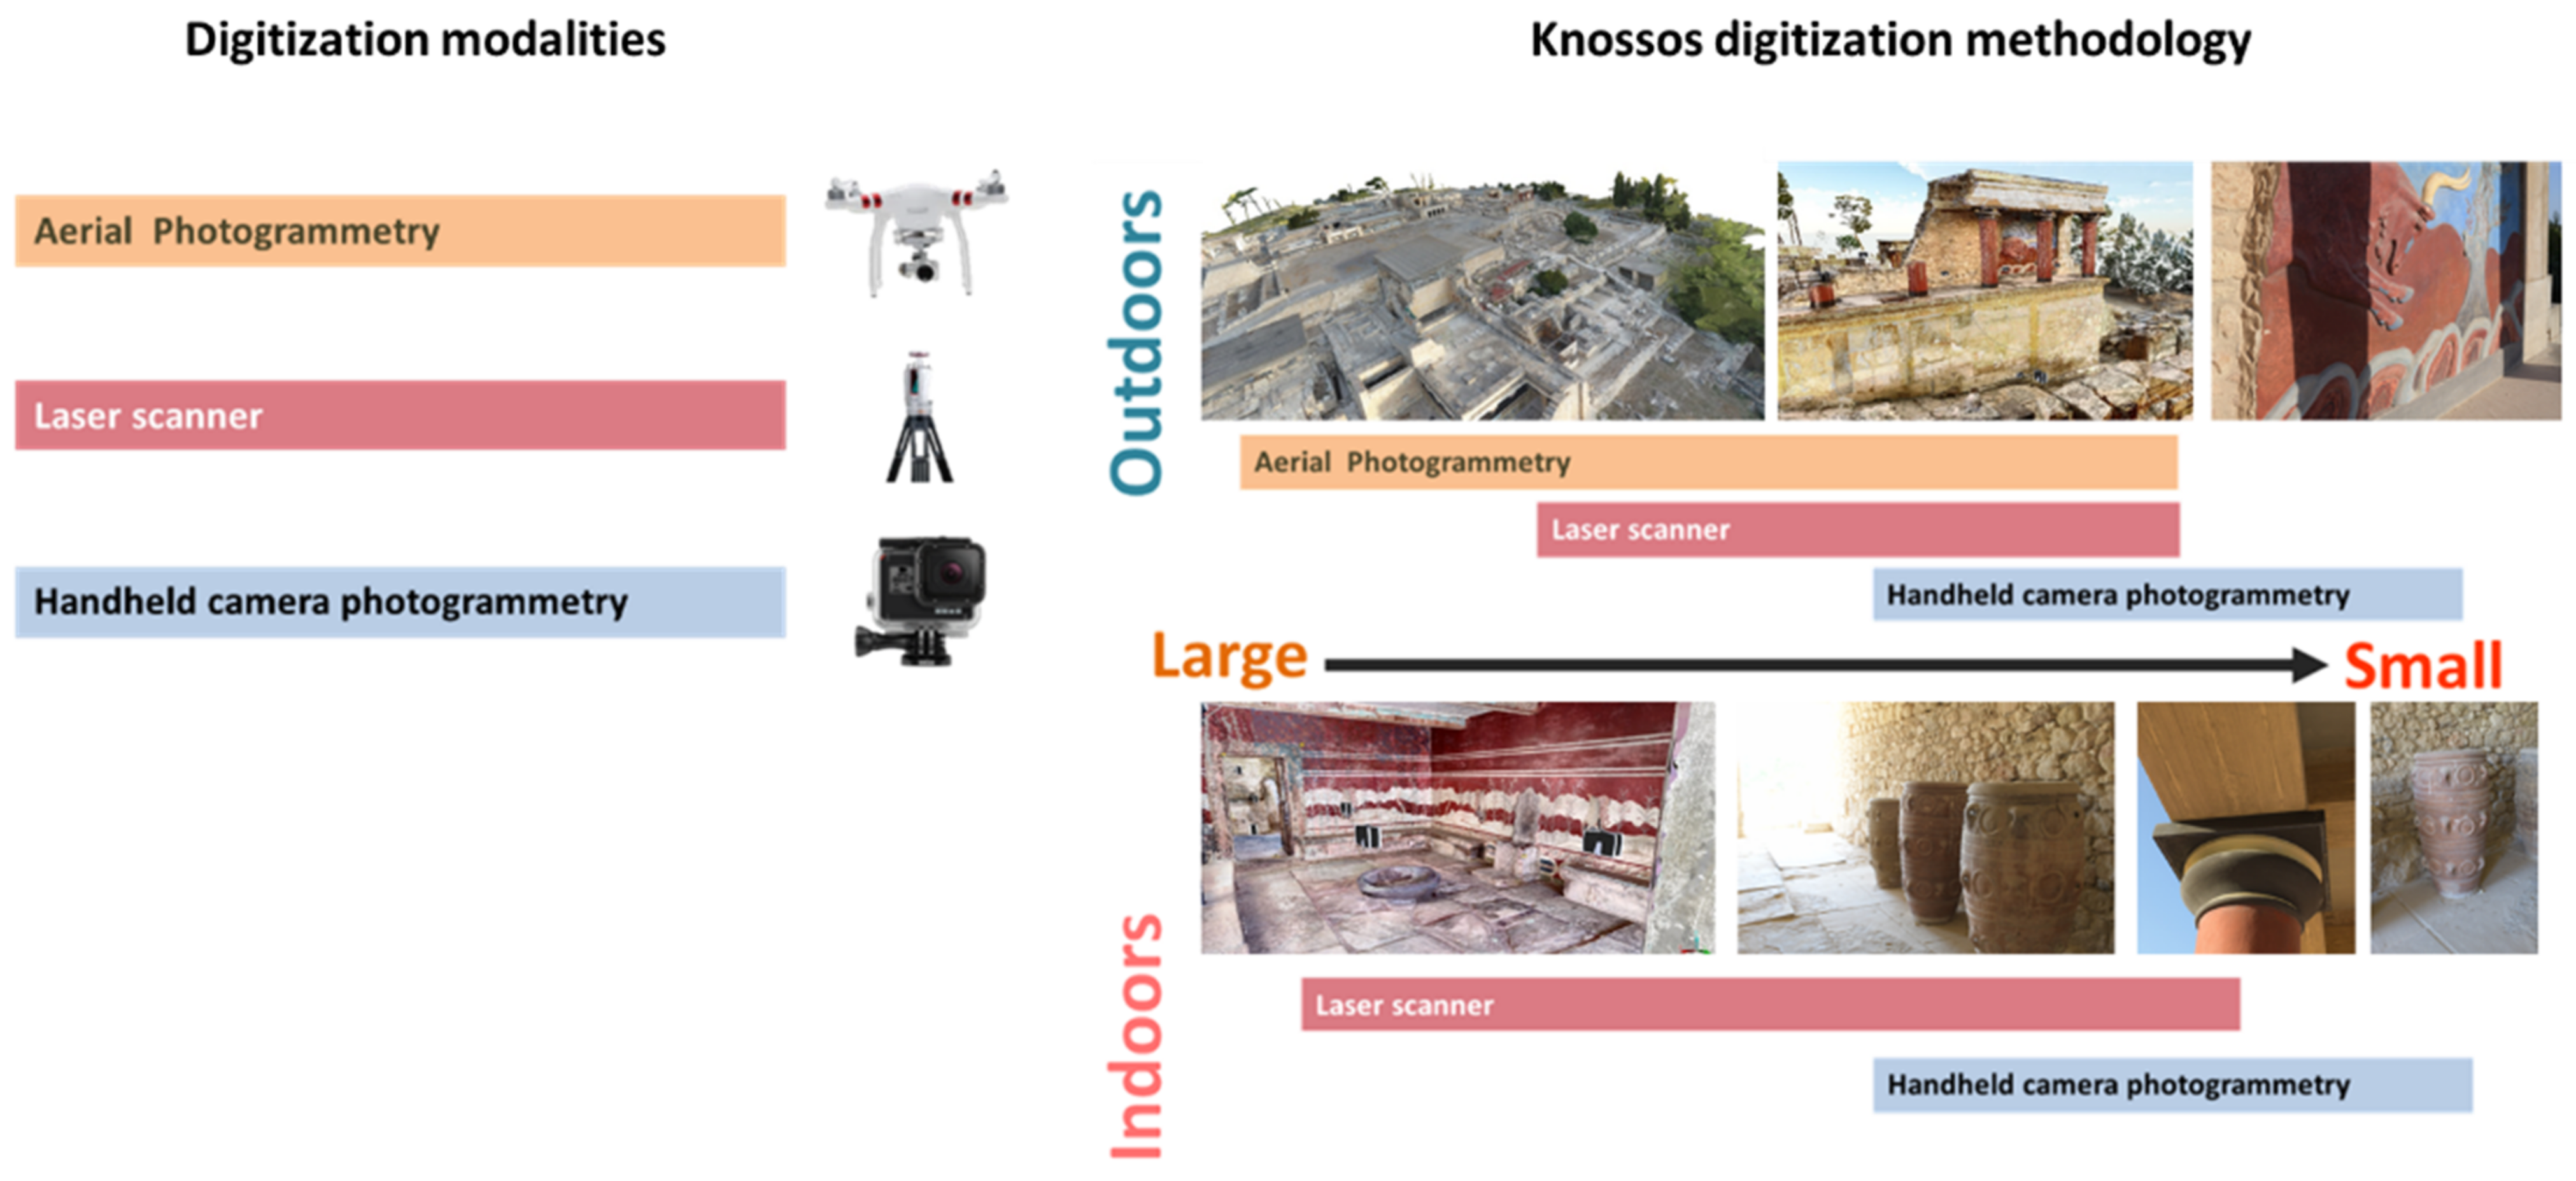
3.1. Digitization
3.2. Post-Processing
4. Digitization
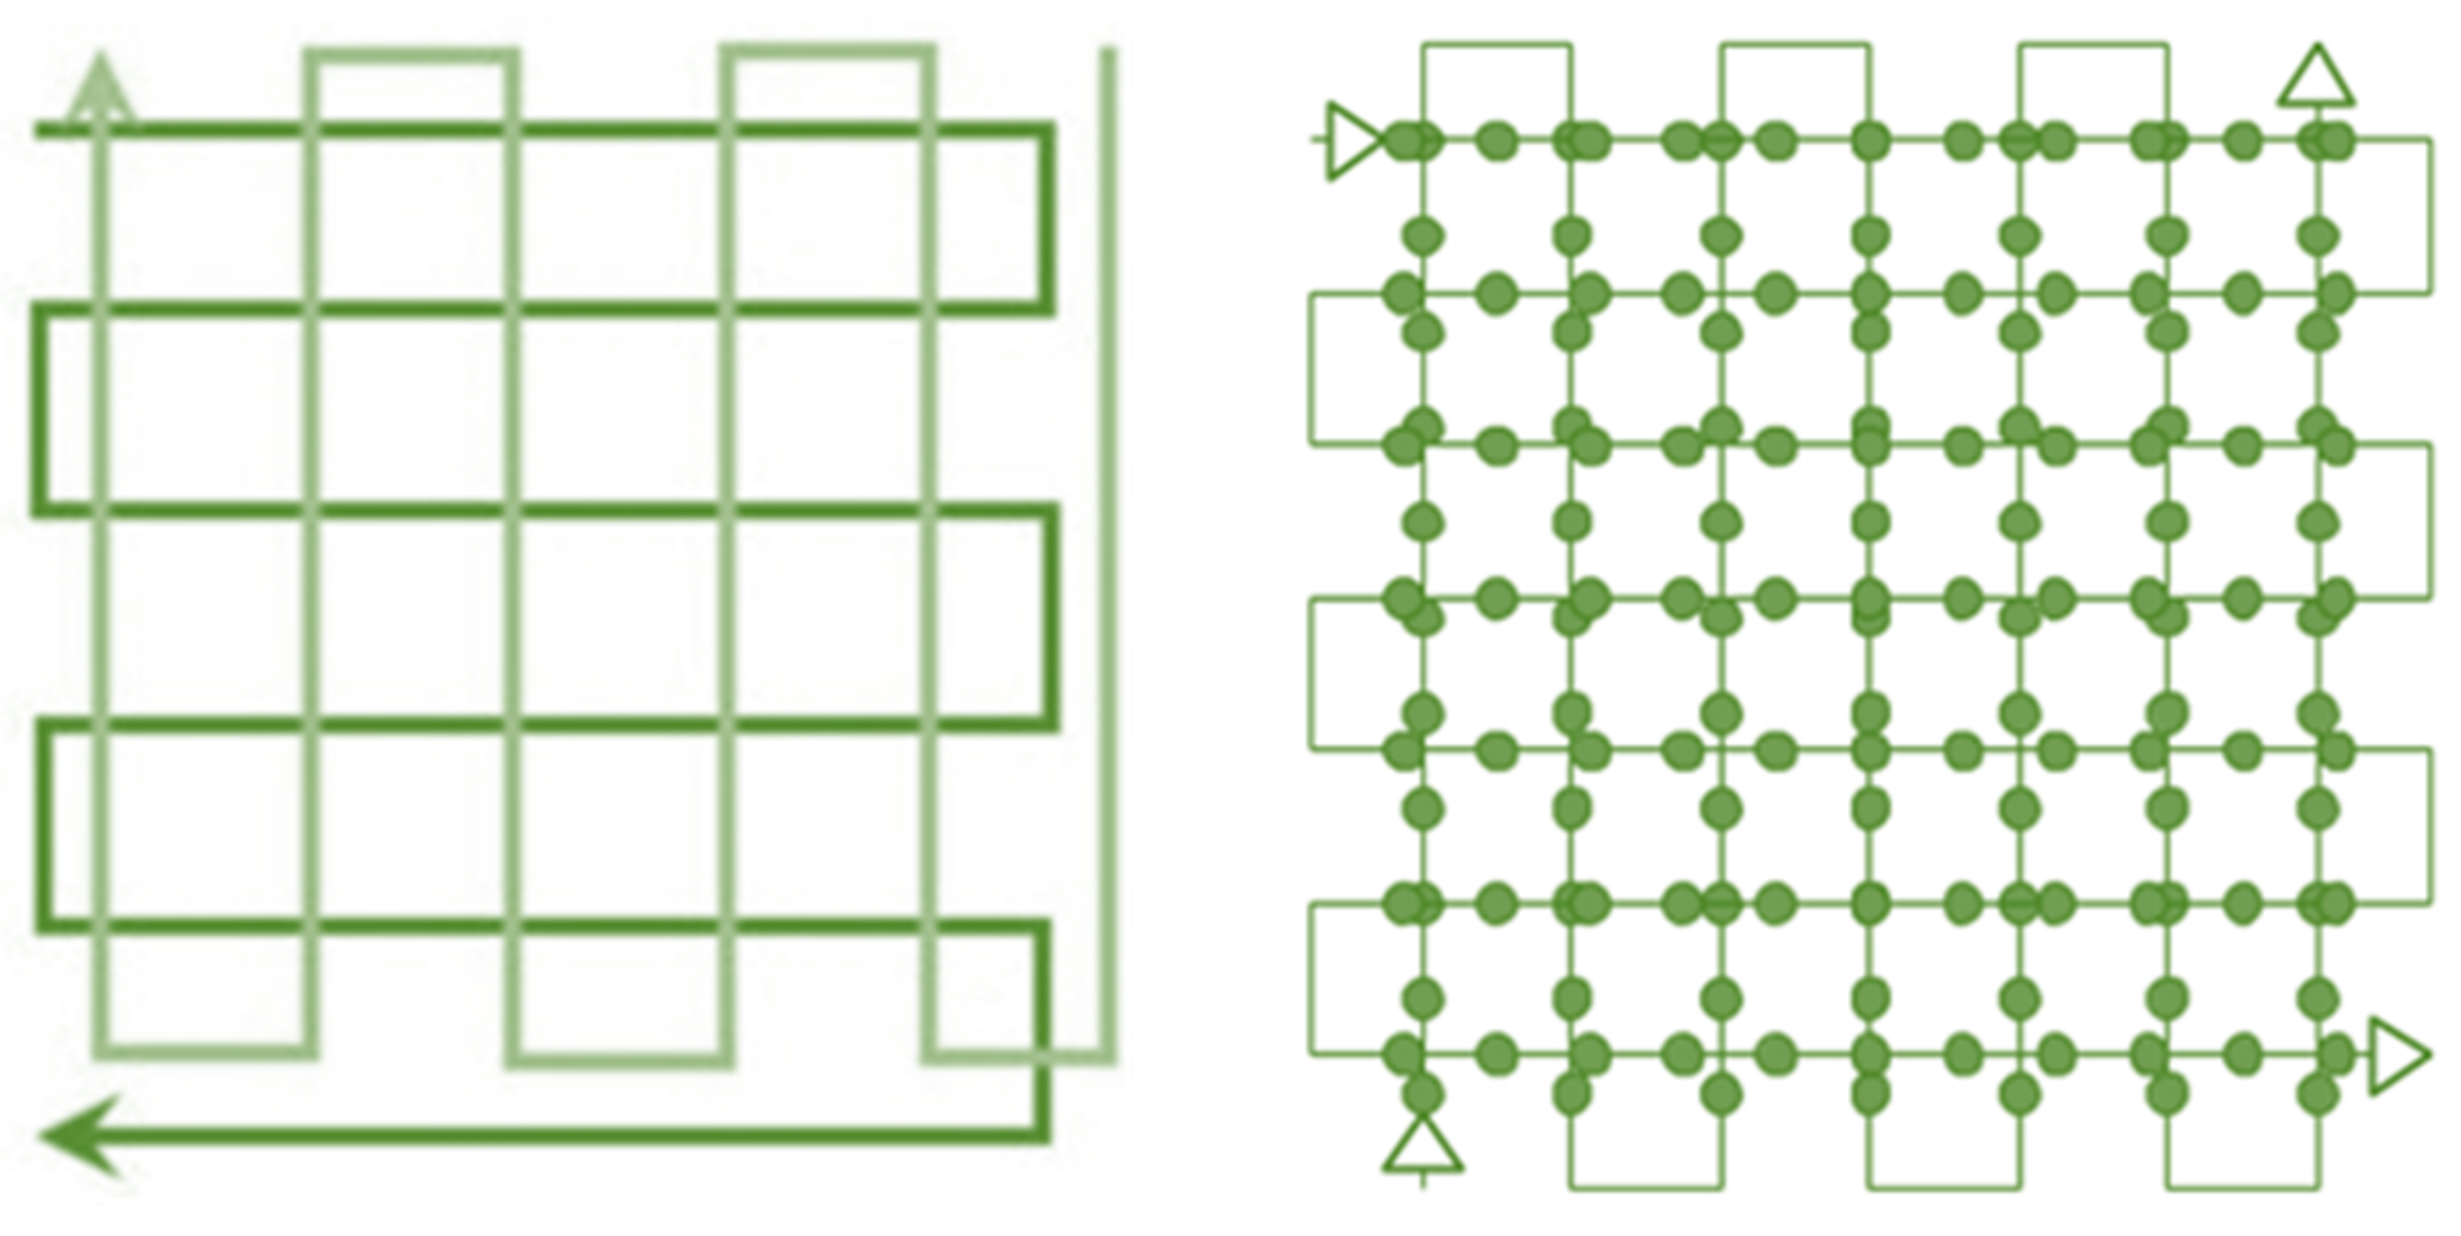
4.1. Aerial Scans
4.2. Terrestrial Scans


4.3. Long-Term Preservation of Data
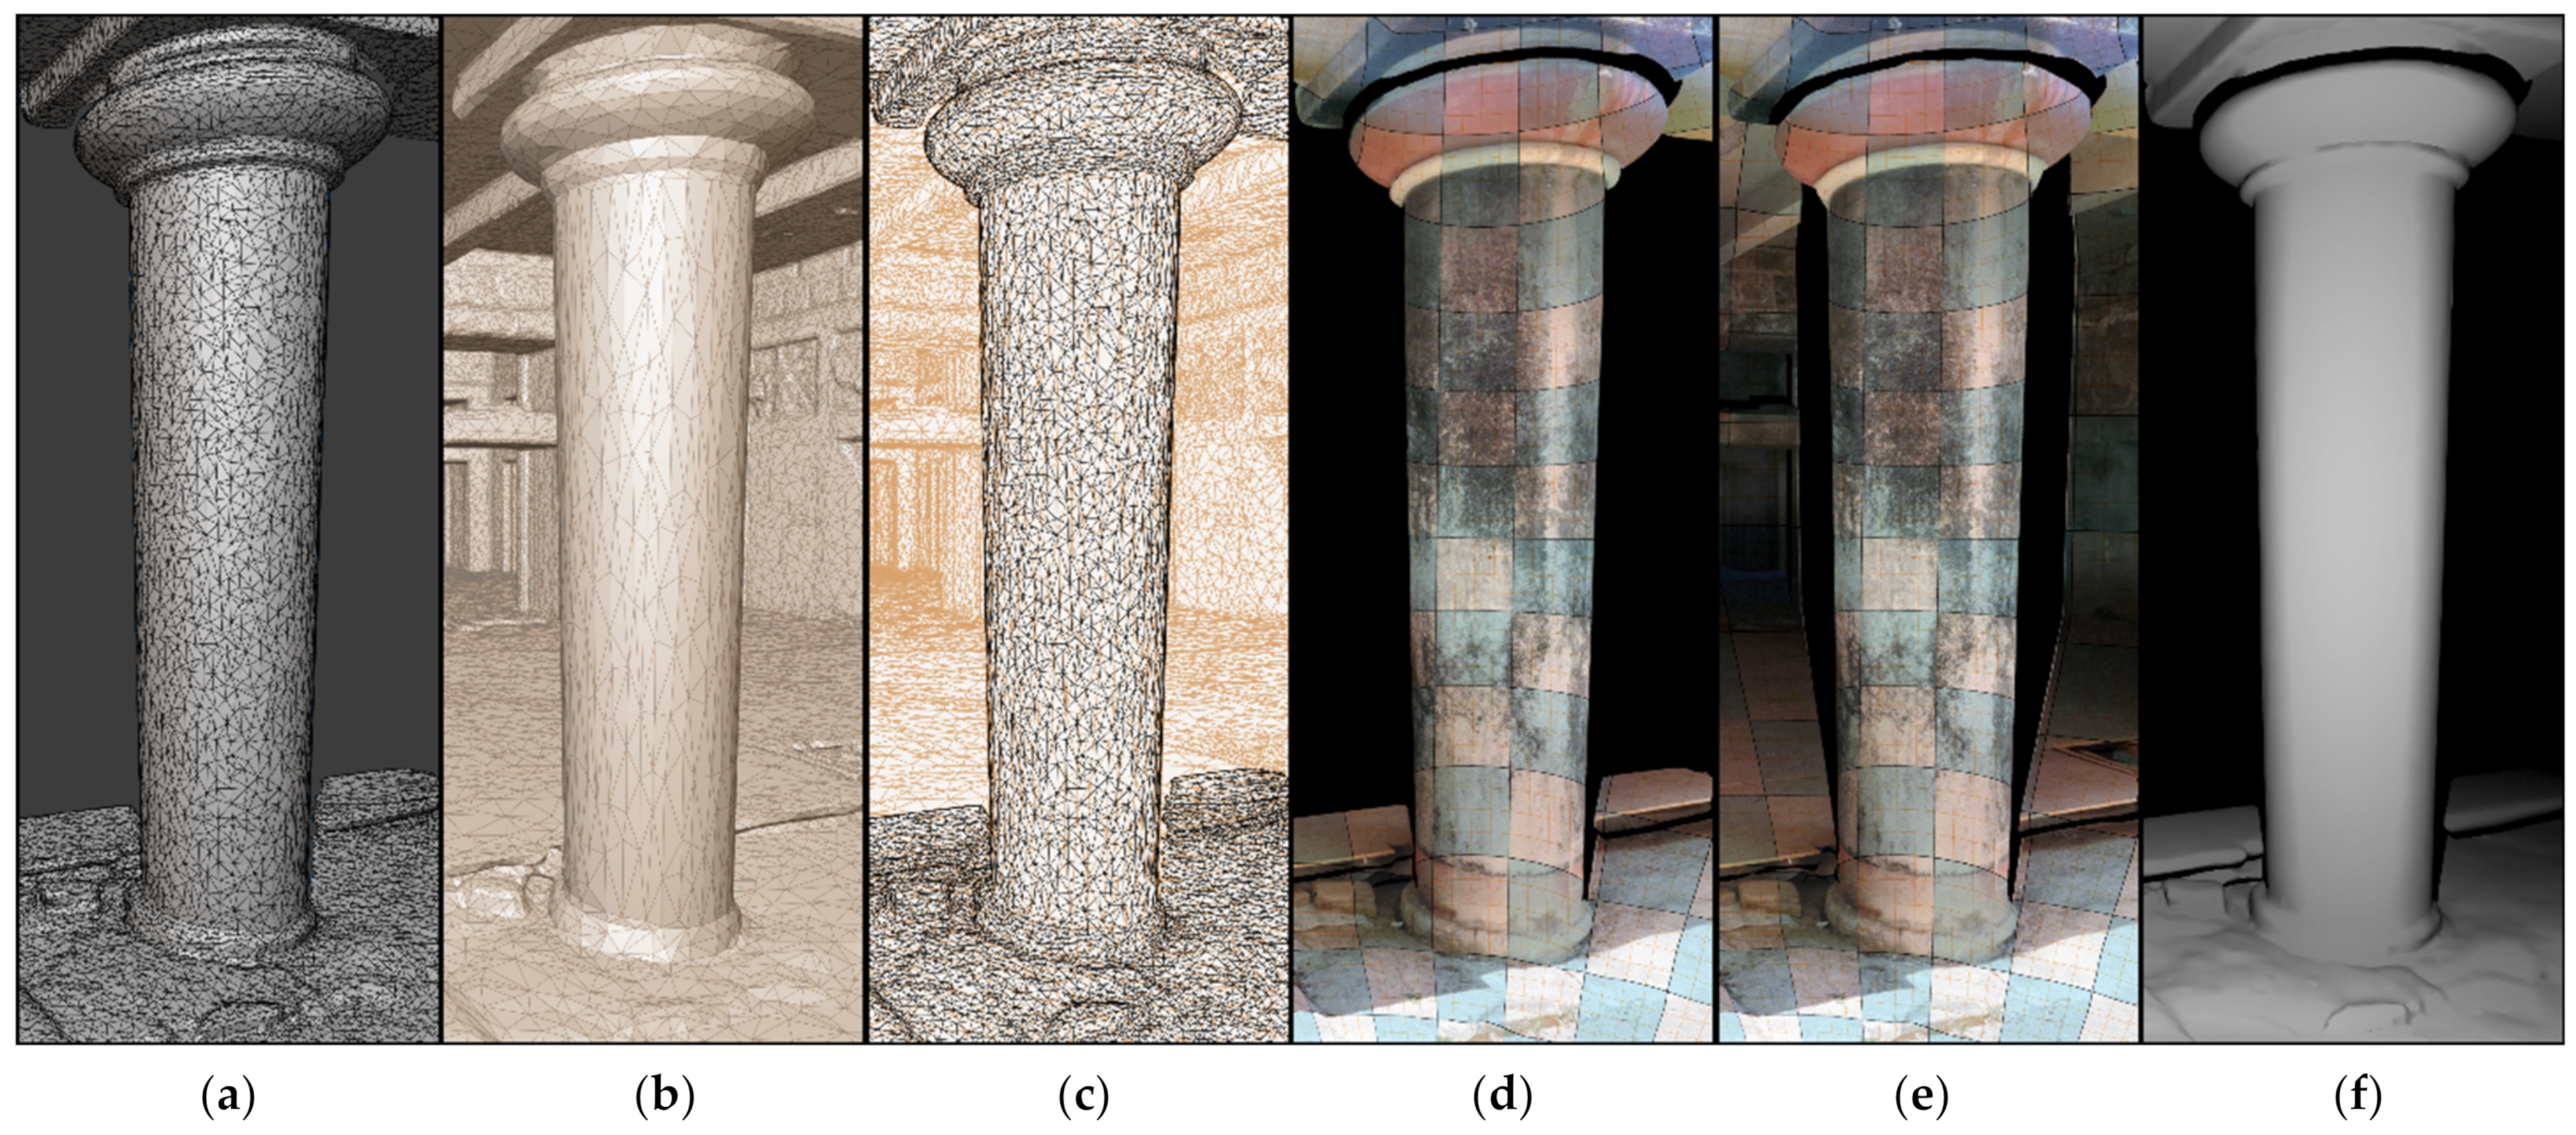
5. Post-Processing
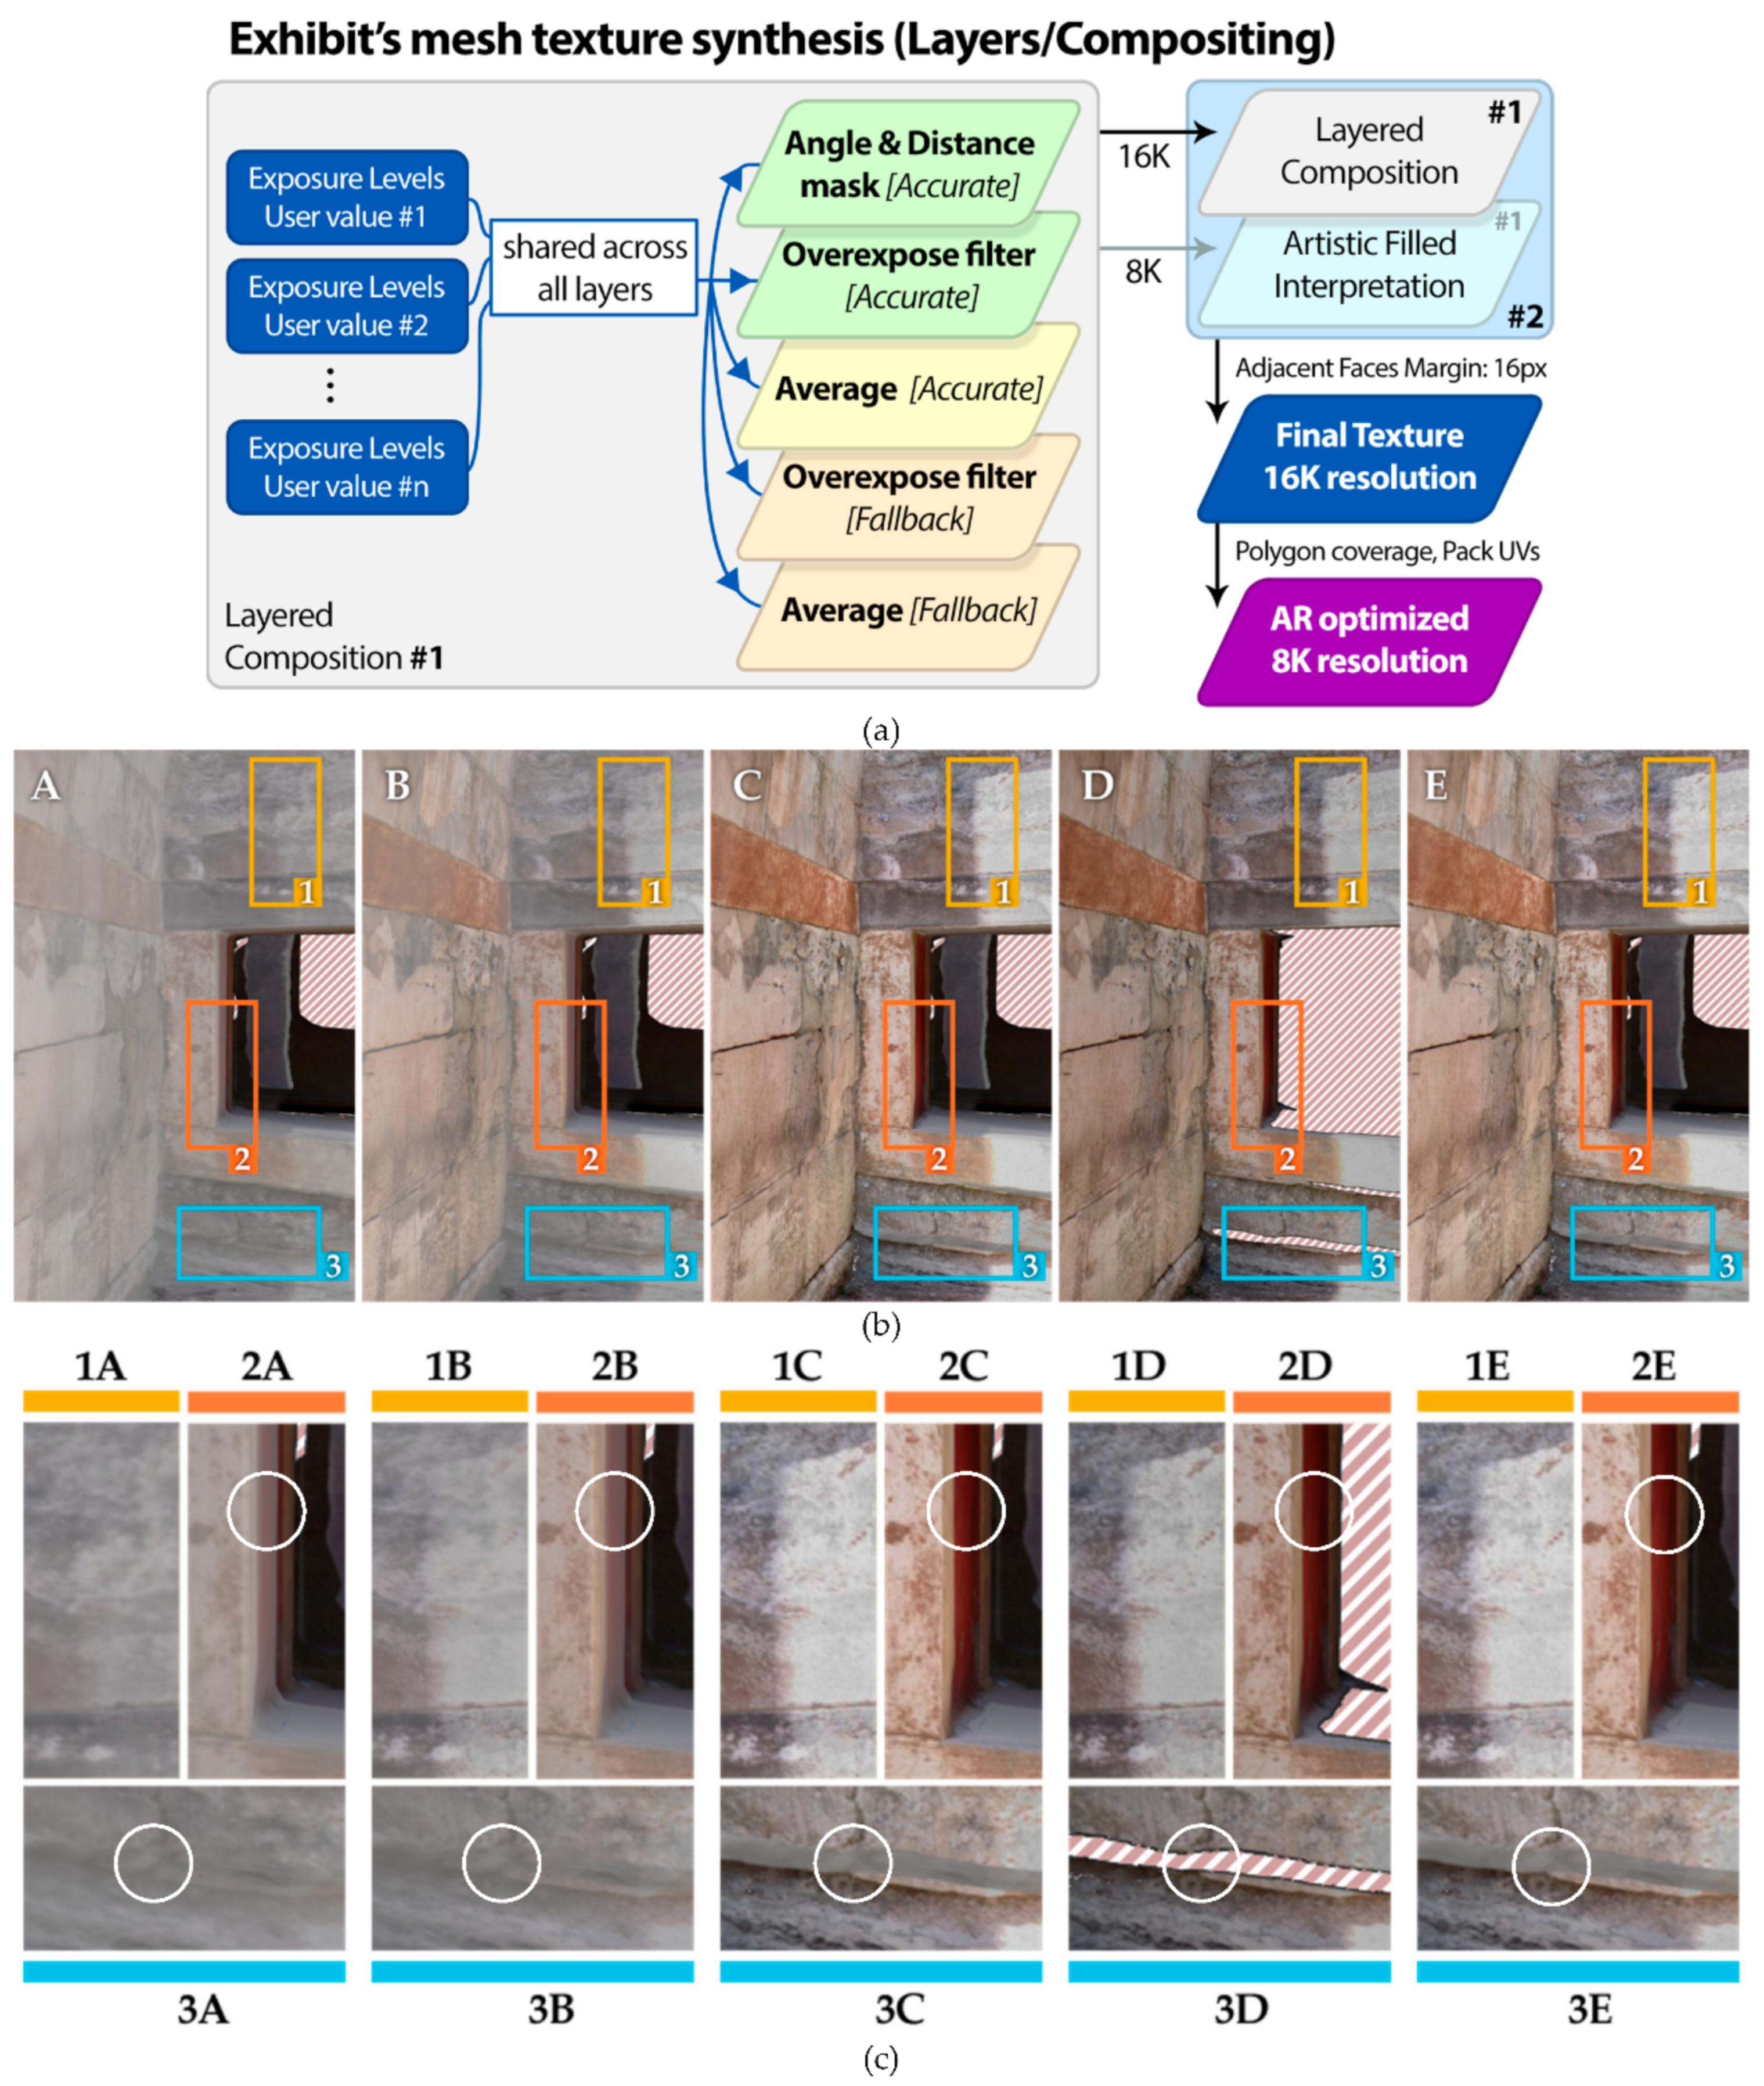
5.1. Image Stacking Methodology

- Smart UV {angle: 30, island 1/16.000}.
- Extract from high-poly to low-poly (Faro scan to target mesh) resolution: generate albedo, normal map, and distance and angle mask from the equivalent 3D scans.
- Accurate texture extraction: project Faro panoramic image onto its scan’s mesh and extract to the target mesh.
- Bake type: diffuse; influence: color; selected to active: ray distance 0.015 m; output: margin 3 px.
- Fallback texture extraction: project Faro panoramic image directly onto target mesh.
- Bake type: diffuse; influence: direct; output: margin 3 px.
- Color management: view transform | set as standard (from default, i.e., filmic, to avoid color-space changes and post-processing inconsistencies).
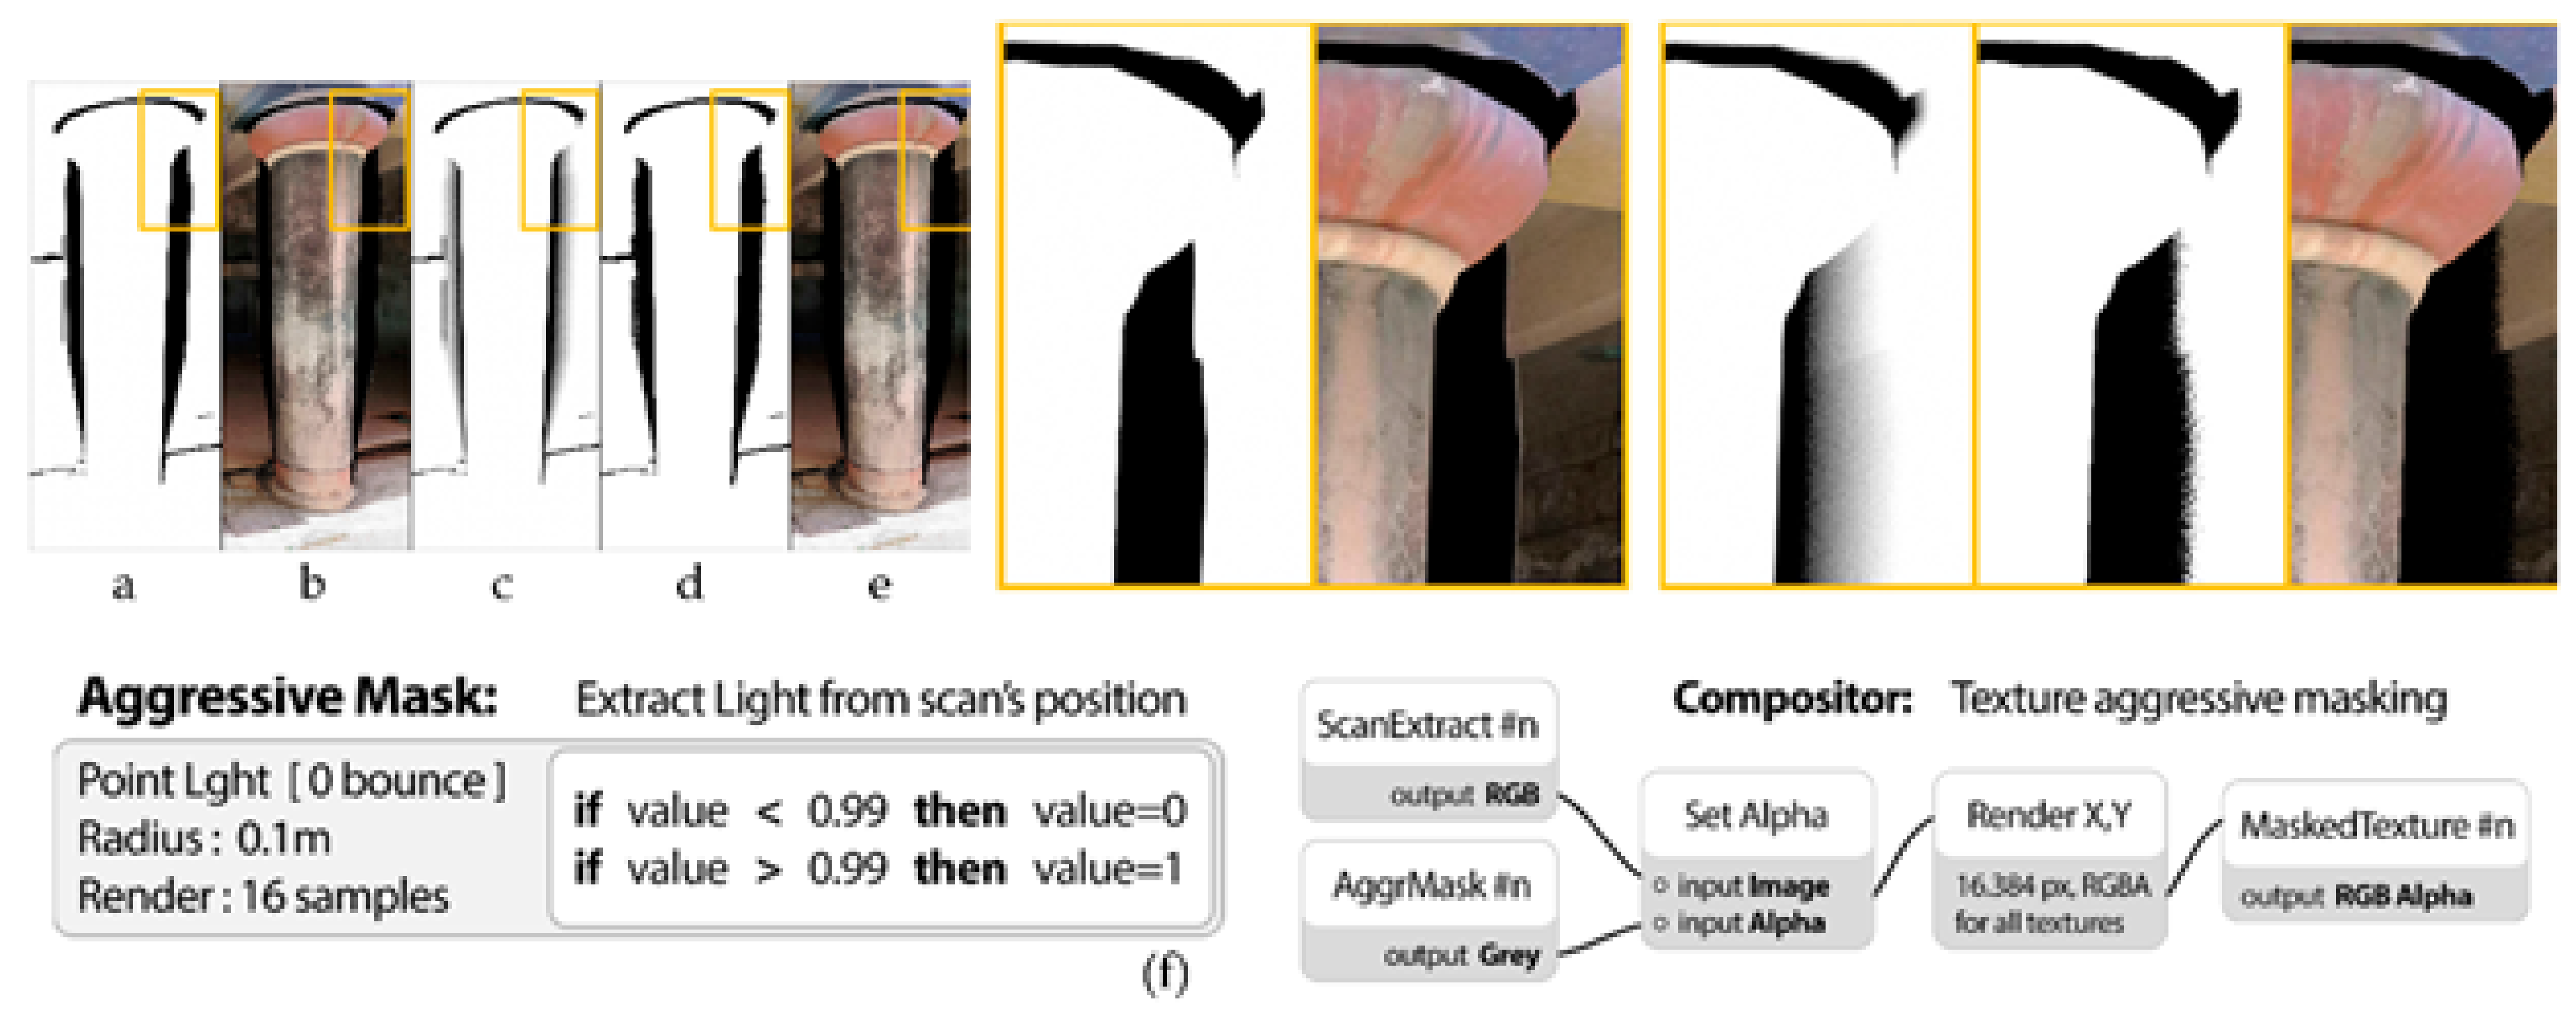
- Light paths: max bounces | set all to (0) zero bounces to avoid light bleeding to neighboring geometry.
- Sampling: render | one sample (more samples offer negligible gains at 16k textures. One sample is easier to fix in terms of texture issues in post-processing).


5.2. Texture Optimization for Cross-Platform Applications


6. Conclusions, Synopsis, and Lessons Learned
Author Contributions
Funding
Data Availability Statement
Acknowledgments
Conflicts of Interest
References
- Knossos Palace. Available online: https://knossospalace.gr/ (accessed on 10 December 2022).
- MacDonald, C. Knossos. In The Oxford Handbook of the Bronze Age Aegean; Cline, E.H., Ed.; Oxford Academic: Oxford, UK, 2012. [Google Scholar] [CrossRef]
- Evans, A.J. The palace of Knossos. Annu. Br. Sch. Athens 1901, 7, 1–120. [Google Scholar] [CrossRef]
- Evans, J.D.; Cann, J.R.; Renfrew, A.C.; Cornwall, I.W.; Western, A.C. Excavations in the neolithic settlement of Knossos, 1957–1960. Part I. Annu. Br. Sch. Athens 1964, 59, 132–240. [Google Scholar] [CrossRef]
- Minoancrete. Available online: http://www.minoancrete.com/knossos1.htm (accessed on 10 December 2022).
- Wohlfeil, J.; Strackenbrock, B.; Kossyk, I. Automated high resolution 3D reconstruction of cultural heritage using multi-scale sensor systems and semi-global matching. Int. Arch. Photogramm. Remote Sens. Spat. Inf. Sci. 2013, XL-4/W4, 37–43. [Google Scholar] [CrossRef]
- Wahbeh, W.; Nebiker, S.; Fangi, G. Combining Public Domain and Professional Panoramic Imagery for the Accurate and Dense 3D Reconstruction of the Destroyed BEL Temple in Palmyra. ISPRS Ann. Photogramm. Remote Sens. Spat. Inf. Sci. 2016, III-5, 81–88. [Google Scholar] [CrossRef]
- Pervolarakis, Z.; Agapakis, A.; Zidianakis, E.; Katzourakis, A.; Evdemon, T.; Partarakis, N.; Zabulis, X.; Stephanidis, C. A Case Study on Supporting the Preservation, Valorization and Sustainability of Natural Heritage. Heritage 2022, 5, 956–971. [Google Scholar] [CrossRef]
- Hardouin, G.; Moras, J.; Morbidi, F.; Marzat, J.; Mouaddib, E.M. Next-Best-View planning for surface reconstruction of large-scale 3D environments with multiple UAVs. In Proceedings of the 2020 IEEE/RSJ International Conference on Intelligent Robots and Systems (IROS), Las Vegas, NV, USA, 24 October 2020–24 January 2021; pp. 1567–1574. [Google Scholar] [CrossRef]
- Xu, Z.; Wu, T.H.; Shen, Y.; Wu, L. Three Dimentional Reconstruction of Large Cultural Heritage Objects Based on UAV Video and TLS Data. Int. Arch. Photogramm. Remote Sens. Spat. Inf. Sci. 2016, XLI-B5, 985–988. [Google Scholar] [CrossRef]
- Stampouloglou, M.; Toska, O.; Tapinaki, S.; Kontogianni, G.; Skamantzari, M.; Georgopoulos, A. 3D Documentation and Virtual Archaeological Restoration of Macedonian Tombs. Int. Arch. Photogramm. Remote Sens. Spat. Inf. Sci. 2019, XLII-2/W11, 1073–1080. [Google Scholar] [CrossRef]
- El-Hakim, S.F.; Beraldin, J.-A.; Gonzo, L.; Whiting, E.; Jemtrud, M.; Valzano, V. A Hierarchical 3D Reconstruction Approach for Documenting Complex Heritage Sites. In Proceedings of the 20th Symposium of International Cooperation to Save the World’s Cultural Heritage, Torino, Italy, 26 September–1 October 2005. [Google Scholar]
- El-Hakim, S.; Beraldin, J.-A.; Picard, M.; Godin, G. Detailed 3D reconstruction of large-scale heritage sites with integrated techniques. IEEE Comput. Graph. Appl. 2004, 24, 21–29. [Google Scholar] [CrossRef]
- Delegou, E.T.; Mourgi, G.; Tsilimantou, E.; Ioannidis, C.; Moropoulou, A. A Multidisciplinary Approach for Historic Buildings Diagnosis: The Case Study of the Kaisariani Monastery. Heritage 2019, 2, 1211–1232. [Google Scholar] [CrossRef]
- Cefalu, A.; Abdel-Wahab, M.; Peter, M.; Wenzel, K.; Fritsch, D. Image based 3D Reconstruction in Cultural Heritage Preservation. In Proceedings of the 10th International Conference on Informatics in Control, Automation and Robotics, Reykjavík, Iceland, 1–3 September 2014; pp. 201–205. [Google Scholar] [CrossRef]
- Santagati, C.; Inzerillo, L.; Di Paola, F. Image-based modeling techniques for architectural heritage 3D digitalization: Limits and potentialities. Int. Arch. Photogramm. Remote Sens. Spat. Inf. Sci. 2013, XL-5, 550–560. [Google Scholar] [CrossRef]
- Vertices Limit—Unity Forums. Available online: https://forum.unity.com/threads/65535-vertices-limit.294585/ (accessed on 9 December 2022).
- Caro, J.L.; Hansen, S. From photogrammetry to the dissemination of archaeolo-gical heritage using game engines: Menga case study. Virtual Archaeol. Rev. 2015, 6, 58–68. [Google Scholar] [CrossRef]
- Kontogianni, G.; Georgopoulos, A. Exploiting Textured 3D Models for Developing Serious Games. Int. Arch. Photogramm. Remote Sens. Spat. Inf. Sci. 2015, XL-5/W7, 249–255. [Google Scholar] [CrossRef]
- LeJacq, Y. The Real World Reflected in the Vanishing of Ethan Carter. Available online: https://www.kotaku.com.au/2014/10/the-real-world-reflected-in-the-vanishing-of-ethan-carter/ (accessed on 15 November 2022).
- How We Used Photogrammetry to Capture Every Last Detail for Star Wars Battlefront. Available online: https://swtorstrategies.com/2015/05/dice-used-photogrammetry-capture-every-last-detail-star-wars-battlefront.html (accessed on 23 October 2022).
- Substance Designer 5.6—Scan Blending and Weathering. Available online: https://m.blog.naver.com/sspsos74/220889041556 (accessed on 3 June 2022).
- Meet the New Megascans. Available online: https://quixel.com/blog/2017/11/21/meet-the-new-megascans (accessed on 9 August 2022).
- Su, C.J. An internet based virtual exhibition system: Conceptual deisgn and infrastructure. Comput. Ind. Eng. 1998, 35, 615–618. [Google Scholar] [CrossRef]
- Lim, J.C.; Foo, S. Creating Virtual Exhibitions from an XML-Based Digital Archive. J. Inf. Sci. 2003, 29, 143–157. [Google Scholar] [CrossRef]
- Dumitrescu, G.; Lepadatu, C.; Ciurea, C. Creating Virtual Exhibitions for Educational and Cultural Development. Inform. Econ. 2014, 18, 102–110. [Google Scholar] [CrossRef]
- Foo, S. Online Virtual Exhibitions: Concepts and Design Considerations. DESIDOC J. Libr. Inf. Technol. 2008, 28, 22–34. [Google Scholar] [CrossRef]
- Rong, W. Some Thoughts on Using VR Technology to Communicate Culture. Open J. Soc. Sci. 2018, 06, 88–94. [Google Scholar] [CrossRef]
- Partarakis, N.; Antona, M.; Stephanidis, C. Adaptable, personalizable and multi user museum exhibits. In Curating the Digital; Springer: Cham, Switzerland, 2016; pp. 167–179. [Google Scholar]
- Papagiannakis, G.; Schertenleib, S.; O’Kennedy, B.; Arevalo-Poizat, M.; Magnenat-Thalmann, N.; Stoddart, A.; Thalmann, D. Mixing virtual and real scenes in the site of ancient Pompeii. Comput. Animat. Virtual Worlds 2005, 16, 11–24. [Google Scholar] [CrossRef]
- Magnenat-Thalmann, N.; Papagiannakis, G. Virtual worlds and augmented reality in cultural heritage applications. Rec. Model. Vis. Cult. Herit. 2005, 16, 419–430. [Google Scholar]
- Papagiannakis, G.; Magnenat-Thalmann, N. Mobile augmented heritage: Enabling human life in ancient Pompeii. Int. J. Archit. Comput. 2007, 5, 395–415. [Google Scholar] [CrossRef]
- Zidianakis, E.; Partarakis, N.; Ntoa, S.; Dimopoulos, A.; Kopidaki, S.; Ntagianta, A.; Ntafotis, E.; Xhako, A.; Pervolarakis, Z.; Kontaki, E.; et al. The Invisible Museum: A User-Centric Platform for Creating Virtual 3D Exhibitions with VR Support. Electronics 2021, 10, 363. [Google Scholar] [CrossRef]
- Partarakis, N.N.; Doulgeraki, P.P.; Karuzaki, E.E.; Adami, I.I.; Ntoa, S.S.; Metilli, D.D.; Bartalesi, V.V.; Meghini, C.C.; Marketakis, Y.Y.; Kaplanidi, D.D.M.; et al. Representation of Socio-historical Context to Support the Authoring and Presentation of Multimodal Narratives: The Mingei Online Platform. J. Comput. Cult. Herit. 2021, 15, 1–26. [Google Scholar] [CrossRef]
- Stefanidi, E.; Partarakis, N.; Zabulis, X.; Zikas, P.; Papagiannakis, G.; Magnenat Thalmann, N. TooltY: An approach for the combination of motion capture and 3D reconstruction to present tool usage in 3D environments. In Intelligent Scene Modeling and Human-Computer Interaction; Springer: Cham, Switzerland, 2021; pp. 165–180. [Google Scholar]
- Stefanidi, E.; Partarakis, N.; Zabulis, X.; Papagiannakis, G. An approach for the visualization of crafts and machine usage in virtual environments. In Proceedings of the 13th International Conference on Advances in Computer-Human Interactions, Valencia, Spain, 21–25 November 2020; pp. 21–25. [Google Scholar]
- Dieck, M.C.T.; Jung, T.H. Value of augmented reality at cultural heritage sites: A stakeholder approach. J. Destin. Mark. Manag. 2017, 6, 110–117. [Google Scholar] [CrossRef]
- Mathioudakis, G.; Klironomos, I.; Partarakis, N.; Papadaki, E.; Anifantis, N.; Antona, M.; Stephanidis, C. Supporting Online and On-Site Digital Diverse Travels. Heritage 2021, 4, 4558–4577. [Google Scholar] [CrossRef]
- The Historical Figures AR. Available online: https://play.google.com/store/apps/details?id=ca.altkey.thehistoricalfiguresar (accessed on 31 October 2022).
- Pervolarakis, Z.; Agapakis, A.; Xhako, A.; Zidianakis, E.; Katzourakis, A.; Evdaimon, T.; Sifakis, M.; Partarakis, N.; Zabulis, X.; Stephanidis, C. A Method and Platform for the Preservation of Temporary Exhibitions. Heritage 2022, 5, 2833–2850. [Google Scholar] [CrossRef]
- Zabulis, X.; Partarakis, N.; Meghini, C.; Dubois, A.; Manitsaris, S.; Hauser, H.; Magnenat Thalmann, N.; Ringas, C.; Panesse, L.; Cadi, N.; et al. A Representation Protocol for Traditional Crafts. Heritage 2022, 5, 716–741. [Google Scholar] [CrossRef]
- Zenodo. Available online: https://zenodo.org/ (accessed on 31 October 2022).
- Pix4dcapture. Available online: https://www.pix4d.com/product/pix4dcapture (accessed on 10 October 2022).
- Pix4dmapper. Available online: https://www.pix4d.com/product/pix4dmapper-photogrammetry-software (accessed on 10 October 2022).
- Pix4dmatic. Available online: https://www.pix4d.com/product/pix4dmatic-large-scale-photogrammetry-software (accessed on 10 October 2022).
- FARO Focus Laser Scanners. Available online: https://www.faro.com/en/Products/Hardware/Focus-Laser-Scanners (accessed on 20 March 2022).
- FARO® SCENE Software. Available online: https://www.faro.com/en/Products/Software/SCENE-Software (accessed on 10 February 2022).
- Evdaimon, T.; Zabulis, X.; Partarakis, N. Photographic documentation of the main complex of the Knossos Palace. Zenodo 2022. [Google Scholar] [CrossRef]
- Nikon D850. Available online: https://www.nikonusa.com/en/nikon-products/product/dslr-cameras/d850.html (accessed on 10 November 2022).
- Evdaimon, T.; Zabulis, X.; Partarakis, N. A collection of photographs documenting the peripheral site to the Palace of Knossos. Zenodo 2022. [Google Scholar] [CrossRef]
- Evdaimon, T.; Zabulis, X.; Partarakis, N. A collection of UAV photographs from a high altitude of the Palace of Knossos. Zenodo 2022. [Google Scholar] [CrossRef]
- DJI Phantom 4 v2.0. Available online: https://www.dji.com/gr/phantom-4 (accessed on 10 December 2022).
- Evdaimon, T.; Zabulis, X.; Partarakis, N. A collection of UAV photographs from a low altitude of the Palace of Knossos flights 1–10. Zenodo 2022. [Google Scholar] [CrossRef]
- Evdaimon, T.; Zabulis, X.; Partarakis, N. A collection of UAV photographs from a low altitude of the Palace of Knossos flights 10–20. Zenodo 2022. [Google Scholar] [CrossRef]
- Evdaimon, T.; Zabulis, x.; Partarakis, N. A collection of Laser scans of the main complex of the Palace of Knossos. Zenodo 2022. [Google Scholar] [CrossRef]
- Evdaimon, T.; Zabulis, X.; Partarakis, N. A collection of laser scans of peripheral sites of the Palace of Knossos archaeological site. Zenodo 2022. [Google Scholar] [CrossRef]
- Evdaimon, T.; Katzourakis, A.; Pervolarakis, Z.; Partarakis, N.; Zidianakis, E.; Zabulis, X. A collection of indoor and outdoor digitisations of the Knossos Palace. Zenodo 2022. [Google Scholar] [CrossRef]
- Blender v2.93. Available online: https://www.blender.org/ (accessed on 13 July 2022).
- Katzourakis, A.; Pervolarakis, Ζ.; Evdaimon, T.; Zidianakis, E.; Partarakis, N.; Zabulis, X. A collection of rendered videos that present the digitisation outcomes and the AR application of the Knossos Palace. Zenodo 2022. [Google Scholar] [CrossRef]


| Sites | Number of Photos | Description |
|---|---|---|
| Knossos Palace | 11,056 | A total of 1506 photos from a high altitude, and 20 low-altitude flights, each one in a segment of the heritage site and with an average of 480 photos per flight. |
| Caravan Serai | 266 | One flight, 266 photos, low altitude. |
| Temple Tomb | 275 | One flight, 275 photos, low altitude. |
| Royal Villa at Knossos | 1406 | Two flights, low altitude, 999 photos during the first flight and 407 photos during the second flight. |
| Little Palace at Knossos | 610 | Two flights, low altitude, 289 photos during the first flight and 321 photos during the second flight. |
| Total | 13,613 | The total number of aerial photos acquired to reconstruct the entire heritage site. |
| Sites | Number of Scans | Description |
|---|---|---|
| Throne Room | 52 | The number of scans depended on various parameters that related more to the complexity rather than the size of each site. For example, internal architectural structures, e.g., pillars, increased the complexity, contributing to visual occlusions. Furthermore, the existence of multiple rooms increased the number of scans required due to the need to capture the transition areas. Finally, subsequent scans needed to be overlapping for registration purposes. |
| North Entrance, North Pillar Hall | 13 | |
| West Wing | 30 | |
| West Magazine | 9 | |
| The Hall of the Double Axes and the Queen’s Megaron | 49 | |
| Shrine of the Double Axes | 30 | |
| Magazine of the Medallion Pithoi, Corridor of the Bays | 15 | |
| South House | 30 | |
| South Propylaeum | 12 | |
| North Lustral Basin | 11 | |
| Caravan Serai | 12 | |
| Temple Tomb | 22 | |
| Royal Villa at Knossos | 24 | |
| Little Palace at Knossos | 37 | |
| Total | 346 |
| Title | Contents |
|---|---|
| Photographic documentation of the main complex of the Knossos Palace [48] | Photos of the main complex of the palace taken using a Nikon D850 [49] |
| Photographic documentation of the peripheral sites of the Knossos Palace [50] | Photos of the peripheral sites taken using a Nikon D850 [49] |
| Aerial photographic documentation for photogrammetric reconstruction (high altitude) [51] | Aerial photographic documentation using a DJI Phantom 4 [52] equipped with a 4K camera |
| Aerial photographic documentation for photogrammetric reconstruction (low altitude) flights 1–10 [53] | |
| Aerial photographic documentation for photogrammetric reconstruction (low altitude) flights 10–20 [54] | |
| Laser scans of the main palace complex [55] | Laser scans were acquired using a Faro Focus laser scanner [46] |
| Laser scans of the peripheral sites of the Knossos Palace [56] | |
| A collection of indoor and outdoor digitizations of the Knossos Palace [57] | Three-dimensional reconstruction results (indoor and outdoor) |
Disclaimer/Publisher’s Note: The statements, opinions and data contained in all publications are solely those of the individual author(s) and contributor(s) and not of MDPI and/or the editor(s). MDPI and/or the editor(s) disclaim responsibility for any injury to people or property resulting from any ideas, methods, instructions or products referred to in the content. |
© 2023 by the authors. Licensee MDPI, Basel, Switzerland. This article is an open access article distributed under the terms and conditions of the Creative Commons Attribution (CC BY) license (https://creativecommons.org/licenses/by/4.0/).
Share and Cite
Pervolarakis, Z.; Zidianakis, E.; Katzourakis, A.; Evdaimon, T.; Partarakis, N.; Zabulis, X.; Stephanidis, C. Three-Dimensional Digitization of Archaeological Sites—The Use Case of the Palace of Knossos. Heritage 2023, 6, 904-927. https://doi.org/10.3390/heritage6020050
Pervolarakis Z, Zidianakis E, Katzourakis A, Evdaimon T, Partarakis N, Zabulis X, Stephanidis C. Three-Dimensional Digitization of Archaeological Sites—The Use Case of the Palace of Knossos. Heritage. 2023; 6(2):904-927. https://doi.org/10.3390/heritage6020050
Chicago/Turabian StylePervolarakis, Zacharias, Emmanouil Zidianakis, Antonis Katzourakis, Theodoros Evdaimon, Nikolaos Partarakis, Xenophon Zabulis, and Constantine Stephanidis. 2023. "Three-Dimensional Digitization of Archaeological Sites—The Use Case of the Palace of Knossos" Heritage 6, no. 2: 904-927. https://doi.org/10.3390/heritage6020050
APA StylePervolarakis, Z., Zidianakis, E., Katzourakis, A., Evdaimon, T., Partarakis, N., Zabulis, X., & Stephanidis, C. (2023). Three-Dimensional Digitization of Archaeological Sites—The Use Case of the Palace of Knossos. Heritage, 6(2), 904-927. https://doi.org/10.3390/heritage6020050