Article

Can Market-Oriented Reform of Agricultural Subsidies Promote the Growth of Agricultural Green Total Factor Productivity? Empirical Evidence from Maize in China

1
College of Economics and Management, Huazhong Agricultural University, Wuhan 430070, China
2
Department of Economics and Management, Tarim University, Alar 843300, China
3
Division of Agribusiness and Agricultural Economics, Department of Agricultural and Consumer Sciences, Tarleton State University, P.O. Box T-0040, Stephenville, TX 76402, USA
4
New College, University of North Texas, 1155 Union Circle, Denton, TX 76203, USA
*
Authors to whom correspondence should be addressed.
Agriculture 2023, 13(2), 251; https://doi.org/10.3390/agriculture13020251
Submission received: 24 November 2022 / Revised: 10 January 2023 / Accepted: 17 January 2023 / Published: 20 January 2023
(This article belongs to the Special Issue Natural Resource and Environmental Economics in Agriculture)

Abstract

:
Green agriculture is the future of agricultural development. However, there has been little attention paid to the relationship between market-oriented reform of agricultural subsidies and green agricultural development. Based on the quasi-natural experiment of China’s maize purchasing and storage policy reform (MPSR), this paper studied the impact of agricultural subsidy market-oriented reform on agricultural green development from the perspective of green total factor productivity using the difference-in-difference model. The results showed that the green total factor productivity (MGTFP) of maize in China from 2010 to 2020 presented an upward trend with an average annual growth rate of 0.70%, which mainly depended on the contribution of green technical progress in maize. MPSR could promote the improvement of MGTFP, but the result had a hysteresis effect. In addition, MPSR had a significant promoting effect on green technical change but had no significant impact on green technical efficiency. The policy implication of this paper is that developing countries should actively promote the market-oriented reform of agricultural subsidies to promote green agricultural development.

1. Introduction

China uses 9% of the world’s arable land to feed 20% of the world’s population. Agriculture plays a vital role in China’s national economy [1]. Since the 1980s, China’s agricultural economy has achieved rapid growth, but most of this growth depends on inputs such as pesticides, fertilizers, agricultural films, etc. [2]. China’s agriculture has also resulted in serious environmental pollution and significant greenhouse gas emissions [3]. As the world’s largest emitter of carbon emissions [4], China has announced carbon peaks by 2030 and carbon neutralization by 2060. Agricultural carbon emissions account for 16–17% of China’s total emissions, higher than the average of 13.5% in the world [5,6]. In order to reduce agricultural carbon emissions, China’s agriculture needs to change the mode of production from a factor-intensive input mode to a green innovation mode. Increasing green total factor productivity (GTFP) in agriculture has the potential to solve these problems. GTFP is a productivity indicator that takes into account non-desired outputs, such as surface source pollution or carbon emissions. GTFP is potentially a better way to measure green agricultural development [7,8].
Since 2003, China has gradually implemented purchasing and storage policies for maize, wheat, rice, and other major food crops. These policies have significantly increased the use of pesticides and fertilizers by farmers, resulting in soil degradation [9,10] and an increase in greenhouse gas emissions [11,12]. In order to promote the green development of agriculture, the Chinese government began the pilot reform of market-oriented agricultural subsidies in 2016 and conducted the maize purchasing and storage policy reform (MPSR) in Heilongjiang, Liaoning, Jilin, and Inner Mongolia, which are the major maize-producing provinces in northern China. One of the key policy objectives of the MPSR is to reduce agricultural pollution. MPSR is a pilot policy, which forms a quasi-natural experiment for this study. Therefore, this study discusses the following three questions: First, will the market-oriented reform of agricultural subsidies, with MPSR as its representative, reduce the use of pesticides, fertilizers, and other elements, thus promoting the growth of MGTFP? Second, is there a lag effect in the MPSR? Third, what is the impact mechanism between MPSR and MGTFP growth? In order to answer the above questions, this paper, based on the quasi-natural experiment of China’s MPSR, used the difference-in-difference (DID) model to study the impact of MPSR on MGTFP by using panel data from China’s main maize-producing provinces from 2010 to 2020.
The literature relevant to this paper focuses on the following two parts: The first part is the measurement of GTFP in agriculture. The current methods for calculating TFP are stochastic frontier analysis (SFA) and data envelopment analysis (DEA). The SFA method, which requires a specific functional form and a probability distribution from random error terms, is a parameter estimation method [13,14]. The DEA method does not require a specific production function and is suitable for efficiency calculations with multiple inputs and outputs [15,16]. Most scholars combined the DEA method with the Malmquist index to measure TFP [17,18,19]. Agricultural GTFP refers to TFP considering non-expected outputs, which primarily refer to agricultural pollution emissions, including non-point source pollution and greenhouse gas emissions [20,21]. Oskam (1991) [22] calculated green agricultural productivity based on Solow residues, which include pollution of environmental elements such as air, water, and soil. West and Marland (2002) [23] suggested that green productivity in agriculture is measured from five perspectives: fertilizer, agricultural lime, pesticides, agricultural irrigation, and seed cultivation. Wang et al. (2012) [24] calculated the GTFP of China’s agriculture using the SFA method, which converts the loss of nitrogen and phosphorus into agricultural input. Liu et al. (2021) [25] measured and analyzed agricultural carbon emissions and included them in the measurement of agricultural total factor productivity. Chen et al. (2021) [26] and Yang et al. (2022) [27] have added agricultural non-point source pollution in addition to carbon emission factors to agricultural GTFP measurements and found that agricultural GTFP has been increasing in recent years. However, because of the different research objects, perspectives, and sample selections, the results of agricultural GTFP vary greatly.
The second major part of the literature is about the influencing factors of GTFP in agriculture. With the continuous improvement of GTFP measurement methods, scholars have begun to pay attention to the influencing factors of agricultural GTFP, such as farmers’ characteristics, agricultural structure, technological change, agricultural insurance, agricultural policy, etc. Characteristics such as the education of farmers tend to influence their adoption of agricultural technologies, thereby affecting green agricultural productivity [28]. Research by Liu and Lv (2021) [29] also shows that human capital can increase GTFP in agriculture. Liu et al. (2021) suggest that optimization of crop structures would also increase GTFP in agriculture [25]. Wang and Feng (2021) [30] identified green technology innovation as the main influencing factor of GTFP growth in agriculture. In addition, it has been argued that agricultural insurance can significantly increase GTFP in agriculture [31]. Furthermore, Wang et al. (2019) [32] argued that FDI could significantly increase agricultural GTFP. Finally, policy changes could also affect GTFP in agriculture; for example, Yu et al. (2022) [33] argued that China’s carbon trading pilot policy significantly increased GTFP in agriculture. In addition, existing studies have shown that optimal inputs of agricultural factors, represented by water resources, increase the income of farm households [34,35], thus increasing productivity.
Generally speaking, the existing literature focuses on the estimation of GTFP and the external influencing factors of GTFP but neglects the influence of subsidy policy on GTFP. Like China, many developing countries, such as Indonesia and the Philippines, have adopted the minimum purchase price policy for agricultural products. The implementation of such policies may protect agricultural production effectively but significantly increase farmers’ input in pesticides and fertilizers, causing environmental pollution [36]. The market-oriented reform of agricultural subsidies is an important way to alleviate agricultural pollution emissions. However, there are few empirical studies on these issues. As a result, this paper attempts to contribute to the literature through the following four aspects: First, this paper discusses the evolutionary trend of MGTFP in China from the perspective of carbon emissions, which has significant implications for the formulation of China’s maize industrial policy. Second, in terms of research breadth, we use agricultural subsidy reform as a policy variable to seek ways to enhance MGTFP and explore the dynamic effects and mechanisms of the effects of MPSR on MGTFP. Third, the DID model we adopt can effectively mitigate the endogeneity of policy reforms and make the empirical results more robust and valid. Fourth, our research results can provide empirical implications for developing countries to promote green agricultural development.
The overall objectives of this study were to explore the impact of market-oriented reform of agricultural subsidies on green agricultural development and to provide experience for the reform of agricultural subsidies in developing countries. First of all, we calculated the carbon emissions of maize in China using the emission factor method and measured the MGTFP using the SBM (Super-Global-Malmquist–Luenberger) method. This method was able to incorporate non-desired outputs into the TFP and could solve the infeasible solution problem in the TFP calculation. Then, we studied the impact of MPSR on MGTFP using the difference-in-difference model. The difference-in-difference model was able to alleviate the endogeneity problem of policy change and thus calculate accurate policy effects. Finally, we studied the dynamic effect and influence mechanism of MPSR on MGTFP.

2. Materials and Methods

2.1. Policy Background

Since 2004, China has implemented a series of agricultural subsidy policies, including direct agricultural subsidies and price support policies. The maize purchasing and storage policy, implemented in 2008, was the focal point of agricultural subsidy policies. The implementation of the policy not only ensured the income of farmers but also greatly mobilized their enthusiasm to grow grain [37,38]. However, the policy also distorted the operation of the maize market, leading to an imbalance between supply and demand for maize [36]. According to China’s China Corn Information Network, the price difference between domestic and foreign corn was USD 148 per ton in 2013. Therefore, the domestic price of maize was much higher than the price in the international market, which led to a sharp increase in maize imports. A large amount of maize had been converted into stocks, and the national grain financial burden had increased [39]. In addition, due to the maize purchasing and storage policy, agricultural inputs, such as pesticides, fertilizers, and agricultural plastic films, increased quickly, resulting in the agricultural ecological environment facing severe challenges [36].
In response, China initiated a market-oriented reform of agricultural subsidies. In March 2016, China decided to abolish the maize purchasing and storage policy and implemented the pilot MPSR in Heilongjiang, Jilin, Liaoning, and Inner Mongolia. This meant that the state stopped setting and announcing the prices of maize for temporary storage, and instead, the market determined the price of maize. Farmers who suffered losses due to fluctuating corn prices were subsidized by the government. The MPSR pilot showed that government intervention was gradually weakened, the price mechanism was gradually formed, and the market would become a decisive factor in resource allocation [40,41]. At the same time, after the implementation of the MPSR policy, the government will no longer buy maize at a higher price than the market. Farmers’ expected returns will be reduced, which may lead to a reduction in farm inputs for maize production.

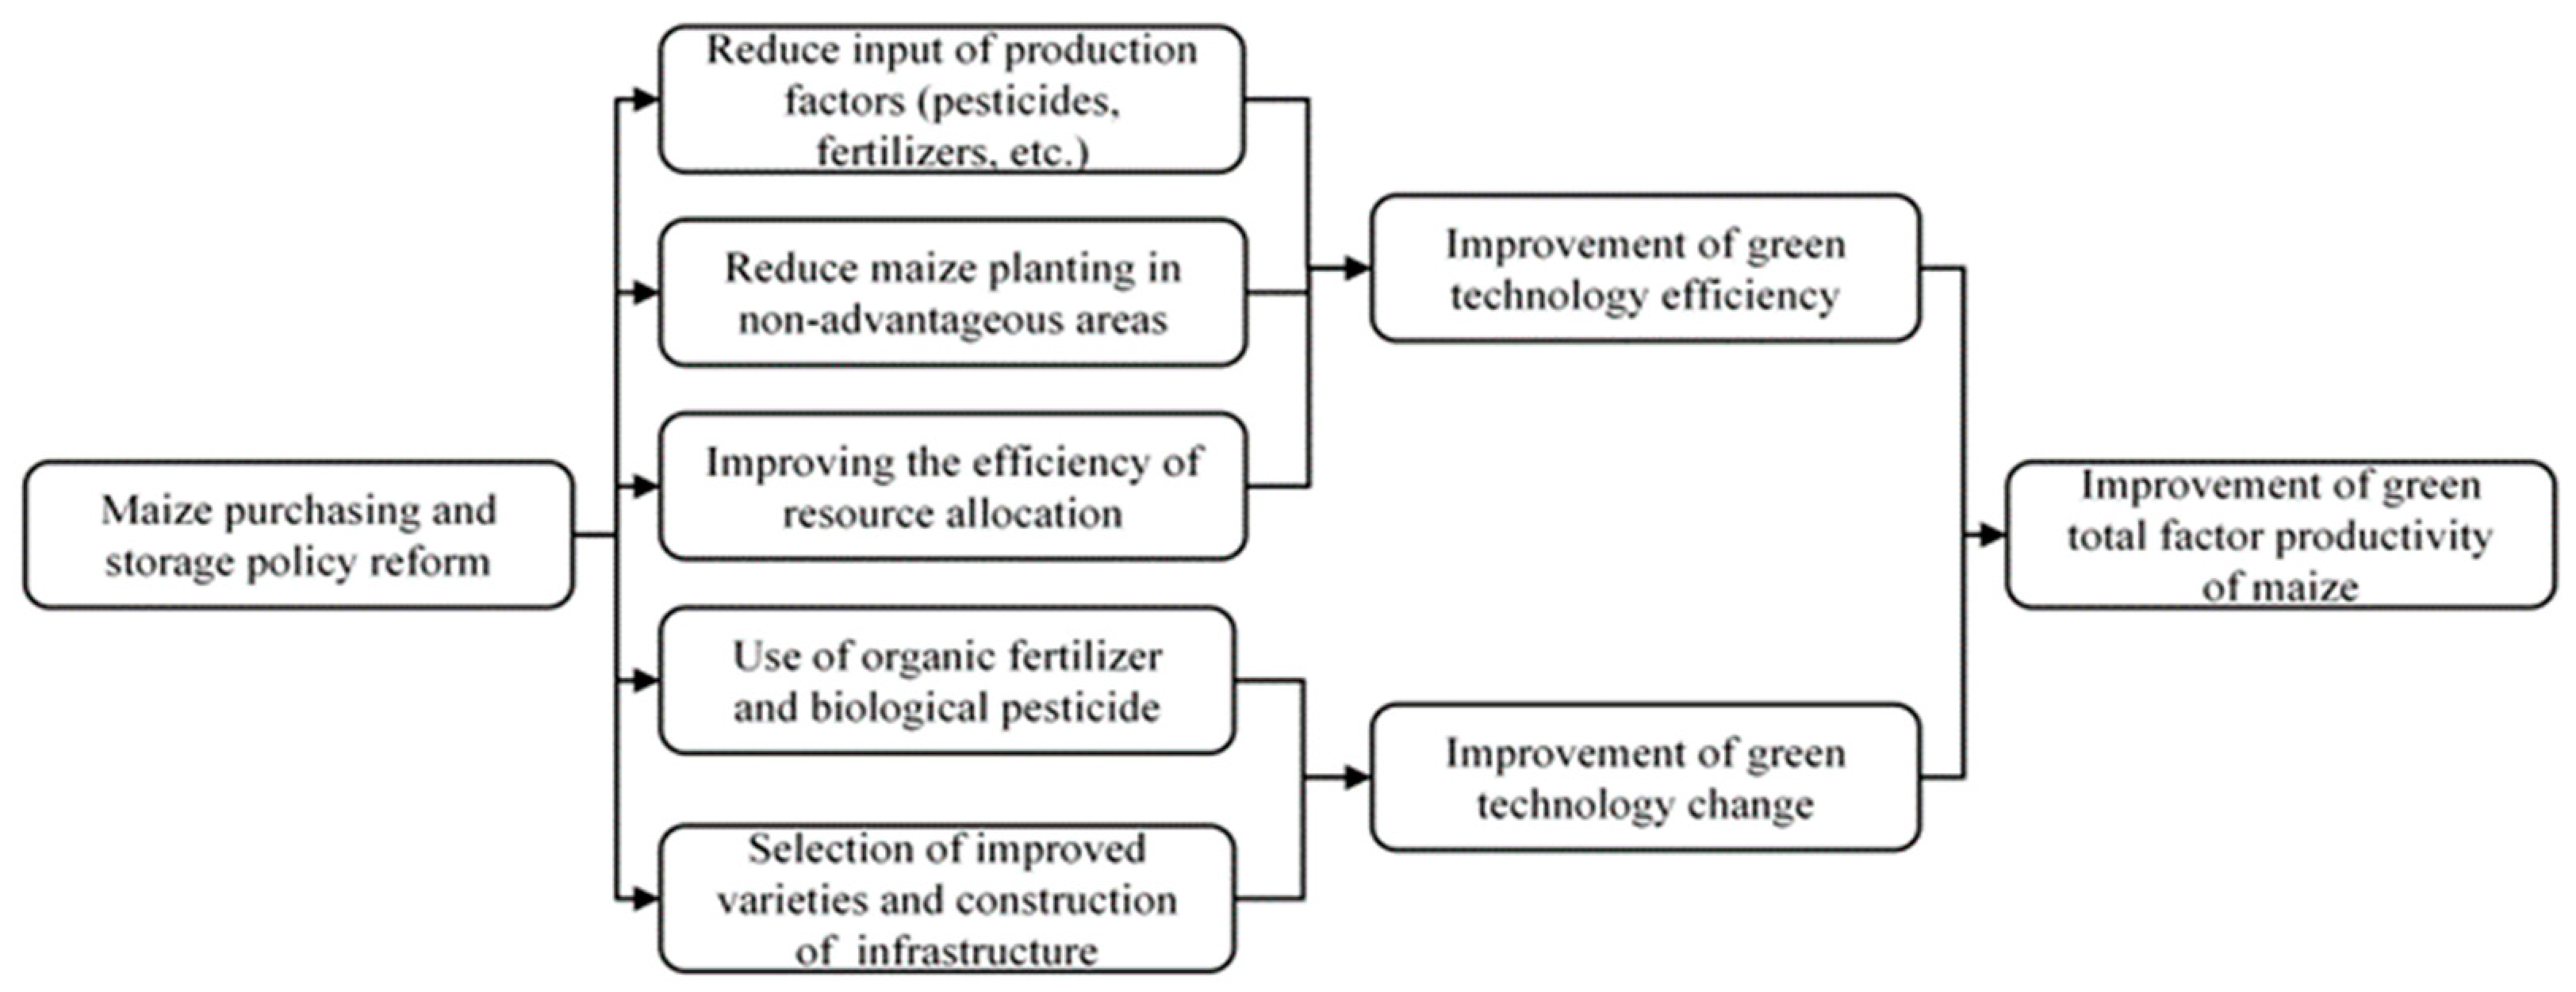
2.2. Theoretical Analysis

The MPSR had an impact on farmers’ maize planting behavior, which then affected MGTFP. In particular, the main ways in which MPSR affected MGTFP are shown in Figure 1.
The first impact mechanism is that MPSR will improve green technology efficiency, leading to the promotion of MGTFP. The improvement of technical efficiency is embodied in the following three aspects: With the state-run maize purchasing and storage policy, the goal of farmers is to maximize maize production through excessive use of fertilizers and pesticides. This production method will lead to a decline in soil quality, which will have a serious impact on MGTFP. Since the implementation of the MPSR policy, the government no longer buys maize from farmers, and farmers’ expected returns from maize cultivation will be reduced. At this time, farmers may reduce maize inputs or change their household farming structure, which will enhance MGTFP [42]. Second, during the period of the state-run maize purchasing and storage policy, the maize planting area expands rapidly, and the agricultural production structure changes in freezing areas, drought-prone areas, and agro-pastoral areas. However, the market-oriented MPSR can reduce maize planting in non-advantageous areas, which will increase MGTFP. Finally, the state-run maize purchasing and storage policy creates imbalanced planting areas between corn and soybean, where farmers reduce soybean cultivation to increase maize cultivation. Ultimately, this results in an inefficient allocation of resources. Since the MPSR, the pilot provinces have further improved MGTFP by adjusting planting structures and improving the efficiency of resource allocation [43].
The second impact mechanism is that MPSR will promote green technology change, leading to the promotion of MGTFP. The two aspects of green technological change are as follows: First, the maize price is determined by the quality that gradually developed after MPSR. Because of the market price premium for maize quality, maize production will shift from quantity to quality. Farmers will change the past production mode that relied on inputs into a new production mode that relies on green production technology. The transformation of the production mode can encourage farmers to use organic fertilizers and biopesticides to a great extent, which will significantly improve MGTFP [44]. Second, the market demand for green agricultural products will encourage farmers to improve the quality of varieties, adopt green technologies, and optimize field infrastructure, which will also significantly increase MGTFP [45].

2.3. Research Methods

2.3.1. The Measurement Model of MGTFP

The MGTFP in China was calculated using the Super-SBM model and Malmquist index. Compared with the traditional DEA model, the Super-SBM model was effective in evaluating and sequencing multiple fully effective decision units [46,47,48]. The specific settings of the model were as follows:
ρ =   min   1 m i = 1 m x i ¯ x i 0 1 s 1 + s 2 r = 1 s 1 y ¯ r g y r 0 g + j = 1 s 2 y ¯ j b y j 0 b s . t . x 0 = X λ + S ,   y 0 g = Y g λ S g ,   y 0 b = Y b λ S b x ¯ j = 1 , 0 n λ j x j ,   y ¯ g j = 1 , 0 n λ j y j g ,   y ¯ b j = 1 , 0 n λ j y j b x ¯ x 0 ,   y ¯ g   y 0 g ,   y ¯ b y 0 b j = 1 , 0 n λ j = 1   ,   S 0 ,   S g 0 , S b = 0 ,   y ¯ g 0 ,   λ 0  
In Equation (1), m, S1, and S2 represent the input variable, expected output variable, and cost expected output variable, respectively, and λ represents the weight vector. The above method could be combined with the Malmquist index to calculate MGTFP. This paper selected the global Malmquist index to construct the production frontier, widely used in the calculation of TFP, as it solves the problem of an infeasible solution in the TFP [49,50]. Since the traditional Malmquist index cannot include undesired outputs, many scholars use the Malmquist–Luenberger (ML) index to measure GTFP in agriculture [51,52,53]. To sum up, this paper constructed the SBM Super-Global-Malmquist–Luenberger (SBM-SGML) model to calculate MGTFP. The formula is as follows:
T F P t , t + 1 m t , n t ; m t + 1 , n t + 1 = 1 + D t m t , n t 1 + D t m t + 1 , n t + 1 × 1 + D t + 1 m t , n t 1 + D t + 1 m t + 1 , n t + 1 1 2 = 1 + D t m t , n t 1 + D t m t + 1 , n t + 1 × 1 + D t + 1 m t , n t 1 + D t m t , n t × 1 + D t + 1 m t + 1 , n t + 1 1 + D t m t + 1 , n t + 1 1 2 = E C m t + 1 , n t + 1 ; m t , n t × T C m t + 1 , n t + 1 ; m t , n t
In Equation (2), Dt and Dt+1 represent the set of production technologies in the t period and the t + 1 period, respectively. MGTFP can be decomposed into green technical change (GTC) and green technical efficiency (GEC) of maize, and TFP > 1 means that MGTFP has increased and vice versa. GTC > 1 and GEC > 1 mean green technical progress and improvement of the green technical efficiency of maize, respectively. The input and output in maize production needed to be measured in the calculation of the above model. The input variables in this paper were mechanical input per hectare (yuan), chemical fertilizer input per hectare (yuan), seed input per hectare (yuan), pesticide input per hectare (yuan), number of workers per hectare (days), and other input per hectare (yuan). The output variables were maize yield per hectare (kg) and carbon emissions from maize production per hectare (kg) [25]. Carbon emissions are a major contributor to global climate change and include nitrogen, phosphorus, and other nutrients that characterize pollutants in agricultural production [54,55]. Therefore, it made sense to consider carbon emissions as an undesirable output in maize production [56].
Most of the existing studies believe that carbon emissions refer to the direct or indirect carbon emissions caused by human behavior during farmland use. Existing studies [54,56] conclude that the carbon emissions from maize production are derived from the following aspects: First, direct or indirect carbon emissions from agricultural land result from the production and use of fertilizers. Second, carbon emissions are caused by the production and use of pesticides. Third, carbon emissions are derived from the production and use of agricultural films. Fourth, carbon emissions are caused by the direct or indirect consumption of fossil fuels (mainly agricultural diesel) due to the use of agricultural machinery. Fifth, carbon emissions are a result of the loss of a large amount of organic carbon to the air due to the destruction of soil organic carbon pools by plows. Last, carbon emissions are caused by the indirect use of fossil fuels in irrigation, which is done with electric energy.
The formula for calculating the carbon emissions from maize production is as follows:
E = E i = T i · δ
Among them, E represents the total carbon emissions in maize production, Ei represents the emissions of various carbon emission sources, Ti is the number of each carbon source, and δ is the carbon emission coefficient of each carbon emission source. The carbon emissions coefficient is derived from the existing literature [25,54]. Table 1 provides a summary of the carbon emission coefficient for growth based on the existing literature.

2.3.2. DID Model

In this paper, the difference-in-difference (DID) model estimated the impact of MPSR on MGTFP. The basic principle of the DID model is to construct a framework for counterfactual analysis. The counterfactual analysis framework is an analytical approach proposed by Robin (1976) [57] to analyze the treatment effects of policy implementation. The basic principle is that the hypothetical treatment group would have had a different result if the policy had not intervened, and the different result is the treatment effect. The following model was based on the existing literature [58,59]:
L N T F P i , t = α 1 + α 2 d i d i , t + β X i , t + η t + γ i + μ i , t
In Equation (4), i stands for province, and t stands for year. TFP represents the MGTFP, did represents the variable of MPSR, X represents the control variables, and η and γ represent the year effect and the province effect, respectively. μ represents a classical random perturbation term. α and β represent un-estimated coefficients. In particular, α2 was the core estimate parameter of this paper, representing the impact of MPSR on MGTFP. If α2 was positive and significant, it indicated that MPSR could improve MGTFP. If α2 was negative and significant, it indicated that MPSR restrained the improvement of MGTFP.

2.3.3. Parallel Trend Test Model

The parallel trend is the assumption condition of the DID model. In this paper, the parallel trend assumption was that the change of MGTFP in the experimental group and control group should be consistent if MPSR does not happen. An event study was always used to test the parallel trend assumption [60]. The event study method is to construct econometric models to judge whether the experimental group and the control group have significant differences before the implementation of the policy. Referring to existing research [61,62,63], this paper constructed the following models to test the parallel trend assumption:
L N T F P i , t = k = 2010 2020 β k . t r e a t e d i × t i m e k + β X i , t + η t + γ i + μ i , t
The meanings of the variables in Equation (5) are the same as in Equation (1). We took 2017 as the control group; if the coefficient before 2017 was not significant, it showed that there was no significant difference between the experimental group and the control group before the policy implementation.

2.3.4. Mechanism Model

Furthermore, in order to investigate the mechanism of MPSR’s effect on MGTFP, this paper divided MGTFP into green technology change (GTC) and green technology efficiency (GTE) by referring to the result of Fare et al. (1993) [63]. Then, we studied the effects of MPSR on GTC and GTE separately. Specifically, the models are as follows:
L N G T C i , t = α 1 + α 2 d i d i , t + β X i , t + η t + γ i + μ i , t
L N G T E i , t = α 1 + α 2 d i d i , t + β X i , t + η t + γ i + μ i , t
Among them, the estimated parameters of DID in Equations (6) and (7) represent the impact of MPSR on GTC and GTE. Other variables have the same meaning as above.

2.4. Variable Description

2.4.1. Dependent Variable

MGTFP was the dependent variable in this paper. MGTFP measures the efficiency of maize production, which can reflect the relationship between the input and output of maize production factors. Using the SBM-SGML index, this paper measured MGTFP in twenty main maize production provinces in China from 2010 to 2020. In the empirical analysis, MGTFP was transformed into the 2010 cumulative growth index, and the logarithmic treatment was adopted. Referencing the existing studies [42,64,65], the input variables we selected were machinery input per hectare (yuan), fertilizer input per hectare (yuan), seed input per hectare (yuan), pesticide input per hectare (yuan), number of workers per hectare (days), and other inputs per hectare (yuan). The output variables were maize yield per hectare (kg) and carbon emissions from maize production per hectare (kg). Then, we divided MGTFP into green technology change (GTC) and green technology efficiency (GTE).

2.4.2. Core Independent Variable

The core independent variable of this paper was did, which was formed by the time virtual variable of policy implementation and the treated interaction of the regional virtual variable of policy implementation. The coefficient of did indicates the impact of MPSR on MGTFP.

2.4.3. Control Variables

MGTFP was mainly affected by infrastructure, management, and natural climate change. Referring to Liu et al. (2021) [25] and Li et al. (2022) [66], this paper selected the following control variables: (1) urbanization (URB), which is the proportion of the non-agricultural population in the total population to express URB; (2) regional human capital (HC), which is the average length of education of the rural labor force to measure HC; (3) infrastructure construction (INF), which stands for the rural highway mileage of unit area to measure INF; (4) corn planting area (CPA), which uses the per capita corn planting area of the rural labor force to indicate CPA; (5) income of rural residents (IRR), which measures IRR by per capita rural income; (6) financial support for agriculture (FSA), which uses the agricultural and forestry water expenditures of previous years in various provinces to indicate FSA; (7) disaster rate (DR), which shows the proportion of the area affected by the disaster to the total sown area of crops; and (8) maize planting structure (MPS), which depicts the proportion of maize acreage to crop acreage to indicate MPS.

2.5. Data Sources and Descriptive Statistics

In this paper, twenty major maize-producing provinces in China were selected as the research subjects from 2010 to 2020. The data on inputs and outputs used in the calculation of MGTFP came from the National Farm Product Cost-Benefit Survey and the China Statistical Yearbook. The data on control variables came from the China Rural Statistical Yearbook, China Statistical Yearbook, and EPS databases. In this study, some abnormal data were processed, and some missing data were calculated by interpolation. Table 2 shows the results of the descriptive statistics of the study variables. In addition, we used a software named Stata 15 to estimate the coefficients.

3. Results

3.1. Evolution of MGTFP in China

This paper calculated MGTFP in China using the SBM-SGML model. Table 3 shows the changes in MGTFP in China from 2010 to 2020. Since China’s MPSR began in 2016, this paper divided the experiment group and the control group into two stages: 2010–2016 and 2017–2020. To verify whether there was a significant difference between the experimental and control groups, we also performed the Kruskal–Wallis t test.
Overall, China’s MGTFP from 2010 to 2020 showed a growth trend with an average annual growth rate of about 0.70%. Except for Hebei, Shanxi, Jiangsu, Anhui, Hubei, Guangxi, Chongqing, Shaanxi, and Gansu, MGTFP growth in more than half of the provinces maintained positive growth, and the growth of MGTFP in all regions tended to balance. The results of the Kruskal–Wallis t test showed a statistically significant difference between the means of the experimental and control groups. This paper divided MGTFP into two time periods, 2010–2016 and 2017–2020, and then analyzed the changes in MGTFP in these different periods. From 2010 to 2016, the average growth rate of MGTFP in China was −0.30%. From 2017 to 2020, the average annual growth rate of MGTFP in China was 2.50%, which indicated that the growth of MGTFP was more obvious after 2017 and also indicated that MPSR may have had a positive impact on MGTFP. By comparing the growth rate of MGTFP before and after 2017, we found that the growth of MGTFP after 2017 may have come from the adjustment of China’s agricultural policies, such as the implementation of the supply-side structural reform of agriculture and the implementation of the agricultural fertilizer and pesticide reduction policy [67].
Before empirical regression, we could intuitively describe the changes in MGTFP before and after MPSR. As shown in Figure 1, before MPSR (2010–2016), the change in MGTFP in the experimental group and the control group remained almost stable. After MPSR (2017–2020), the control group remained relatively stable, but MGTFP in the experimental group increased significantly. This indicated that the MGTFP in the experimental group was much higher than that in the control group after MPSR. The trend change in Figure 1 could also serve as an important parallel trend test in the DID model (the control group and experimental group had consistent trends with the change in MGTFP before policy implementation). The parallel trend was an important test for the DID model. Figure 2 shows that the control group and the experimental group shared common trends.

3.2. DID Regression Results

This part analyzed the average treatment effect of MPSR on MGTFP. The stepwise regression strategy was adopted in the empirical analysis. The results are in Table 4. Model 1 did not control any variables. Model 2 added some control variables. Model 3 added as many control variables as possible. The results showed that the impact of MPSR on MGTFP was significantly positive at the 1% statistical level under the control of all variables, including time effect and individual effect. The estimated coefficient was 0.119, which indicated that on average, the policy reform increased MGTFP by 11.9%.
We also explained the effect of control variables on MGTFP. DR had a significant negative effect on MGTFP growth. The result showed that maize production was affected by natural disasters, which were related to the industrial characteristics of agriculture [68]. This conclusion was consistent with the findings of Liu et al. (2020) [69]. URB had a significant positive effect on the growth of MGTFP, indicating that urbanization could improve the allocation of agricultural labor between urban and rural areas, promoting MGTFP. This conclusion was consistent with Li et al. (2021) [70] and Song and Li (2020) [71]. CPA had a significant positive effect on MGTFP growth, which indicated that MGTFP would be promoted by scale expansion. This conclusion was consistent with the findings of Ye (2022) [42]. IRR had a significant negative effect on the development of MGTFP. The growth of China’s agricultural economy was dominated by factor inputs. This conclusion was consistent with the findings of Liu et al. (2021) [25]. In addition, we did not find empirical evidence that HC, INF, FSA, or MPS could affect MGTFP.

3.3. Dynamic Effects of MPSR

The empirical results of 4.2 could only reflect the average effect of the change in MGTFP after the implementation of the policy and could not test whether there was a lag in the effect. Therefore, referring to the existing research ideas of Ruan et al. (2020) [62], this paper discusses the dynamic effect of the implementation of MPSR. The estimated coefficients are shown in Table 5. Model 1 only controlled time-fixed effects and individual fixed effects. Model 2 added a series of control variables based on model 1. The results in model 2 showed that MPSR was lagging behind the improvement of MGTFP. Further, comparing the estimated coefficients for year × 2019 and year × 2020 indicated that the effect of MPSR on MGTFP was increasing gradually.

3.4. Analysis of Impact Mechanisms

In order to verify the effect mechanism of MPSR on MGTFP, this paper decomposed green total factor productivity into green technology change and green technology efficiency. The results are in Table 6. Model 1 depicted the impact of MPSR on the evolution of maize green technology. Model 2 was the effect of MPSR on maize green technology efficiency. Table 6 shows that the estimation coefficient of green technology progress in maize was 0.043. The estimation coefficient passed the significance test at the level of 1%, indicating that MPSR was helpful to the progress of maize green technology. The estimation coefficient of maize green technology efficiency was −0.054. The estimation coefficient failed to pass the significance test at the 10% level. This paper did not find evidence that MPSR could improve the green technology efficiency of maize. Based on the empirical study, we knew that green technology change was the main way that MPSR increased green total factor productivity.

3.5. Disruption Policy: Soybean Target Price Reform

Because of the substitutability of maize and soybean planting in the pilot area, the above results may have been influenced by the change in soybean policy. In 2014, China released a policy titled “Guiding Opinions on Soybean Target Prices,” launching the soybean target price pilot program. Soybean target price reform may have affected the MGTFP by adjusting the planting structure, thus making the above results biased. To solve the problem of disruption policy, this paper used a policy dummy variable to control the impact of the soybean target price policy on MGTFP. Specifically, if the region was hit by the target price policy for soybeans, it should be recorded as 1 and the remainder as 0 [42]. The regression results in Table 7 show that the results were still significant after controlling for the impact of the soybean target price policy, and the results of this study were relatively robust.

3.6. Parallel Trend Test

This part used an econometric method to test the parallel trend assumption of the model, referring to existing research [72,73,74]. The previous graphical approach (Figure 2) tested the common trend assumption. In order to more accurately judge the parallel trend assumption of MGTFP in reform and non-reform regions, we used the model in Equation (5) to regress. The results are in Table 8. Models 1 and 2 represent regression results without and with control variables, respectively. The results in Table 8 show that when 2016 was chosen as the base period, the coefficients before 2016 were not significant. The results showed that there was no significant difference in MGTFP between reformed and unreformed regions before 2016. Both the graphical approach and the econometric approach showed that the parallel trend assumption was valid, which showed that it was reasonable to adopt the DID model. The research design of this paper could effectively identify the causal relationship between MPSR and MGTFP.

3.7. Placebo Test

The policy treatment effect from the above regression may have been partly caused by the placebo effect. The results may not have accurately identified the impact of MPSR on MFTFP. Referring to previous studies, this paper used time placebo and regional placebo methods to test the robustness of the model [75].

3.7.1. Time-Placebo Test

This paper randomly selected the implementation time of MPSR during the time-placebo test. We assumed that the policy was implemented in 2012 or 2014. The estimates are in Table 9. Model 1 and model 2 represent the results of the policy’s implementation in 2012 and 2014, respectively. Table 9 shows that the results of model 1 and model 2 were not significant, indicating that the fictitious policy had no effect on MGTFP and that the previous results were robust.

3.7.2. Regional Placebo Test

Using the concepts of Chetty et al. (2009) and Cai et al. (2016) [76,77], this paper selected samples randomly in the control group and then treated them as experimental groups to conduct regional placebo tests, which could effectively avoid the chance of policy effects. The method of this paper was to randomly select four main maize-producing provinces as the new experimental group and the other provinces as the corresponding control group. We used the two-way fixed effect model to estimate the coefficients while keeping the control variables unchanged. In order to increase the credibility of the results, the process was repeated 200 times to obtain a virtual policy implementation effect (Figure 3). In Figure 3, the coefficients of repeated regression are concentrated near 0. The results showed that the impact of MPSR on MGTFP was not caused by a placebo, and the results were very stable.

3.8. Discussion

Although MGTFP in China fluctuated from 2010 to 2020, the trend of MGTFP was slowly rising during the period. The findings were similar to those of Liu et al. (2021) [25], Li and Lin (2022) [43], Xu et al. (2019) [78], and other scholars who used DEA to measure trends in agricultural GTFP growth. The magnitude of the fluctuations, however, was different from that in these studies. The reason is that this study was focused on maize and not all crops. Most of the existing studies measured GTFP based on the whole agriculture or plantation industry; however, due to the different growth cycles of different crops, the summed GTFP could hardly reflect the intra-agricultural differences, and it was also difficult to make more detailed policy recommendations. We innovatively measured the GTFP of maize, which could provide more detailed policy recommendations for the development of the maize industry. From 2010 to 2020, MGTFP changed steadily, with an annual growth rate of only 0.70%, but since 2016, MGTFP has achieved a significant growth rate of 2.50%. In recent years, China’s agriculture has entered a stage of accelerated development. The government has begun to attach importance to the green development of agriculture. The Chinese government has successively implemented the market-oriented reform of agricultural subsidies, the Zero Growth Action Plan for Fertilizers to 2020, and the Zero Growth Action Plan for Pesticides to 2020. These initiatives have significantly reduced agricultural non-point source pollution and carbon emissions [79,80], which is also an important reason for the rapid growth of MGTFP.
Most of the current studies believe that the implementation of agricultural subsidies will increase the use of pesticides and fertilizers. Government subsidies can ease farmers’ financial constraints and promote their excessive use of pesticides and fertilizers [81,82]. However, there is little literature on the environmental effects of subsidy reform. The market-oriented reform of agricultural subsidy policy may be an important way to reduce farmers’ use of pesticides and fertilizers [42]. China’s MPSR policy provided us with the opportunity to study its impact. Through the DID model, this paper innovatively studied whether the implementation of the pilot reform policy of corn subsidies in China would promote MGTFP. The results showed that MPSR could significantly improve MGTFP and promote the green development of maize. Because of the long production cycles and vulnerability of agriculture to natural disasters, most developing countries have adopted minimum purchase prices or temporary storage policies to ensure food security [83]. However, this kind of subsidy policy easily causes the excessive input of pesticides and fertilizer in agricultural production, thus causing serious environmental pollution. To promote the green development of agriculture, the market-oriented reform of agricultural subsidies should be properly explored to improve GTFP in developing countries.
Moreover, the dynamic effect of MPSR on the effect of MGTFP was further investigated in this paper. The results of such a refined study can better optimize the MPSR policy. This research also showed that MPSR has a lagging effect on MGTFP. Studies by Ye et al. (2022) [42] and by Ding et al. (2022) [84] have also shown that there is a lag effect in the policy effectiveness of MPSR, mainly due to the implementation of producer subsidies and the responsiveness of farmers to policy reform. However, they did not focus on the environmental effects of MPSR, which are inadequate for Chinese agriculture pursuing high-quality development. We also suggest possible reasons for the hysteresis effect. The amount and standard of producer subsidies have not been unified since the reform. The pattern of market allocation of production factors has not been fully formed, and the improvement of MGTFP has a lagging effect. In addition, Chinese farmers are small-scale producers. The delayed effect of the policy reform will be caused by how small farmers react to the policy lag. The Chinese government needs to pay attention to the long-term impact of the MPSR on the MGTFP. Through continuous optimization and adjustment of policies and increased informational communication between farmers and the government [85], the effect of MPSR may gradually increase.
In addition, we also explored the mechanism of action of MPSR on the effects of MGTFP. We found that MPSR can promote green technology progress. The MPSR can significantly improve the adoption of green technology by farmers. The use of green technologies in agriculture is an effective means of increasing GTFP in agriculture [86,87]. In theory, the MPSR will promote the green efficiency of maize. However, our empirical study did not find evidence that maize storage system reform could improve maize green technology efficiency. We maintained that improving the efficiency of green technology is a long-term process. In the short term, the improvement of maize technology efficiency will be hindered due to an inadequate understanding of policy, imperfect supporting facilities, and unreasonable subsidies. The MPSR may improve maize green technology efficiency as time goes by. The Chinese government needs to find the reasons why MPSR does not affect the efficiency of green technologies and propose solutions to address them.

4. Conclusions and Recommendations

4.1. Conclusions

In 2016, China started MPSR. Based on this policy reform, this paper studied the relationship between the market-oriented reform of agricultural subsidies and the green development of agriculture. Specifically, this paper built the DID model to solve the endogenous problems in policy evaluation, accurately identify the causal relationship between MPSR and MGTFP, and explore dynamic effects and impact mechanisms. The following are the findings:
(1)
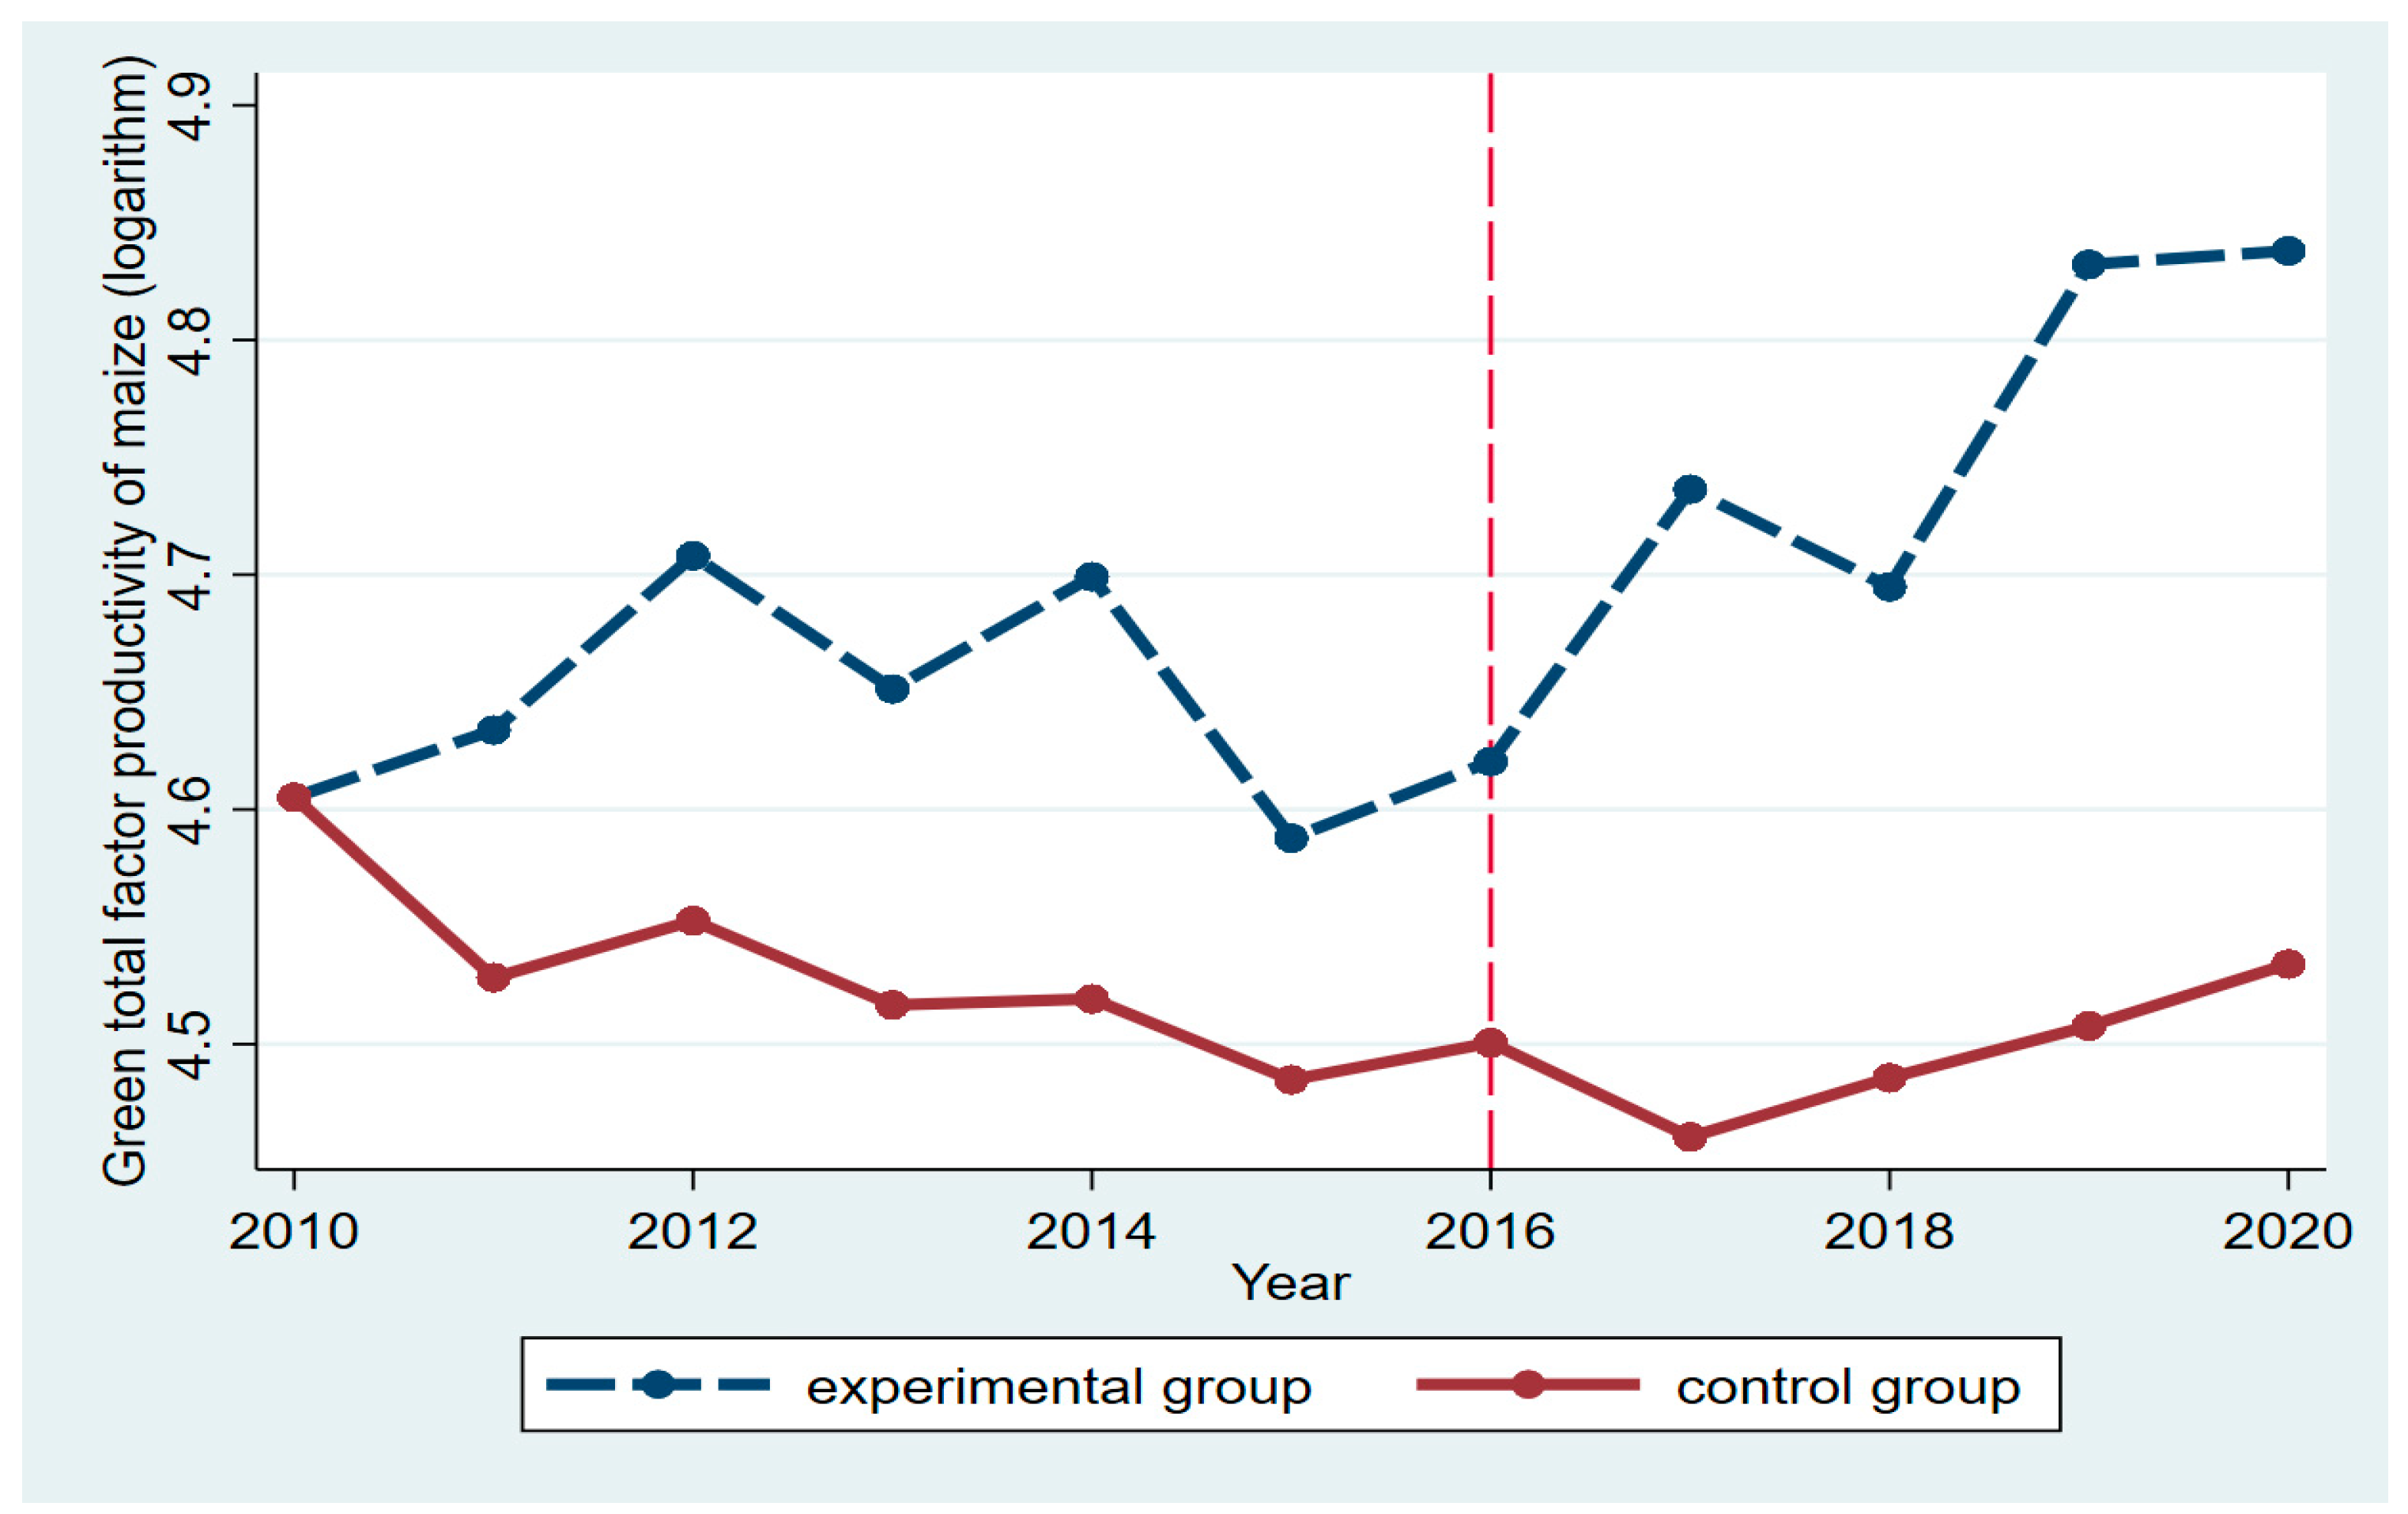
China’s MGTFP increased in 2010–2020, with an average annual growth rate of 0.70%. From 2010 to 2016, the average growth rate of MGTFP in China was −0.30%. From 2017 to 2020, the average annual growth of MGTFP was 2.50%, and the growth of MGTFP after 2016 was more obvious.
(2)
The MPSR could raise MGTFP above the average level. However, the effect of the policy is lagging behind. Two years after the reform, the effect of the policy was evident. Furthermore, this study discovered that urbanization and corn planting areas improved MGTFP and that economic level development and disaster rates reduced MGTFP.
(3)
A mechanism analysis of how the MPSR made the MGTFP grow shows that it mostly did so by helping green technology in maize advance, and the effect on green efficiency was not statistically significant.

4.2. Recommendations

According to the empirical results, China’s MPSR can significantly improve MGTFP. Therefore, we have proven that the market-oriented reform of agricultural subsidies can promote the green development of agriculture. China should accelerate the reform of agricultural subsidies, promote the market-oriented reform of wheat and rice subsidies, and promote green and sustainable agricultural development. This paper makes the following policy recommendations:
(1)
The slow development of MGTFP in China is mainly due to the mode of production. China’s agricultural development cannot rely on high inputs of pesticides and fertilizers. Agricultural production should be transformed into scientific and technological innovation. In order to promote the development of MGTFP, the government should strengthen the research and development of green and low-carbon technologies for agriculture. The government should continue to reduce the use of pesticides and fertilizers and promote the green development of farmers. Last, the government should change agricultural production modes and take appropriate scale management measures to raise the agricultural MGTFP level.
(2)
China should persist in the market-oriented reform of agricultural subsidies for rice and wheat. Our research shows that the MPSR will promote MGTFP, which indicates that the market-oriented reform of agricultural subsidies can promote green agricultural development. The future reform of agricultural subsidies should revolve around market-oriented reform. The market’s functions of resource allocation and price formation will be activated. At present, the price of wheat and rice in China is still decided by the government. The government should gradually carry out the market-oriented reform of agricultural subsidies and restore the market mechanism for determining prices. Producers’ subsidies, cost savings, and efficiency gains will help farmers produce food.
(3)
The government should make maize producers’ subsidies more reasonable. The reason the impact of MPSR on MGTFP is lagging is that the subsidy is not reasonable enough. Farmers’ planting behavior determines MGTFP. The amount and mode of subsidy have a profound influence on farmers’ planting behavior. China just started implementing MPSR a few years ago, and the policy should be further improved. The continuity of subsidy policy, the determination principle of subsidy standards, the publication time of subsidy standards, and the diversification of subsidy modes need further improvement.

4.3. Limitations of the Study and Future Research

Our study provides strong evidence for promoting green development in agriculture. However, some limitations are worth noting. Our study only included carbon emissions in the calculation of agricultural TFP, ignoring surface-source pollution. Future studies could include surface-source pollution in the calculation of TFP. In addition, we only evaluated the policy effects of MPSR from an environmental perspective. Future studies can assess the policy effects in more dimensions.

Author Contributions

Conceptualization, F.Y. and Z.Y.; methodology, F.Y. and Z.Y.; software, F.Y.; validation, F.Y., Z.Y. and M.Y.; formal analysis, F.Y. and Z.Y.; investigation, F.Y.; resources, F.Y. and Z.Y.; data curation, F.Y. and Z.Y.; writing the original draft preparation, F.Y. and Z.Y.; writing, review, and editing, F.Y., Z.Y., M.Y., S.W. and A.L.; visualization, F.Y. and Z.Y.; supervision, Z.Y. and M.Y.; project administration, Z.Y. and M.Y.; funding acquisition, Z.Y. All authors have read and agreed to the published version of the manuscript.

Funding

This research was supported by the Tarim University Key Discipline Construction Project in Agricultural and Forestry Economics and Management (060000303) and the National Social Science Foundation of China (Project No. 18ZDA072).

Institutional Review Board Statement

Not applicable.

Data Availability Statement

The datasets used and analyzed during the current study are available from the corresponding author on reasonable request.

Acknowledgments

We are grateful to Ting Tong and Qing Zhang of Huazhong Agricultural University for their assistance in research methodology.

Conflicts of Interest

The authors declare no conflict of interest.

References

  1. He, G.; Zhao, Y.; Wang, L.; Jiang, S.; Zhu, Y. China’s food security challenge: Effects of food habit changes on requirements for arable land and water. J. Clean. Prod. 2019, 229, 739–750. [Google Scholar] [CrossRef]
  2. Ren, Y.; Peng, Y.; Campos, B.C.; Li, H. The effect of contract farming on the environmentally sustainable production of rice in China. Sustain. Prod. Consum. 2021, 28, 1381–1395. [Google Scholar] [CrossRef]
  3. Xu, B.; Lin, B. Factors affecting CO2 emissions in China’s agriculture sector: Evidence from geographically weighted regression model. Energy Policy 2017, 104, 404–414. [Google Scholar] [CrossRef]
  4. Yang, W.; Zhao, R.; Chuai, X.; Xiao, L.; Cao, L. China’s pathway to a low carbon economy. Carbon Balance Manag. 2019, 14, 1–12. [Google Scholar] [CrossRef] [PubMed] [Green Version]
  5. Ball, V.E.; Lovell CA, K.; Lu, H.; Nehring, R. Incorporating environmental impacts in the measurement of agricultural productivity growth. J. Agric. Resour. Econ. 2004, 29, 436–460. [Google Scholar]
  6. Huang, X.; Feng, C.; Qin, J.; Wang, X.; Zhang, T. Measuring China’s agricultural green total factor productivity and its drivers during 1998–2019. Sci. Total Environ. 2022, 829, 154477. [Google Scholar] [CrossRef]
  7. Kumbhakar, S.C.; Denny, M.; Fuss, M. Estimation and decomposition of productivity change when production is not efficient: A panel data approach. Econom. Rev. 2000, 19, 312–320. [Google Scholar] [CrossRef]
  8. Wang, H.; Cui, H.; Zhao, Q. Effect of green technology innovation on green total factor productivity in China: Evidence from spatial durbin model analysis. J. Clean. Prod. 2021, 288, 125624. [Google Scholar] [CrossRef]
  9. Atafar, Z.; Mesdaghinia, A.; Nouri, J.; Homaee, M. Effect of fertilizer application on soil heavy metal concentration. Environ. Monit. Assess. 2010, 160, 83–89. [Google Scholar] [CrossRef]
  10. Yuan, F.; Tang, K.; Shi, Q. Does Internet use reduce chemical fertilizer use? Evidence from rural households in China. Environ. Sci. Pollut. Res. 2021, 28, 6005–6017. [Google Scholar] [CrossRef]
  11. Zhang, Z.S.; Chen, J.; Liu, T.Q.; Cao, C.; Li, F. Effects of nitrogen fertilizer sources and tillage practices on greenhouse gas emissions in paddy fields of central China. Atmos. Environ. 2016, 144, 274–281. [Google Scholar] [CrossRef]
  12. Wu, H.; MacDonald, G.K.; Galloway, J.N.; Zhang, L. The influence of crop and chemical fertilizer combinations on greenhouse gas emissions: A partial life-cycle assessment of fertilizer production and use in China. Resour. Conserv. Recycl. 2021, 168, 105303. [Google Scholar] [CrossRef]
  13. Aigner, D.; Lovell CA, K.; Schmidt, P. Formulation and estimation of stochastic frontier production function models. J. Econom. 1977, 6, 21–37. [Google Scholar] [CrossRef]
  14. Lin, B.; Wang, X. Exploring energy efficiency in China’s on and steel industry: A stochastic frontier approach. Energy Policy 2014, 72, 87–96. [Google Scholar] [CrossRef]
  15. Bai, C.; Du, K.; Yu, Y.; Feng, C. Understanding the trend of total factor carbon productivity in the world: Insights from convergence analysis. Energy Econ. 2019, 81, 698–708. [Google Scholar] [CrossRef]
  16. Razzaq, A.; Qing, P.; Abid, M.; Anwar, M.; Javed, I. Can the informal groundwater markets improve water use efficiency and equity? Evidence from a semi-arid region of Pakistan. Sci. Total Environ. 2019, 666, 849–857. [Google Scholar] [CrossRef]
  17. Grifell-Tatjé, E.; Lovell, C.A.K. A note on the Malmquist productivity index. Econ. Lett. 1995, 47, 169–175. [Google Scholar] [CrossRef]
  18. Tian, X.; Yu, X. The Enigmas of TFP in China: A meta-analysis. China Econ. Rev. 2012, 23, 396–414. [Google Scholar] [CrossRef] [Green Version]
  19. Tugcu, C.T.; Tiwari, A.K. Does renewable and/or non-renewable energy consumption matter for total factor productivity (TFP) growth? Evidence from the BRICS. Renew. Sustain. Energy Rev. 2016, 65, 610–616. [Google Scholar] [CrossRef]
  20. Xu, X.; Zhang, L.; Chen, L.; Liu, C. The role of soil N2O emissions in agricultural green total factor productivity: An empirical study from China around 2006 when agricultural tax was abolished. Agriculture 2020, 10, 150. [Google Scholar] [CrossRef]
  21. Liu, Y.; Feng, C. What drives the fluctuations of “green” productivity in China’s agricultural sector? A weighted Russell directional distance approach. Resour. Conserv. Recycl. 2019, 147, 201–213. [Google Scholar] [CrossRef]
  22. Oskam, A. Productivity Measurement, Incorporating Environmental Effects of Agricultural Production. Agricultural Economics and Policy: International Challenges for the Nineties; Elsevier: Amsterdam, The Netherlands, 1991; pp. 186–204. [Google Scholar]
  23. West, T.O.; Marland, G. A synthesis of carbon sequestration, carbon emissions, and net carbon flux in agriculture: Comparing tillage practices in the United States. Agric. Ecosyst. Environ. 2002, 91, 217–232. [Google Scholar] [CrossRef]
  24. Wang, Q.; Wang, H.; Chen, H. A study on agricultural green TFP in China: 1992–2010. Econ. Rev. 2012, 5, 24–33. [Google Scholar]
  25. Liu, D.; Zhu, X.; Wang, Y. China’s agricultural green total factor productivity based on carbon emission: An analysis of evolution trend and influencing factors. J. Clean. Prod. 2021, 278, 123692. [Google Scholar] [CrossRef]
  26. Chen, Y.; Miao, J.; Zhu, Z. Measuring green total factor productivity of China’s agricultural sector: A three-stage SBM-DEA model with non-point source pollution and CO2 emissions. J. Clean. Prod. 2021, 318, 128543. [Google Scholar] [CrossRef]
  27. Yang, Y.; Ma, H.; Wu, G. Agricultural Green Total Factor Productivity under the Distortion of the Factor Market in China. Sustainability 2022, 14, 9309. [Google Scholar] [CrossRef]
  28. Adnan, N.; Nordin, S.M.; Ali, M. A solution for the sunset industry: Adoption of green fertiliser technology amongst Malaysian paddy farmers. Land Use Policy 2018, 79, 575–584. [Google Scholar] [CrossRef]
  29. Liu, F.; Lv, N. The threshold effect test of human capital on the growth of agricultural green total factor productivity: Evidence from China. Int. J. Electr. Eng. Educ. 2021, 4, 1–15. [Google Scholar] [CrossRef]
  30. Wang, R.; Feng, Y. Research on China’s agricultural carbon emission efficiency evaluation and regional differentiation based on DEA and Theil models. Int. J. Environ. Sci. Technol. 2021, 18, 1453–1464. [Google Scholar] [CrossRef]
  31. Fang, L.; Hu, R.; Mao, H.; Chen, S. How crop insurance influences agricultural green total factor productivity: Evidence from Chinese farmers. J. Clean. Prod. 2021, 321, 128977. [Google Scholar] [CrossRef]
  32. Wang, Y.; Xie, L.; Zhang, Y.; Wang, C.; Yu, K. Does FDI promote or inhibit the high-quality development of agriculture in China? An agricultural GTFP perspective. Sustainability 2019, 11, 4620. [Google Scholar] [CrossRef] [Green Version]
  33. Yu, Z.; Mao, S.; Lin, Q. Has China’s carbon emissions trading pilot policy improved agricultural green total factor productivity? Agriculture 2022, 12, 1444. [Google Scholar] [CrossRef]
  34. Razzaq, A.; Xiao, M.; Zhou, Y.; Liu, H.; Abbas, A.; Liang, W. Impact of participation in groundwater market on farmland, income, and water access: Evidence from Pakistan. Water 2022, 14, 1832. [Google Scholar] [CrossRef]
  35. Razzaq, A.; Xiao, M.; Zhou, Y.; Anwar, M.; Liu, H. Towards sustainable water use: Factors influencing farmers’ participation in the informal groundwater markets in Pakistan. Front. Environ. Sci. 2022, 10, 944156. [Google Scholar] [CrossRef]
  36. Gu, L.; Guo, Q.; Gao, L. Research on the Effects and the Optimization of Maize Purchase and Storage System Reform in China: Based on the Survey in Jilin Province. Econ. Rev. 2018, 4, 106–112. (In Chinese) [Google Scholar] [CrossRef]
  37. Gale, H.F. Growth and Evolution in China’s Agricultural Support Policies. USDA-ERS Economic Research Report, 2013 (153). Available online: https://ssrn.com/abstract=2323650 (accessed on 10 January 2023).
  38. Hejazi, M.; Marchant, M.A. China’s evolving agricultural support policies. Choices 2017, 32, 1–7. [Google Scholar]
  39. Gong, B.; Yang, N.; Liu, S. Implementation effect and improvement of corn producer subsidy policy. Issues Agric. Econ. 2021, 10, 127–138. (In Chinese) [Google Scholar] [CrossRef]
  40. Ely, A.; Geall, S.; Song, Y. Sustainable maize production and consumption in China: Practices and politics in transition. J. Clean. Prod. 2016, 134, 259–268. [Google Scholar] [CrossRef] [Green Version]
  41. Han, X.; Chen, Y.; Wang, X. Impacts of China’s bioethanol policy on the global maize market: A partial equilibrium analysis to 2030. Food Secur. 2022, 14, 147–163. [Google Scholar] [CrossRef]
  42. Ye, F.; Li, G.; Li, Q. Whether the Reform of Collection and Storage System Can Promote the High Quality Development of Corn: Based on the Perspective of TFP. Commer. Res. 2022, 2, 56–66. (In Chinese) [Google Scholar] [CrossRef]
  43. Li, J.; Lin, Q. Can the Adjustment of China’s Grain Purchase and Storage Policy Improve Its Green Productivity? Int. J. Environ. Res. Public Health 2022, 19, 6310. [Google Scholar] [CrossRef] [PubMed]
  44. Liu, H.; Qin, F. Grain Quality Improvement in Northeast China since the Grain Storage System Reform and Reform Proposals. Econ. Rev. 2019, 12, 99–106. (In Chinese) [Google Scholar] [CrossRef]
  45. Xu, H.; Gu, L.; Liu, S. Research on the development of corn industry in Jilin province under the reform of purchasing and storage system. Maize Sci. 2021, 29, 175–180. (In Chinese) [Google Scholar] [CrossRef]
  46. Tone, K. A slacks-based measure of efficiency in data envelopment analysis. Eur. J. Oper. Res. 2001, 130, 498–509. [Google Scholar] [CrossRef] [Green Version]
  47. Tao, X.; Wang, P.; Zhu, B. Provincial green economic efficiency of China: A non-separable input–output SBM approach. Appl. Energy 2016, 171, 58–66. [Google Scholar] [CrossRef]
  48. Zhou, Y.; Liu, W.; Lv, X.; Chen, X.; Shen, M. Investigating interior driving factors and cross-industrial linkages of carbon emission efficiency in China’s construction industry: Based on Super-SBM DEA and GVAR model. J. Clean. Prod. 2019, 241, 118322. [Google Scholar] [CrossRef]
  49. Pastor, J.; Lovell, C.A. A global Malmquist productivity index. Econ. Lett. 2005, 88, 266–271. [Google Scholar] [CrossRef]
  50. Oh, D. A global Malmquist-Luenberger productivity index. J. Product. Anal. 2010, 34, 183–197. [Google Scholar] [CrossRef]
  51. Chung, Y.H.; Färe, R.; Grosskopf, S. Productivity and undesirable outputs: A directional distance function approach. J. Environ. Manag. 1997, 51, 229–240. [Google Scholar] [CrossRef] [Green Version]
  52. Bao, B.; Jin, S.; Li, L.; Duan, K.; Gong, X. Analysis of green total factor productivity of grain and its dynamic distribution: Evidence from Poyang Lake Basin, China. Agriculture 2021, 12, 8. [Google Scholar] [CrossRef]
  53. Wang, L.; Tang, J.; Tang, M.; Su, M.; Guo, L. Scale of operation, financial support, and agricultural green total factor productivity: Evidence from China. Int. J. Environ. Res. Public Health 2022, 19, 9043. [Google Scholar] [CrossRef] [PubMed]
  54. Li, B.; Zhang, J.; Li, H. Research on spatial-temporal characteristics and affecting factors decomposition of agricultural carbon emission in China. China Popul. Resour. Environ. 2011, 21, 80–86. (In Chinese) [Google Scholar] [CrossRef]
  55. Xiong, C.; Yang, D.; Xia, F.; Huo, J. Changes in agricultural carbon emissions and factors that influence agricultural carbon emissions based on different stages in Xinjiang, China. Sci. Rep. 2016, 6, 1–10. [Google Scholar] [CrossRef] [PubMed]
  56. IPCC. Working Group I: The Physical Science Basis. IPCC Fourth Assess Rep Clim Change. 2007. Available online: https://ui.adsabs.harvard.edu/abs/2007AGUFM.U43D.01S%2F (accessed on 15 May 2022).
  57. Rubin, D.B. Estimating causal effects of treatments in randomized and non-randomized studies. J. Educ. Psychol. 1974, 66, 688–701. [Google Scholar] [CrossRef] [Green Version]
  58. Han, X.; Xue, P.; Zhang, N. Impact of grain subsidy reform on the land Use of smallholder farms: Evidence from Huang-Huai-Hai Plain in China. Land 2021, 10, 929. [Google Scholar] [CrossRef]
  59. Tang, H.; Liu, J.; Mao, J.; Wu, J. The effects of emission trading system on corporate innovation and productivity-empirical evidence from China’s SO2 emission trading system. Environ. Sci. Pollut. Res. 2020, 27, 21604–21620. [Google Scholar] [CrossRef]
  60. Jacobson, L.S.; Lalonde, R.J.; Sullivan, D.G. Earnings losses of displaced workers. Am. Econ. Rev. 1993, 83, 685–709. Available online: https://www.jstor.org/stable/2117574 (accessed on 13 June 2022).
  61. He, C.; Yu, L. Does the change from the temporary purchasing and storage policy to the target price policy increase the soybean acreage? An analysis based on a difference-in-differences technique. Chin. Rural. Econ. 2018, 9, 29–46. (In Chinese) [Google Scholar]
  62. Ruan, R.; Liu, S.; Zheng, F. Does the reform of corn purchasing and storage policy lead to a reduction in corn production? An analysis based on a difference-in-differences technique. Chin. Rural. Econ. 2020, 1, 86–107. (In Chinese) [Google Scholar]
  63. Fare, R.; Grosskopf, S.; Norris, M.; Zhang, Z. Productivity growth, technical progress, and efficiency change in industrialized countries. Am. Econ. Rev. 1994, 84, 1040–1044. Available online: https://www.jstor.org/stable/2117971 (accessed on 25 May 2022).
  64. Li, B.; Zhu, X. Analysis of maize production efficiency based on dea-malmquist indexes: A case study of Henan Province. J. Agric. Chem. Environ. 2018, 7, 176. [Google Scholar] [CrossRef] [Green Version]
  65. Mumba, M.; Edriss, A.K. Determinants and change in total factor productivity of smallholder maize production in Southern Zambia. J. Sustain. Dev. 2018, 11, 170–186. [Google Scholar] [CrossRef] [Green Version]
  66. Li, H.; Zhou, X.; Tang, M.; Guo, L. Impact of Population Aging and Renewable Energy Consumption on Agricultural Green Total Factor Productivity in Rural China: Evidence from Panel VAR Approach. Agriculture 2022, 12, 715. [Google Scholar] [CrossRef]
  67. Hu, J.; Zhang, X.; Wang, T. Spatial Spillover Effects of Resource Misallocation on the Green Total Factor Productivity in Chinese Agriculture. Int. J. Environ. Res. Public Health 2022, 19, 15718. [Google Scholar] [CrossRef]
  68. Elahi, E.; Khalid, Z.; Tauni, M.Z.; Zhang, H.; Lirong, X. Extreme weather events risk to crop-production and the adaptation of innovative management strategies to mitigate the risk: A retrospective survey of rural Punjab, Pakistan. Technovation 2022, 117, 102255. [Google Scholar] [CrossRef]
  69. Liu, J.; Dong, C.; Liu, S.; Rahman, S.; Sriboonchitta, S. Sources of total-factor productivity and efficiency changes in China’s agriculture. Agriculture 2020, 10, 279. [Google Scholar] [CrossRef]
  70. Li, J.; Chen, J.; Liu, H. Sustainable agricultural total factor productivity and its spatial relationship with urbanization in China. Sustainability 2021, 13, 6773. [Google Scholar] [CrossRef]
  71. Song, M.; Li, H. Total factor productivity and the factors of green industry in Shanxi Province, China. Growth Chang. 2020, 51, 488–504. [Google Scholar] [CrossRef]
  72. Ma, J.; Hu, Q.; Shen, W.; Wei, X. Does the low-carbon city pilot policy promote green technology innovation? Based on green patent data of Chinese A-share listed companies. Int. J. Environ. Res. Public Health 2021, 18, 3695. [Google Scholar] [CrossRef]
  73. Yang, B.; Liu, C.; Gou, Z.; Man, J.; Su, Y. How will policies of China’s CO2 ETS affect its carbon price: Evidence from Chinese pilot regions. Sustainability 2018, 10, 605. [Google Scholar] [CrossRef] [Green Version]
  74. Han, Y. Impact of environmental regulation policy on environmental regulation level: A quasi-natural experiment based on carbon emission trading pilot. Environ. Sci. Pollut. Res. 2020, 27, 23602–23615. [Google Scholar] [CrossRef] [PubMed]
  75. Huang, W.; Liu, H. Early childhood exposure to health insurance and adolescent outcomes: Evidence from rural China. J. Dev. Econ. 2023, 160, 102925. [Google Scholar] [CrossRef]
  76. Chetty, R.; Looney, A.; Kroft, K. Salience and taxation: Theory and evidence. Am. Econ. Rev. 2009, 99, 1145–1177. [Google Scholar] [CrossRef] [Green Version]
  77. Cai, X.; Lu, Y.; Wu, M.; Yu, L. Does environmental regulation drive away inbound foreign direct investment? Evidence from a quasi-natural experiment in China. J. Dev. Econ. 2016, 123, 73–85. [Google Scholar] [CrossRef]
  78. Xu, X.; Huang, X.; Huang, J.; Gao, X.; Chen, L. Spatial-temporal characteristics of agriculture green total factor productivity in China, 1998-2016: Based on more sophisticated calculations of carbon emissions. Int. J. Environ. Res. Public Health 2019, 16, 3932. [Google Scholar] [CrossRef] [Green Version]
  79. Shuqin, J.; Fang, Z. Zero growth of chemical fertilizer and pesticide use: China’s objectives, progress and challenges. J. Resour. Ecol. 2018, 9, 50–58. [Google Scholar] [CrossRef]
  80. Ma, W.; Zheng, H. Heterogeneous impacts of information technology adoption on pesticide and fertilizer expenditures: Evidence from wheat farmers in China. Aust. J. Agric. Resour. Econ. 2022, 66, 72–92. [Google Scholar] [CrossRef]
  81. Laborde, D.; Mamun, A.; Martin, W.; Pineiro, V.; Vos, R. Agricultural subsidies and global greenhouse gas emissions. Nat. Commun. 2021, 12, 1–9. [Google Scholar] [CrossRef]
  82. Yi, F.; Sun, D.; Zhou, Y. Grain subsidy, liquidity constraints and food security—Impact of the grain subsidy program on the grain-sown areas in China. Food Policy 2015, 50, 114–124. [Google Scholar] [CrossRef] [Green Version]
  83. Zhang, T.; Guo, Y.; Yang, J. Review and prospect of the reform of agricultural support and protection system based on price support and subsidy. Issues Agric. Econ. 2018, 11, 4–10. (In Chinese) [Google Scholar] [CrossRef]
  84. Ding, Y.; Shi, H.; Lv, K. Policy response of farmers to the reform of corn purchase and storage system: Based on the perspective of scale heterogeneity. J. Arid. Land Resour. Environ. 2022, 36, 22–27. (In Chinese) [Google Scholar] [CrossRef]
  85. Erfanian, S.; Ziaullah, M.; Tahir, M.A.; Ma, D.G. How does justice matter in developing supply chain trust and improving information sharing-an empirical study in Pakistan. Int. J. Manuf. Technol. Manag. 2021, 35, 354–368. [Google Scholar] [CrossRef]
  86. Urruty, N.; Deveaud, T.; Guyomard, H.; Boiffin, J. Impacts of agricultural land use changes on pesticide use in French agriculture. Eur. J. Agron. 2016, 80, 113–123. [Google Scholar] [CrossRef]
  87. Möhring, N.; Dalhaus, T.; Enjolras, G.; Finger, R. Crop insurance and pesticide use in European agriculture. Agric. Syst. 2020, 184, 102902. [Google Scholar] [CrossRef]
Figure 1. Impact mechanism diagram.
Agriculture 13 00251 g001
Figure 2. Dynamic change of MGTFP in the control group and experimental group.
Agriculture 13 00251 g002
Figure 3. Coefficient distribution of 200 results.
Agriculture 13 00251 g003
Table 1. Carbon emissions’ influencing factors and coefficients.
Carbon Emissions SourceCarbon Emissions CoefficientSource of Coefficient
Chemical fertilizer0.8956 kg·kg−1Oak Ridge National Laboratory, ORNL
Pesticides4.9341 kg·kg−1Oak Ridge National Laboratory, ORNL
Agricultural film5.18 kg·kg−1Institute of Resources, Ecosystem and Environment of Agriculture, IREEA
Diesel oil0.5927 kg·kg−1IPCC
Plowing312.6 kg·km−2Institute of Agriculture and Biotechnology of China Agricultural University, IABCAU
Irrigation25 kg·Cha−1Li et al., 2011 [54]
Table 2. Descriptive statistics of variables.
VariablesAbbreviationUnitsNMeanS.D.MinMax
Green total factor productivity of maizeMGTFP-2201.0070.1390.4052.427
Green technology change of maizeGTC-2201.0140.0271.0001.168
Green technology efficiency of maizeGTE-2200.9940.1360.4022.427
DID variabledid-2200.0730.2600.0001.000
UrbanizationURB%2200.5360.0850.3380.734
Regional human capitalHCYear2209.7050.7247.51611.000
Infrastructure constructionINFKm2200.8680.5090.0922.197
Corn planting areaCPAMu2201.5791.5900.1956.318
Eco-development levelIRRK yuan22010.3863.8533.42524.199
Financial support for agricultureFSAB yuan22057.95226.7479.423133.936
Disaster rateDR%2200.1640.1060.0120.512
Maize planting structureMPS%2200.2720.1670.0530.700
Maize yieldOUTPUT1Kg220480.01390.432229.880748.590
Carbon emissionsOUTPUT2Kg220491.600129.400191.100734.500
Mechanical inputINPUT1Yuan2207264.0001456.0003448.00012,071.000
Fertilizer inputINPUT2Yuan220111.50052.20029.300243.400
Seed inputINPUT3Yuan2201243.000646.10025.1002431.000
Pesticide inputINPUT4Yuan2202019.000300.1001298.0002719.000
Labor inputINPUT5Day220766.800169.000458.1001314.000
Other inputsINPUT6Yuan220223.40081.50036.500505.900
Note: mu is a Chinese unit; 1 hectare is equivalent to 15 mu. Yuan is a Chinese currency; 1 yuan is equivalent to 0.1569 USD in 2022.
Table 3. Measurement results of China’s MGTFP.
Region2010–20162017–2020Mean
Experience groupInner Mongolia0.988 1.090 1.029
Liaoning1.019 1.004 1.013
Jilin1.036 1.104 1.063
Heilongjiang0.985 1.048 1.010
Control groupHebei0.979 1.019 0.995
Shanxi0.975 1.012 0.990
Jiangsu0.988 0.991 0.989
Anhui0.962 1.024 0.987
Shandong0.995 1.036 1.011
Henan1.207 0.866 1.071
Hubei0.960 1.004 0.977
Guangxi0.987 0.976 0.983
Chongqing0.941 1.008 0.968
Sichuan1.008 1.002 1.006
Guizhou1.008 1.026 1.015
Yunnan0.988 1.018 1.000
Shaanxi0.988 1.015 0.999
Gansu0.952 1.065 0.997
Ningxia0.993 1.046 1.014
Xinjiang0.971 1.143 1.040
Mean0.9971.0251.007
Kruskal–Wallis t test1.878
Note: The data in the table are geometric averages of MGTFP by region.
Table 4. DID regression results.
VariablesModel 1Model 2Model 3
did0.164 ***
(0.039)
0.145 ***
(0.050)
0.119 ***
(0.053)
URB--1.335 ***
(0.333)
1.433 ***
(0.412)
HC--0.005
(0.043)
−0.029
(0.044)
INF--−0.048
(0.117)
−0.026
(0.117)
CPA--0.136 ***
(0.037)
0.147 ***
(0.041)
IRR----−0.706 **
(0.290)
FSA----0.005
(0.093)
DR----−0.328 ***
(0.112)
CPS----−0.235
(0.429)
Individual fixed effectsYesYesYes
Year fixed effectsYesYesYes
_cons4.605 ***
(0.025)
−0.677
(1.425)
5.376 ***
(2.512)
R20.0250.1180.159
N220220220
Note: *** and ** indicate significance levels of 1% and 5%, respectively.
Table 5. Dynamic effects of MPSR.
VariablesModel 1Model 2
Year × 20170.093
(0.061)
0.101
(0.062)
Year × 20180.051
(0.061)
0.060
(0.065)
Year × 20190.189 ***
(0.061)
0.119 *
(0.067)
Year × 20200.194 ***
(0.061)
1.358 ***
(0.332)
Control variablesNoYes
Individual fixed effectsYesYes
Year fixed effectsNoYes
_cons4.543 ***
(0.008)
3.715 ***
(0.737)
R20.1670.146
N220220
Note: *** and * indicate significance levels of 1% and 10%, respectively.
Table 6. Impact mechanism analysis.
VariablesModel 1Model 2
did0.043 ***
(0.016)
−0.054
(0.072)
Control variablesYesYes
Individual fixed effectsYesYes
Year fixed effectsYesYes
_cons3.621 ***
(0.762)
8.121
(3.414)
R20.5940.118
N220220
Note: *** indicates a significance level of 1%.
Table 7. Regression results after eliminating interference policies.
VariablesModel 1Model 2
did0.167 ***
(0.054)
0.143 **
(0.055)
Soybean target price reformYesYes
Control variablesNoYes
Individual fixed effectsYesYes
Year fixed effectsYesYes
_cons4.605 ***
(0.025)
6.635 ***
(2.618)
R20.0200.166
N220220
Note: *** and ** indicate significance levels of 1% and 5%, respectively.
Table 8. Results of the parallel trend test.
VariablesModel 1Model 2
Year × 2011−0.120
(0.085)
−0.009
(0.154)
Year × 2012−0.014
(0.070)
0.112
(0.122)
Year × 20130.036
(0.083)
0.183
(0.108)
Year × 20140.015
(0.075)
0.133
(0.087)
Year × 20150.060
(0.074)
0.137
(0.086)
Year × 2016−0.017
(0.063)
0.060
(0.079)
Control variablesYesYes
Individual fixed effectsYesYes
Year fixed effectsYesYes
_cons4.639 ***
(0.031)
6.340
(2.400)
R20.1120.250
N220220
Note: *** indicates a significance level of 1%.
Table 9. Time-placebo test results.
VariablesModel 1Model 2
did−0.017
(0.062)
−0.060
(0.064)
Control variablesYesYes
Individual fixed effectsYesYes
Year fixed effectsYesYes
_cons7.434 ***
(2.454)
8.229 ***
(2.585)
R20.1360.140
N220220
Note: *** indicates a significance level of 1%.
Disclaimer/Publisher’s Note: The statements, opinions and data contained in all publications are solely those of the individual author(s) and contributor(s) and not of MDPI and/or the editor(s). MDPI and/or the editor(s) disclaim responsibility for any injury to people or property resulting from any ideas, methods, instructions or products referred to in the content.

