Article

Towards Understanding the Key Signature Pathways Associated from Differentially Expressed Gene Analysis in an Indian Prostate Cancer Cohort

by
Nidhi Shukla
1,2,†,
Bhumandeep Kour
3,†,
Devendra Sharma
4,
Maneesh Vijayvargiya
5,
T. C. Sadasukhi
6,
Krishna Mohan Medicherla
1,7,
Babita Malik
2,
Bhawana Bissa
8,
Sugunakar Vuree
9,10,
Nirmal Kumar Lohiya
11 and
Prashanth Suravajhala
9,12,*
1
Department of Biotechnology and Bioinformatics, Birla Institute of Scientific Research (BISR), Statue Circle, Jaipur 302001, India
2
Department of Chemistry, School of Basic Sciences, Manipal University Jaipur, Jaipur 303007, India
3
Department of Biotechnology, School of Bioengineering and Biosciences, Lovely Professional University, Phagwara 144001, India
4
Department of Urology, Rukmani Birla Hospital, Jaipur 302018, India
5
Department of Pathology, Mahatma Gandhi University of Medical Sciences and Technology, Jaipur 302022, India
6
Department of Urology, Mahatma Gandhi University of Medical Sciences and Technology, Jaipur 302022, India
7
Department of Bioengineering, Birla Institute of Technology, Mesra Jaipur Campus, 27-Malaviya Industrial Area, Jaipur 302017, India
8
Department of Biochemistry, Central University of Rajasthan, Ajmer 305817, India
9
Bioclues.org, Hyderabad 500072, India
10
MNR Foundation for Research & Innovation, MNR University, Sangareddy 502294, India
11
Department of Zoology, Center for Advanced Studies, University of Rajasthan, Jaipur 302004, India
12
Amrita School of Biotechnology, Amrita Vishwa Vidyapeetham, Kollam 690525, India
*
Author to whom correspondence should be addressed.
These authors contributed equally to this work.
Diseases 2023, 11(2), 72; https://doi.org/10.3390/diseases11020072
Submission received: 20 February 2023 / Revised: 13 April 2023 / Accepted: 18 April 2023 / Published: 11 May 2023
(This article belongs to the Section Oncology)

Abstract

:
Prostate cancer (PCa) is one of the most prevalent cancers among men in India. Although studies on PCa have dealt with genetics, genomics, and the environmental influence in the causality of PCa, not many studies employing the Next Generation Sequencing (NGS) approaches of PCa have been carried out. In our previous study, we identified some causal genes and mutations specific to Indian PCa using Whole Exome Sequencing (WES). In the recent past, with the help of different cancer consortiums such as The Cancer Genome Atlas (TCGA) and International Cancer Genome Consortium (ICGC), along with differentially expressed genes (DEGs), many cancer-associated novel non-coding RNAs have been identified as biomarkers. In this work, we attempt to identify differentially expressed genes (DEGs) including long non-coding RNAs (lncRNAs) associated with signature pathways from an Indian PCa cohort using the RNA-sequencing (RNA-seq) approach. From a cohort of 60, we screened six patients who underwent prostatectomy; we performed whole transcriptome shotgun sequencing (WTSS)/RNA-sequencing to decipher the DEGs. We further normalized the read counts using fragments per kilobase of transcript per million mapped reads (FPKM) and analyzed the DEGs using a cohort of downstream regulatory tools, viz., GeneMANIA, Stringdb, Cytoscape-Cytohubba, and cbioportal, to map the inherent signatures associated with PCa. By comparing the RNA-seq data obtained from the pairs of normal and PCa tissue samples using our benchmarked in-house cuffdiff pipeline, we observed some important genes specific to PCa, such as STEAP2, APP, PMEPA1, PABPC1, NFE2L2, and HN1L, and some other important genes known to be involved in different cancer pathways, such as COL6A1, DOK5, STX6, BCAS1, BACE1, BACE2, LMOD1, SNX9, CTNND1, etc. We also identified a few novel lncRNAs such as LINC01440, SOX2OT, ENSG00000232855, ENSG00000287903, and ENST00000647843.1 that need to be characterized further. In comparison with publicly available datasets, we have identified characteristic DEGs and novel lncRNAs implicated in signature PCa pathways in an Indian PCa cohort which perhaps have not been reported. This has set a precedent for us to validate candidates further experimentally, and we firmly believe this will pave a way toward the discovery of biomarkers and the development of novel therapies.

1. Introduction

Prostate cancer (PCa) is the fifth most common cause of cancer death in males worldwide and the second most frequently diagnosed malignancy in many developed nations. In the recent past, there is an increased occurrence of PCa varying among different races and countries, particularly between Western (Caucasian) and Eastern (Asian) populations [1,2]. Notwithstanding the increased burden of PCa incidence in affluent nations, males of African ancestry (MAA) bear a disproportionate amount of this burden. Men living in the Caribbean and in Sub-Saharan Africa had the highest PCa mortality rates in the world. According to the International Agency for Research on Cancer (IARC), PCa is also anticipated to trend higher across Africa, where fatalities from the disease will rise from about 28,000 in 2010 to just over 57,000 by 2030.
Over the last few years, there has been an increase in PCa cases across all the different parts of and regions in India [3,4]. Next Generation Sequencing (NGS) has advanced our understanding of the diseased phenotypes, particularly cancers with tumor heterogeneity, and capture of large amounts of genetic architecture leading to isoforms, splice junctions, and post-transcriptional modifications with great accuracy and sensitivity [5,6]. Although studies have dealt with the genetics, genomics, and environmental influence in the causality of PCa, no association of genotype and phenotype employing the NGS approaches has been discussed in the Indian population. Recent studies from our lab using the whole exome sequencing (WES) approach of PCa have yielded very promising results to identify causal genes specific to PCa, with 30 causal genes and over eight genes specific to the Indian phenotype with variable degrees of genetic disposition [7]. Whole transcriptome shotgun sequencing (WTSS) or RNA-sequencing (RNA-seq), on the other hand, is used to study gene expression patterns, regulation, developmental biology, and clinical and health sectors [8]. The expected outcome of RNA-seq is the identification of differentially expressed genes (DEGs) in different conditions (for, e.g., wild type vs. mutant or control vs. tumor), which could provide a detailed mechanism of underlying disease [9]. The DEGs are selected based on the cut-off and the log2 fold change that depends on p-values obtained by statistical modeling [10]. RNA-seq generates millions of short reads that are aligned to a reference genome using different alignment software, and based on this, the characteristic of a particular dataset is calculated [11]. Although RNAs are labile and unstable in alkaline conditions, they can be easily detected and quantified at very low abundance for varying gene expression patterns; which, makes them suitable to use as biomarkers [12]. Compared with DNA and protein biomarkers, RNA biomarkers have more sensitivity and specificity and are very cost-effective [13]. Similarly, RNA biomarkers have the advantage of providing dynamic insights into cellular states and regulatory processes compared to DNA biomarkers [14]. With the advent of high-throughput sequencing technologies, different types of non-coding RNAs (e.g., small nuclear RNA, micro-RNA, small nucleolar RNA, long non-coding RNA, etc.) and protein-coding RNAs (i.e., mRNAs) have been detected [15]. Interestingly, there have been lots of novel non-coding RNAs discovered recently, out of which mRNAs, piwiRNAs, siRNAs, ceRNAs, and miRNAs have been well-documented as diagnostic and prognostic markers in different types of cancers (ovary, lung, breast, colorectal) [16]. In addition to small RNAs, long non-coding RNAs (lncRNAs) previously considered as ‘transcriptional noises’ have been known to have a diverse and significant role in various diseases, primarily cancers [17,18]. Although well-known lncRNAs in the form of MALAT, HOTAIR, XIST have been reported in genitourinary cancers, the increasing number of cases of PCa worldwide and as well as in the Indian population, warrants the need for identifying lncRNA-based biomarkers [19,20]. Further with the advent of RNA-seq, the identification of lncRNAs will hopefully facilitate the translational research to the bench side [21]. Therefore, with considerable data available on the Indian population, transcriptome analysis on Indian patients supplementing strategies in diseased phenotypes of PCa will be of great interest [22]. In the current study, we analyzed the RNA-seq data from a cohort of six patients and identified DEGs as well as lncRNAs which could lay emphasis as deterministic markers. Cufflinks-Cuffdiff has been used for transcriptome analysis in a wide number of studies, e.g., Tripathi et al. [23] have identified DEGs from breast cancer. Similarly, Kim et al. [24] have done transcriptome analysis of sinensetin-treated liver cancer cells using the Cufflinks-Cuffdiff pipeline. There are many more studies that corroborate the importance of these tools. We discuss the impending results obtained from this study and attempt to further compare and validate from our downstream analysis.

2. Materials and Methods

2.1. Patients, Clinical Samples, and Criteria

From a cohort of 60, we screened 6 patients who underwent prostatectomy (4 cases and 2 controls) from Rukmani Birla Hospital (RBH) (Table 1). The study was carried out through our CA Prostate Consortium of India (CAPCI; https://bioclues.org/capci last accessed on 13 April 2023) and received approval from the Institutional Ethics Committee (IEC) of Rukmani Birla Hospitals, Jaipur, India, and informed consent was judiciously taken. The inclusion and exclusion criteria for selecting patients have been mentioned in Table 2.

2.2. Tissue Preparation and RNA Sequencing

RNA was isolated using the RNeasy FFPE kit (Qiagen, Catalog No-73504) from BPH and malignant Formalin-Fixed Paraffin-Embedded (FFPE) blocks, and was sent for sequencing (outsourced). From approximately 0.5 mg of cross-section, the RNA was prepared wherein the NEBNext® Ultra™ II Directional RNA Library Prep Kit was used for preparing the libraries following the manufacturer’s protocol. While 100 ng of FFPE RNA was used as input, it was then subjected to end repair and Illumina-specific adaptors were ligated. The adaptor-ligated product was then barcoded and subjected to 15 cycles of PCR. The samples after PCR were cleaned up using AMPure XP beads with the final libraries checked for quality using Qubit Fluorometer and Agilent Tapestation. The obtained libraries were pooled and diluted to the final optimal loading concentration before cluster amplification on the Illumina flow cell. Once the cluster generation is completed, the cluster flow cell is loaded on an Illumina HiSeq X instrument to generate 60 M, 150 bp paired end reads.

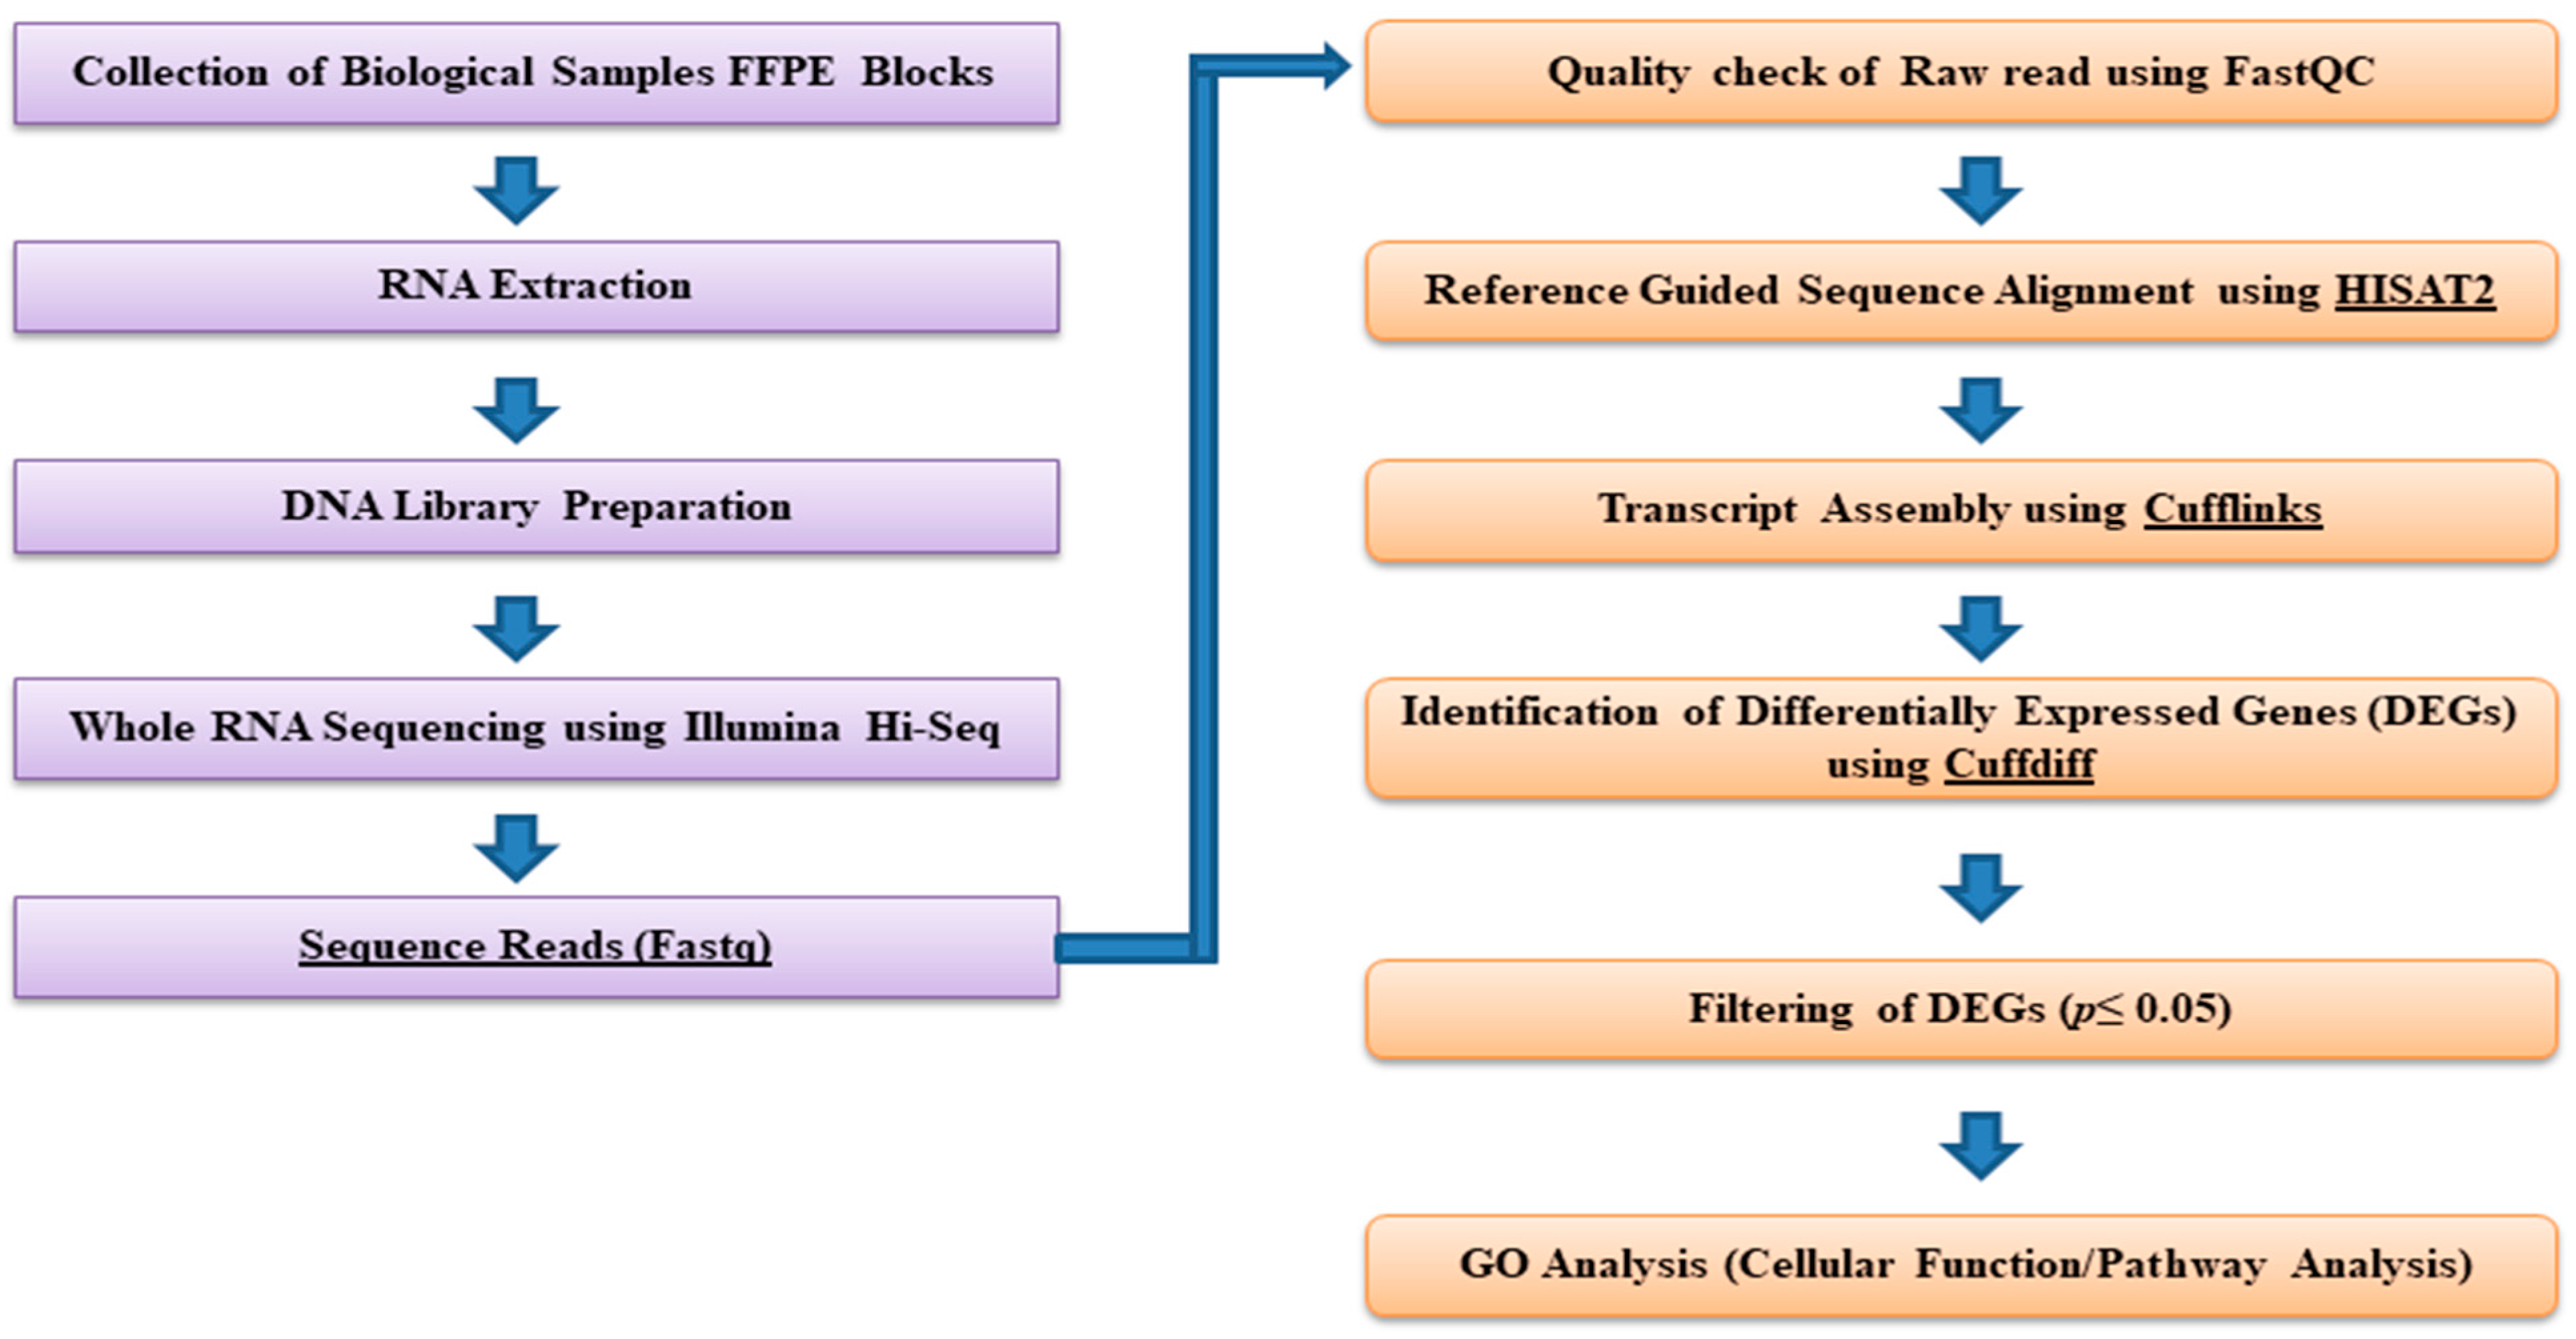
2.3. Bioinformatics and Downstream RNA-Sequencing Analysis

The Cufflinks-Cuffdiff pipeline was employed to yield significant changes at the level of transcript expression [25], as we used our benchmarked pipeline from our lab to run through the workflow [26]. The sequences were aligned to human genome reference (build hg38) using HISAT2 to produce the alignment results output in SAM (sequence alignment map/file). HISAT2 aligns a set of unpaired reads (in fastq or fq format) to the reference genome using the Ferragina and Manzini (FM)-index [27]. Cufflinks uses this map (SAM) and assembles the reads into transcripts, estimates their abundances, and finally examines DEGs from the samples (Figure 1). This was followed by Cuffdiff to check the DEGs which compared the aligned reads from RNA-seq samples from two or more conditions, and identified transcripts that are differentially expressed using a rigorous FPKM normalization/statistical analysis [28]. In the current study, Cuffdiff was used to perform differential analysis between the control samples and the other 4 malignant samples, respectively [29]. A p-value cutoff of 0.05 and less was used to identify the significantly expressed transcripts (Figure 2). We performed a real-time PCR validation for some selected DEGs. The primers were ordered accordingly, and RT-PCR was performed (supplementary information). We saw a significant difference in the expression of a few genes in malignant samples compared to control ones. But some of the genes did not show any difference which could be due to the small sample size as well as the poor quality of FFPE blocks.

2.4. Interaction Networks, Statistical Analysis, Gene Ontology, and Cbioportal Analyses

We generated an interaction network considering a flexible and intuitive approach to evaluating gene lists for generating l functional studies [30]. To check this, GeneMANIA (https://genemania.org/ last accessed on 13 April 2023) was employed which is a versatile, user-friendly web tool for developing gene function hypotheses, reviewing gene lists, and ranking genes for functional experiments [31]. In addition, we also used the search tool for the retrieval of interacting genes (STRING) database (https://string-db.org/ last accessed on 13 April 2023), and integrated DEGs into STRING to evaluate the interaction. Experimentally valid interactions with a score of a minimum of 0.4 (40% or more) were chosen to be ideal ones with the resulting file saved as a tab-separated values (TSV) file [32]. The raw data files from the STRING database were then imported into Cytoscape 3.5.1 and the cytoHubba (http://hub.iis.sinica.edu.tw/cytohubba/ last accessed on 13 April 2023) plugin was employed with clustering coefficient, betweenness, and closeness centralities to calculate the significant modules in the PPI network [33]. Different Cytoscape plugins can score and rank the nodes using different algorithms [34]. CytoHubba is one such plugin that uses a simple interface to analyze the different networks. CytoHubba implements eleven nodes such as degree, Maximum Neighborhood Component, betweenness, closeness, clustering coefficient, stress, etc., to rank any network [35]. Each method has an F function attached to it that gives each node v a numerical value (v). If a node’s score, or F (u), is higher than that of another node, or F(v), then we can say that node’s ranking is higher than that of that other node. PANTHER (http://www.pantherdb.org/ last accessed on 13 April 2023) is a gene ontology-based functional annotation tool that takes a variety of inputs such as Gene IDs, UniProtKB IDs, Ensembl IDs, etc., and results in either functional analysis or statistical enrichment analysis [36]. Furthermore, we deemed to check the expression and mutational profile of some of the genes from our study in the cbioportal (https://www.cbioportal.orglast last accessed on 13 April 2023) for cancer genomics that provides visualization, analysis, and the download of large-scale cancer genomics data sets [37]. We used data from TCGA, PanCancer Atlas of Prostate Adenocarcinoma where 489 samples/patients were screened [38].

3. Results

3.1. Distinct DEGs Were Obtained

Although there has been difficulty in extracting RNA from FFPE blocks from the RNA-seq, which is usually the case [39], while checking it and downstream analyses, all samples yielded good quality reads from FastQC with ca. 40 M transcript reads with no exposure in tiles. With the ensuing Cufflinks-Cuffdiff pipeline, we obtained approximately 70 DEGs, among which 65 were upregulated and 5 were downregulated with inherent p-value heuristics ≤ 0.05 and ≤−2 Log2FC and Log2FC ≥ 2 (Table 3).
Among the top niche-specific DEGs, collagen type VI α1 chain (COL6A1), a gene which is located on chromosome 21, encoding the α1 (VI) chain of type VI collagen (which is a primary extracellular matrix protein) was found which maintains the integrity of various tissues [40]. The signaling role of COL6A1 is very important in tumors as it increases tumor cell proliferation in osteosarcoma as well as promotes vascular invasion and distant metastasis in pancreatic carcinoma [41,42]. Also, COL6A1 plays a role as an oncogene in breast and lung cancer where it regulates anti-apoptosis, proliferation, angiogenesis, and metastasis [43,44]. Catenin delta-1 (CTNND1) functions as an oncogene and is known to be the driver of metastatic cancer progression in hepatocellular carcinoma, breast cancer, and colorectal cancer [45,46,47]. A very important gene that we identified is the six-transmembrane epithelial antigen of Prostate-2 (STEAP2), known to be over-expressed in aggressive PCa, which corroborates our study as it was identified in a high-grade tumor [48]. Furthermore, we also observed that the docking protein 5 (DOK5), a member of a subgroup of the DOK family, is known to be expressed using c-Ret in several neuronal tissues [49]. Recent studies have implicated its role in the invasion, progression, and metastasis of gastric cancer [50]. Amongst the lncRNAs, we identified that SOX2-OT is mapped to the chromosome locus 3q26.3 and is highly expressed in embryonic stem cells [51]. Deregulation of SOX2-OT is observed in various tumors, including lung cancer [52], gastric cancer [53], esophageal cancer [54], breast cancer [55], hepatocellular carcinoma [56], ovarian cancer [57], pancreatic [58], laryngeal squamous cell carcinoma, osteosarcoma, nasopharyngeal carcinoma, and glioblastoma [59,60]. The lncRNA FTX (five prime to XIST) possesses an X-inactive specific transcript and is involved in X-chromosome inactivation [61]. FTX has been reported to act as a tumor promoter in various types of cancer, including osteosarcoma [62], colorectal cancer [63], gliomas [64], lung adenocarcinoma [65], and gastric cancer [66], where it was found to be closely associated with a poor prognosis.

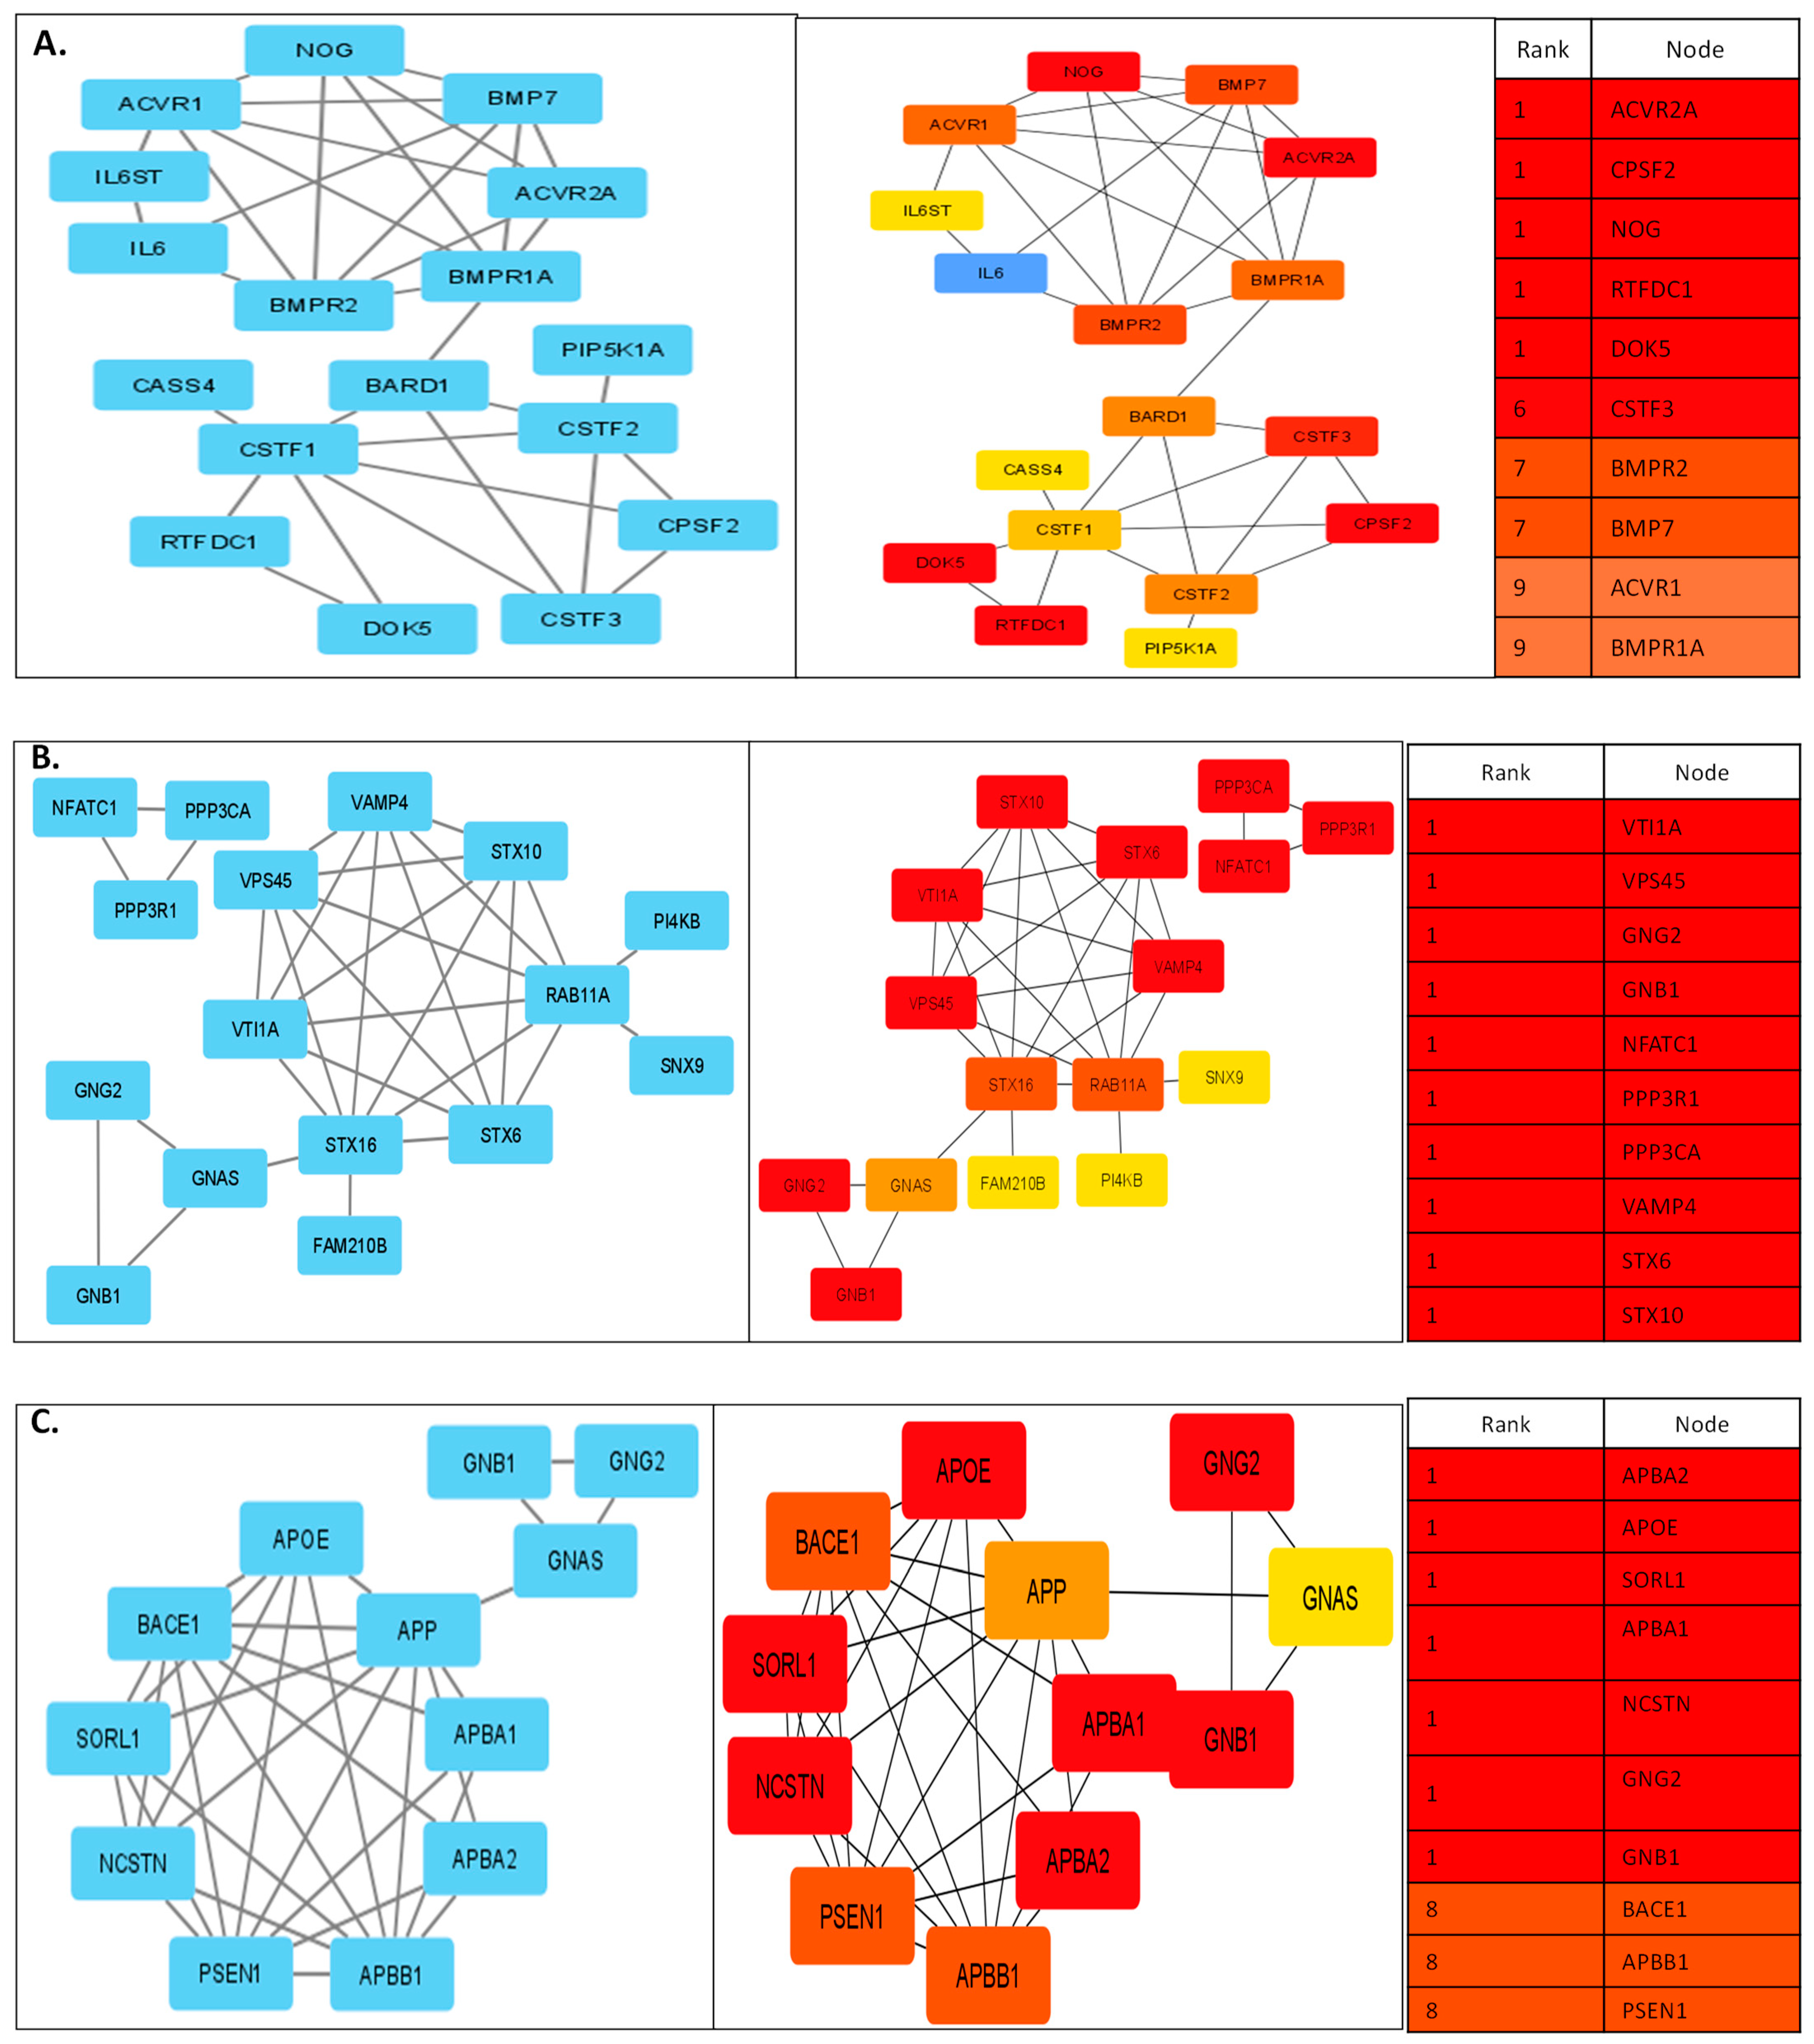
3.2. Protein Interactions Yielded Innate Pathways Responsible for PCa

The significant DEGs were used to build a gene interaction network using GeneMANIA and were later visualized using String and Cytoscape. The network was checked for the top-ranking genes using the expression correlation with a cut-off of 0.95 [67]. From the input genes shown with cross-hatched circles of uniform size, GeneMANIA added relevant genes which are shown with solid circles (hub genes are central), and their size is proportional to the number of interactions they have (Figure 3). In addition, we have identified several interacting partners that are co-expressed such as DZIP1, COL6A2, TAGLN, ZBTB33, LAMP1, LAMP2, IKBKB, and DNAJB11 which act as oncogenes in different cancers such as gastric cancer, renal cell carcinoma, and colorectal cancer, to name a few [68,69,70,71,72,73].
Finally, the network analyzer, Cytoscape-CytoHubba plugin was used to define the network measures, where yellow/orange (lower contrast) means the rank is lower and red/maroon (bigger contrast) indicates the rank is greater. We further evaluated the top network genes for clustering coefficient with the top 20 hub genes in our different malignant samples. Some of the prominent genes we identified through the networks are DOK5, APP, CTNND1, STX6, STX10, STX16, BACE1, and BACE2 (Figure 4A–D); which, agree with the regulation of various cancers based on their co-expression patterns in GeneMANIA.

3.3. Validation of RNA-seq Result Using TCGA Dataset by Cbioportal

We sought to ask whether any DEGs were relatively expressed in publicly available datasets from various studies. To check this, we used TCGA datasets and checked for alteration of frequencies and expression in the cohorts. We used the PanCancer Atlas [74] dataset for Prostate Adenocarcinoma, where 489 samples were screened for their functional roles and molecular aberrations (Figure 5 and Figure 6. Mutations and CNV analysis for some of the DEGs were done and the results are summarized below:
Furthermore, an attempt was made to analyze genomic alterations such as gene amplifications, deep deletions (that are equivalent to homozygous deletions), shallow deletions (heterozygous loss), truncating mutations, in-frame mutations, or missense mutations. Among the DEGs, amplification was the most prominent one in the case of DOK5 and STEAP2; whereas, deep deletions and mutations were observed in COL6A1, STX6, and CTNND1. We argue that similar analysis could check the performance of all the DEGs which will highlight the alteration frequencies across the cohort (Figure 5).

3.4. Gene Ontology Yielded Distinct Pathways Regulating Biogenesis

All the DEGs obtained from our Cuffdiff pipeline were subjected to GO analysis by Pantherdb, which shows the role of DEGs in biological adhesions, biological regulations, biogenesis, cellular, metabolic and developmental processes, localization, locomotion, and multicellular organismal processes (Figure 7 and Figure 8).
For the molecular function category, the terms are binding factors, catalytic, adapter, transducer, and transcription regulator activities which are associated with differential expressed genes. This indicates the role of DEGs in different important processes like transcription, cell migration, differentiation, etc.

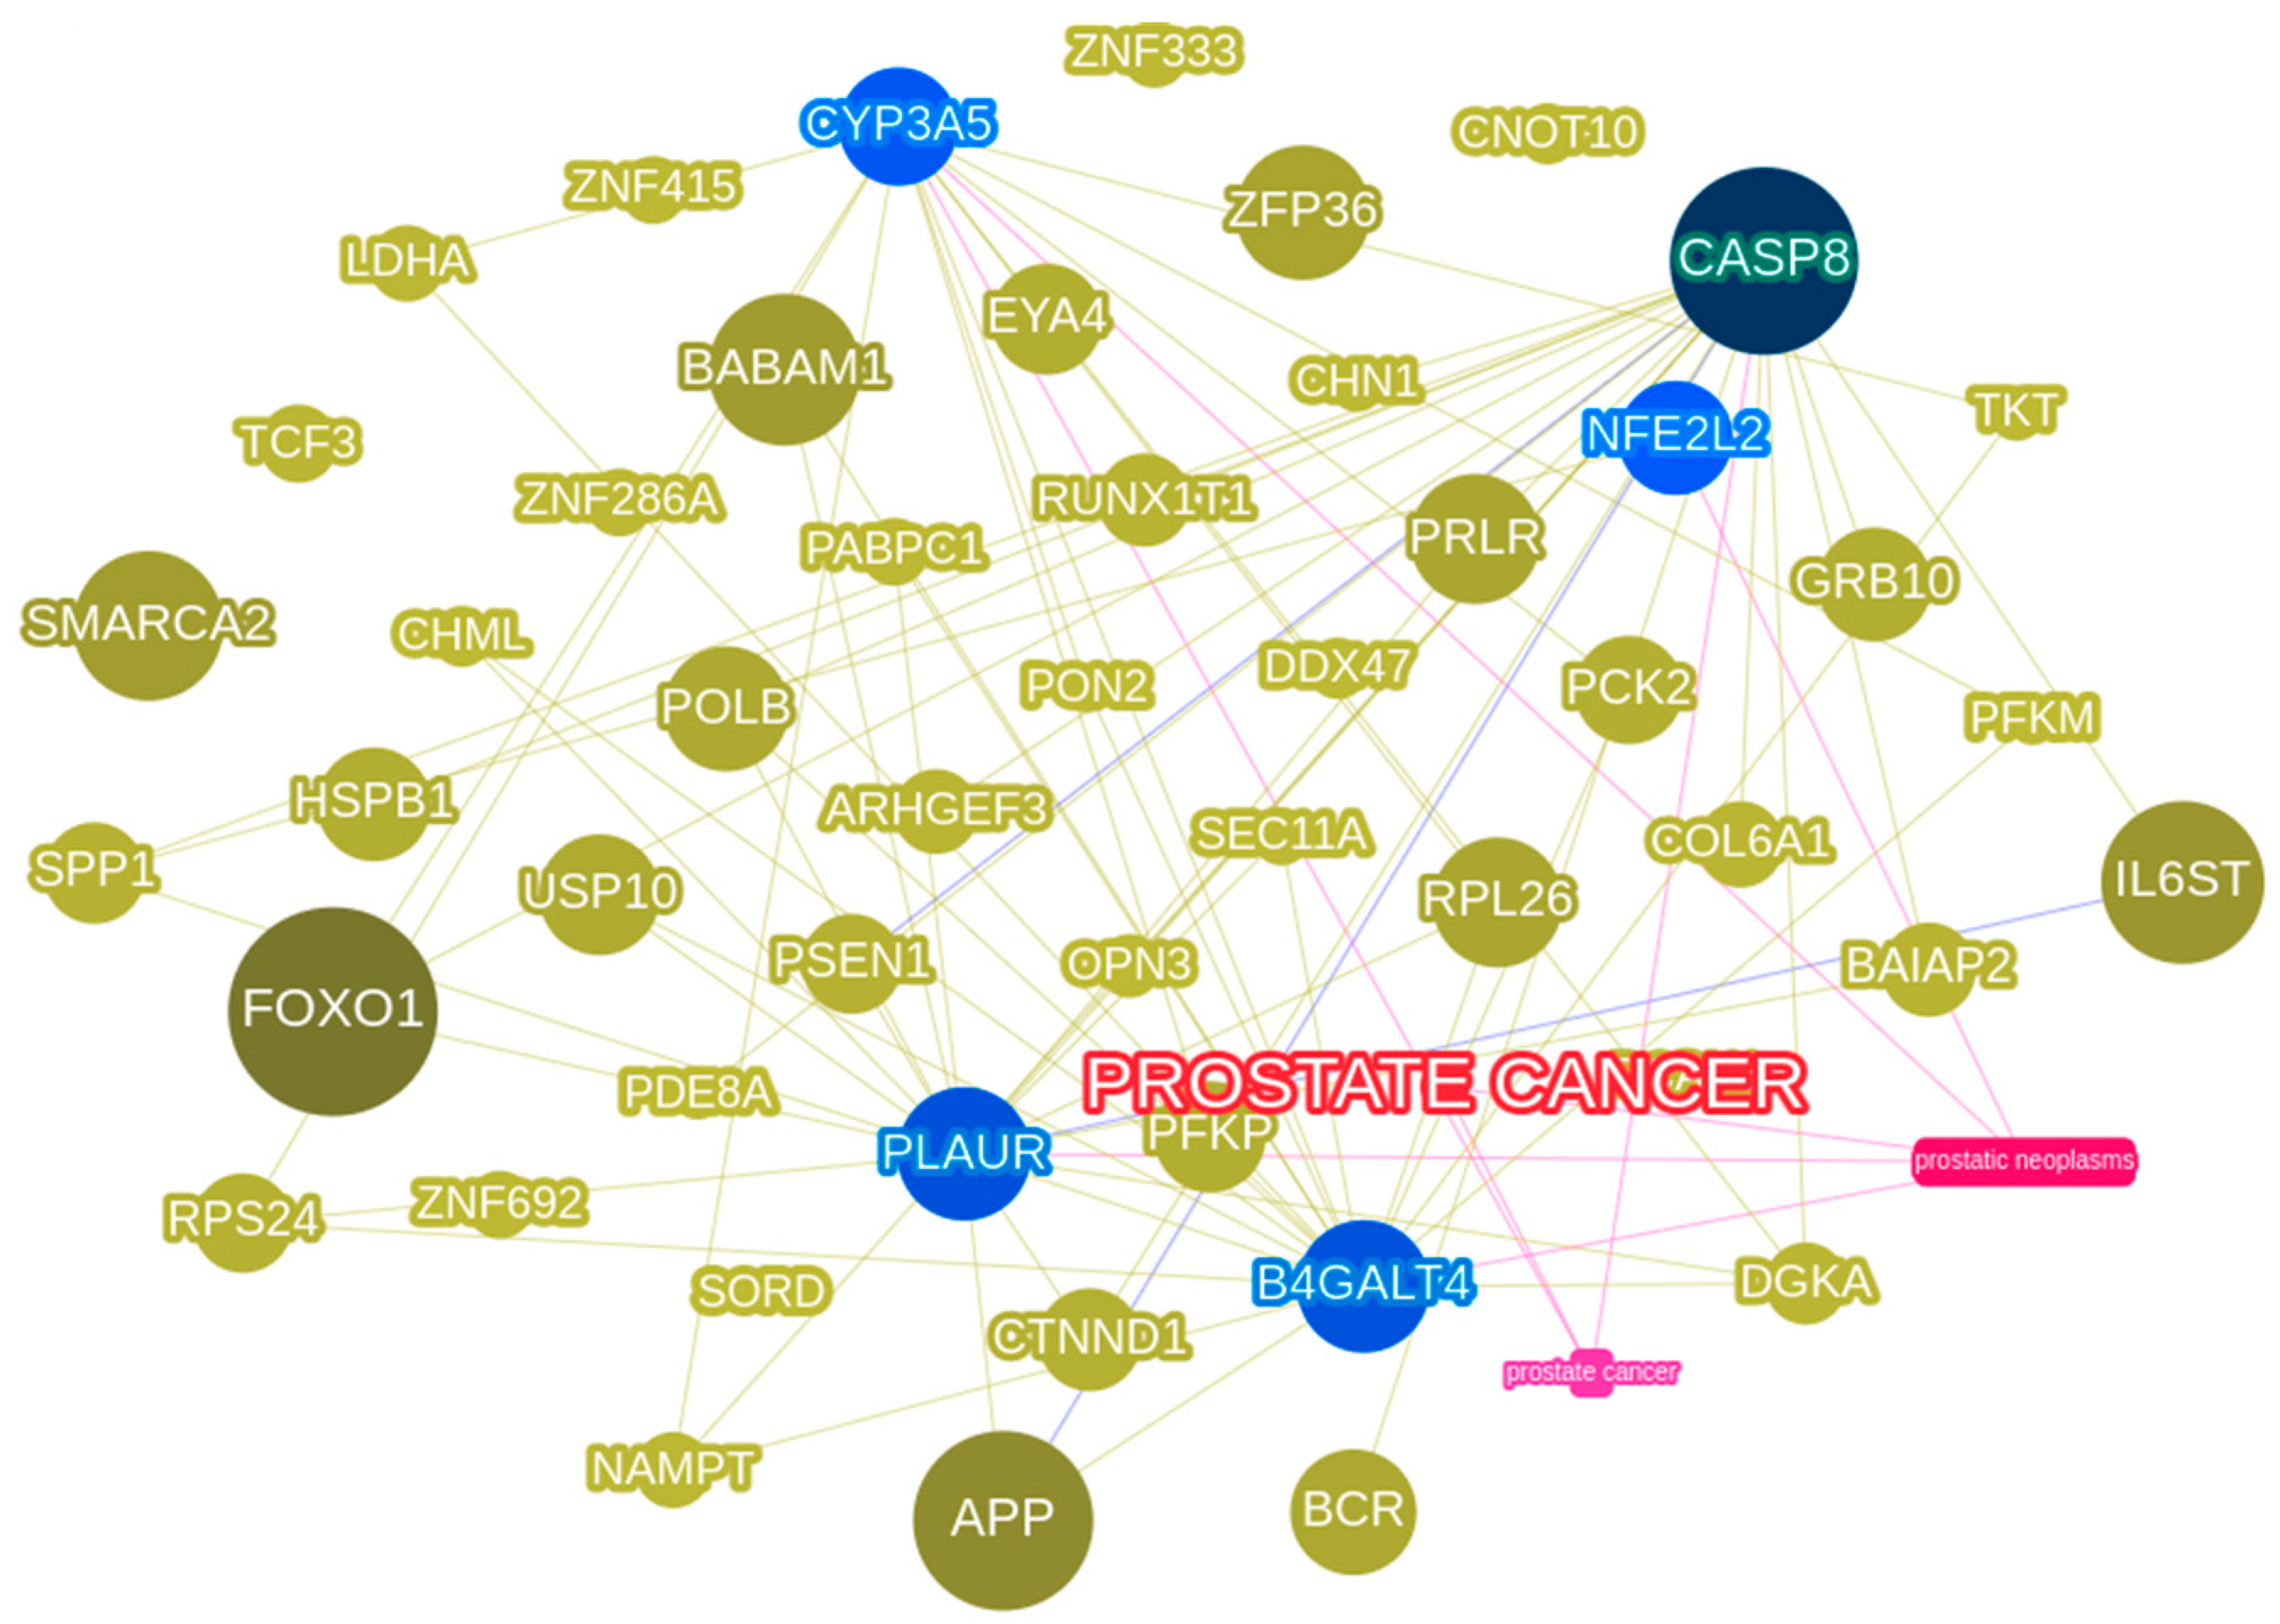
3.5. Phenolyzer Highlights Important DEGs

A cross-sectional comparison of phenotypes and DEGs using phenolyzer (http://phenolyzer.usc.edu last accessed on 7 April 2023; Figure 9) would provide us with indicators for the extent of expression across diseases [75]. Therefore, we asked how many DEGs among all, including the samples, cbioportal, and comparative analyses, are distinctly associated with disease/phenotype terms. Our Phenolyzer results with disease names, viz., Prostate Cancer, PCa neoplasia, which are clinical phenotype terms, have largely related to each other (seen in pink edges in Figure 8). On the other hand, to reach a consensus with the identification of DEGs, we also employed the DESeq/EdgeR normalization method which resulted in the identification of approximately 1230 genes as DEG: 490 were upregulated and 1215 were downregulated. We identified distinct genes including KLK4, FN1, PBOV1, TPM2, and FLNA which are known to be involved in PCa pathways along with IGF1, TPD52, and SRSF1 that are involved in different cancer pathways [76,77,78]. While KLK4 is a very important gene that is known to be involved in the progression of prostate cancer by promoting proliferation, migration, and epithelial to mesenchymal transition, we have checked its expression in our sample by qRT-PCR and we did see a significant change in benign vs. malignant samples. We also found a few novel lncRNAs such as LINC00940 and FLJ16779 that have not been reported earlier besides SNHG19, NPBWR1, and lncRNAs that are known to be involved in cancer and other diseases as well. A further attempt was made to understand the regulatory mechanisms underpinning PCa signature pathways by mapping lncRNAs with protein-encoding genes (Supplementary Table S2).

4. Discussion

In the current study, we have identified many DEGs which are known to be involved in different cancer pathways including PCa. While some of them are specifically known to be associated with PCa, we also discovered a few novel lncRNAs which need further investigation. Expression of COL6A1 is significantly elevated in different tumors such as lung, prostate, cervical, and pancreatic cancer compared to normal tissues. Interestingly, our previous WES studies in PCa have identified COL6A1 as one of the causal genes [9]; whereas we also identified this through our RNA-seq analysis. COL6A1 was shown to be physically interacting with DNAJB11, APP along with some other genes. DNAJB11 is involved in aberrant signaling pathways associated with different cancers. Similarly, APP is known to be associated with androgen-responsive genes and regulates the proliferation and migration of PCa cells [79]. Therefore, we argue that COL6A1 might act as a prognostic marker for PCa in the Indian population. Transcriptional factor Kaiso/ZBTB33 was identified as a CTNND1-specific binding partner and this complex is a modulator of the canonical Wnt/β-catenin signaling pathway [80]. There is a large amount of research focusing on the role of CTNND1 in cancer development and progression; however, in PCa, it is still not well-elucidated [81]. In our study, we have identified CTNND1 and ZBTB33 through interaction studies, but what is more interesting is that we have earlier identified CTNND1 as a co-localization partner with one of the lncRNAs (NONHSAT239888) which is known to be highly expressed in PCa [82]. Furthermore, CTNND1 is one of the main interacting partners of ACE2/TMPRSS2, the main receptors which are responsible for SARS-CoV-2 entry into the cell. We had hypothesized that CTNND1 interacts with EGFR, and this interaction could uphold the SARS-CoV-2 infection independent of its endocytosis and associated with cell viability [83]. The interacting partners of another important gene STEAP2 are KLK3, KLK2, and AR, all of which are hallmarks of PCa. KLK3 is a protein-coding gene, and its protein product, Prostate-specific antigen (PSA), is a well-established biomarker of PCa [84,85]. Similarly, human kallikrein 2 (KLK2), interacts with AR and drives PCa progression [86]. Earlier studies have shown that DOK5 are expressed in T-cells and their expression is regulated upon T-cell activation. DOK5 is shown to be involved in the invasion and metastasis of cancer specifically in gastric cancer, but it has not been well-studied in PCa [49]. Since we got a strong interaction of DOK5 in our clustering coefficient studies using the cytoHubba plugin, we argue that it would be worth analyzing this gene further. Interestingly, through our cytoscape-cytoHubba analysis, we identified many soluble N-ethylmaleimide-sensitive factor (NSF) attachment protein receptor (SNARE) proteins that are key mediators of membrane fusion [87]. All the SNARE proteins share a common sequence of 60–70 residue called the SNARE motifs, which helps in mediating the interaction between vesicle SNAREs (v-SNAREs) and targetting membrane SNAREs (t-SNAREs) [88]. One of the t-SNARE proteins, syntaxin 6 (STX6), is particularly important in vesicle fusion. STX6 is upregulated in a variety of cancers including breast, colon, liver, pancreatic, prostate, bladder, skin, testicular, tongue, cervical, lung, and gastric cancers, and it has been identified as a common transcriptional target of the p53 family members (p53, p63, and p73) [89]. Along with STX6, we have identified STX10, VTI1A, and STX16 which can be further studied. Overall, we also found other important DEGs, viz., BACE1 and BACE2, which belong to a class of proteases called β-secretases that are extensively studied in Alzheimer’s disease [90]. Not many studies have been done with respect to their role in cancer, but there are some recent studies that have shown their involvement in pancreatic and skin cancers [91].

4.1. Comparative Analysis of RNA-seq Data with Other Publicly Available Datasets

To screen the potential DEGs across the datasets, we compared and analyzed the DEGs from our current study to those of the DEGs from cbioportal and methylation/array-specific datasets that are publicly available from NCBI gene expression omnibus (GEO; https://www.ncbi.nlm.nih.gov/geo/ last accessed on 13 April 2023). As no concrete list of RNA-seq datasets was associated in the sequence read archive in lieu of PCa phenotype, we compared our DEGs to GEO datasets, viz., GSE6919 and GSE45016, in addition to the previously benchmarked RNA-seq dataset of PCa in the Chinese population [92]. From this, we obtained only 135 hits in SRA for the RNA-seq of PCa, and most datasets are either from PCa cell lines or RIP-seq; hence, we deemed them not useful keeping in view of diffident phenotypes, experiments, and perhaps correlation studies that they may be heralded with. Nevertheless, we identified a few common genes which could be the key candidate genes in our study, viz., STEAP2, DOK5, Il6ST, LMOD1, CTNND1, etc. Likewise, when our data were compared with GEO datasets, we observed IL6ST, BACE2, SOX2-OT, STEAP2, APP, SNX9, STX16, and CTNND1 among the other genes that are expressed. This, we believe, strengthens our finding that the DEGs which we have mentioned in the current study could be a valid signature for PCa diagnosis. On the other hand, when we compared Prostate Adenocarcinoma (TGCA, PanCancer Atlas) dataset to that of our list of DEGs, we found IL6ST and ZBTB20. These key DEGs are common between the Indian population and the Western population, which can be validated further as it is beyond the scope of this current analysis.

4.2. A Major Chunk of lncRNAs Are Novel and Regulated in Distinct Pathways

LncRNAs do not code for proteins, but they are involved in almost all biological processes such as gene expression, epigenetic regulation, cell cycle regulation, etc., in different cancers, PCa being one of them. Previous studies have highlighted the oncogenic role of lncRNAs in metastasis, proliferation, and development of PCa, but still there are several lncRNAs whose functions are still unknown. With the advancement in NGS, bioinformatics analysis has enabled the identification of many lncRNAs which show dysregulated expression in PCa [93]. Their diverse role has made them a target for all stages of PCa development which includes screening, diagnosis, prognosis, and treatment, further establishing their role as biomarkers in PCa. For example, MALAT-1 (Metastasis associated lung adenocarcinoma transcript 1), a lncRNA, which is used to predict metastasis and survival in non-small cell lung cancer [94], has also been correlated with PCa development and progression [95]. It has also been reported that MALAT-1 expression closely correlates with PSA levels, Gleason scores, and tumor sizes [93]. Similarly, PCAT-18 (prostate-cancer-associated non-coding RNA transcript 18 and SChLAP1 (second chromosome locus associated with prostate-1)) has also been used as a diagnostic and prognostic biomarker in PCa [96,97]. Some of the lncRNAs we identified from our current study include LINC01440, SOX2OT, ENSG00000232855, ENST00000647843.1, and FTX. FTX has been reported to be involved in the tumorigenesis of multiple cancer types. Long intergenic non-protein coding RNA 1440 (LINC01440) is a novel lncRNA that needs to be explored for its role in cancers. A recent study has implicated its role in a spinal disorder known as Ossification of ligamentum flavum (OLF), where it was found to be upregulated in the diseased patients compared to the healthy population [98]. Different studies have shown that SOX2OT acts as an oncogene and is elevated in different tumor types. However, its role and significance are still not explored in PCa, which makes it a very promising candidate for further analysis. Another lncRNA, ENSG00000287903 (NONHSAT106693), was earlier screened in our Vitamin K deficiency cohort from our recent study [99]; wherein, qRT-PCR showed a significant upregulation in malignant samples compared to control samples (supplementary information), which provides us a raison d’être to further validate the remaining lncRNAs as well. Given the role of lncRNAs in PCa, it would be interesting to see if any of these lncRNAs can serve as biomarkers; albeit several downstream experiments and well-designed clinical trials are to be employed. Taken together, there are a few limitations to our study. (i) The qRT-PCR validation needs more tumor and adjacent normal tissue samples as our sample size is very small. (ii) Some additional experiments, such as immunohistochemistry and Western blot, when performed, could confirm the protein levels in PCa. (iii) Given the scarcity of PCa data in India, the survival analysis across the entire transcriptome could not be drawn as it is largely towards the identification of biomarkers indicating the prognostic power, but given the sample size conundrum we have, we are limited in checking this power. Nevertheless, in our previous study, we performed WES on PCa samples, which we have cited, but again, the sample size is limited. (iv) Due to a lack of fresh–frozen prostate/radical prostatectomy tissues, only FFPE blocks were used, and isolating RNA from them is an arduous and challenging task [39]; due to this, we could not perform qRT-PCR for all the selected DEGs.

5. Conclusions

Prostate cancer cases are increasing in India even as NGS studies are just beginning to be explored. In our current RNA-seq study and subsequent bioinformatics analyses, we sought to characterize DEGs including lncRNAs that are specific to PCa of an Indian sub-population. While we identified some of the important genes, viz., DOK5, COL6A1, CTNND1, STEAP2, and APP, their role in PCa is still not clear. We envisage that characterizing their functional aspects would help us understand PCa progression. Since the search for non-invasive and more sensitive biomarkers is on the anvil across all solid tumors, we firmly hope that these lncRNAs amongst the DEGs would serve as a precedent in the development of NGS panels for PCa detection in the Indian phenotype.

Supplementary Materials

The following supporting information can be downloaded at: https://www.mdpi.com/article/10.3390/diseases11020072/s1, Table S1: p values for GO analysis; Table S2: LncPro table for lncRNA-protein interaction; Table S3: List of all DEGs identified after RNA-seq Supplementary Information: qRT-PCR validation of important DEGs, Primer sequences used in the qRT-PCR, and PCR conditions for the experiment.

Author Contributions

N.S. and B.K. contributed equally. All the other authors chipped in with lateral sections. N.S. wrote the first draft. P.S. conceived the project and proofread the manuscript before all the authors agreed to the manuscript. All authors have read and agreed to the published version of the manuscript.

Funding

Nidhi Shukla gratefully acknowledges the Department of Science and Technology (DST), Government of India for women scientist fellowship (SR/WOS-A/LS-404/2018).

Institutional Review Board Statement

This study was authorized by the Office of the Institutional Ethics committee at the Rukmani Birla Hospital, Jaipur, India. Reference number: RBH/IEC/21/008.

Informed Consent Statement

Informed consent was obtained from all subjects involved in the study. Participants in this study were recruited from the Urology department at Rukmani Birla Hospitals, Jaipur, India. All the participants were well-informed about the use of their samples.

Data Availability Statement

The data that support the findings of this study are available at the National Center for Biotechnology Information (NCBI) Sequence Read Archive (SRA) database; accession number-PRJNA616165.

Acknowledgments

NS acknowledges the Department of Science and Technology, GOI, for the Women Scientist fellowship (SR/WOS-A/LS-404/2018) award.

Conflicts of Interest

The authors declare no conflict of interest.

References

  1. Jemal, A.; Bray, F.; Center, M.M.; Ferlay, J.; Ward, E.; Forman, D. Global cancer statistics. CA Cancer J. Clin. 2011, 61, 69–90. [Google Scholar] [CrossRef] [PubMed] [Green Version]
  2. Sim, H.G.; Cheng, C.W.S. Changing demography of prostate cancer in Asia. Eur. J. Cancer 2005, 41, 834–845. [Google Scholar] [CrossRef]
  3. Jain, S.; Saxena, S.; Kumar, A. Epidemiology of prostate cancer in India. Meta Gene 2014, 2, 596–605. [Google Scholar] [CrossRef] [PubMed]
  4. NCRP. Three-Year Report of the Population Based Cancer Registries-2009–2011; National Centre for Disease Informatics and Research (NCDIR); Indian Council of Medical Research ICMR: Bangalore, India, 2013.
  5. Trapnell, C.; Pachter, L.; Salzberg, S.L. TopHat: Discovering splice junctions with RNA-Seq. Bioinformatics 2009, 25, 1105–1111. [Google Scholar] [CrossRef] [PubMed] [Green Version]
  6. Guan, Y.F.; Li, G.R.; Wang, R.J.; Yi, Y.T.; Yang, L.; Jiang, D.; Zhang, X.P.; Peng, Y. Application of next-generation sequencing in clinical oncology to advance personalized treatment of cancer. Chin. J. Cancer 2012, 31, 463. [Google Scholar] [CrossRef] [Green Version]
  7. Gupta, A.; Shukla, N.; Nehra, M.; Gupta, S.; Malik, B.; Mishra, A.K.; Vijay, M.; Batra, J.; Lohiya, N.K.; Sharma, D.; et al. A Pilot Study on the Whole Exome Sequencing of Prostate Cancer in the Indian Phenotype Reveals Distinct Polymorphisms. Front. Genet. 2020, 11, 874. [Google Scholar] [CrossRef]
  8. Stark, R.; Grzelak, M.; Hadfield, J. RNA sequencing: The teenage years. Nat. Rev. Genet. 2019, 20, 631–656. [Google Scholar] [CrossRef]
  9. Marco-Puche, G.; Lois, S.; Benítez, J.; Trivino, J.C. RNA-Seq Perspectives to Improve Clinical Diagnosis. Front. Genet. 2019, 10, 1152. [Google Scholar] [CrossRef] [Green Version]
  10. Stupnikov, A.; McInerney, C.E.; Savage, K.I.; McIntosh, S.A.; Emmert-Streib, F.; Kennedy, R.; Salto-Tellez, M.; Prise, K.M.; McArt, D.G. Robustness of differential gene expression analysis of RNA-seq. Comput. Struct. Biotechnol. J. 2021, 19, 3470–3481. [Google Scholar] [CrossRef]
  11. Kukurba, K.R.; Montgomery, S.B. RNA sequencing and analysis. Cold Spring Harb. Protoc. 2015, 2015, 951–969. [Google Scholar] [CrossRef] [Green Version]
  12. Xi, X.; Li, T.; Huang, Y.; Sun, J.; Zhu, Y.; Yang, Y.; Lu, Z.J. RNA biomarkers: Frontier of precision medicine for cancer. Non-Coding RNA 2017, 3, 9. [Google Scholar] [CrossRef] [PubMed] [Green Version]
  13. Chatterjee, S.K.; Zetter, B.R. Cancer biomarkers: Knowing the present and predicting the future. Future Oncol. 2005, 1, 37–50. [Google Scholar] [CrossRef] [PubMed]
  14. Chen, L.L. The biogenesis and emerging roles of circular RNAs. Nat. Rev. Mol. Cell Biol. 2016, 17, 205–211. [Google Scholar] [CrossRef]
  15. Lopez, J.P.; Diallo, A.; Cruceanu, C.; Fiori, L.M.; Laboissiere, S.; Guillet, I.; Fontaine, J.; Ragoussis, J.; Benes, V.; Turecki, G.; et al. Biomarker discovery: Quantification of microRNAs and other small non-coding RNAs using next generation sequencing. BMC Med. Genom. 2015, 8, 35. [Google Scholar] [CrossRef] [Green Version]
  16. Krishnan, P.; Damaraju, S. The Challenges and Opportunities in the Clinical Application of Noncoding RNAs: The Road Map for miRNAs and piRNAs in Cancer Diagnostics and Prognostics. Int. J. Genom. 2018, 2018, 5848046. [Google Scholar] [CrossRef] [Green Version]
  17. Grixti, J.M.; Ayers, D. Long noncoding RNAs and their link to cancer. Non-Coding RNA Res. 2020, 5, 77–82. [Google Scholar] [CrossRef]
  18. Evans, J.R.; Feng, F.Y.; Chinnaiyan, A.M. The bright side of dark matter: LncRNAs in cancer. J. Clin. Investig. 2016, 126, 2775–2782. [Google Scholar] [CrossRef] [PubMed] [Green Version]
  19. Arun, G.; Diermeier, S.D.; Spector, D.L. Therapeutic Targeting of Long Non-Coding RNAs in Cancer. Trends Mol. Med. 2018, 24, 257–277. [Google Scholar] [CrossRef]
  20. Gao, N.; Li, Y.; Li, J.; Gao, Z.; Yang, Z.; Li, Y.; Liu, H.; Fan, T. Long Non-Coding RNAs: The Regulatory Mechanisms, Research Strategies, and Future Directions in Cancers. Front. Oncol. 2020, 10, 598817. [Google Scholar] [CrossRef]
  21. Winkle, M.; El-Daly, S.M.; Fabbri, M.; Calin, G.A. Noncoding RNA therapeutics—Challenges and potential solutions. Nat. Rev. Drug Discov. 2021, 20, 629–651. [Google Scholar] [CrossRef]
  22. Kumar, P.; Chakraborty, J.; Sukumar, G.; Dalgard, C.; Chatterjee, R.; Biswas, R. Comparative RNA-seq analysis reveals dys-regulation of major canonical pathways in ERG-inducible LNCaP cell progression model of prostate cancer. Oncotarget 2019, 10, 4290–4306. [Google Scholar] [CrossRef] [Green Version]
  23. Tripathi, R.; Sharma, P.; Chakraborty, P.; Varadwaj, P. Count-based transcriptome analysis to identify differentially expressed genes for breast cancer. In Proceedings of the 2016 International Conference on Bioinformatics and Systems Biology (BSB), Allahabad, India, 4–6 March 2016; pp. 1–5. [Google Scholar] [CrossRef]
  24. Kim, S.M.; Rampogu, S.; Vetrivel, P.; Kulkarni, A.M.; Ha, S.E.; Kim, H.H.; Lee, K.W.; Kim, G.S. Transcriptome analysis of sinensetin-treated liver cancer cells guided by biological network analysis. Oncol. Lett. 2021, 21, 355. [Google Scholar] [CrossRef] [PubMed]
  25. Trapnell, C.; Roberts, A.; Goff, L.; Pertea, G.; Kim, D.; Kelley, D.R.; Pimentel, H.; Salzberg, S.L.; Rinn, J.L.; Pachter, L. Differential gene and transcript expression analysis of RNA-seq experiments with TopHat and Cufflinks. Nat. Protoc. 2012, 7, 562–578. [Google Scholar] [CrossRef] [Green Version]
  26. Gupta, A.; Gupta, S.; Jatawa, S.K.; Kumar, A.; Suravajhala, P. A simplest bioinformatics pipeline for whole transcriptome sequencing: Overview of the processing and steps from raw data to downstream analysis. BioRxiv 2019. [Google Scholar] [CrossRef] [Green Version]
  27. Ferragina, P.; Manzini, G. Opportunistic data structures with applications. In Proceedings of the Annual Symposium on Foundations of Computer Science—Proceedings, Redondo Beach, CA, USA, 12–14 November 2000. [Google Scholar]
  28. Trapnell, C.; Hendrickson, D.G.; Sauvageau, M.; Goff, L.; Rinn, J.L.; Pachter, L. Differential analysis of gene regulation at transcript resolution with RNA-seq. Nat. Biotechnol. 2013, 31, 46–53. [Google Scholar] [CrossRef] [PubMed]
  29. Liu, X.; Zhao, J.; Xue, L.; Zhao, T.; Ding, W.; Han, Y.; Ye, H. A comparison of transcriptome analysis methods with reference genome. BMC Genom. 2022, 23, 232. [Google Scholar] [CrossRef]
  30. Mostafavi, S.; Morris, Q. Combining many interaction networks to predict gene function and analyze gene lists. Proteomics 2012, 12, 1687–1696. [Google Scholar] [CrossRef]
  31. Warde-Farley, D.; Donaldson, S.L.; Comes, O.; Zuberi, K.; Badrawi, R.; Chao, P.; Franz, M.; Grouios, C.; Kazi, F.; Lopes, C.T.; et al. The GeneMANIA prediction server: Biological network integration for gene prioritization and predicting gene function. Nucleic Acids Res. 2010, 38, W214–W220. [Google Scholar] [CrossRef] [Green Version]
  32. Szklarczyk, D.; Gable, A.L.; Nastou, K.C.; Lyon, D.; Kirsch, R.; Pyysalo, S.; Doncheva, N.T.; Legeay, M.; Fang, T.; Bork, P.; et al. The STRING database in 2021: Customizable protein-protein networks, and functional characterization of user-uploaded gene/measurement sets. Nucleic Acids Res. 2021, 49, D605–D612. [Google Scholar] [CrossRef] [PubMed]
  33. Shannon, P.; Markiel, A.; Ozier, O.; Baliga, N.S.; Wang, J.T.; Ramage, D.; Amin, N.; Schwikowski, B.; Ideker, T. Cytoscape: A software Environment for integrated models of biomolecular interaction networks. Genome Res. 2003, 13, 2498–2504. [Google Scholar] [CrossRef]
  34. Saito, R.; Smoot, M.E.; Ono, K.; Ruscheinski, J.; Wang, P.L.; Lotia, S.; Pico, A.R.; Bader, G.D.; Ideker, T. A travel guide to Cytoscape plugins. Nat. Methods 2012, 9, 1069–1076. [Google Scholar] [CrossRef] [PubMed] [Green Version]
  35. Chin, C.H.; Chen, S.H.; Wu, H.H.; Ho, C.W.; Ko, M.T.; Lin, C.Y. cytoHubba: Identifying hub objects and sub-networks from complex interactome. BMC Syst. Biol. 2014, 8, S11. [Google Scholar] [CrossRef] [PubMed] [Green Version]
  36. Mi, H.; Muruganujan, A.; Casagrande, J.T.; Thomas, P.D. Large-scale gene function analysis with the panther classification system. Nat. Protoc. 2013, 8, 1551–1566. [Google Scholar] [CrossRef] [PubMed]
  37. Cerami, E.; Gao, J.; Dogrusoz, U.; Gross, B.E.; Sumer, S.O.; Aksoy, B.A.; Jacobsen, A.; Byrne, C.J.; Heuer, M.L.; Larsson, E.; et al. The cBio Cancer Genomics Portal: An open platform for exploring multidimensional cancer genomics data. Cancer Discov. 2012, 2, 401–404. [Google Scholar] [CrossRef] [PubMed] [Green Version]
  38. Liu, J.; Lichtenberg, T.; Hoadley, K.A.; Poisson, L.M.; Lazar, A.J.; Cherniack, A.D.; Kovatich, A.J.; Benz, C.C.; Levine, D.A.; Lee, A.V.; et al. An Integrated TCGA Pan-Cancer Clinical Data Resource to Drive High-Quality Survival Outcome Analytics. Cell 2018, 173, 400–416.e11. [Google Scholar] [CrossRef] [Green Version]
  39. Shukla, N.; Siva, N.; Sivakumar, M.; Parveen, R.; Mishra, A.; Shah, A.; Medicherla, K.; Suravajhala, P. Extraction of DNA and RNA from Formalin-fixed Paraffin-embedded Tissue Specimens. Bio-Protocol 2021, 11, e4095. [Google Scholar] [CrossRef]
  40. Tanaka, T.; Ikari, K.; Furushima, K.; Okada, A.; Tanaka, H.; Furukawa, K.I.; Yoshida, K.; Ikeda, T.; Ikegawa, S.; Hunt, S.C.; et al. Genomewide Linkage and Linkage Disequilibrium Analyses Identify COL6A1, on Chromosome 21, as the Locus for Ossification of the Posterior Longitudinal Ligament of the Spine. Am. J. Hum. Genet. 2003, 73, 812–822. [Google Scholar] [CrossRef] [Green Version]
  41. Zhang, Y.; Liu, Z.; Yang, X.; Lu, W.; Chen, Y.; Lin, Y.; Wang, J.; Lin, S.; Yun, J.P. H3K27 acetylation activated-COL6A1 promotes osteosarcoma lung metastasis by repressing STAT1 and activating pulmonary cancer-associated fibroblasts. Theranostics 2021, 11, 1473–1492. [Google Scholar] [CrossRef]
  42. Owusu-Ansah, K.G.; Song, G.; Chen, R.; Edoo, M.I.A.; Li, J.; Chen, B.; Wu, J.; Zhou, L.; Xie, H.; Jiang, D.; et al. COL6A1 promotes metastasis and predicts poor prognosis in patients with pancreatic cancer. Int. J. Oncol. 2019, 55, 391–404. [Google Scholar] [CrossRef] [Green Version]
  43. Li, N.; Liu, M.; Cao, X.; Li, W.; Li, Y.; Zhao, Z. Identification of differentially expressed genes using microarray analysis and COL6A1 induction of bone metastasis in non-small cell lung cancer. Oncol. Lett. 2021, 22, 12954. [Google Scholar] [CrossRef]
  44. Lin, Z.; Zhu, G.; Tang, D.; Bu, J.; Zou, J. High expression of COL6A1 correlates with poor prognosis in patients with breast cancer. Int. J. Clin. Exp. Med. 2018, 11, 12157–12164. [Google Scholar]
  45. Lu, Q. δ-Catenin dysregulation in cancer: Interactions with E-cadherin and beyond. J. Pathol. 2010, 222, 119–123. [Google Scholar] [CrossRef] [PubMed] [Green Version]
  46. Tang, B.; Tang, F.; Wang, Z.; Qi, G.; Liang, X.; Li, B.; Yuan, S.; Liu, J.; Yu, S.; He, S. Overexpression of CTNND1 in hepatocellular carcinoma promotes carcinous characters through activation of Wnt/β-catenin signaling. J. Exp. Clin. Cancer Res. 2016, 35, 82. [Google Scholar] [CrossRef] [Green Version]
  47. Liao, X.H.; Zhang, Y.; Dong, W.J.; Shao, Z.M.; Li, D.Q. Chromatin remodeling protein MORC2 promotes breast cancer invasion and metastasis through a PRD domain-mediated interaction with CTNND1. Oncotarget 2017, 8, 97941–97954. [Google Scholar] [CrossRef] [PubMed] [Green Version]
  48. Burnell, S.E.A.; Spencer-Harty, S.; Howarth, S.; Bodger, O.; Kynaston, H.; Morgan, C.; Doak, S.H. STEAP2 Knockdown Reduces the Invasive Potential of Prostate Cancer Cells. Sci. Rep. 2018, 8, 6252. [Google Scholar] [CrossRef] [PubMed] [Green Version]
  49. Grimm, J.; Sachs, M.; Britsch, S.; Di Cesare, S.; Schwarz-Romond, T.; Alitalo, K.; Birchmeier, W. Novel p62dok family members, dok-4 and dok-5, are substrates of the c-Ret receptor tyrosine kinase and mediate neuronal differentiation. J. Cell Biol. 2001, 154, 345–354. [Google Scholar] [CrossRef] [PubMed] [Green Version]
  50. Luo, F.; Wang, Z.; Chen, S.; Luo, Z.; Wang, G.; Yang, H.; Tang, L. DOK5 as a Prognostic Biomarker of Gastric Cancer Immunoinvasion: A Bioinformatics Analysis. Biomed. Res. Int. 2022, 2022, 9914778. [Google Scholar] [CrossRef]
  51. Amaral, P.P.; Neyt, C.; Wilkins, S.J.; Askarian-Amiri, M.E.; Sunkin, S.M.; Perkins, A.C.; Mattick, J.S. Complex architecture and regulated expression of the Sox2ot locus during vertebrate development. RNA 2009, 15, 2013–2027. [Google Scholar] [CrossRef] [Green Version]
  52. Hou, Z.; Zhao, W.; Zhou, J.; Shen, L.; Zhan, P.; Xu, C.; Chang, C.; Bi, H.; Zou, J.; Yao, X.; et al. A long noncoding RNA Sox2ot regulates lung cancer cell proliferation and is a prognostic indicator of poor survival. Int. J. Biochem. Cell Biol. 2014, 53, 380–388. [Google Scholar] [CrossRef]
  53. Qu, F.; Cao, P. Long noncoding RNA SOX2OT contributes to gastric cancer progression by sponging miR-194-5p from AKT2. Exp. Cell Res. 2018, 369, 187–196. [Google Scholar] [CrossRef]
  54. Shahryari, A.; Rafiee, M.R.; Fouani, Y.; Oliae, N.A.; Samaei, N.M.; Shafiee, M.; Semnani, S.; Vasei, M.; Mowla, S.J. Two novel splice variants of SOX2OT, SOX2OT-S1, and SOX2OT-S2 are coupregulated with SOX2 and OCT4 in esophageal squamous cell carcinoma. Stem Cells 2014, 32, 126–134. [Google Scholar] [CrossRef]
  55. Askarian-Amiri, M.E.; Seyfoddin, V.; Smart, C.E.; Wang, J.; Kim, J.E.; Hansji, H.; Baguley, B.C.; Finlay, G.J.; Leung, E.Y. Emerging role of long non-coding RNA SOX2OT in SOX2 regulation in breast cancer. PLoS ONE 2014, 9, e102140. [Google Scholar] [CrossRef]
  56. Sun, J.; Wei, X.; Xu, L. Upregulation of lncRna Sox2ot indicates a poor prognosis for patients with hepatocellular carcinoma and promotes cell invasion. Oncol. Lett. 2018, 16, 1189–1195. [Google Scholar] [CrossRef] [PubMed]
  57. Han, L.; Zhang, W.; Zhang, B.; Zhan, L. Long non-coding RNA SOX2OT promotes cell proliferation and motility in human ovarian cancer. Exp. Ther. Med. 2018, 15, 2182–2188. [Google Scholar] [CrossRef] [PubMed]
  58. Wang, Y.; Zhang, X.F.; Wang, D.Y.; Zhu, Y.; Chen, L.; Zhang, J.J. Long noncoding RNA SOX2OT promotes pancreatic cancer cell migration and invasion through destabilizing FUS protein via ubiquitination. Cell Death Discov. 2021, 7, 261. [Google Scholar] [CrossRef]
  59. Wang, Y.; Wu, N.; Luo, X.; Zhang, X.; Liao, Q.; Wang, J. SOX2OT, a novel tumor-related long non-coding RNA. Biomed. Pharmacother. 2020, 123, 109725. [Google Scholar] [CrossRef]
  60. Liu, B.; Zhou, J.; Wang, C.; Chi, Y.; Wei, Q.; Fu, Z.; Lian, C.; Huang, Q.; Liao, C.; Yang, Z.; et al. LncRNA SOX2OT promotes temozolomide resistance by elevating SOX2 expression via ALKBH5-mediated epigenetic regulation in glioblastoma. Cell Death Dis. 2020, 11, 384. [Google Scholar] [CrossRef]
  61. Li, S.; Zhang, Q.; Liu, W.; Zhao, C. Silencing of FTX suppresses pancreatic cancer cell proliferation and invasion by upregulating miR-513b-5p. BMC Cancer 2021, 21, 290. [Google Scholar] [CrossRef]
  62. Chen, H.; Liu, T.; Ouyang, H.; Lin, S.; Zhong, H.; Zhang, H.; Yang, Y. Upregulation of ftx promotes osteosarcoma tumorigenesis by increasing sox4 expression via mir-214-5p. Onco. Targets. Ther. 2020, 2020, 7125–7136. [Google Scholar] [CrossRef]
  63. Guo, X.B.; Hua, Z.; Li, C.; Peng, L.P.; Wang, J.S.; Wang, B.; Zhi, Q.M. Biological significance of long non-coding RNA FTX expression in human colorectal cancer. Int. J. Clin. Exp. Med. 2015, 8, 15591–15600. [Google Scholar]
  64. Chen, W.; Li, Y.; Guo, L.; Zhang, C.; Tang, S. Long non-coding RNA FTX predicts a poor prognosis of human cancers: A meta-analysis. Biosci. Rep. 2021, 41, BSR20203995. [Google Scholar] [CrossRef]
  65. Huo, X.; Wang, H.; Huo, B.; Wang, L.; Yang, K.; Wang, J.; Wang, L.; Wang, H. FTX contributes to cell proliferation and migration in lung adenocarcinoma via targeting miR-335-5p/NUCB2 axis. Cancer Cell Int. 2020, 20, 89. [Google Scholar] [CrossRef]
  66. Zhang, F.; Wang, X.S.; Tang, B.; Li, P.A.; Wen, Y.; Yu, P.W. Long non-coding RNA FTX promotes gastric cancer progression by targeting miR-215. Eur. Rev. Med. Pharmacol. Sci. 2020, 24, 3037–3048. [Google Scholar] [CrossRef]
  67. Azuaje, F.J. Selecting biologically informative genes in co-expression networks with a centrality score. Biol. Direct 2014, 9, 12. [Google Scholar] [CrossRef] [PubMed] [Green Version]
  68. Liu, Y.J.; Li, J.P.; Zeng, S.H.; Han, M.; Liu, S.L.; Zou, X. DZIP1 expression as a prognostic marker in gastric cancer: A bioinformatics-based analysis. Pharmgenom. Pers. Med. 2021, 2021, 1151–1168. [Google Scholar] [CrossRef] [PubMed]
  69. Piao, X.M.; Hwang, B.; Jeong, P.; Byun, Y.J.; Kang, H.W.; Seo, S.P.; Kim, W.T.; Lee, J.Y.; Ha, Y.S.; Lee, Y.S.; et al. Collagen type VIα1 and 2 repress the proliferation, migration and invasion of bladder cancer cells. Int. J. Oncol. 2021, 59, 37. [Google Scholar] [CrossRef] [PubMed]
  70. Singhal, S.K.; Sens, D.; Sens, M.A.; Byun, J.; Yancey, R.; Caban, A.; Boisvert, H.; Hennek, S.; Bobrow, M.; Ahmed, S.; et al. Subcellular partitioning of Kaiso (ZBTB33) as a biomarker to predict overall breast cancer survival. J. Clin. Oncol. 2020, 38, 3534. [Google Scholar] [CrossRef]
  71. Wang, Q.; Yao, J.; Jin, Q.; Wang, X.; Zhu, H.; Huang, F.; Wang, W.; Qiang, J.; Ni, Q. LAMP1 expression is associated withpoor prognosis in breast cancer. Oncol. Lett. 2017, 14, 4729–4735. [Google Scholar] [CrossRef] [Green Version]
  72. Alessandrini, F.; Pezzè, L.; Ciribilli, Y. LAMPs: Shedding light on cancer biology. Semin. Oncol. 2017, 44, 239–253. [Google Scholar] [CrossRef]
  73. Sun, R.; Yang, L.; Wang, Y.; Zhang, Y.; Ke, J.; Zhao, D. DNAJB11 predicts a poor prognosis and is associated with immune infiltration in thyroid carcinoma: A bioinformatics analysis. J. Int. Med. Res. 2021, 49. [Google Scholar] [CrossRef]
  74. Assenov, Y.; Ramírez, F.; Schelhorn, S.E.S.E.; Lengauer, T.; Albrecht, M. Computing topological parameters of biological networks. Bioinformatics 2008, 24, 282–284. [Google Scholar] [CrossRef] [PubMed] [Green Version]
  75. Yang, H.; Robinson, P.N.; Wang, K. Phenolyzer: Phenotype-based prioritization of candidate genes for human diseases. Nat. Methods 2015, 12, 841–843. [Google Scholar] [CrossRef] [PubMed]
  76. Klokk, T.I.; Kilander, A.; Xi, Z.; Wæhre, H.; Risberg, B.; Danielsen, H.E.; Saatcioglu, F. Kallikrein 4 is a proliferative factor that is overexpressed in prostate cancer. Cancer Res. 2007, 67, 5221–5230. [Google Scholar] [CrossRef] [PubMed] [Green Version]
  77. Carleton, N.M.; Zhu, G.; Gorbounov, M.; Miller, M.C.; Pienta, K.J.; Resar, L.M.S.; Veltri, R.W. PBOV1 as a potential biomarker for more advanced prostate cancer based on protein and digital histomorphometric analysis. Prostate 2018, 78, 547–559. [Google Scholar] [CrossRef] [PubMed]
  78. Du, J.X.; Luo, Y.H.; Zhang, S.J.; Wang, B.; Chen, C.; Zhu, G.Q.; Zhu, P.; Cai, C.Z.; Wan, J.L.; Cai, J.L.; et al. Splicing factor SRSF1 promotes breast cancer progression via oncogenic splice switching of PTPMT1. J. Exp. Clin. Cancer Res. 2021, 40, 171. [Google Scholar] [CrossRef]
  79. Pandey, P.; Sliker, B.; Peters, H.L.; Tuli, A.; Herskovitz, J.; Smits, K.; Purohit, A.; Singh, R.K.; Dong, J.; Batra, S.K.; et al. Amyloid precursor protein and amyloid precursor-like protein 2 in cancer. Oncotarget 2016, 7, 19430–19444. [Google Scholar] [CrossRef] [PubMed] [Green Version]
  80. Kantidze, O.L.; Kamalyukova, I.M.; Razin, S.V. Association of the mammalian transcriptional regulator kaiso with centrosomes and the midbody. Cell Cycle 2009, 8, 2303–2304. [Google Scholar] [CrossRef] [PubMed]
  81. Schackmann, R.C.J.; Tenhagen, M.; van de Ven, R.A.H.; Derksen, P.W.B. P120-catenin in cancer—Mechanisms, models and opportunities for intervention. J. Cell Sci. 2013, 126, 3515–3525. [Google Scholar] [CrossRef] [Green Version]
  82. Singh, K.K.; Chaubey, G.; Chen, J.Y.; Suravajhala, P. Decoding SARS-CoV-2 hijacking of host mitochondria in COVID-19 pathogenesis. Am. J. Physiol.-Cell Physiol. 2020, 319, C258–C267. [Google Scholar] [CrossRef] [PubMed]
  83. Shukla, N.; Prasad, A.; Kanga, U.; Suravajhala, R.; Nigam, V.K.; Kishor, P.B.K.; Polavarapu, R.; Chaubey, G.; Singh, K.K.; Suravajhala, P. SARS-CoV-2 transgressing LncRNAs uncovers the known unknowns. Physiol. Genom. 2021, 53, 433–440. [Google Scholar] [CrossRef]
  84. Stamey, T.A.; Yang, N.; Hay, A.R.; McNeal, J.E.; Freiha, F.S.; Redwine, E. Prostate-Specific Antigen as a Serum Marker for Adenocarcinoma of the Prostate. N. Engl. J. Med. 1987, 317, 909–916. [Google Scholar] [CrossRef] [PubMed]
  85. Ahn, J.; Berndt, S.I.; Wacholder, S.; Kraft, P.; Kibel, A.S.; Yeager, M.; Albanes, D.; Giovannucci, E.; Stampfer, M.J.; Virtamo, J.; et al. Variation in KLK genes, prostate-specific antigen and risk of prostate cancer. Nat. Genet. 2008, 40, 1032–1034. [Google Scholar] [CrossRef] [PubMed] [Green Version]
  86. Shang, Z.; Niu, Y.; Cai, Q.; Chen, J.; Tian, J.; Yeh, S.; Lai, K.P.; Chang, C. Human kallikrein 2 (KLK2) promotes prostate cancer cell growth via function as a modulator to promote the ARA70-enhanced androgen receptor transactivation. Tumor Biol. 2014, 35, 1881–1890. [Google Scholar] [CrossRef] [PubMed]
  87. Meng, J.; Wang, J. Role of SNARE proteins in tumourigenesis and their potential as targets for novel anti-cancer therapeutics. Biochim. Biophys. Acta-Rev. Cancer 2015, 1856, 1–12. [Google Scholar] [CrossRef]
  88. Han, J.; Pluhackova, K.; Böckmann, R.A. The multifaceted role of SNARE proteins in membrane fusion. Front. Physiol. 2017, 8, 5. [Google Scholar] [CrossRef] [Green Version]
  89. Riggs, K.A.; Hasan, N.; Humphrey, D.; Raleigh, C.; Nevitt, C.; Corbin, D.; Hu, C. Regulation of integrin endocytic recycling and chemotactic cell migration by syntaxin 6 and VAMP3 interaction. J. Cell Sci. 2012, 125, 3827–3839. [Google Scholar] [CrossRef] [Green Version]
  90. Yan, R. Physiological functions of the β-site amyloid precursor protein cleaving enzyme 1 and 2. Front. Mol. Neurosci. 2017, 10, 97. [Google Scholar]
  91. Farris, F.; Matafora, V.; Bachi, A. The emerging role of β-secretases in cancer. J. Exp. Clin. Cancer Res. 2021, 40, 147. [Google Scholar] [CrossRef]
  92. Ren, S.; Peng, Z.; Mao, J.H.; Yu, Y.; Yin, C.; Gao, X.; Cui, Z.; Zhang, J.; Yi, K.; Xu, W.; et al. RNA-seq analysis of prostate cancer in the Chinese population identifies recurrent gene fusions, cancer-associated long noncoding RNAs and aberrant alternative splicings. Cell Res. 2012, 22, 806–821. [Google Scholar] [CrossRef]
  93. Guo, H.; Ahmed, M.; Zhang, F.; Yao, C.Q.; Li, S.; Liang, Y.; Hua, J.; Soares, F.; Sun, Y.; Langstein, J.; et al. Modulation of long noncoding RNAs by risk SNPs underlying genetic predispositions to prostate cancer. Nat. Genet. 2016, 48, 1142–1150. [Google Scholar] [CrossRef]
  94. Ji, P.; Diederichs, S.; Wang, W.; Böing, S.; Metzger, R.; Schneider, P.M.; Tidow, N.; Brandt, B.; Buerger, H.; Bulk, E.; et al. MALAT-1, a novel noncoding RNA, and thymosin β4 predict metastasis and survival in early-stage non-small cell lung cancer. Oncogene 2003, 22, 8031–8041. [Google Scholar] [CrossRef] [Green Version]
  95. Ren, S.; Liu, Y.; Xu, W.; Sun, Y.; Lu, J.; Wang, F.; Wei, M.; Shen, J.; Hou, J.; Gao, X.; et al. Long noncoding RNA MALAT-1 is a new potential therapeutic target for castration resistant prostate cancer. J. Urol. 2013, 190, 2278–2287. [Google Scholar] [CrossRef] [PubMed]
  96. Crea, F.; Watahiki, A.; Quagliata, L.; Xue, H.; Pikor, L.; Parolia, A.; Wang, Y.; Lin, D.; Lam, W.L.; Farrar, W.L.; et al. Identification of a long non-coding RNA as a novel biomarker and potential therapeutic target for metastatic prostate cancer. Oncotarget 2014, 5, 764–774. [Google Scholar] [CrossRef] [PubMed] [Green Version]
  97. Prensner, J.R.; Zhao, S.; Erho, N.; Schipper, M.; Iyer, M.K.; Dhanasekaran, S.M.; Magi-Galluzzi, C.; Mehra, R.; Sahu, A.; Siddiqui, J.; et al. RNA biomarkers associated with metastatic progression in prostate cancer: A multi-institutional high-throughput analysis of SChLAP1. Lancet Oncol. 2014, 15, 1469–1480. [Google Scholar] [CrossRef] [Green Version]
  98. Kong, D.; Zhao, Q.; Liu, W.; Wang, F. Identification of crucial miRNAs and IncRNAs for ossification of ligamentum flavum. Mol. Med. Rep. 2019, 20, 1683–1699. [Google Scholar] [CrossRef] [PubMed] [Green Version]
  99. Rajagopal, S.; Sharma, A.; Simlot, A.; Mathur, P.; Mehta, S.; Mehta, S.; Naravula, J.; Medicherla, K.M.; Kumar, A.; Kanga, U.; et al. Inferring bona fide Differentially Expressed Genes and Their Variants Associated with Vitamin K Deficiency Using a Systems Genetics Approach. Genes 2022, 13, 2078. [Google Scholar] [CrossRef]
Figure 1. The incidence and mortality rates for the top 10 most common cancers of 2020 (adapted from Globocan 2020).
Diseases 11 00072 g001
Figure 2. Pictorial representation of the RNA-seq workflow depicting different steps of analysis. The input consists of FASTQ files of the sample (control and malignant), human reference genome sequence file (hg38), and gene annotations from gtf files.
Diseases 11 00072 g002
Figure 3. Protein—protein interaction of different samples using GeneMANIA with purple edges representing co-expression; green—genetic interaction; red—physical interaction; and blue representing co-localization. ((ad) represents different sample pairs (with #1374 as a control) from which DEGs were inferred, viz., 69/19, 1631/H19, 4226/H19, 5110/H20, respectively, and the circles with edges are the input genes whereas solid circles are the interacting partners).
Diseases 11 00072 g003
Figure 4. A compendium of the top 20 genes from the PPI network that are regulated and expressed in malignant samples was considered using the Cytoscape-CytoHubba plugin. The network was ranked based on clustering coefficients which yielded hierarchically high confidence interactions. These genes with the highest clustering coefficients are indicated in red, while high to moderate clustering coefficients are in orange and those with low clustering coefficients are shown in yellow. Some of the important genes we identified through all 4 networks ((AD) represents 4 different sample pairs from which DEGs were analyzed) are DOK5, APP, CTNND1, STX6, STX10, STX16, BACE1, and BACE2, which are amongst the top-ranking genes in the network. It is imperative that some genes are ranked based on the clusters they make.
Diseases 11 00072 g004aDiseases 11 00072 g004b
Figure 5. Graphical summary of corresponding genes with mutation types. We employed the cBioportal and analyzed different mutation types in genes; (A) COL6A1, (B) DOK5, (C) STEAP2, (D) STX6, and (E) CTNND1 related to PCa by comparing with integrated genomic data of different alterations available in it. Different color codes depict different mutation types. Here, green shows missense mutations of unknown significance, grey for truncating mutations, and red for in-frame putative mutations.
Diseases 11 00072 g005
Figure 6. Graphical representation of gene expression and alteration frequency. (A) COL6A1, (B) DOK5, (C) STEAP2, (D) STX6, and (E) CTNND1 were queried using an available gene expression database of Prostate adenocarcinoma cancer type in the cBioportal tool where the different colors green, red, blue, and grey code mutations, amplifications, deep deletion, and other multiple alterations, respectively. The queried gene is altered either in 1% or less than 1% of queried patients/samples (total number of samples—489).
Diseases 11 00072 g006
Figure 7. Gene Ontology analysis using Pantherdb. We used GO database for upregulated DEGS from our study, with the genes clustered based on biological functions (BP) and Molecular functions (MP). Important pathways associated with them are listed below corresponding to different colors.
Diseases 11 00072 g007
Figure 8. Gene Ontology analysis using Pantherdb. We used GO database for downregulated DEGS from our study with the genes clustered based on biological functions (BP) and Molecular functions (MP). Important pathways associated with them are listed below corresponding to different colors.
Diseases 11 00072 g008
Figure 9. Phenolyzer hub of DEGs associated with distinct clinical terms, viz., PCa and PCa neoplasia.
Diseases 11 00072 g009
Table 1. Samples used for the WTSS along with their Gleason scores constituted two high-grade tumor samples with two intermediate samples, while 2 others with less than 6 from benign cases.
Sample IDConditionGleason Score (Primary + Secondary)
69/19Adenocarcinoma3 + 4
1631/H19Adenocarcinoma4 + 4
4226/H19Adenocarcinoma3 + 4
5110/H20Adenocarcinoma4 + 4
1374/19Benign Nodular Prostatic Hyperplasia<6
1266/19Benign Nodular Prostatic Hyperplasia<6
Table 2. The criteria used for inclusion and exclusion of the test subjects.
Inclusion CriteriaExclusion Criteria
Malignant (PCa)Age > 55 years
PSA > 4 ng/mL
Gleason score > 6
Non-diabetic or any other co-morbidity
Smoking
Familial history of BPH
Normal (BPH)Age > 55 years
PSA < 4 ng/mL
Gleason score < 6
Those with Associated diseases/phenotypes or any urological diseases.
Table 3. List of DEGs obtained with the designated cut-off after Cufflinks-Cuffdiff analyses. Some of the identified DEGs were PCa-specific such as APP, STEAP2, PABPC1, RPS24, etc.
Gene IdLocuslog2 Foldp-ValueGene Name
CUFF.1000chr1:12314982–123154013.14200.0254VPS13D
CUFF.100001chr20:53952153–539523692.90340.0366BCAS1
CUFF.10004chr1:151206377–1512066384.65430.02435PIP5K1A
CUFF.100042chr20:54490801–544909818.87440.0245DOK5
CUFF.100060chr20:55553908–555540847.17750.0213LINC01440
CUFF.134059chr5:55937823–559381534.64640.0334IL6ST
CUFF.100106chr20:57168914–571691002.84680.02305BMP7
CUFF.100077chr20:56403670–564038262.78960.011CSTF1
CUFF.100080chr20:56412720–564128943.23450.02435CASS4
CUFF.100086chr20:56487111–564872973.12690.02305RTF2
CUFF.102595chr21:41275383–412759473.41490.0307BACE2
CUFF.109200chr3:43335859–433363903.41730.0307SNRK
CUFF.109337chr3:44926095–449268124.01900.02435ZDHHC3
CUFF.119448chr3:181441034–1814413583.35630.0131SOX2OT
CUFF.126886chr4:101280781–1012812513.05880.0234PPP3CA
CUFF.131979chr5:13991457–139917533.18470.04515DNAH5
CUFF.13343chr1:201898030–2018983944.0541580.02435LMOD1
CUFF.141632chr5:173034434–1730348324.0946790.02855ATP6VOE1
CUFF.151326chr6:157942571–1579433994.2549920.004SNX9
CUFF.157342chr7:90232992–902352543.2480.03545STEAP2
CUFF.100128chr20:57648598–576491554.1196270.00535PMEPA1
CUFF.10017chr1:151326615–1513271933.30820.0272PI4KB
CUFF.100074chr20:56367973–563685884.46360.0028FAM21OB
CUFF.100241chr20:58895335–588955912.72060.0227GNAS
CUFF.100175chr20:58033916–580342025.0590.04605STX16
CUFF.100056chr20:55074569–550747682.7430.00795RPL12P4
CUFF.100291chr20:59967544–599681643.4150.04675CADHERIN 26
CUFF.100698chr21:14084939–140851283.1239190.0416 ENSG00000224905
CUFF.10107chr1:152032497–1520328394.32150.0145 ENSG00000229021
CUFF.101153chr21:18857730–188584452.80430.04035PPIAP22
CUFF.101277chr21:25880415–258817775.63210.03945APP
CUFF.101659chr21:28672882–286732913.30340.00035 ENSG00000232855
CUFF.101853chr21:31210389–312108383.21570.0433TIAM1
CUFF.102028chr21:33551193–335531465.48860.02575SON
CUFF.102981chr21:46003384–460050447.46520.0004COL6A1
CUFF.115488chr3:126861928–1268652633. 99280.04385CHCM1/CHCHD6
CUFF.101498chr8:100713839–1007142043.232090.03765PABPC1
CUFF.110085chrX:74232840–742331823.239190.03765FTX
CUFF.103580chr9:14087901–140881943.428880.04005NFIB
CUFF.2892chr1:52416916–524175413.139210.0423TUT4
CUFF.41953chr17:48060789–480611024.189460.04285NFE2L2
CUFF.36847chr16:1699878–17001923.073520.044HN1L/JPT2
CUFF.22947chr12:52949238–529503833.045390.04445KRT18
CUFF.15787chr11:6483526–64839703.316990.04535TIMM10b
CUFF.3812chr1:70224556–702249993.317130.04535SRSF11
CUFF.20358chr11:123057501–1230612804.934010.0459HSPA8
CUFF.30773chr14:58259607–582602342.969180.046PSMA3
CUFF.39071chr16:71729367–717299162.974060.046AP1G1
CUFF.14995chr10:118005601–1180062153.176330.049RAB11FIP2
CUFF.17593chr11:61130859–611311972.906190.0491VPS37C
CUFF.11546chr10:34656519–346568113.12450.00075PARD3
CUFF.31039chr14:63395971–633962752.83750.00075PPP2R5E
CUFF.110851chrX:111699308–1116996573.87640.00085ALG3
CUFF.25323chr12:111257228–1112578303.86540.00095CUX2
CUFF.107185chr9:127397206–1273974653.25640.00105SLC2A8
CUFF.107177chr9:127325581–1273259694.34650.0007GARNL3
CUFF.17462chr11:57782675–577829474.934010.0003CTNND1
CUFF.13238chr10:78033882–780406776.186170.0252RPS24
CUFF.100491chr8:71098236–710984517.94620.00075ENST00000647843.1
CUFF.55161chr15:44826300–448268765.032780.0428ENST00000558419.1
CUFF.10014chr1:151287575–1512879793.98670.01955ZNF687
CUFF.100478chr20:63890280–638905384.89680.0235TPD52L2
CUFF.100559chr21:6986631–69872862.96450.0209ENST00000623165.3
CUFF.103593chr22:22900959–229014404.65790.01695IGLC2
CUFF.100039chr8:60846260–608465063.89650.03515CHD7
Down-regulated
CUFF.148166chr6:109038801–109039233−2.856490.0181SESN1
CUFF.27895chr13:71866547–71867205−4.478920.03305DACH1
CUFF.28742chr13:102161569–102161764−3.742640.00095FGF14
CUFF.30017chr14:37573929–37574220−2.983460.001MIPOL1
CUFF.23189chr12:56596124–56596418−5.365420.0008RBMS2
Disclaimer/Publisher’s Note: The statements, opinions and data contained in all publications are solely those of the individual author(s) and contributor(s) and not of MDPI and/or the editor(s). MDPI and/or the editor(s) disclaim responsibility for any injury to people or property resulting from any ideas, methods, instructions or products referred to in the content.

