Article

Attack Analysis Framework for Cyber-Attack and Defense Test Platform

College of Computer, National University of Defense Technology, Changsha 410073, China
*
Author to whom correspondence should be addressed.
Electronics 2020, 9(9), 1413; https://doi.org/10.3390/electronics9091413
Submission received: 10 July 2020 / Revised: 6 August 2020 / Accepted: 24 August 2020 / Published: 1 September 2020
(This article belongs to the Section Computer Science & Engineering)

Abstract

:
In 2012, Google first proposed the knowledge graph and applied it in the field of intelligent searching. Subsequently, knowledge graphs have been used for in-depth association analysis in different fields. In recent years, composite attacks have been discovered through association analysis in the field of cyber security. This paper proposes an attack analysis framework for cyber-attack and defense test platforms, which stores prior knowledge in a cyber security knowledge graph and attack rule base as data that can be understood by a computer, sets the time interval of analysis on the Spark framework, and then mines attack chains from massive data with spatiotemporal constraints, so as to achieve the balance between automated analysis and real-time accurate performance. The experimental results show that the analysis accuracy depends on the completeness of the cyber security knowledge graph and the precision of the detection results from security equipment. With the rational expectation about more exposure of attacks and faster upgrade of security equipment, it is necessary and meaningful to constantly improve the cyber security knowledge graph in the attack analysis framework.

1. Introduction

The knowledge graph was proposed by Google in 2012 and successfully applied to search engines afterwards [1]. The advantage of applying the knowledge graph in the field of intelligent searching is to exchange space for time. In recent years, the knowledge graph has also been used to analyze the relationships between entities to discover and analyze problems in certain areas, such as finance and intelligence. In the field of network security, computer networks naturally have the characteristics of knowledge graphs. A computer network is composed of multiple computing nodes, and there are network connection relationships among these computing nodes, so a computer network can form a knowledge graph.
A knowledge graph constructed based on a computer network is called a cyber security knowledge graph (CSKG), and the CSKG includes two parts: a security knowledge graph (SeKG) and a scene knowledge graph (ScKG). The SeKG includes known information about vulnerabilities, attacks, assets and the relationships among them. The above information can be obtained from various vulnerability and attack analysis websites and can be updated gradually. The ScKG includes network node information and network connectivity information involved in specific attacks. Generally, the SeKG is the core graph and the ScKG is the extended graph.
The data source of the CSKG is known as cyber security knowledge, which can be transformed into different types of attack information, such as attack source, attack mode, attack object and vulnerability information. The data source of the scene knowledge graph depends on all the information about the current attack.
In the field of cyber security, the mainstream research direction is the anomaly detection technology based on machine learning. However, the result of exception detection can only tell us whether it is normal or abnormal, without the specific state of the current network or node, which can only be presented by situational awareness. Situational awareness is a way to improve the ability to discover, identify, understand, analyze and respond to security threats from a global perspective based on security big data, and is usually classified into detection, analysis, prediction and defense. This paper will focus on analysis. Prediction and defense are not in the scope of discussion here.
The premise of the attack analysis in this paper is the understanding of the general steps of testing cyber-attacks, and the experience of security analysis at the same time, with the help of the security device detection results and the characteristics of attacks. It involves a lot of human work, and since the experience is different among different people, the time and accuracy of the analysis will also be different. Therefore, can the prior knowledge of security analysts be stored in a computer according to certain rules, and can cyber-attacks then be analyzed automatically with the help of computer algorithms and programs?
Based on the above ideas, this paper proposes an attack analysis framework for cyber-attack and defense test platforms. First, build a CSKG, including SeKG and ScKG, and set up a threat element association base and a composite attack rule base. Second, fuse the multi-source heterogeneous input data and extract threat elements. The extracted threat elements are sequentially matched with the threat element knowledge base. If the match is successful, carry out the association statistics of the threat elements and then match with the CSKG; if the match is unsuccessful, the threat elements are directly matched with the CSKG. If the threat elements match with the CSKG successfully, then return single-step attacks, and if the threat elements match with the CSKG unsuccessfully, then add the threat elements to the CSKG. Due to the occurrence of false positives, the ScKG is used to determine whether the single-attack is effective, and delete the invalid single-attack. Finally, after association analysis (composite attack rule base and space-time attribute constraints) of these effective single-step attacks, the single-step attacks related to the same composite attack are respectively associated and output in the form of attack chains.

2. Related Work

The concept of ontology [2] was first applied in the field of philosophy. The German scholar Studer gave the definition of ontology in 1998: ontology is a formal specification of shared conceptual models [3]. Ontology is a conceptual model that abstracts objective facts from the objective world. There are many construction methods of ontology, such as the IDEF-5 (Integrated Computer Aided Manufacturing DEFinition-5) method, TOVE (TOronto Virtual Enterprise) modeling method, Methontology method, Skeletal Methodology method, seven-step method and construction of a domain ontology based on a thesaurus. Most of the current ontology construction is manual, and ontologies cannot be automatically constructed yet. Comez-Perez et al. [4] proposed a classification method to organize ontologies and express the ontology model by using concepts, relationships, functions, axioms and examples. Guarino et al. [5] subdivided an ontology into top-level, domain, task, method and application ontologies according to the degree of domain dependency. Wang [6] et al. established an attack ontology model according to the classification of attacks, and strictly defined the logic relationship and hierarchical structure of the ontology in the ontology model, thereby achieving effective reuse of attack knowledge. Wang et al. [6] proposed a threat intelligence ontology model, which could not only realize the extraction of entities and entity relations, but also provide the function of visual display. Tao et al. [7] proposed an ontology construction model that used servers, network devices and security devices as nodes, business data flow as the relationship connecting two nodes, and the direction of business data flow as the direction of the relationship. Wang et al. [8] constructed a network security knowledge graph, parallelized the association analysis algorithm and realized a distributed association analysis system.
The comprehensive analysis of cyber-attacks makes cyber security event association analysis technology a high concern. In recent years, many authors have summarized the cyber security event association analysis methods. Yan et al. [9] summarized the different technical methods of security event association analysis based on attribute characteristics, logic reasoning, probability statistics and machine learning. Attribute-based security event association analysis technology commonly uses methods including the finite state machine and rule-based association analysis methods. Mastani et al. [10] proposed the association analysis model based on the state machine; Forgy et al. [11] proposed the RETE algorithm, which has been the most effective algorithm based on forward chain reasoning; and Gu et al. [12] describes the principle of Rule Engine and improved RETE algorithm. The common methods of security event association analysis based on logical reasoning include case inference and model inference. Esmaili et al. [13] proposed an association technology based on case inference, and Chen et al. [14] proposed an association technology based on model inference. The common methods of security event association technology based on probability and statistics include dependency graph-based association analysis technology, the Bayesian network model and the Markov model. Rubin et al. [15] proposed a dependency graph-based association analysis technology. The common methods of security event association analysis based on machine learning include the neural network (ANN), the support vector machine (SVM), and so on. In addition, open source association analysis tools mainly include Swatch [16], SEC [17], OSSEC [18], OSSIM [19], Drools [20], Esper [21], and so on. In terms of attack scenario restoration, Peng et al. [22] proposed an alert correlation method based on the causality of attacks. Zhang et al. [23] proposed a real-time alert correlation analysis method based on an attack plan graph, which improved the attack scenario.
The rest of this paper is organized in the following way: Section 3 introduces the relevant content of the attack analysis framework, Section 4 analyzes the experimental results, and Section 5 summarizes the advantages and disadvantages of the method proposed in this paper, and points out the direction of future work.

3. Attack Analysis Framework

At present, research into cyber-attacks is carried out in the form of simulations. Thus, the cyber-attack and defense test platform came into being. It integrates all kinds of common equipment in the field of cyber security attack and defense, and uses professional attack and defense methods to provide simulation scenarios.
The cyber-attack and defense test platform provides attack and defense drills, and a variety of collection and detection systems. The collection systems can implement terminal collection, traffic collection, honeypot collection, log collection, IDS alert collection, vulnerability scanning, virus scanning, and so on. The detection systems mainly perform preliminary detection on the collected data. The attack analysis framework for the cyber-attack and defense test platform proposed in this paper is based on the above. The preliminary detection result is the input of the framework, with the help of the CSKG and the association analysis method to analyze the current cyber status. The workflow schematic diagram of the framework is shown in Figure 1. The core of the framework comprises the cyber security knowledge graph module and association analysis module.

3.1. Cyber Security Knowledge Graph Construction

In this paper, the steps to construct the cyber security knowledge graph are divided into ontology construction, ontology data model construction, self-defined reasoning rules determination and entity extraction.

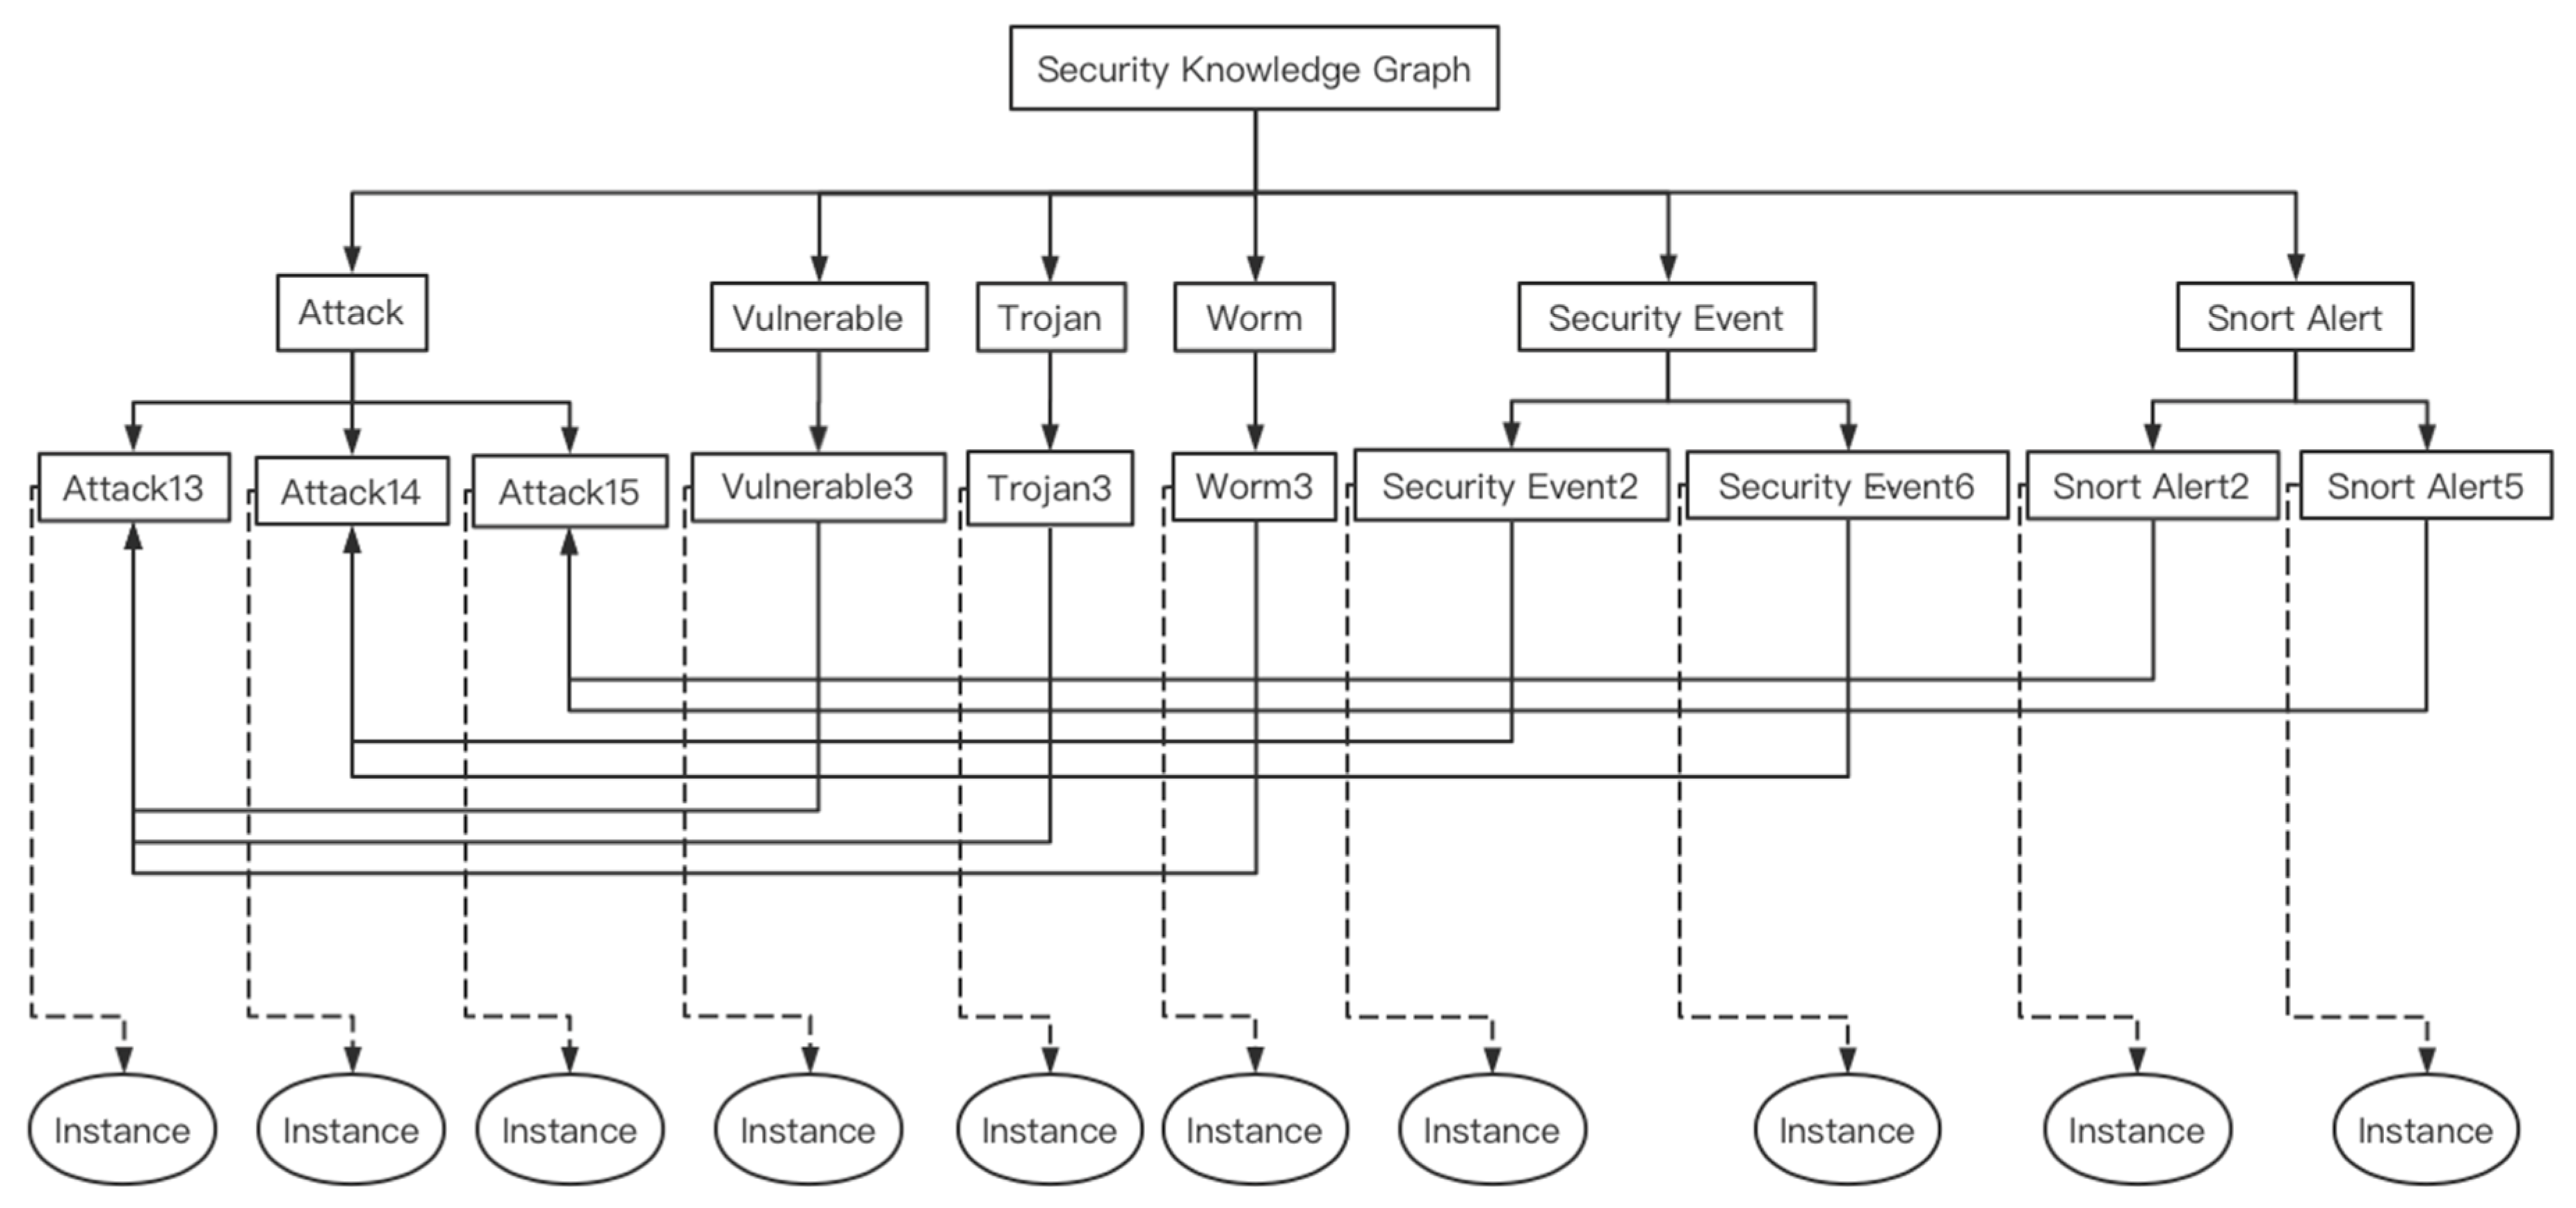
3.1.1. Security Knowledge Graph

Security Knowledge Ontology Model

This paper uses the five-tuple model proposed by Jia Yan et al. [24] to construct a security knowledge graph. The five-tuple model includes entities, attributes of entities, relationships between entities, and reasoning rules. We use SeKG (security knowledge graph) to represent the security knowledge graph, SO (security ontology) to represent the security knowledge ontology, SI (security instance) to represent the security instance, SOP (security object properties) to represent the relationships between the security ontologies, SDP (security data properties) to represent the properties of the security instance and SRR (security reasoning rule) to represent the reasoning rules of security knowledge. The formal expression is as follows:
SKG =<SO,SI,SOP,SDP,SRR>.
(1) SO = {SOi|i = 1,...,n}. Security knowledge ontology is a concept summarized and abstracted from security knowledge, and usually divided into multi-level ontologies. For example, asset is a first-level ontology, and can be divided into second-level ontologies: software and hardware. The software is divided into a three-level ontology, including operating system, application software, etc. The hardware is divided into a three-level ontology, including PC, server, switch, etc. The operating system is divided into a four-level ontology, including the Windows operating system and the Linux operating system. The Linux operating system is divided into a five-level ontology, including Ubuntu, SUSE, Debian, Redhat and CentOS operating systems. Again, for instance, vulnerability is a first-level ontology, and can be divided into a second-level ontology, including ddos vulnerability, privilege escalation vulnerability, buffer overflow vulnerability, etc. The same applies to the ontology division of attacks, Trojans, worms, snort alerts and security events.
(2) SI = {SIi|i = 1,...,m}. The security instance is the specific security knowledge corresponding to the last level of an ontology, such as, examples of asset software operating system are: Windows 7, Windows 10, and so on; examples of vulnerability-buffer overflow vulnerability are: CVE-2019-1010309, CVE-2019-1010306, CVE-2019-1010298, CVE-2019-1010238, CVE-2019-1010208, and so on.
(3) SDP = {<SIi, Proij, valuej>}. The data attributes of the security instance, such as the version number of the operating system, the discovery time, update time, hazard level of the vulnerability, and so on.
(4) SOP =< SOi, Rcc, SOj>|<SOi, Rci, SIi>|<SIi, Rcc, SIj>. The object property of the security instance is the relationship between the security instances. For example, the relationship between multi-level ontologies is subClassOf, such as (asset, subClassOf, hardware), (asset, subClassOf, software); the relationship between different ontologies includes hasExit and exploit, such as (Windows operating system, hasExit, buffer overflow vulnerability), (buffer overflow attack, exploit, buffer overflow vulnerability). After adding instances to the ontology, the relationship between ontology and instance is instanceOf, such as (CVE-2019-1010298, instanceOf, buffer overflow vulnerability), and so on.
(5) SRR = {SRR|SRR = <SIi, newRij, SIj>|<SOi, newRij, SIj>|<SIi, Proij, newValuej>. Based on SKG, reasoning rules can be used to reason out new attributes of the security instance and new relationships between security instances.

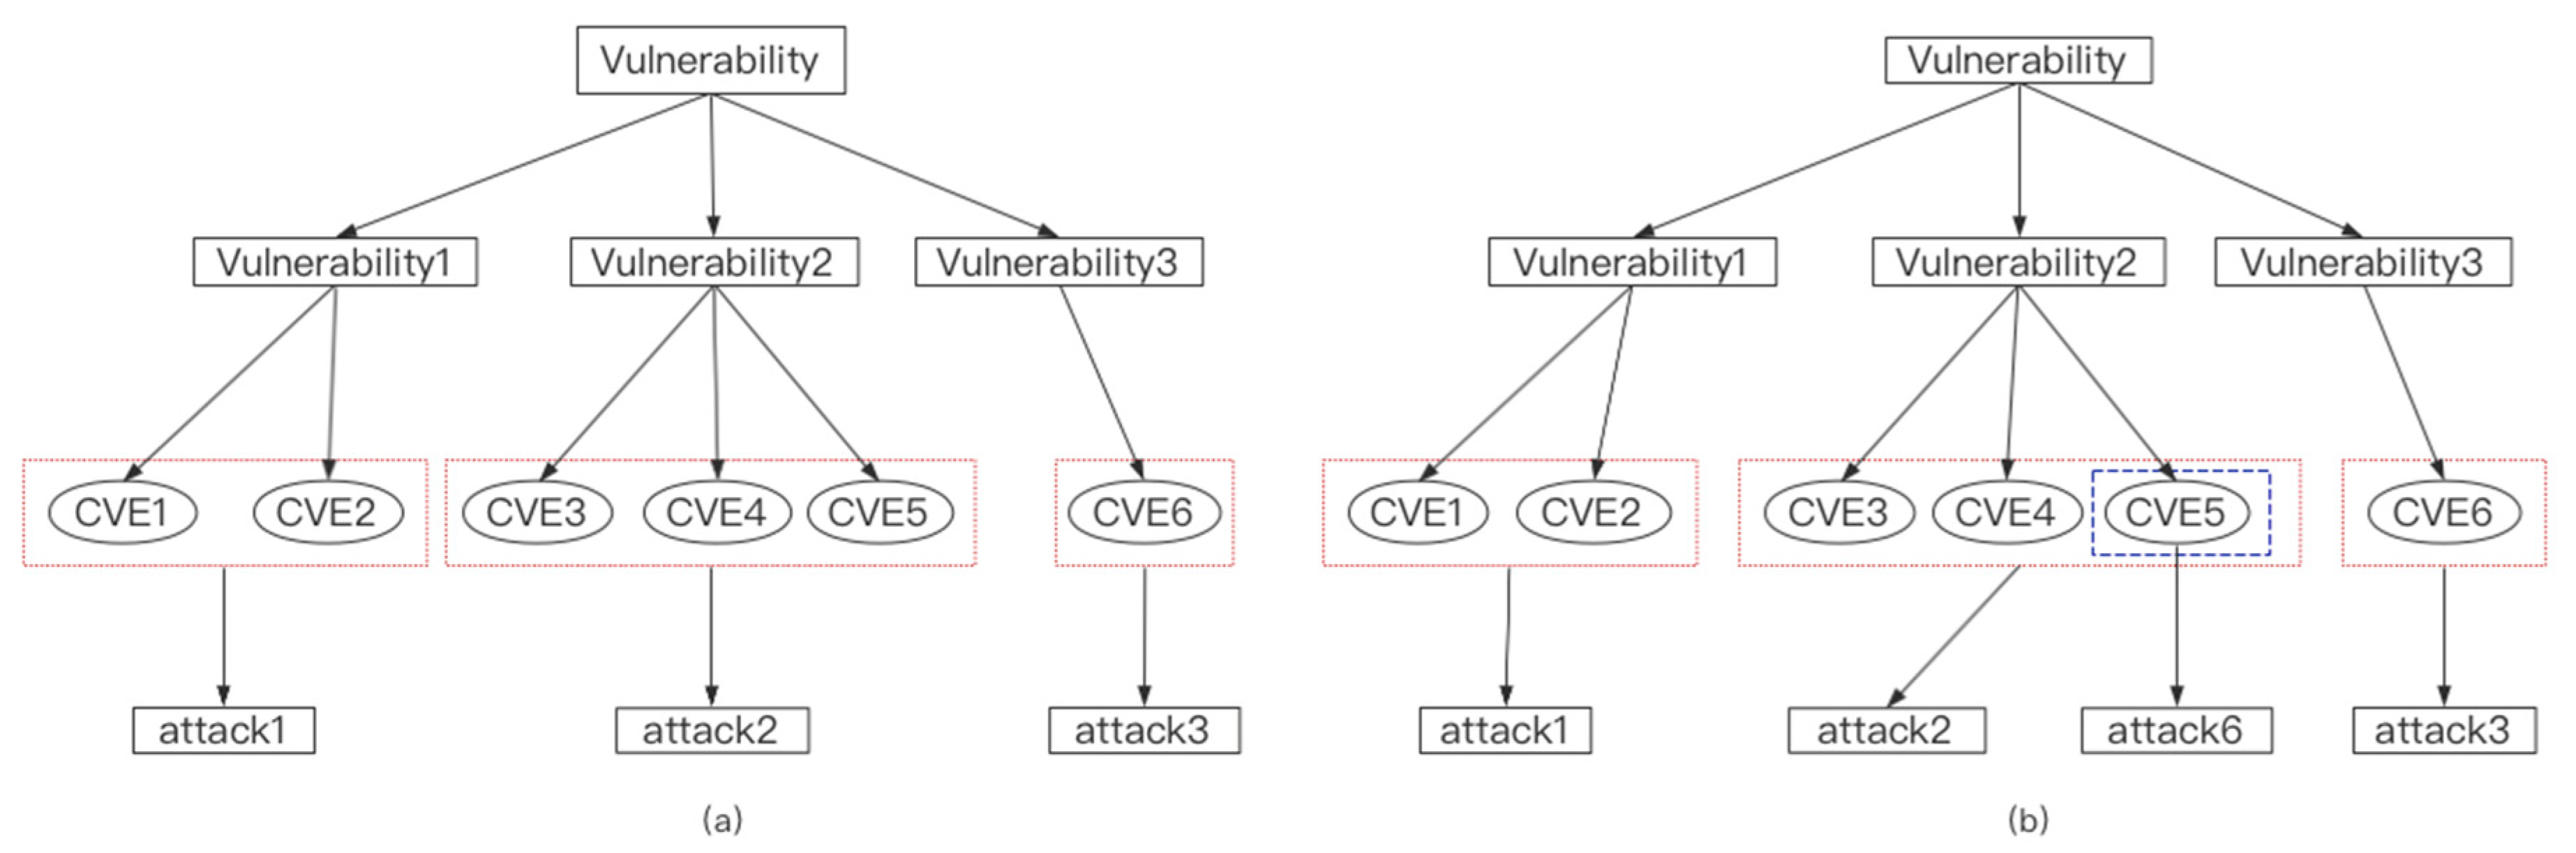
Ontology-Instance Data Model

The security knowledge used in this paper mainly comes from six aspects: vulnerability database, virus database, snort alert, preliminary detection results, log information and attack classification. This paper is mainly concerned with the relationships between vulnerabilities, viruses, snort alerts, preliminary detection results, log information and attacks. We classify the relationships into three types: 1:1, n:1 and 1:n.
In particular, log information can be incorporated into security events. Instances of security event and snort alert are directly stored in the corresponding model based on prior knowledge. For certain instances of vulnerability, Trojan and worm, the entity-relationship needs to be extracted directly, and for other instances, the entity needs to be extracted and then added to the corresponding model. Although Trojans and worms are both viruses, they have specific classifications and different relationships with attacks, so they are respectively taken as ontologies in this paper.
1:1 data model
Take vulnerability as an example. If all instances in each category of the vulnerability are associated with the same attack, as shown in Figure 2a, then the 1:1 ontology model can be constructed between vulnerability and attack. If not, as shown in Figure 2b, CVE5, the instance in blue, is different from the others, since it not only connects to the attack2, but also connects to the attack6, and needs to be extracted directly, and the rest of the instances are used to construct the ontology model between vulnerability and attack.
Construct attack ontology, security event ontology, vulnerability ontology, Trojan ontology, worm ontology, snort alert ontology and secondary ontology, determine the relationships between secondary ontologies, and then add instances to secondary ontologies respectively. The data model is shown in Figure 3.
n:1 data model
Take vulnerability as an example. If all instances in each category of the vulnerability are associated with the same multiple attacks, as shown in Figure 4a, then the n:1 ontology model can be constructed between vulnerability and attack. If not, as shown in Figure 4b, CVE11, the instance in blue, is different from the others, since it connects to the attack6 and attack2, and needs to be extracted directly, and the rest of the instances are used to construct the ontology model between vulnerability and attack.
Construct attack ontology, vulnerability ontology, Trojan ontology, worm ontology and secondary ontology, determine the relationships between secondary ontologies, and then add instances to secondary ontologies respectively. The data model is shown in Figure 5.
1:n data model
Take vulnerability, Trojan and worm as examples. If all instances of vulnerability, Trojan and worm are associated with the same attack, as shown in Figure 6a, then the 1:n ontology model can be constructed between vulnerability, Trojan, worm and attack. If not, as shown in Figure 6b, T-3 and W-1, the instances in blue, are different from the others, since they not only connect to the attack10, but also connect to the attack1, and need to be extracted directly, and the rest of the instances are used to construct the ontology model between vulnerability, Trojan, worm and attack.
Construct attack ontology, security event ontology, vulnerability ontology, Trojan ontology, worm ontology, snort alert ontology and secondary ontology, determine the relationships between secondary ontologies, and then add instances to secondary ontologies respectively. The data model is shown in Figure 7.

Self-Defined Reasoning Rules

(1)
Fixed reasoning rules
The entities of machine learning and manual recognition are added to the 1:1 data model, 1:n data model and n:1 data model according to the entity classification and relationship classification, applied with reasoning rules (instance 1, belongs to, ontology1), (instance 2, belongs to, ontology 2), (ontology 1, relationship 1, ontology 2) -> (instance 1, relationship 1, instance 2). Instances of vulnerability, Trojan, worm, snort alert and security event are then associated with types of attack, and stored in the cyber security knowledge graph as cyber security knowledge. For convenience, we convert the 1:n and n:1 data models into the 1:1 model for reasoning. Examples of reasoning rules are shown in Table 1.
(2)
Specific reasoning rules
When new knowledge emerges, it is necessary to associate the new knowledge with the existing knowledge to enrich the cyber security knowledge graph. Applied with reasoning rules (instance 1, relationship 1, instance 2), (instance 2, belongs to, Ontology 2), (instance 3, belongs to, ontology 3), (ontology 2, relationship 2, ontology 3) -> (instance 1, relationship 2, instance 3), then instances of new vulnerabilities, new Trojans or new worms can be associated with types of attack, and stored in the cyber security knowledge graph. Examples of reasoning rules are shown in Table 2.

Named Entity Recognition Based on CRF

In the field of cyber security, although the sources of the corpus are diverse, they have the same syntactic description, and machine learning methods can be used for entity and entity-relationship recognition. Taking vulnerability base and virus base as examples, the markup method of ontology construction-information extraction is shown in Figure 8. The markup method of direct information extraction is shown in Figure 9. We divide the data into a training data set and a test data set, use word2vec to convert words to vectors, and combine with CNN, Bilstm and CRF in order to simultaneously carry out entity recognition and relationship classification. For the instance identified by the first markup method, triples need to be artificially extracted and added to the cyber security knowledge graph. For the instance identified by the second markup method, the instance needs to be artificially added to the corresponding data model, and after the self-defined reasoning, triples can be generated and added to the cyber security knowledge graph.
Due to the small data set, the best result of recognition is 97.6%. Manual verification is required to ensure the knowledge in the cyber security knowledge graph is 100% correct. The method and improvement of machine learning are not the focus of this paper. The purpose of adopting machine learning in this paper is to reduce manual operation as much as possible, and realize semi-automatic cyber security knowledge graph construction.

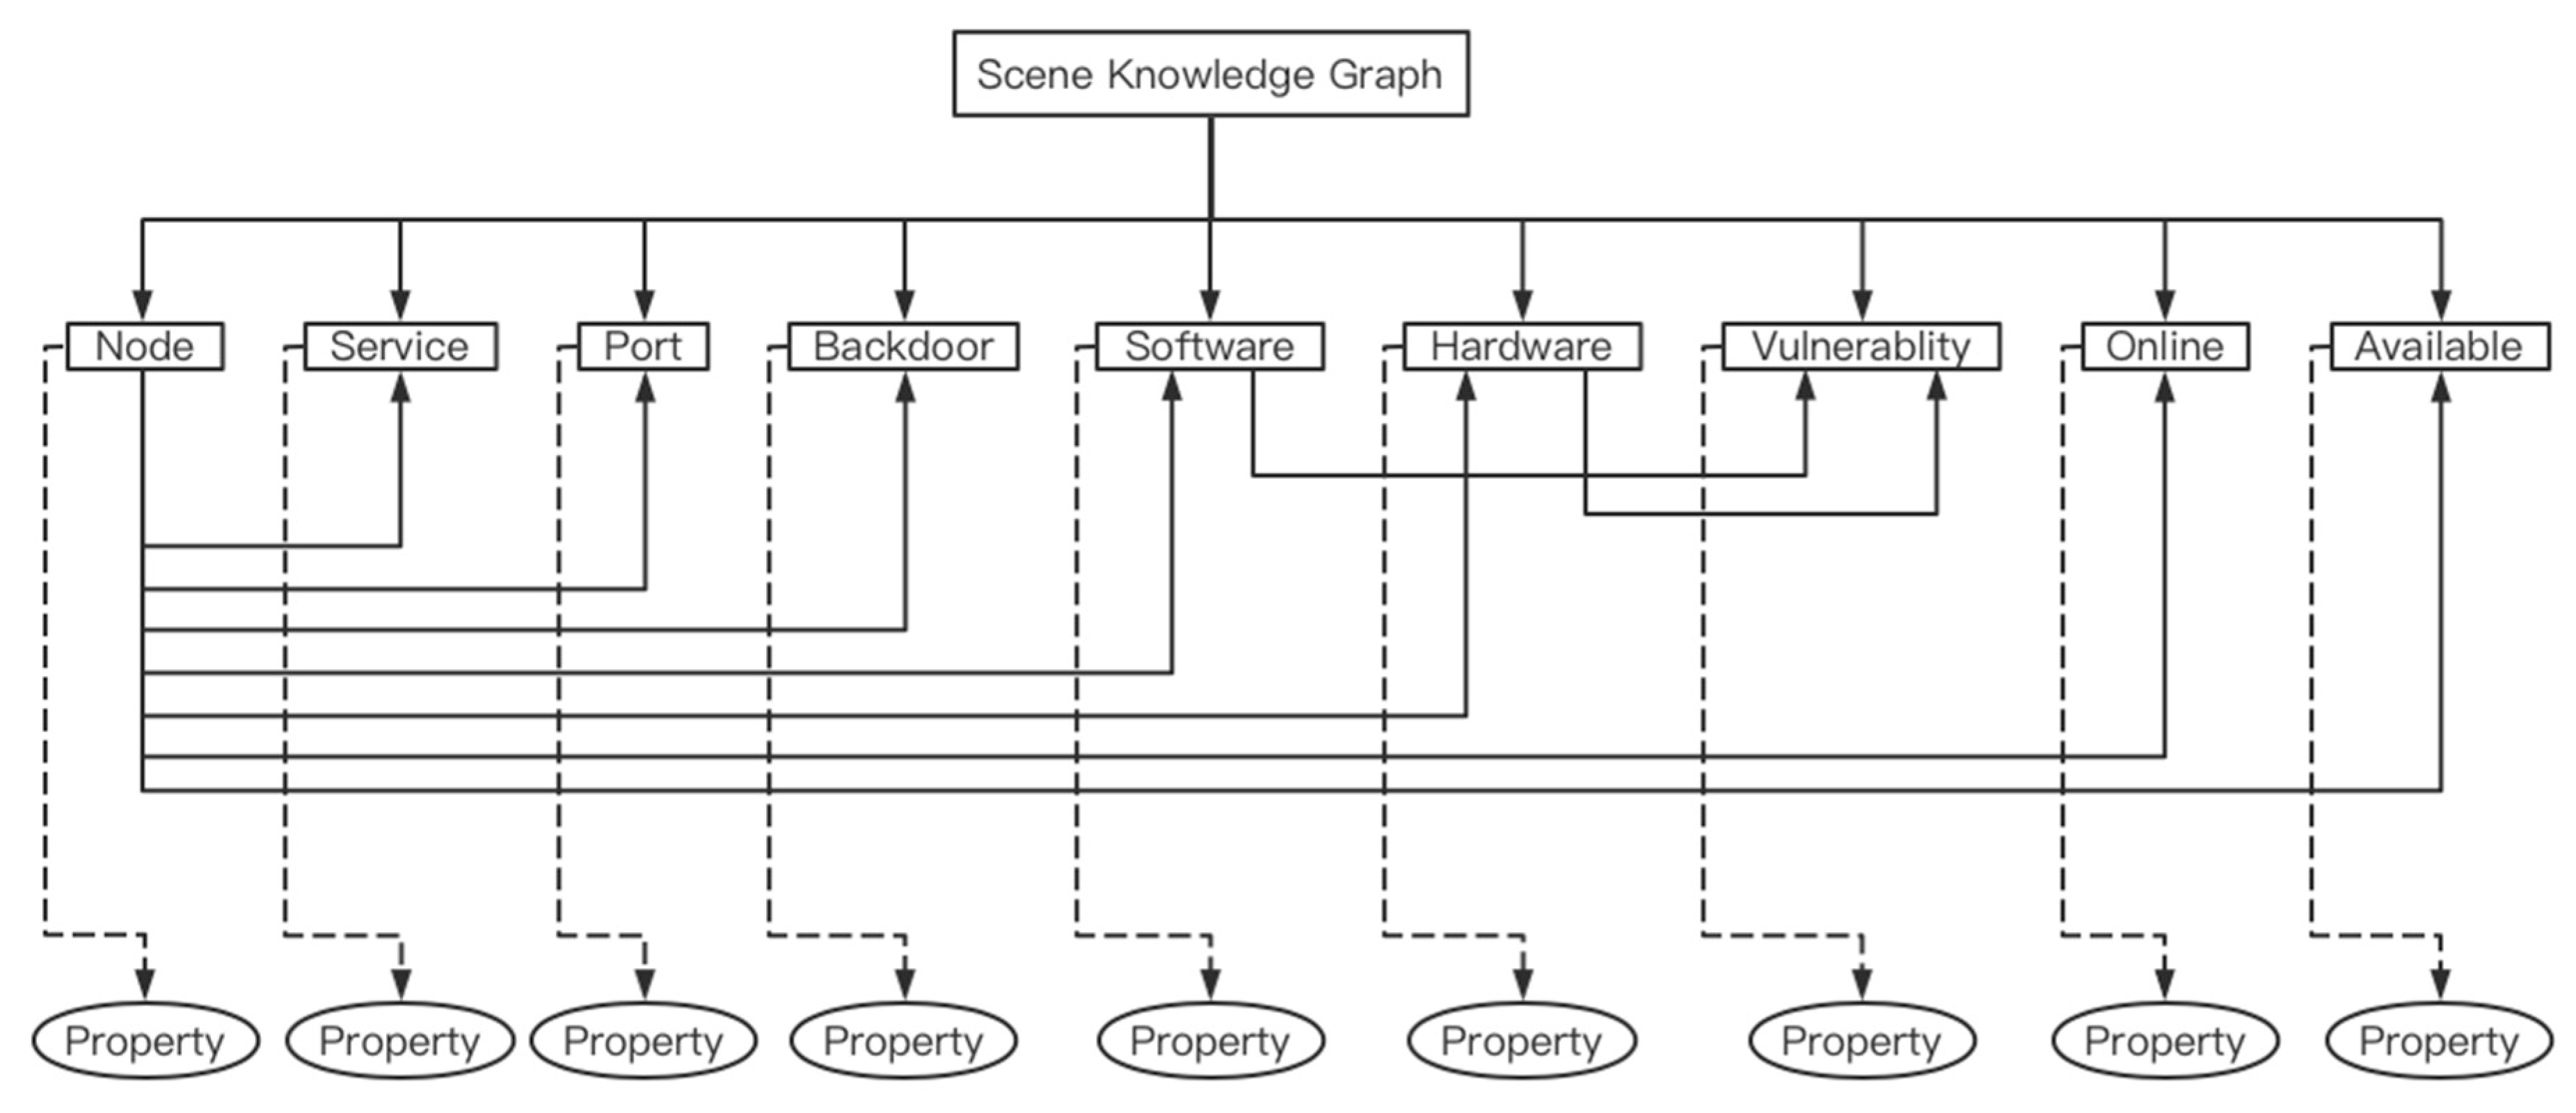
3.1.2. Scene Knowledge Graph

The scene knowledge graph is composed of the details of multiple simulation attacks of the scene, including node IP, software and hardware, existing vulnerabilities, backdoors, standby status, network status, open services and ports, and so on.
An ontology model is also needed to construct a scene knowledge graph, and the focus of scene knowledge is data attributes. Construct the node ontology, software ontology, hardware ontology, backdoor ontology, standby state ontology, network state ontology, port ontology, service ontology and vulnerability ontology. Determine the data attributes for the ontologies, and then add instances and data attributes of the instances according to the ontology model. The data model is shown in Figure 10.

3.2. Threat Element Association Statistics

After data fusion and threat element extraction, we can extract vulnerabilities, Trojans, worms, snort alerts and security events from input data. Vulnerabilities, Trojans, worms, certain snort alerts and security events can be directly matched with the security knowledge graph, but there are two special cases of certain snort alerts and security events. 1. For the same IP, within a certain time interval, count the same snort alert time. If it exceeds the set threshold, the attack corresponding to the snort alert can be considered to have occurred, and the same is true for security events. 2. For the same IP, within a certain time interval, multiple different snort alerts are reported in turn. Count the number of alerts, and if it exceeds the set threshold, the attack corresponding to the multiple different snort alerts can be considered to have occurred, and the same is true for security events.

3.2.1. Set Frequency Threshold

If the counted time of an alert is greater than or equal to the set threshold, match the alert information with the knowledge graph and return the attack associated with the alert information. If the counted time of the alert is less than the set threshold, the statistical results are cached and participate in the calculation of the next time window. The same is true for security events.
The calculation formula of the alert information is shown below.
s u m i k = t = t 0 t 1 i = 1 i ( k e y i ,   a l e r t k )
where keyi stands for different IP and alertk stands for different alert information of the same IP in a (t0, t1) time period.
The calculation formula of the security event is shown below.
s u m i k = t = t 0 t 1 i = 1 i ( k e y i ,   s e k )
where keyi stands for different IP and sek stands for different security events of the same IP in a (t0, t1) time period.

3.2.2. Set Number Threshold

If the counted number of alerts is greater than or equal to the set threshold, match the last alert information with the knowledge graph and return the attack associated with the alert information. If the counted number of alerts is less than the set threshold, the statistical results are cached and participate in the calculation of the next time window. The same is true for security events.
The calculation formula of the alert information is shown below.
s u m i k = c o u n t ( t = t 0 t 1 i = 1 i ( k e y i , [ a l e r t 1 ,   a l e r t 2 ,   a l e r t k ] )
where keyi stands for different IP and alert1, alert2alertk represents multiple alert messages corresponding to the same IP in a (t0, t1) time period.
The calculation formula of the security event is shown below.
s u m i k = c o u n t ( t = t 0 t 1 i = 1 i ( k e y i , [ s e 1 ,   s e 2 ,   s e k ] )
where keyi stands for different IP and se1, se2sek represents multiple alert messages corresponding to the same IP in a (t0, t1) time period.

3.3. Attack Analysis and Judgment Based on Association Analysis

3.3.1. Attack Rule Base

Any action that attempts to breach resource integrity, confidentiality and availability is called an attack. When an attack has an independent and undecomposed purpose, it is a single-step attack. However, a successful attack process often contains multiple single-step attacks, which is called a composite attack. Figure 11a is the example of a single-step attack, while Figure 11b,c are the examples of composite attacks. The scene in Figure 11b contains only one target, while the scene in Figure 11c exploits several nodes.
We know that cyber-attacks can be divided into single-step attacks and composite attacks. Composite attacks can be regarded as a combination of multiple single-step attacks. Only by following certain rules can single-step attacks be composed of composite attacks. For example, if many attacks occurred on the same node, as shown in Figure 12, how could we determine what attacks are targeted on the node B? This paper solves this problem by establishing an attack rule base.
The framework models to describe attacks mainly include Kill Chain, the ATT&CK model and the NSA/CSS technical threat framework. These framework models summarize the steps for composite attacks. Based on the above models, this paper summarizes the general rules of composite attacks, some of which are shown in Figure 13. An attack rule base can be added or modified as analysis progresses.
Even if multiple single-step attacks against the same node conform to the attack rules, they cannot be judged as composite attacks, as shown in Figure 14. Attacks on node B exactly conform to attack rule 2, but they actually belong to five different composite attacks. Obviously, composite attacks cannot be accurately analyzed just by setting up the attack rule base. This paper solves this problem by setting spatiotemporal constraints.

3.3.2. Spatiotemporal Constraints
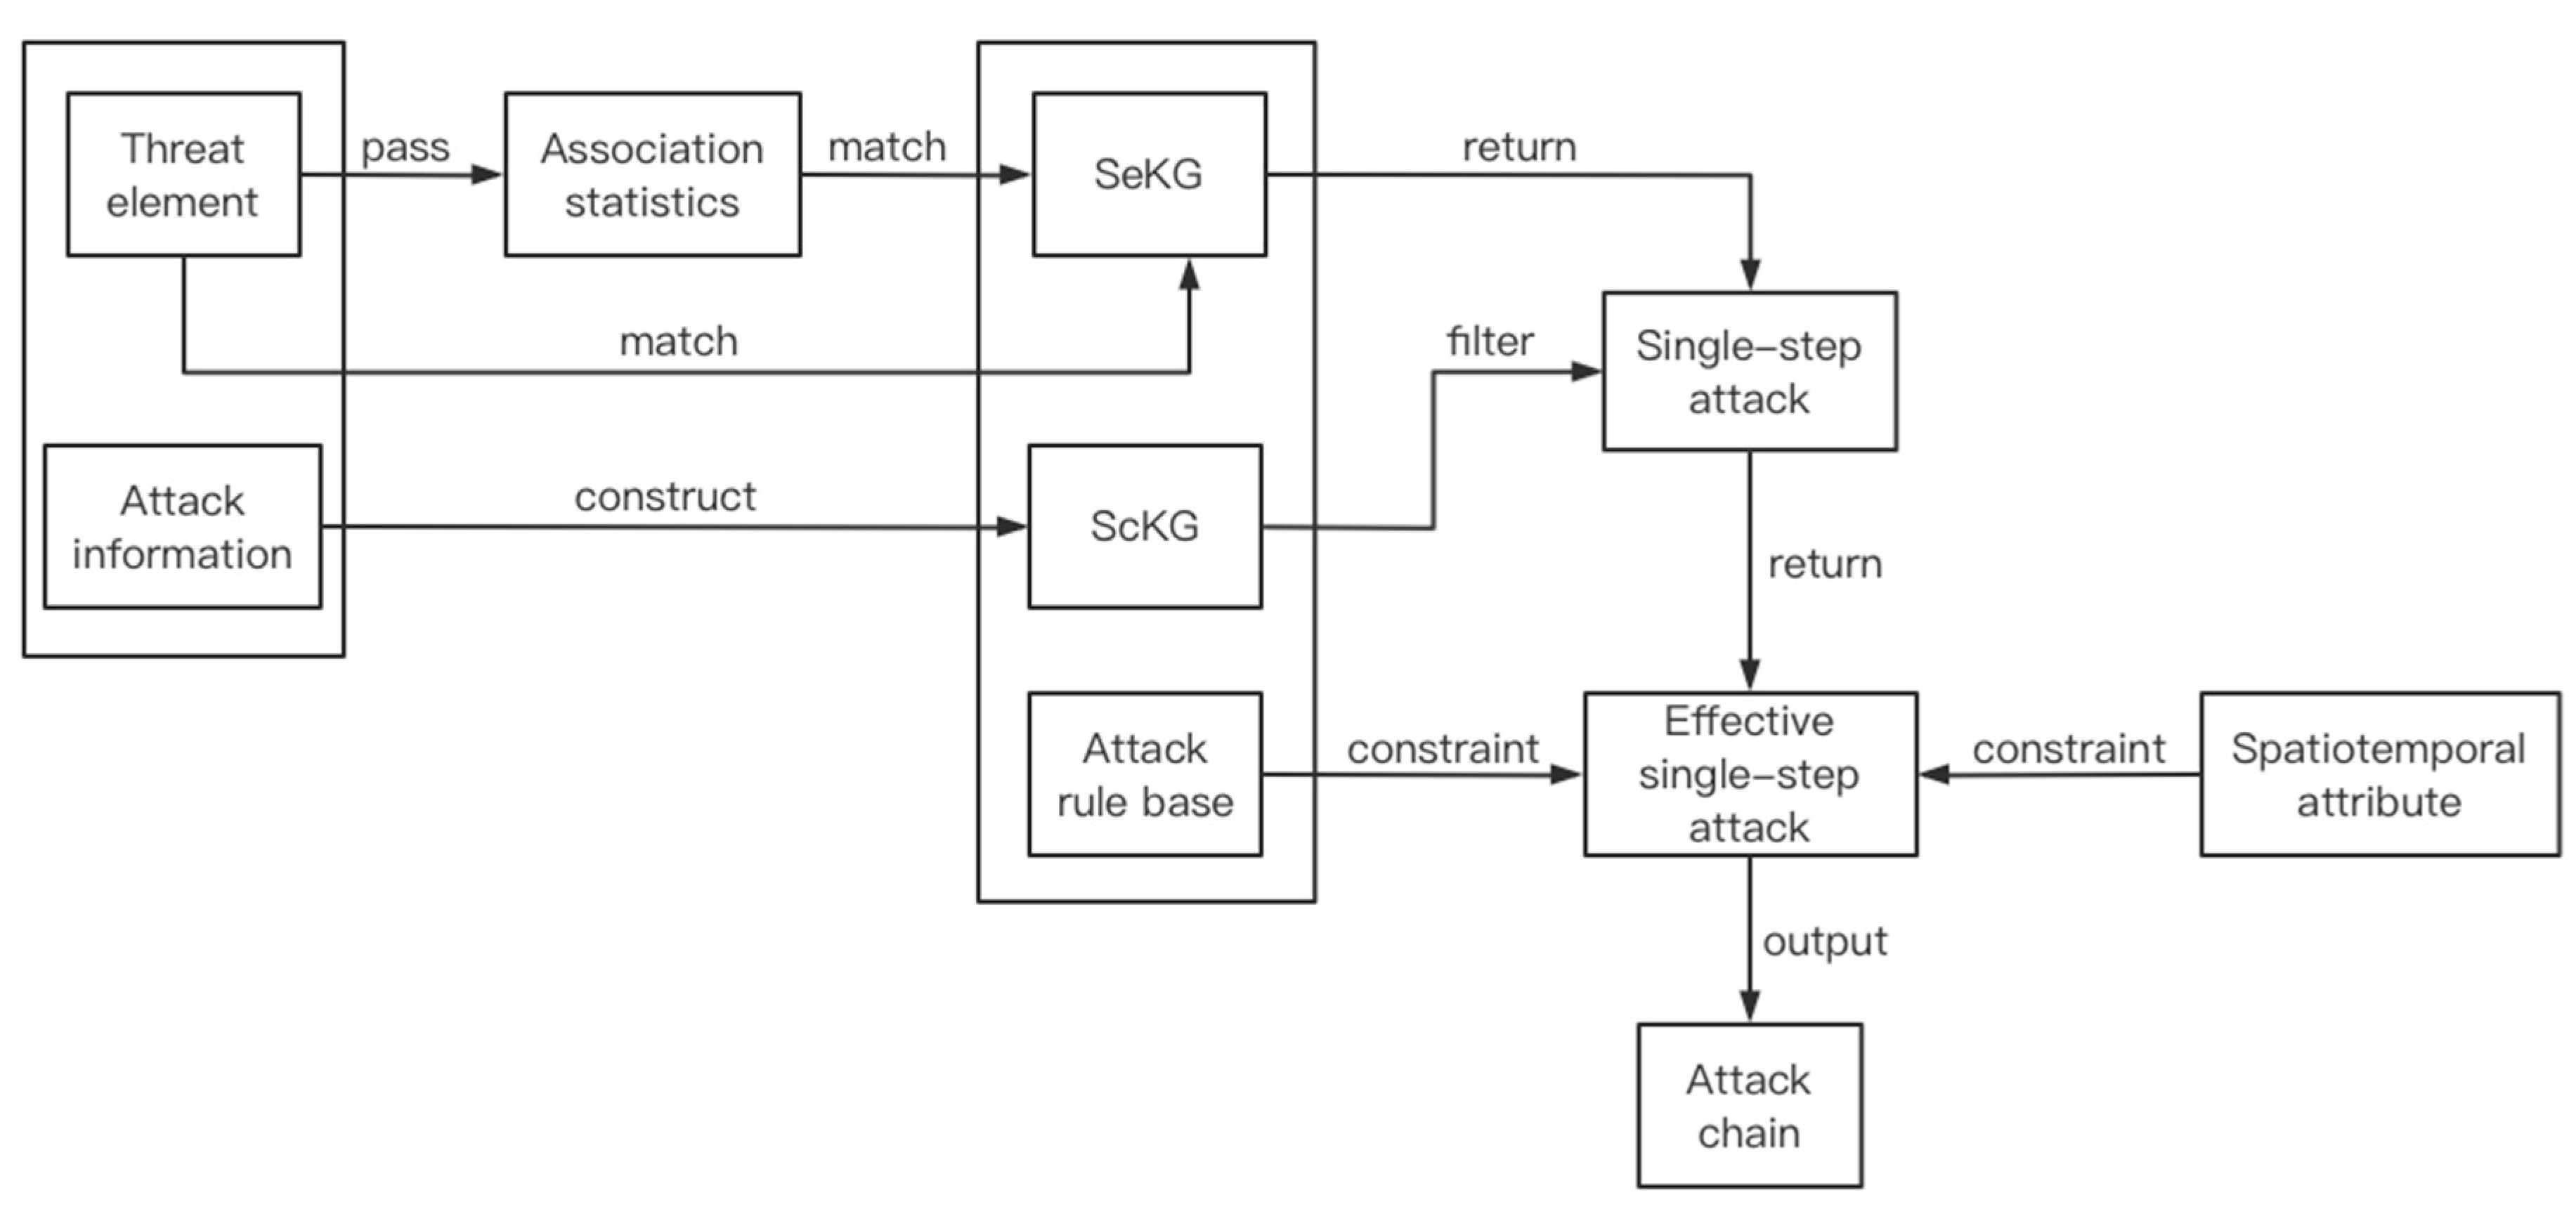
The duration of each composite attack is different. We cannot know the duration of each composite attack in advance, and it is impossible to set the analysis interval for each composite attack separately. As shown in Figure 15a, if the duration of the attack is less than the time of analysis, an attack has occurred and caused the damage, but the analysis has not been completed. As shown in Figure 15b, if the duration of the attack is greater than the time of analysis, the attack has not finished yet, but the analysis has finished, which means we cannot obtain the full attack chain. For these two situations, we set the analysis time interval and time interval offset on Spark, and iteratively output the results of each analysis to ensure the accuracy of the composite attack analysis.
Spark [25] is good at processing stream data. The basic principle is to divide stream data into small pieces of time (a few seconds) and process these small pieces of data in a way similar to batch processing. The attack analysis framework uses the Spark framework to process data in parallel, and uses time windows and time-increasing offsets to iteratively output the analysis results, thereby greatly reducing the false negative and false positive rates of the analysis results, and the analysis response time is close to a real-time response.
The process of composite attack analysis is described as follows:
set the analysis time window and offset on the Spark framework, and respectively set the alert base and security event base that need to be associated statistically;
in a time window, after data fusion and threat element extraction, the input data is first matched with the alert base and security event base set in the first step. If the matching fails, it can be directly matched with the security knowledge graph. If the match is successful, then it is matched with the security knowledge graph after statistical association;
the result returned in the previous step is for single-step attacks after using the scene knowledge graph to filter out invalid attacks;
match effective single-step attacks with attack rule bases, while constraining time and IP propagation;
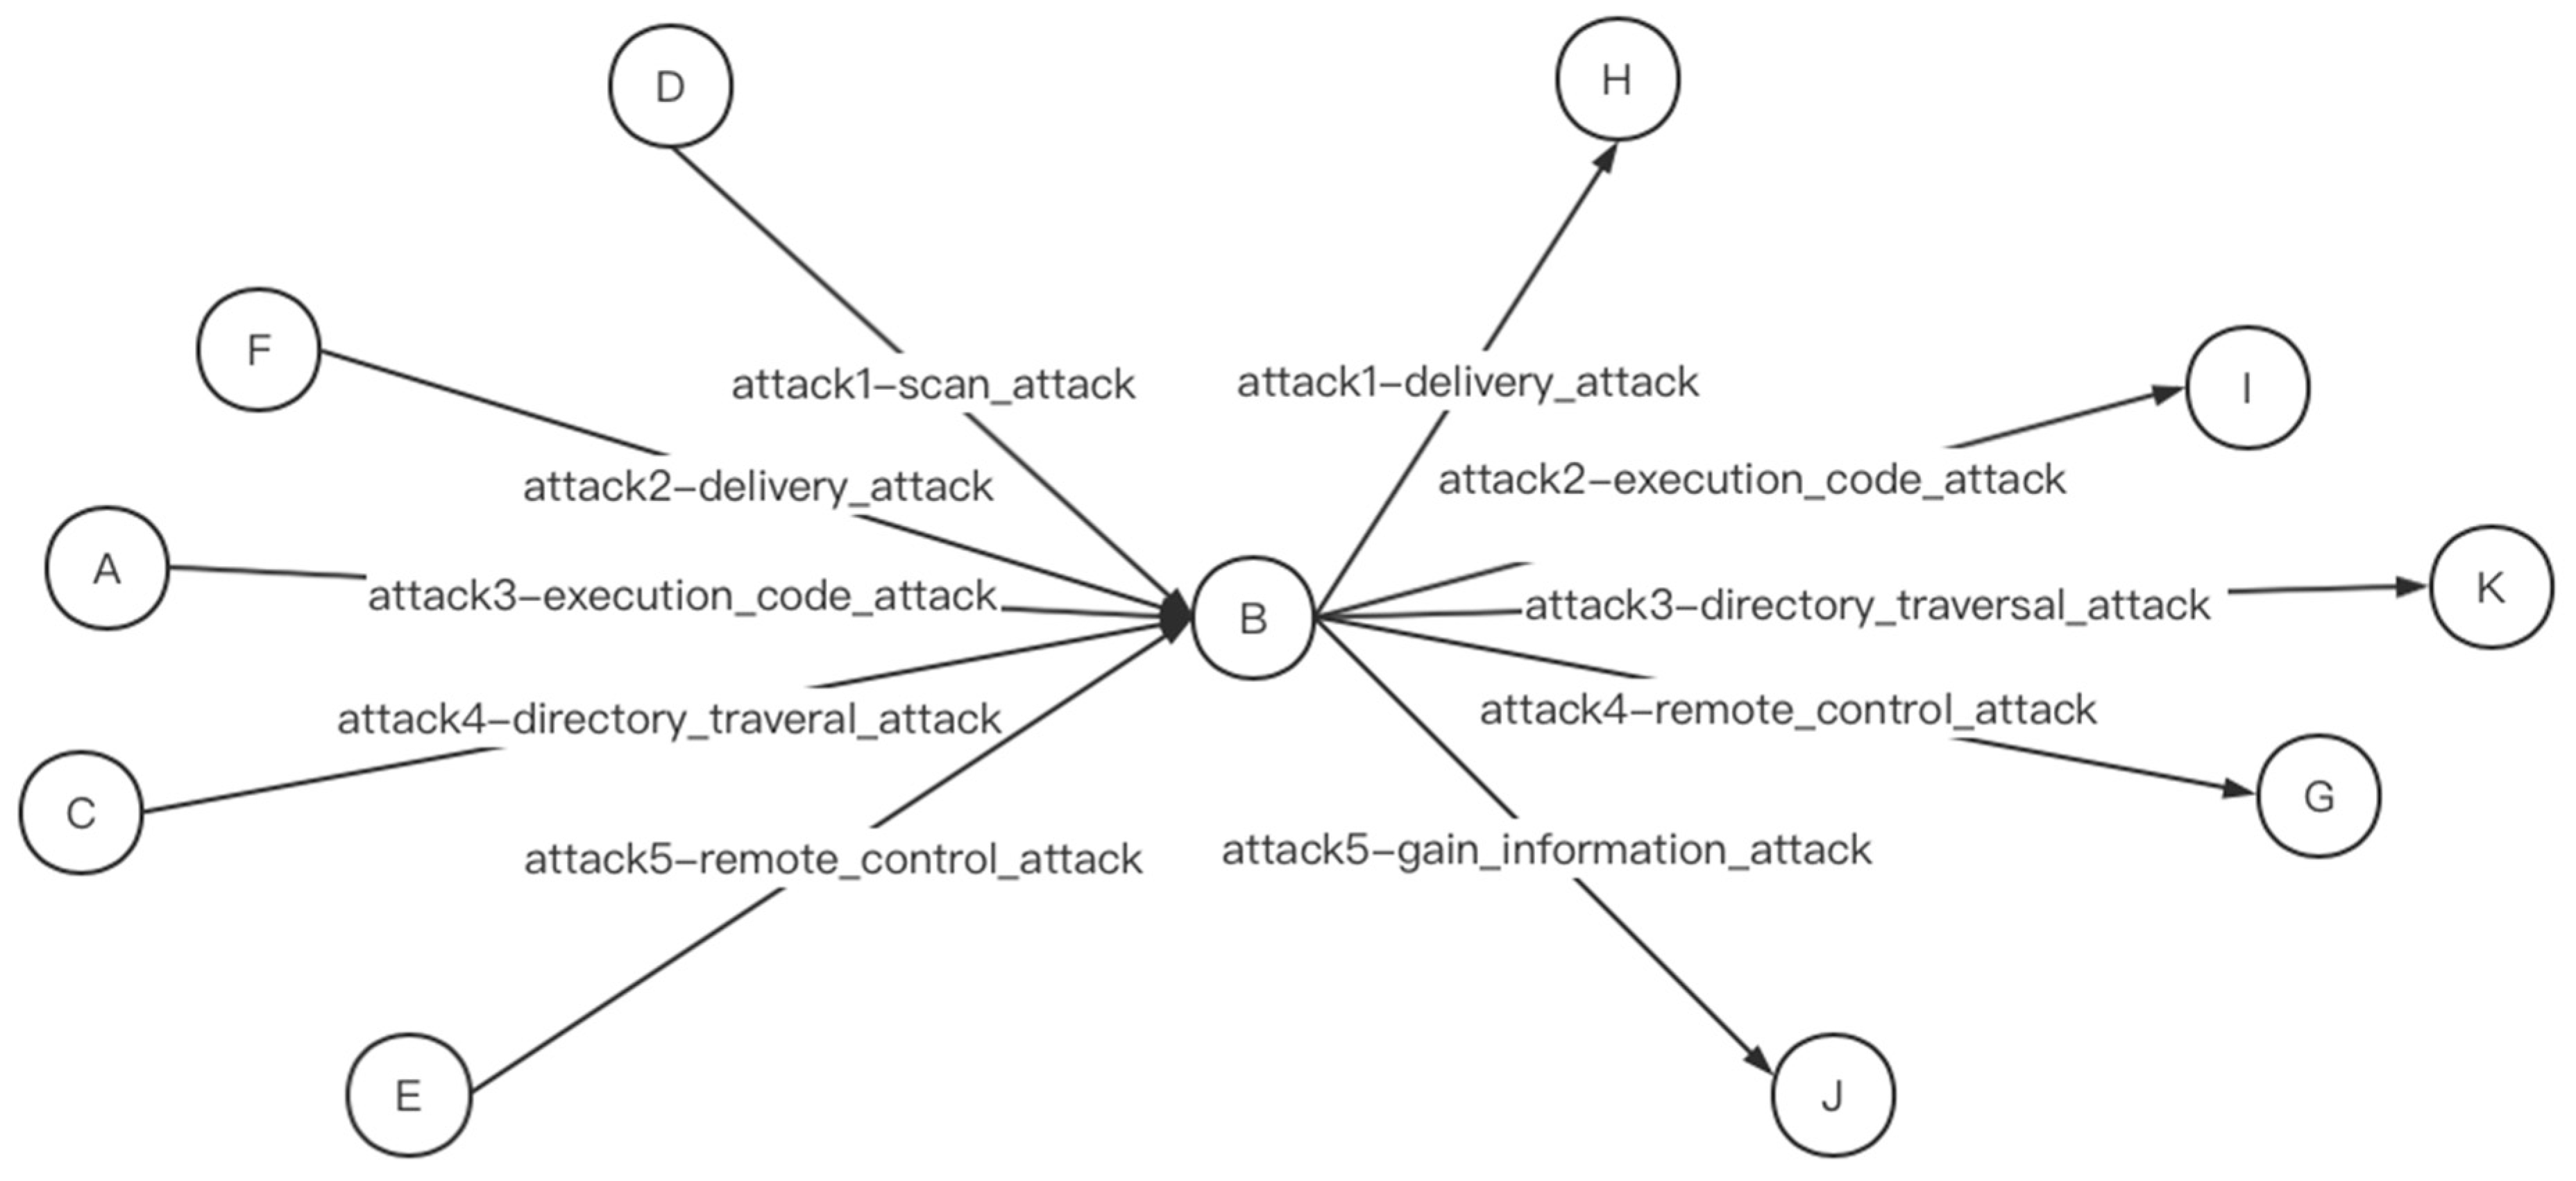
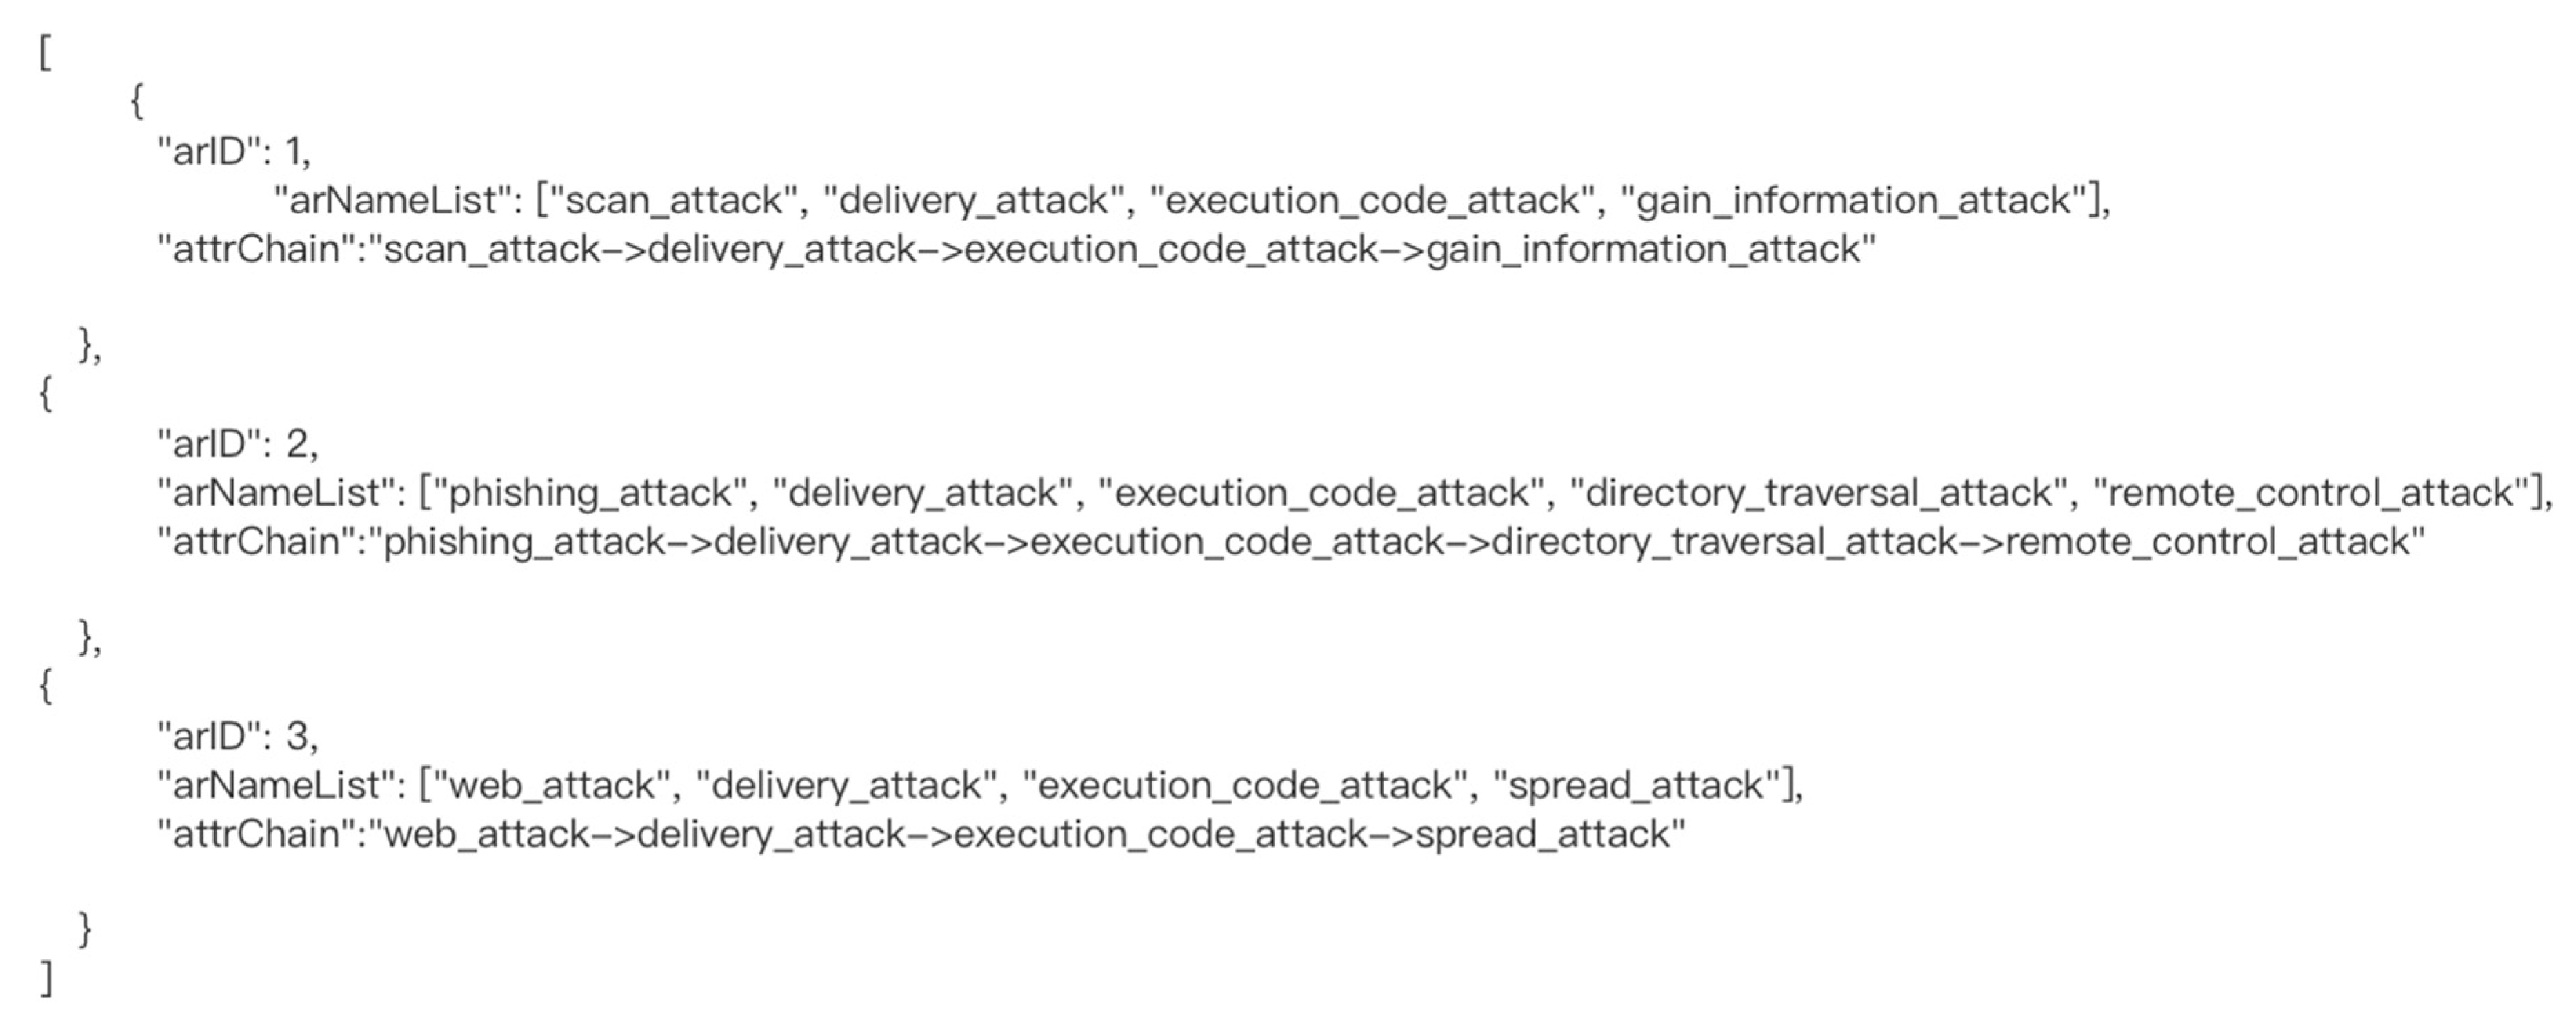
after the analysis of the input data within a time window is completed, the analysis results are cached and output as intermediate results. With the offset of the time window, the results of each analysis are iteratively output. When the attack ends, the complete attack chain will be output. Intermediate results and final results are output in the form of an attack chain. A schematic of the attack chain generation is shown in Figure 16.

3.3.3. Evaluation Mechanism

The effective attack analysis framework for the cyber-attack and defense test platform proposed in this paper is based on the cyber security knowledge graph. The core of the analysis is to first match a threat element with the cyber security knowledge graph and return a single-attack result, and then generate possible composite attack chains within the constraints of an attack rule base and spatiotemporal properties.
We know that some vulnerabilities, Trojans and worms can correspond to multiple attacks, but in actual simulations, they can only correspond to one attack at a time. Therefore, based on the analysis results of the cyber security knowledge graph, the number of analysis results will be equal to or greater than the number of simulated attacks. In order to verify the effectiveness of this method, we save the simulated attack information in advance, match the analysis results with it, and use the matched results as the basis of the verification method.
At present, there is no general evaluation mechanism to verify the effectiveness of this method. There may be four cases that affect the results of attack analysis: 1. simulated attacks are all successful, and detection results are all correct; 2. simulated attacks are partially successful, and detection results are all correct; 3. simulated attacks are all successful, and detection results are partially correct; 4. simulated attacks are partially successful, and detection results are partially correct. The results of the theoretical attack analyses in these four cases are shown in Table 3.
In order to quantify the above indicators, this paper proposes a concept: efficiency of attack analysis. The number of simulated attacks is denoted as F1, the number of single-step attacks obtained by matching with the security knowledge graph is denoted as F2, the number of effective single-step attacks obtained by matching with the scene knowledge graph is denoted as F3, the number of invalid attacks is denoted as F4, the number of attacks obtained by association analysis is denoted as F5, matching of the analyzed attack with the simulated attack and the number of successful matches is recorded as F6 and the efficiency of the attack analysis is recorded as R. The formula is as follows:
R = { F 6 F 1 , i f   s i m u l a t e d   a t t a c k s   a r e   a l l   e f f e c t i v e F 6 F 1 F 4 , i f   s i m u l a t e d   a t t a c k s   a r e   p a r t i a l l y   e f f e c t i v e

4. Test and Result Analysis

The simulation of the composite attacks is completed on the cyber-attack and defense test platform by running the attack script. The attack script sets the path of the attack. The cyber-attack and defense test platform provides test node mirrors. In the node mirror, software and hardware can be arbitrarily installed, network state and standby can be set arbitrarily and the open state of the port and service can be set arbitrarily. Deploy the attack script, then generate a virtual machine mirror, start the virtual machine, execute the attack script, run a command to complete the attack simulation, and at the same time, the cyber-attack and defense test platform will provide collection and detection systems, such as vulnerability scanning, virus detection, terminal collection, mail collection, honeypot collection, computing node data collection, file detection, sandbox detection analysis, network detection and honeypot terminal behavior detection.
The experiment is divided into two parts. The first part is to verify the validity of self-defined reasoning during the expanding of the knowledge graph. The second part is to verify the feasibility of the analysis framework and the evaluation mechanism. The first part uses the comparison of analysis results of known and unknown vulnerabilities to verify the validity of the self-defined reasoning. The second part simulates all possibilities in the occurrence of attacks and detections, and uses the analysis results to verify the feasibility of the evaluation mechanism. The test deployment is shown in Figure 17. In this test, 3 attacks are simulated, the duration of these attacks is 15 min and the analysis time window is set to 5 min.

4.1. Verify the Validity of Self-Defined Reasoning Rules

It is known that CVE-2019-1010153 is not stored in the safety knowledge graph, and the relationship between CVE-2019-1010153 and CVE-2013-3525 is known. It is assumed that all simulation attacks are successful and the detection results are all correct. The original knowledge graph and the expanded knowledge graph are used to compare the results, and the results are shown in Table 4 (see Section 3.1, Section 3.2 and Section 3.3 for detailed analysis).

4.2. Verify the Feasibility of the Analysis Framework

Divide the test into four cases, each of which uses the extended security knowledge graph. In the first case, the simulated attacks are all successful and the detection results are all correct; in the second case, the simulated attacks are partially successful, the standby state of the node with IP 183.146.1.6 is set to shut down to simulate a failed attack, and the detection results are all correct; in the third case, the simulated attacks are all successful and the detection results are partially correct, and the Trojan information of the node with IP 183.146.2.8 is lost; in the fourth case, the simulated attacks are partially successful, the standby state of the node with IP 183.146.1.6 is set to shut down to simulate a failed attack, the detection results are partially correct, and the Trojan information of the node with IP 183.146.2.8 is lost. The effective results of the attack analysis under different cases are shown in Table 5 (see Section 3.1 to Section 3.3 for detailed analysis).
The test results show that the richer the security knowledge graph, the higher the efficiency of the attack analysis; the fewer false positives and false negatives in the detection result, the higher the efficiency of the attack analysis. When new knowledge appears and has not been added to the cyber security knowledge graph and attack rule base, even if it is detected, a complete attack chain cannot be analyzed. In the simulation environment, the analysis framework proposed in this paper is feasible. However, when the detection results are wrong, the complete attack chain cannot be analyzed. Future work will mainly focus on how to comprehensively develop self-defined reasoning rules, and how to complete the attack chain with the help of a scene knowledge graph and an attack rule base.

5. Conclusions

The core of this paper is to apply a cyber security knowledge graph to attack analysis, which is divided into a security knowledge graph and a scene knowledge graph. The security knowledge graph is constructed and expanded semi-automatically, and the scene knowledge graph is constructed manually. Using the cyber security knowledge graph, attack rule base and spatiotemporal property constraints, composite attack chains are mined from multiple single-attacks.
At present, the construction of the cyber security knowledge graph and attack rule bases also requires a lot of manual operations, and the flexibility is poor. The goal of future work is to achieve semi-automatic or automated construction. Since the results of the analysis may not generate a complete attack chain, this paper proposes the effectiveness of attack analysis. The effectiveness of attack analysis is proportional to the accuracy of the detection results. The focus of future work is how to improve the effectiveness of attack analysis. The framework proposed in this paper is only applicable to the analysis of attacks with prior knowledge that can be stated in a cyber security knowledge graph and an attack rule base, and is not designed for the discovery of unknown attacks.

Author Contributions

Conceptualization, Y.J. and A.L.; methodology, Y.Q. and R.J.; software, Y.Q.; validation, Y.Q., R.J., and A.L.; investigation, Y.Q.; resources, Y.Q.; data curation, R.J.; writing—original draft preparation, Y.Q.; writing—review and editing, R.J.; visualization, A.L.; supervision, Y.J.; project administration, A.L.; funding collection, Y.J. All authors have read and agreed to the published version of the manuscript.

Funding

This research was partially supported by the National Key Research and Development Program of China, grant numbers 2019QY1406, 2017YFB0802204, and 2017YFB0803301, and the Key R&D Program of Guangdong Province, grant number No.2019B010136003. This research was also supported by the National Natural Science Foundation of China, grant numbers No. 61732004, 61732022, 61502517, 61472433, and 61672020.

Conflicts of Interest

The authors declare no conflict of interest.

References

  1. Liu, Q.; LI, Y.; Duan, H. Overview of Knowledge Mapping Technology. J. Comp. Res. Dev. 2016, 3, 582–600. [Google Scholar]
  2. Zhang, X.; Jiang, L. Overview of Ontology concept Research. Chin. J. Inf. Technol. 2002, 26, 527–531. [Google Scholar]
  3. Qiu, B. Research on Knowledge Modeling for Domain Ontology; Shandong Normal University: Jinan, China, 2009. [Google Scholar]
  4. Gómez-Pérez, A.; Benjamins, R. Overview of knowledge sharing and reuse components: Ontologies and problem-solving methods. IJCAI and the Scandinavian AI Societies. In Proceedings of the CEUR Workshop Proceedings, Stockholm, Sweden, 31 July 1999. [Google Scholar]
  5. Guarino, N. Semantic matching: Formal ontological distinctions for information organization, extraction, and integration. In International Summer School on Information Extraction; Springer: Berlin/Heidelberg, Germany, 1997. [Google Scholar]
  6. Wang, T.; Ai, Z.; Zhang, X. Knowledge Graph Construction of Threat Intelligence Based on Deep Learning. Comput. Mod. 2018, 280, 25–30. [Google Scholar]
  7. Tao, Y.; Huang, T.; Li, M. Research on Network Security Level Protection Log Audit Analysis Model Driven by Knowledge Graph. Net. Secur. 2020, 20, 46–51. [Google Scholar]
  8. Wang, W.; Jiang, R.; Jia, Y. KGBIAC: Knowledge Graph Based Intelligent Alert Correlation Framework. In International Symposium on Cyberspace Safety and Security; Springer: Cham, Switzerland, 2017; pp. 523–530. [Google Scholar]
  9. Yan, A.K.; Guo, Y.B.; Zhu, T.M. Research on Network Security Incident Correlation Analysis Technology and Tools. Comput. Sci. 2017, 2, 38–45. [Google Scholar]
  10. Mastani, S.A. Reduced Merge_FSM Pattern Matching Algorithm for Network Intrusion Detection. Int. J. Recent Trends Eng. Technol. 2014, 10, 117. [Google Scholar]
  11. Forgy, C.L. Rete: A fast algorithm for the many pattern/many object pattern match problem. In Readings in Artificial Intelligence and Databases; Morgan Kaufmann: Burlington, MA, USA, 1989; pp. 547–559. [Google Scholar]
  12. Gu, X.D.; Gao, Y. Rete algorithm: Current issues and future Challenge. Comput. Sci. 2012, 39, 8–12. [Google Scholar]
  13. Esmaili, M.; Balachandran, B.; Safavi-Naini, R. Case-based reasoning for intrusion detection. In Proceedings of the 12th Annual Computer Security Applications Conference, San Diego, CA, USA, 9–13 December 1996; IEEE: Piscataway, NJ, USA, 1996; pp. 214–223. [Google Scholar]
  14. Bo, C.; Ling, Y.U.; Jun-Mo, X. An Application of Simulated Annealing Algorithm in Model-Based Reasoning Intrusion Detection. J. Univ. Electron. Sci. Technol. China 2005, 34, 36–39. [Google Scholar]
  15. Rubin, D.E.; Mital, V.; Beckman, B.C. Dependency Graph in Data-Driven Model. U.S. Patent 8,352,397, 8 January 2013. [Google Scholar]
  16. Hansen, S.E.; Atkins, E.T. Automated System Monitoring and Notification with Swatch. In Proceedings of the LISA 93, Monterey, CA, USA, 1–5 November 1993; pp. 145–152. [Google Scholar]
  17. Rouillard, J.P. Real-time Log File Analysis Using the Simple Event Correlator (SEC). In Proceedings of the LISA, Atlanta, GA, USA, 14–19 November 2004; pp. 133–150. [Google Scholar]
  18. Cid, D.B. Log Analysis Using OSSEC. 2007. Available online: http://www.academia.edu/8343225/Log_Analysis_using_OSSEC (accessed on 15 August 2020).
  19. Nguyen, G.; Fischer, M.; Strufe, T. Ossim: A generic simulation framework for overlay streaming. In Proceedings of the 2013 Summer Computer Simulation Conference, Toronto, ON, Canada, 7–10 July 2013; Society for Modeling & Simulation International: Vista, CA, USA, 2013; p. 30. [Google Scholar]
  20. Proctor, M. Drools: A rule engine for complex event processing. In Proceedings of the 4th International Conference on Applications of Graph Transformations with Industrial Relevance, Budapest, Hungary, 4–7 October 2011; Springer: Berlin/Heidelberg, Germany, 2011; p. 2. [Google Scholar]
  21. EsperTech. Esper Website. Available online: http://www.espertech.com (accessed on 15 August 2020).
  22. Ning, P.; Cui, Y.; Reeves, D. Constructing Attack Scenarios through Correlation of Intrusion Alert; North Carolina State University at Raleigh: Raleigh, NC, USA, 2002. [Google Scholar]
  23. Zhang, J.; Li, X.; Wang, H. Real-time alert correlation approach based on attack planning graph. J. Comput. Appl. 2016, 6, 1538–1543. [Google Scholar]
  24. Jia, Y.; Qi, Y.; Shang, H.; Jiang, R.; Li, A. A Practical Approach to Constructing a Knowledge Graph for Cybersecurity. Engineering 2018, 4, 53–60. [Google Scholar] [CrossRef]
  25. Qi, L.I.; Xin, Z.; Pingkang, Z. Improved CFSFDP Algorithm Based on Spark Framework. Electron. Sci. Technol. 2019. [Google Scholar]
Figure 1. The workflow schematic diagram of the framework.
Electronics 09 01413 g001
Figure 2. Example of 1:1 data model.
Electronics 09 01413 g002
Figure 3. 1:1 data model.
Electronics 09 01413 g003
Figure 4. Example of n:1 data model.
Electronics 09 01413 g004
Figure 5. n:1 data model.
Electronics 09 01413 g005
Figure 6. Example of 1:n data model.
Electronics 09 01413 g006
Figure 7. 1:n data model.
Electronics 09 01413 g007
Figure 8. The cyber security corpus: markup method 1.
Electronics 09 01413 g008
Figure 9. The cyber security corpus: markup method 2.
Electronics 09 01413 g009
Figure 10. The data model of scene knowledge graph.
Electronics 09 01413 g010
Figure 11. The examples of single-step attack and composite attack.
Electronics 09 01413 g011
Figure 12. The examples of different attacks on the same node.
Electronics 09 01413 g012
Figure 13. The examples of attack rule.
Electronics 09 01413 g013
Figure 14. The examples of special attack.
Electronics 09 01413 g014
Figure 15. The examples of analysis time.
Electronics 09 01413 g015
Figure 16. The generation process of the attack chain.
Electronics 09 01413 g016
Figure 17. Test deployment.
Electronics 09 01413 g017
Table 1. Fixed reasoning rules.
rule: (?m NamedIndividualof ?n), (?p NamedIndividualof ?q), (?n r1 ?q) -> (?m r1?p)
rule: (?m NamedIndividualof ?n), (?p NamedIndividualof ?q), (?n r2 ?q) -> (?m r2?p)
Table 2. Specific reasoning rules.
[rule1: (?m NamedIndividualof ?n), (?p NamedIndividualof ?q), (?n r2 ?q) -> (?m r2?p)] [rule2: (?l equal ?m), (?m r2 ?p) -> (?l r2 ?p)]
[rule1: (?m NamedIndividualof ?n), (?p NamedIndividualof ?q), (?n r2 ?q) -> (?m r2?p)] [rule2: (?l SameCategory ?m),(?m r2 ?p) -> (?l r2 ?p)]
Table 3. Four kinds of results.
Simulated Attacks Are All SuccessfulSimulated Attacks Are Partially Successful
Detection Results are All Correct100%100%
Detection Results are Partially Correct<100%<100%
Table 4. Analysis results of different knowledge graphs.
F1F2F3F4F5F6R
Original SKG3242403266.7%
Expanded SKG32626033100%
Table 5. The effective results of attack analysis under different cases.
Simulated Attacks Are All SuccessfulSimulated Attacks Are Partially Successful
Detection Results are All Correct100%100%
Detection Results are Partially Correct66.7%33.4%

