Article

Movement Trajectory Recognition of Sign Language Based on Optimized Dynamic Time Warping

1
Institute of Intelligent Control and Robotics, Hangzhou Dianzi University, Hangzhou 310018, China
2
Xianheng International (Hangzhou) Electric Manufacturing Co., Ltd., Hangzhou 310022, China
*
Author to whom correspondence should be addressed.
Electronics 2020, 9(9), 1400; https://doi.org/10.3390/electronics9091400
Submission received: 27 June 2020 / Revised: 10 August 2020 / Accepted: 26 August 2020 / Published: 29 August 2020
(This article belongs to the Section Computer Science & Engineering)

Abstract

:
Movement trajectory recognition is the key link of sign language (SL) translation research, which directly affects the accuracy of SL translation results. A new method is proposed for the accurate recognition of movement trajectory. First, the gesture motion information collected should be converted into a fixed coordinate system by the coordinate transformation. The SL movement trajectory is reconstructed using the adaptive Simpson algorithm to maintain the originality and integrity of the trajectory. The algorithm is then extended to multidimensional time series by using Mahalanobis distance (MD). The activation function of generalized linear regression (GLR) is modified to optimize the dynamic time warping (DTW) algorithm, which ensures that the local shape characteristics are considered for the global amplitude characteristics and avoids the problem of abnormal matching in the process of trajectory recognition. Finally, the similarity measure method is used to calculate the distance between two warped trajectories, to judge whether they are classified to the same category. Experimental results show that this method is effective for the recognition of SL movement trajectory, and the accuracy of trajectory recognition is 86.25%. The difference ratio between the inter-class features and intra-class features of the movement trajectory is 20, and the generalization ability of the algorithm can be effectively improved.

1. Introduction

Sign language (SL) is a complex dynamic mode accompanied by various gestures [1,2] and is the main form of communication for the deaf community. Automatically recognizing and converting SL into an easily understandable form for non-deaf people [3,4] will help the integration of the deaf community into society, which will bring great benefits to many deaf communities around the world. At present, SL translation mainly focuses on gesture recognition [5,6,7], whereas trajectory recognition is often simplified or ignored by many scholars. The same gesture matching with different movement trajectory often expresses two different meanings, that is, representing different SL. Therefore, the trajectory recognition is directly related to the accuracy of SL translation.
Machine vision and deep algorithms have been widely used in the recognition and detection of trajectory. In Reference [8], tracked devices and depth sensors are used to capture three-dimensional (3D) trajectory, which achieves good results in short trajectory and multi-finger gestures recognition, but has great limitations in long trajectory recognition, such as SL translation. In References [9,10], a 3D camera is used to track 3D trajectory. The machine vision cannot meet the wearable and low-cost requirements of the SL translation system; hence, research methods based on combined electromyography (EMG) and motion information are gradually favored [11,12]. In gesture motion information, acceleration (ACC) information is often directly encoded to the classifier for processing. In Reference [13], ACC sensors are used to collect data in three-axis direction and encoded to the pattern classifier. In Reference [12], ACC and EMG information are encoded to support vector machine (SVM) for gesture classification. ACC can only represent object displacement in a certain direction. When the attitude angle changes during motion, ACC cannot accurately reflect the trajectory of the object. Therefore, how to restore the SL movement trajectory without distortion is the first condition for accurate trajectory classification. Liu [14] restored the air handwriting trajectory, and the accuracy was 85%, but the stability needs to be further improved. In Reference [15], hidden Markov model (HMM) is used to recognize five kinds of dynamic gesture trajectories, and the average recognition rate is 84%. Five kinds of trajectories are difficult to meet the requirements of complex dynamic patterns of SL, and a recognition method with more types and higher accuracy is urgently needed.
The SL movement trajectory deviates to some extent due to the user’s action speed and action arm length; even for the same user, physiological or psychological changes lead to inconsistent execution speed of SL movement [16]. Time-scale normalization can simultaneously process the length of two movement sequences but may lead to a sharp decrease in the similarity of movement sequences. Therefore, an effective measurement method for the similarity of movement sequences with different length is needed.
Dynamic time warping (DTW) [17,18,19,20,21] can effectively solve the expansion and offset of the time series by warping the time axis, which is suitable for local speed. However, DTW focuses on the amplitude characteristics of time series but ignores its local shape characteristics, thus leading to the risk of abnormal matching. Weighted DTW [22] uses a nonlinear weight function to optimize sequence matching but ignores to the local shape characteristics of the sequence. Accurately matching the key features representing the shape characteristics of time series, such as local peak value and valley value, is necessary to ensure the accuracy of similarity measurement between sequences. Generalized linear regression (GLR) [23,24,25] is an accurate, efficient, and robust classification method with great advantages in the analysis and extraction of signal extremum features. In this paper, a new algorithm based on DTW for GLR model optimization (GLR-DTW) is proposed. The regression coefficient of the distance matrix network is constructed by modifying the activation function of GLR to optimize the algorithm. The similarity measure is used to identify different types of SL movement trajectory. The results show that this method effectively recognizes SL movement trajectory.

2. Materials and Methods
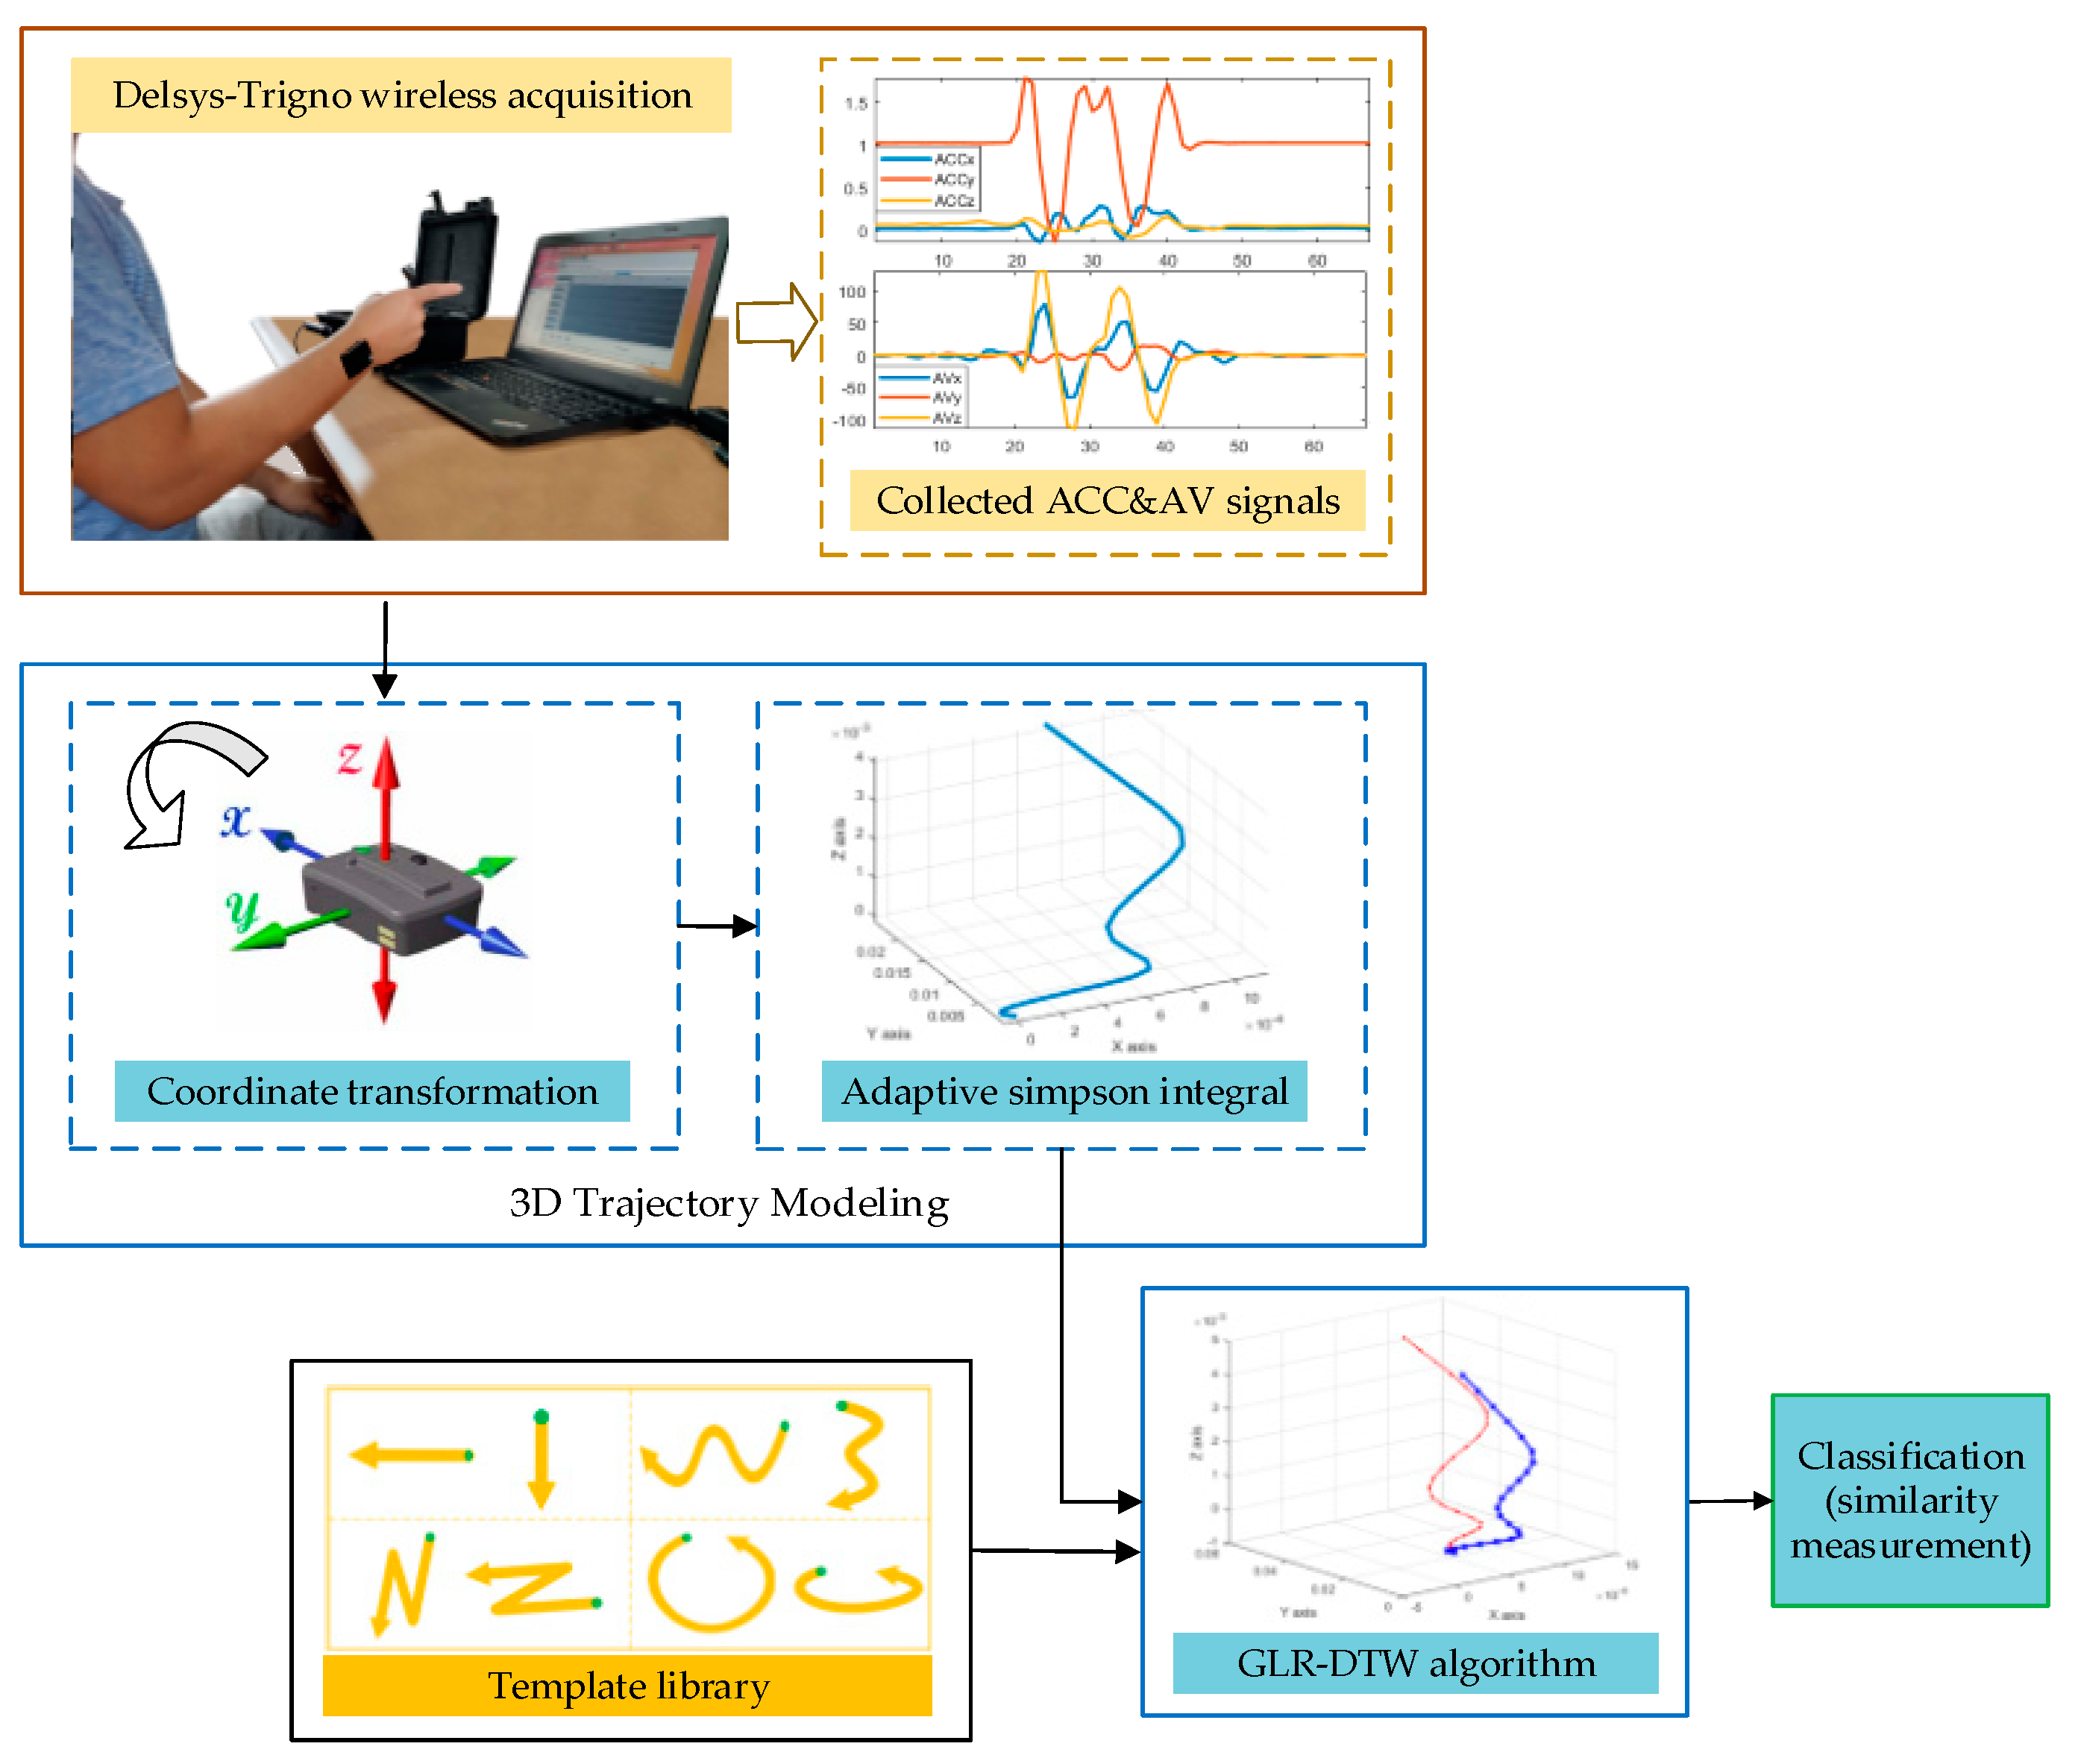
2.1. Overview

Figure 1 shows the steps of the trajectory recognition method proposed in this paper. Firstly, the Trigno wireless acquisition system (Delsys Ltd.) is used to collect the ACC and angular velocity (AV) signals when the SL is acted, and the ACC signals after the coordinate transformation are reconstructed to the SL movement trajectory by the adaptive Simpson algorithm. Then, the reconstructed trajectory compares with the trajectory of the template library one-by-one and are encoded to the GLR-DTW algorithm together. Finally, the similarity measure is used to judge whether the two warped trajectories are classified to the same category.

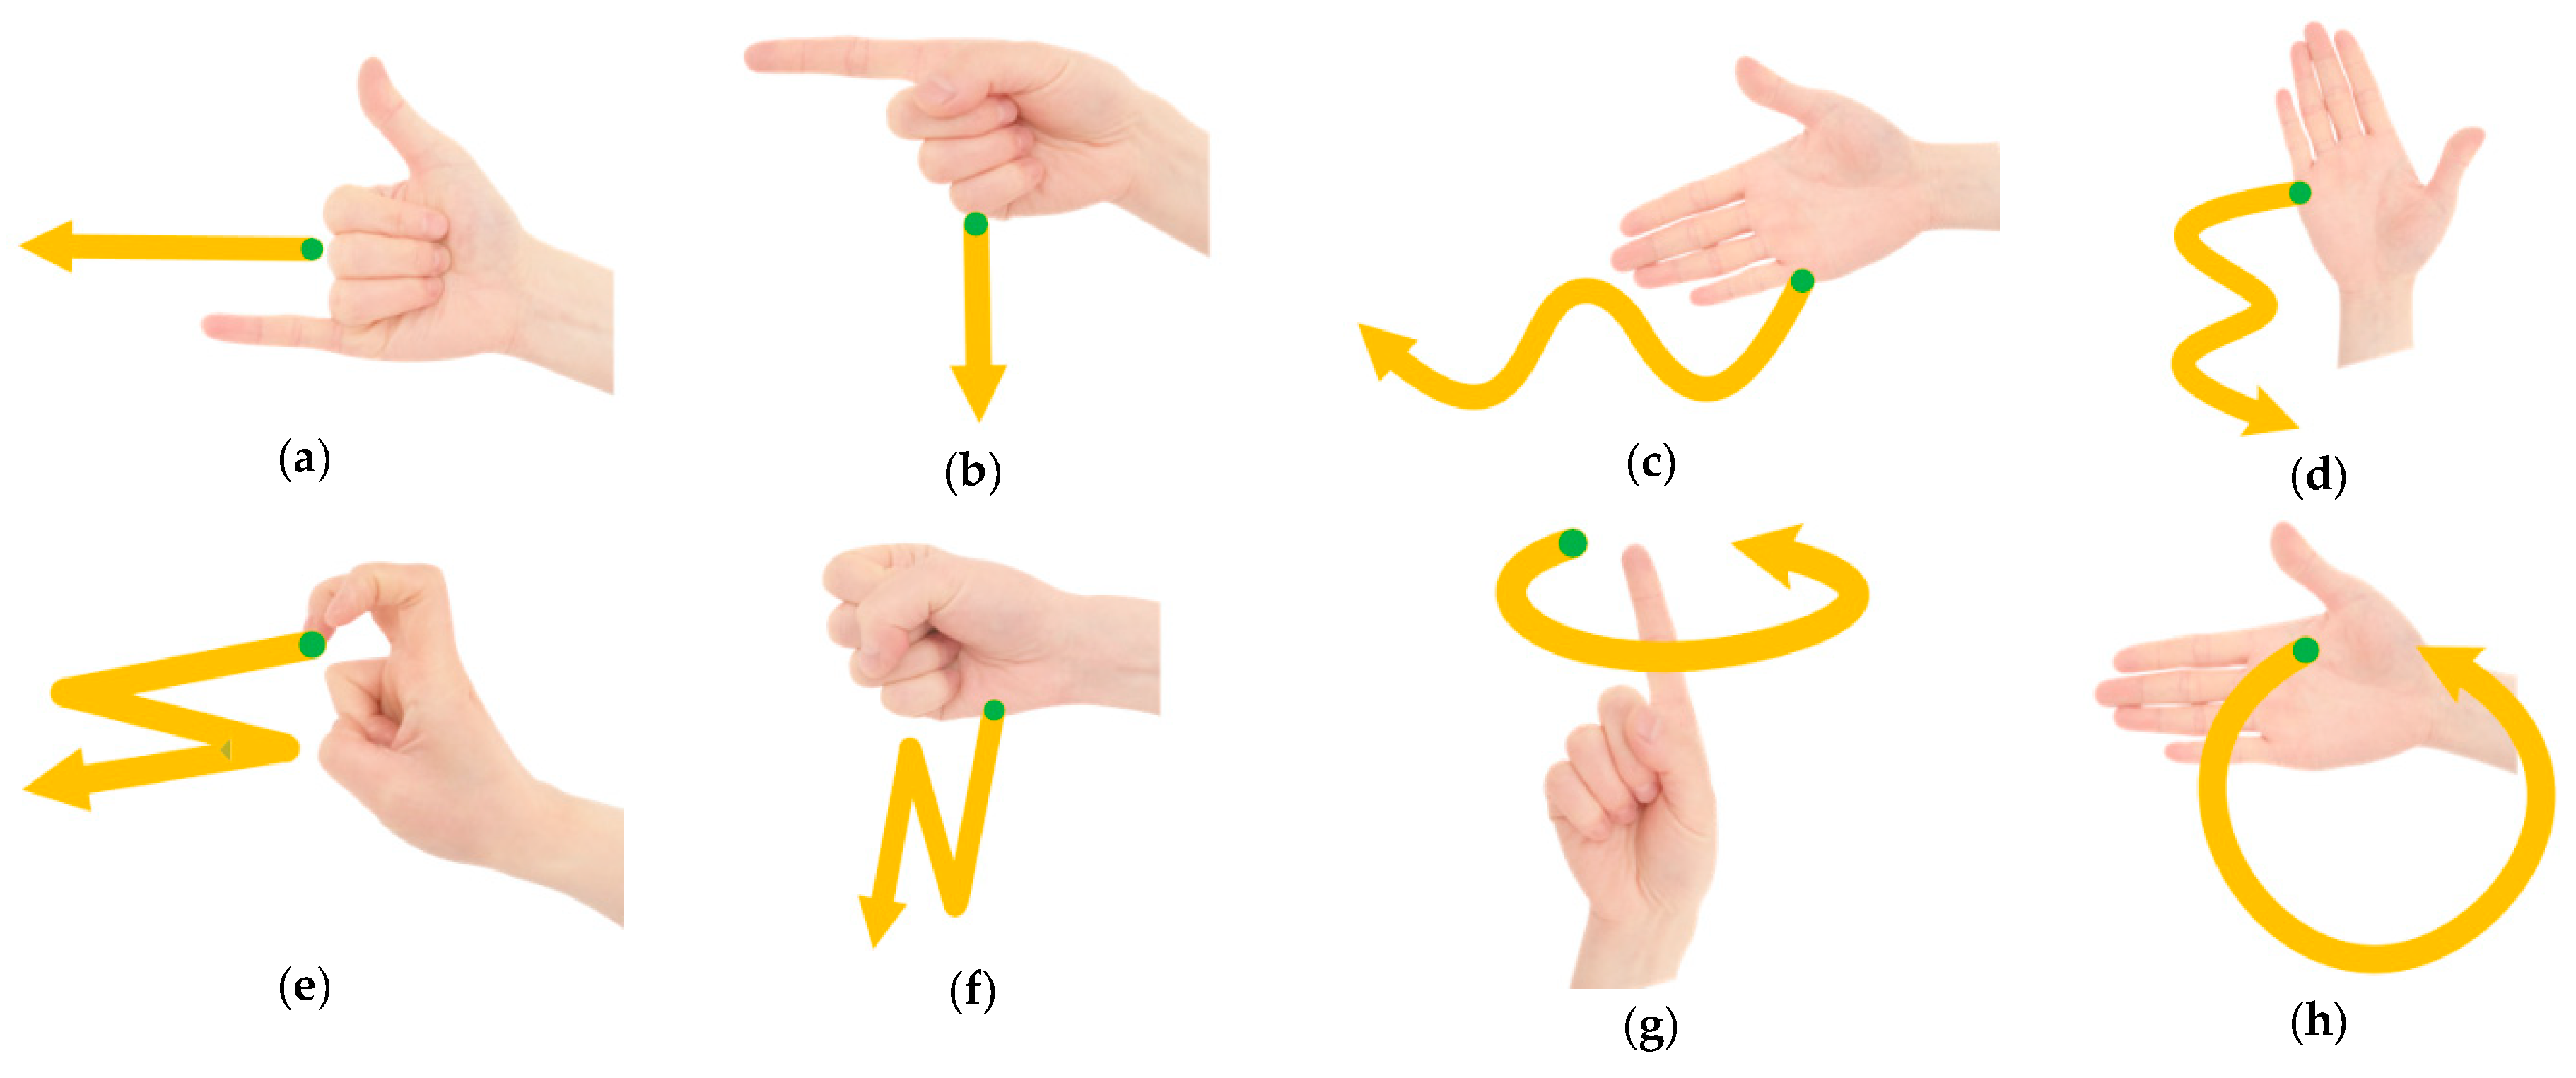
2.2. Trajectory Category

According to the analysis and induction of more than 100 kinds of high-frequency words [26] in Chinese SL, many words have great similarities in movement trajectory and can be divided into eight categories, as shown in Figure 2, after repeated induction. The description of trajectory category and corresponding vocabularies are shown in Table 1.

2.3. Data Acquisition

In this paper, Delsys-Trigno is used to collect the motion information when the SL is acted. The Trigno sensor is equipped with a three-axis accelerometer and a three-axis gyroscope, which can collect ACC and AV signals of SL action in real time. At the same time, the system is equipped with signal acquisition and transmission software, which greatly facilitates the acquisition experiment of motion information. The sensor is attached to the wrist of the subject, as shown in Figure 3.

2.4. Modeling Method of Trajectory

In SL movement trajectory modeling, ACC data cannot be directly integrated to obtain the exact displacement curve. Shaking or rotation of the hand changes the spatial direction of the wearing sensor and consequently, the coordinate system of the ACC sensor [14]. Transforming the measured ACC data into a fixed coordinate system, such as a geographic coordinate system, is necessary for an accurate trajectory detection.
The geographical coordinate system of the moving object is assumed to be O X Y Z , and the carrier coordinate system is O X 0 Y 0 Z 0 , as shown in Figure 4a. The transformation between coordinate systems can be realized by continuous rotation, as shown in Figure 4b. The specific transformation process can be referred to in References [14,27]. O X 0 Y 0 Z 0 transformation to O X Y Z can be obtained as follows:
[ x y z ] = [ 1 0 0 0 cos α sin α 0 sin β cos α ] [ cos β 0 sin β 0 1 0 sin β 0 cos β ] [ cos γ sin γ 0 sin γ cos γ 0 0 0 1 ] [ x 0 y 0 z 0 ] = [ cos γ cos β sin γ cos α + cos γ sin β sin α sin γ sin α cos γ sin β cos α sin γ cos β cos γ cos α + cos γ sin β sin α cos γ sin α sin γ sin β cos α sin β cos β sin α cos β cos α ] [ x 0 y 0 z 0 ] = C e b [ x 0 y 0 z 0 ]
where [ x , y , z ] T and [ x 0 , y 0 , z 0 ] T are the ACC vectors of the geographical coordinate system and the sensor carrier coordinate system respectively, and C e b is the rotation matrix indicating the transformation relationship between two coordinate systems. α , β , and γ are angle values that can be calculated by integrating the collected AV signals.
After the coordinate transformation, the ACC vector will not be affected by the change of the sensor carrier direction. The trajectory curve can be obtained after the integration operation. Simpson integral is an approximate numerical integration method that uses conic approximation instead of trapezoid or rectangular integration to obtain the integral value.
For a given conic g ( x ) = α x 2 + β x + γ , the definite integral for g ( x ) is as follows:
G ( x ) = 0 x g ( x ) d x = α x 3 3 + β x 2 2 + γ x + d
where d is constant.
In the plane rectangular coordinate system, by fitting f ( x ) with parabola determined by ( x 0 , g ( x 0 ) ) , ( x 1 , g ( x 1 ) ) , and ( x 2 , g ( x 2 ) ) (where x 1 = x 0 + x 2 2 ), the approximate integral value on the interval [ x 0 , x 2 ] is obtained as follows:
x 0 x 2 f ( x ) d x G ( x 2 ) G ( x 0 ) = α x 2 3 α x 0 3 3 + β x 2 2 β x 0 2 2 + γ x 2 γ x 0
After Formula (3) is simplified, the Simpson integral formula of f ( x ) on interval [ a , b ] can be obtained as:
a b f ( x ) d x b a 6 [ f ( a ) + 4 f ( a + b 2 ) + f ( b ) ]
The low sampling rate system will generate large error to the Simpson integral’s three-point fitting method. Many points will affect the calculation speed. An adaptive method is used to solve the trajectory for computation and error precision.
The integral interval is divided, and c is set as the midpoint of interval [ a , b ] . If the following formula holds, then the recursive operation is completed:
| S ( a , c ) + S ( c , b ) S ( a , b ) | < 15 ε
where S is Simpson’s formula and ε is error precision. If the above formula does not hold, then the interval [ a , c ] and [ c , b ] need to be further divided and iterated until the requirements of Formula (5) are satisfied. After the double integration of ACC data by the adaptive Simpson method, the vivid and intuitive 3D trajectory curve of SL movement is constructed and lays a foundation for the following trajectory recognition.

2.5. GLR-DTW Algorithm

DTW, which measures the similarity of two different length time series to effectively solve the expansion and migration of the series on the time axis, was proposed by Itakura and has been widely used in speech recognition and data mining [28,29,30]. The speech signal has great randomness, different people have varying pronunciations and speech speeds and drag sound sometimes appears. The SL movement trajectory features are similar to this speech feature. Hence, DTW can be applied to classify the SL movement trajectory.
The traditional DTW algorithm aims to measure a single dimension time series and uses Euclidean distance as the distance measure [9,31]. If the three-axis motion signals are warped separately, then the length of the warped signal sequence of each axis will differ, resulting in the serious distortion of the 3D trajectory. Holt et al. [32] extended the DTW algorithm to measure multidimensional time series but ignored the correlation between different dimensions when calculating the two sequences’ distance. Mahalanobis distance (MD) [33,34] is a method of calculating the similarity of two sequences, as proposed by Mahalanobis. In this paper, the GLR-DTW algorithm uses MD to expand the dimension of time series and modifies the activation function of GLR to construct the regression coefficient of the MD matrix network, which can achieve the accurate matching of local shape characteristic points while taking into account the correlation of three-axis motion signals.
For a given multidimensional time series X = { X i , i = 1 , 2 , n } and Y = { Y j , j = 1 , 2 , m } , where { X i = { x k i , k = 1 , 2 , q } T Y j = { y k j , k = 1 , 2 , q } T .
In the formula, X is the template sequence, Y is the test sequence, n and m are the lengths of X and Y respectively, and q is the dimension of X and Y . With emphasis on the 3D signal sequence, the value of q is set to 3.
The distance between any two points in the X and Y sequence can be expressed as:
d ( X i , Y j ) = ( X i Y j ) T 1 ( X i Y j )
where is the covariance matrix of the template sequence X [23]. The matrix network of MD is constructed as follows:
[ d ( X 1 , Y 1 ) d ( X 2 , Y 1 ) d ( X n , Y 1 ) d ( X 1 , Y 2 ) d ( X 2 , Y 2 ) d ( X n , Y 2 ) d ( X 1 , Y m ) d ( X 2 , Y m ) d ( X n , Y m ) ]
When searching the best path in the matrix network, the following constraints must be met.
The boundedness constraint should be followed, that is, starting from the starting point d ( X 1 , Y 1 ) to the ending point d ( X n , Y m ) . The monotonicity and continuity constraint should be followed, that is, if the current node is d ( X i , Y j ) , then the next node must be selected between d ( X i + 1 , Y j ) , d ( X i , Y j + 1 ) , and d ( X i + 1 , Y j + 1 ) , and the path must be the shortest.
Therefore, the recursive algorithm of GLR-DTW is as follows:
{ d i , j = λ i j d ( X i , Y j ) 2 = λ i j ( X i Y j ) T 1 ( X i Y j ) D ( i , j ) = d i , j + min { D ( i 1 , j ) , D ( i , j 1 ) , D ( i 1 , j 1 ) } D ( 1 , 1 ) = d 1 , 1
where D ( i , j ) is the cumulative distance from d 1 , 1 to d i , j , which is the criterion of similarity measure. λ i j is the regression coefficient of the distance network optimized by the GLR model.
The sigmoid activation function of the GLR model is:
S ( z ) = 1 1 + e z
Through the extreme value detection of time series, the activation function S ( z ) is modified according to the extreme value characteristics, and the regression coefficient of the matrix network is constructed. Accurate matching of local shape characteristic points is achieved in the sequence warping. The construction process is as follows:
U X = { μ k i , i = 1 , 2 , n , k = 1 , 2 , q } and U Y = { μ k j , j = 1 , 2 , m , k = 1 , 2 , q } , representing the characteristic points of X and Y , are obtained through extremum detection.
Among them, the rules for μ k i and μ k j values are as follows:
(1)
The value is 1 when the detection is a local maximum point.
(2)
The value is –1 when the detection is a local minimum point.
(3)
The value is 0 when the detection is a non-extreme point.
Therefore, the value of | μ k i μ k j 1 | can be calculated as:
(1)
The value is 0 when μ k i = 1 , μ k j = 1 or μ k i = 1 , μ k j = 1 ; that is, the maximum point matches the maximum point, or the minimum point matches the minimum point.
(2)
The value is 1 when at least one of μ k i and μ k j is 0; that is, the non-extreme point matches the other points.
(3)
The value is 2 when μ k i = 1 , μ k j = 1 or μ k i = 1 , μ k j = 1 ; that is, the maximum point matches the minimum point.
The above values are combined to modify the activation function, and the regression coefficient of the distance matrix network is obtained as follows:
λ i j = C 1 + exp ( g k = 1 q | μ k i μ k j 1 | )
where q is the dimension of time series, C is the maximum regression coefficient, which is a constant set as 2 in the simulation experiment, g is the non-linear curvature, and the curve λ ( z ) = C 1 + exp ( g z ) with different g value is shown in Figure 5.
The simulation results show that when g [ 0.02 , 0.1 ] , λ i j has good linearity, and when g [ 0.1 , 0.2 ] , λ i j has good optimization effect, and the value is 0.2 in the following experiment. When g = 1 , λ i j changes into standard sigmoid function.
Analysis results revealed that the value range of λ i j is [C/2, C]. If “maximum to maximum point” or “minimum to minimum point” matching occurs in all dimensions of the sequence, then | μ k i μ k j 1 | = 0 , and λ i j is always equal to the minimum C/2. The regression coefficient is the smallest, the distance measurement of the two sequences is reduced, and the similarity increases. Otherwise, the distance of the two sequences increases. DTW optimized by the regression coefficient realizes the calculation of amplitude distance and considers the shape characteristics of time series to avoid abnormal matching.
In path warping, the index numbers of the sequence are recorded. w ¯ x ( k ) and w ¯ y ( k ) are the index numbers of X and Y , respectively. The optimal path can then be expressed as follows:
W ¯ = ( w ¯ x ( k ) w ¯ y ( k ) ) ,   k = 1 , 2 , 3 , p
where p [ max ( n , m ) , n + m ] , which is the length of the new sequence.
The optimal warping path, W ¯ , is obtained, and the sequences X ¯ ( k ) and Y ¯ ( k ) are extended from X i and Y j by W ¯ . The sequences after dynamic warping are expressed as follows:
{ X ¯ ( k ) = X ( w ¯ x ( k ) ) Y ¯ ( k ) = Y ( w ¯ y ( k ) ) ,   k = 1 , 2 , 3 , p

3. Results and Discussion

3.1. Template Trajectory Library

In the experiment of recognition of the SL movement trajectory, eight kinds of standard SL movement trajectory libraries should be established as the template trajectory of algorithm input, as shown in Figure 6. A SL teacher from a deaf school in Hangzhou was invited as the SL instructor. After wearing the Trigno sensor, the eight kinds of movements in Figure 2 were executed successively, and the ACC and AV signals of corresponding movements were collected as the motion information of the template trajectory library.
Another 10 healthy volunteers (5 males and 5 females) were recruited. After repeated training of eight kinds of movements, wearing the Trigno sensor, each volunteer performed the eight movements at regular speed (about 300 ms each movement, equivalent to the speed of template trajectory) and fast speed (about 200 ms each movement), recording the corresponding ACC and AV signals.

3.2. Experiment of Movement Trajectory Modeling

In order to facilitate the observation and analysis of the experimental results, the “vertical wave-shape movement” was selected as an example to show the experimental process of trajectory classification. Figure 7a,c presents the collected three-axis ACC and AV signals of vertical wave-shape movement (VWM) in the template library, and Figure 7b,d shows the collected three-axis ACC and AV signals of the faster VWM (fVWM), respectively. In these figures, ACCx, ACCy and ACCz represent the ACC signals of the x-, y-, and z-axis respectively, and AVx, AVy and AVz represent the AV signals of the x-, y-, and z-axis, respectively. The dashed boxes in the two figures are the effective signal intervals to represent these two groups of movements. VWM takes about 300 ms, while fVWM takes 200 ms.
Observation and analysis of Figure 7 showed that even with the same wave-shaped movement curve, the speed of movement directly leads to differences in ACC and AV signal characteristics, thus complicating the movement recognition. In addition, the six-dimensional (6D) data input of ACC and AV signals increases the training burden of the pattern classifier.
Figure 8a displays the waveform of VWM ACC signals after coordinate conversion, and Figure 8b shows the waveform of fVWM ACC signals after coordinate conversion. TSx, TSy and TSz represent the ACC signals of the x-, y-, and z-axis respectively, in the geographic coordinate system. The two figures only include the waveform of the effective movement interval for comparison and observation. Comparative analysis indicated that the ACC curves have shown a certain similar trend after the transformation of the two groups.
Figure 9 shows a 3D trajectory obtained by using the adaptive Simpson integral for the signals of Figure 8. In the figure, the red line is the VWM trajectory, and the blue line is the fVWM trajectory. The wave-shape characteristics of the two curves are visible in this figure. The modeling of movement trajectory greatly reduces the dimension of the eigenvector and greatly decreases the design complexity of the pattern classifier.

3.3. Experiment of GLR-DIW

The 3D trajectories of VWM and fVWM were restored and modeled. In order to verify the effectiveness of the GLR-DTW algorithm, the above VWM and fVWM trajectories were encoded to the DTW and GLR-DTW algorithms respectively, and the new trajectories, after warping, were compared, as shown in Figure 10. In the figure, the red line is the warped VWM trajectory, and the blue line is the warped fVWM trajectory. The algorithm cannot directly find the differences because it warps on the time axis, which is not reflected by the 3D coordinate map. Therefore, the expansions of the two output trajectory sequences on the time axis were analyzed and compared, as shown in Figure 11.
In Figure 11a, the TPLx, TPLy and TPLz are the x-, y-, and z-axis data of the template sequence, i.e., VWM trajectory, respectively, and TSTx, TSTy and TSTz are the x-, y-, and z-axis data of the test sequence, i.e., fVWM trajectory, respectively. The three solid lines and dashed lines in Figure 11b are two sets of new sequence output by the DTW algorithm. Given that the Euclidean distance is used in the DTW algorithm, the correlation among varying dimensional data is ignored in the multidimensional time series calculation. In Figure 11b, DTW only considers the sequence characteristic of the largest amplitude dimension, leading to the abnormal matching of other dimension sequences. The matching of local peak point and valley point appears at symbol 1.
The three solid lines and dashed lines in Figure 11c are two sets of new sequence output by the GLR-DTW algorithm. Given that GLR-DTW first uses MD as the distance measure of the algorithm, the sequences can achieve synchronous warping under the premise of considering the correlation of 3D data. In addition, the regression coefficient of the algorithm is optimized to achieve the accurate matching of local extreme value characteristics, thereby solving the abnormal matching problem of DTW, as shown in symbol 2 of Figure 11c. Observation and analysis revealed that the interpolation point at symbol 3 in Figure 11c is the acceleration area of the fVWM trajectory with fast speed and short time. When the sequence is matched, sequence stretching is achieved. After constant warping, the lengths of the two sets of sequences are equalized.
In summary, GLR-DTW is better than traditional DTW in the recognition of movement trajectory and solves the drawback of abnormal matching. It is helpful to improve the accuracy of movement trajectory classification.

3.4. Similarity Measurement and Classification

The calculation process of the GLR-DTW algorithm is actually searching the best path—the shortest cumulative distance between two sets of sequences. After the search is completed, the distance between sequences was also calculated. When measuring the similarity of two trajectory sequences, one group of trajectories of a volunteer (subject A) and trajectories of the template library were selected and encoded in turn to the GLR-DTW algorithm designed in this paper. The distance between the two sequences was obtained as the basis for similarity measurement. Specific data are listed in Table 2.
The eight sequences all intercept 30 points because the distance between every two trajectory sequences is also related to the number of sequence points. Table 2 shows that the distance of the same movement trajectory between two subjects is between 10 and 50, and the distance of a different movement trajectory is basically more than 1000. The difference ratio between different and similar trajectory features is 1000/50 = 20, indicating large variation. Therefore, this distance measurement method is feasible as a recognition criterion for different SL movement trajectories.
The volunteer’s test trajectory and the eight template trajectories are warped one-by-one and the distance is calculated. If a group with the smallest distance among them is found, and the difference ratio between other groups and this group are all greater than 20, then this group is classified into the same category. Volunteers’ SL act at the regular speed and faster speed, i.e., each movement had 20 trajectory data, which encoded to HMM, DTW, and GLR-DTW for comparison, respectively. The correct recognition number comparison of HMM, DTW, and GLR-DTW are shown in Table 3. Among the three methods, the average accuracy of GLR-DTW proposed in this paper is the highest, reaching 86.25%, which is 3.12% better than the traditional DTW.
Time complexity is the time spent from the end of trajectory signals’ acquisition to the conclusion of recognition, which is mainly a measure of the real-time performance of the algorithm. The HMM algorithm strongly depends on the training samples, and the parameter model can be obtained through repeated calculation, which has a large amount of calculation and takes a long time. Therefore, HMM has the longest calculation time among the three methods. Due to the addition of the covariance matrix and regression coefficient calculation, the response time of GLR-DTW is slightly longer than that of DTW, and the average response time is about 140 ms, as shown in Table 4. However, with a response time of 140 ms, users can hardly detect the delay of the recognition process, and the real-time performance is good. Therefore, the real-time performance of the GLR-DTW algorithm meets the requirements of the real-time system.
Figure 12 shows the recognition of the GLR-DTW algorithm under the conditions of regular speed and fast speed. According to the observation in this figure, the classification accuracy of eight kinds of trajectories is basically the same under different speed conditions. The action arm length of SL was different between male and female volunteers, but it had no effect on recognition results. Therefore, the trajectory classification based on GLR-DTW solves the recognition problem of SL movement trajectory deviation under different speed conditions and different arm conditions.

4. Conclusions

SL movement trajectory recognition is an important research direction for SL translation. This paper deeply discussed a method of SL movement trajectory recognition based on GLR-DTW. First, the algorithm collected ACC and AV information during SL execution, transformed 6D original data into 3D feature data through a trajectory modeling algorithm, and output a 3D trajectory curve with many intuitive features. The DTW algorithm optimized by modifying GLR activation function was then used to warp movement trajectories. Finally, similarity measures were employed to identify different types of SL movement. Experimental results show that this method effectively recognizes SL movement trajectory. A large difference was observed between the inter- and intra-class features of movement trajectory; hence, the generalization ability of the algorithm can be effectively improved. In addition, the method reduced the dimension of the input eigenvector, greatly simplified the complexity of the pattern classifier, and has a certain reference value for the processing of similar trajectories.
This paper also discussed the problem of trajectory classification under different speed and different arm conditions in detail. This method can reconstruct the original 3D trajectory curve through the motion information and has good robustness to the trajectory classification under different conditions. Compared with the traditional DTW method, the method proposed in this paper has a great improvement in the problem of abnormal matching of trajectory classification. In the future work, the method proposed in this paper will be coupled with the existing hand shape and gesture recognition systems and try to be transplanted to a real-time system. However, it is worth noting that this study only examines healthy people. In the next step, we will cooperate with the rehabilitation institution to do further experiments and research, and test the method proposed in this paper on a group of deaf patients under physical therapy.

Author Contributions

All authors contributed to this paper. Conceptualization and methodology, W.L. and Z.L.; Software, W.L.; Validation, Z.L.; Formal analysis and investigation, W.L., Z.L., and X.X.; Data curation, W.L.; Writing—Original draft preparation, W.L.; Writing—Review and editing, Z.L. and X.X.; Funding acquisition, Z.L. All authors have read and agreed to the published version of the manuscript.

Funding

This work was supported by the National Natural Science Foundation of China (Nos. 61671197 and 61971169).

Conflicts of Interest

The authors declare no conflict of interest.

References

  1. Kumar, P.; Gauba, H.; Roy, P.P.; Dogr, D.P. A Multimodal Framework for Sensor based Sign Language Recognition. Neurocomputing 2017, 259, 21–38. [Google Scholar] [CrossRef]
  2. Bantupalli, K.; Xie, Y. American Sign Language Recognition using Deep Learning and Computer Vision. In Proceedings of the 2018 IEEE International Conference on Big Data (Big Data), Seattle, WA, USA, 10–13 December 2018; pp. 4896–4899. [Google Scholar]
  3. Mittal, A.; Kumar, P.; Roy, P.P.; Balasubramanian, R.; Chaudhuri, B.B. A Modified LSTM Model for Continuous Sign Language Recognition Using Leap Motion. IEEE Sens. J. 2019, 19, 7056–7063. [Google Scholar] [CrossRef]
  4. Yang, P.; Chen, X.; Li, Y.; Wang, W.; Yang, J. A Sign Language Recognition Method Based on Multi-sensor Information. Space Med. Med. Eng. 2012, 25, 276–281. [Google Scholar]
  5. Yang, X.; Chen, X.; Cao, X.; Wei, S.; Zhang, X. Chinese Sign Language Recognition Based on an Optimized Tree-Structure Framework. IEEE J. Biomed. Health Inform. 2017, 21, 994–1004. [Google Scholar] [CrossRef]
  6. Naik, G.R.; Al-Timemy, A.H.; Nguyen, H.T. Transradial Amputee Gesture Classification Using an Optimal Number of sEMG Sensors: An Approach Using ICA Clustering. IEEE Trans. Neural Syst. Rehabil. Eng. 2016, 24, 837–846. [Google Scholar] [CrossRef]
  7. Kosmidou, V.E.; Hadjileontiadis, L.J. Sign language recognition using intrinsic-mode sample entropy on sEMG and accelerometer data. IEEE Trans. Biomed. Eng. 2009, 56, 2879–2890. [Google Scholar] [CrossRef]
  8. Caputo, F.M.; Prebianca, P.; Carcangiu, A.; Spano, L.D.; Giachetti, A. Comparing 3D trajectories for simple mid-air gesture recognition. Comput. Graph. 2018, 73, 17–25. [Google Scholar] [CrossRef]
  9. Junhua, G.; Junsheng, X.; Hongpu, L. Application of an improved DTW algorithm in human behavior recognition. J. Hebei Univ. Technol. 2018, 47, 17–20. [Google Scholar]
  10. Yang, J.; Yuan, J.; Li, Y. Parsing 3D motion trajectory for gesture recognition. J. Vis. Commun. Image Represent. 2016, 38, 627–640. [Google Scholar] [CrossRef]
  11. Savur, C.; Sahin, F. American sign language recognition system by using surface EMG signal. In Proceedings of the IEEE International Conference on Systems, Man, and Cybernetics, Budapest, Hungary, 9–12 October 2016; pp. 2872–2877. [Google Scholar]
  12. Wu, J.; Sun, L.; Jafari, R. A Wearable System for Recognizing American Sign Language in Real-Time Using IMU and Surface EMG Sensors. IEEE J. Biomed. Health Inform. 2016, 20, 1281–1290. [Google Scholar] [CrossRef]
  13. Zhang, X.; Chen, X.; Li, Y.; Lantz, V.; Wang, K.; Yang, J. A Framework for Hand Gesture Recognition Based on Accelerometer and EMG Sensors. IEEE Trans. Syst. Man Cybern. Part A Syst. Hum. 2011, 41, 1064–1076. [Google Scholar] [CrossRef]
  14. Liu, J. Research and Design of Air Handwriting Trajectory Detection System. Master’s Thesis, Chengdu University of Technology, Chengdu, China, 28 May 2017. [Google Scholar]
  15. Yaokai, P. Dynamic Gesture Trajectory Recognition Based on HMM. Master’s Thesis, Beijing Jiaotong University, Beijing, China, June 2017. [Google Scholar]
  16. Chen, J. Research on Gesture Recognition and Human Activity Analysis Based on Surface Electromyography and Acceleration Signals. Ph.D. Thesis, University of Science and Technology of China, Hefei, China, 4 May 2013. [Google Scholar]
  17. Okawa, M. Template Matching Using Time-Series Averaging and DTW with Dependent Warping for Online Signature Verification. IEEE Access 2019, 7, 81010–81019. [Google Scholar] [CrossRef]
  18. Tormene, P.; Giorgino, T.; Quaglini, S.; Stefanelli, M. Matching incomplete time series with dynamic time warping: An algorithm and an application to post-stroke rehabilitation. Artif. Intell. Med. 2009, 45, 11–34. [Google Scholar] [CrossRef]
  19. Shen, J.; Huang, W.; Zhu, D.; Liang, J. A novel similarity measure model for multivariate time series based on LMNN and DTW. Neural Process. Lett. 2017, 45, 925–937. [Google Scholar] [CrossRef]
  20. Xu, L.; Chen, K.; Guo, Y. Sparse floating car data filling based on NB and DTW combined model. J. Zhongshan Univ. 2019, 58, 136–145. [Google Scholar]
  21. Lei, J.; Ma, W.J.; Chang, D.H. Gesture Acceleration Signals Recognition Based on Dynamic Time Warping. Chin. J. Sens. Actuators 2012, 25, 72–76. [Google Scholar]
  22. Jeong, Y.S.; Jeong, M.K.; Omitaomu, O.A. Weighted Dynamic Time Warping for Time Series Classification. Pattern Recognit. 2011, 44, 2231–2240. [Google Scholar] [CrossRef]
  23. Chou, Y.T.; Yang, J.F.K. Object recognition based on generalized linear regression classification in use of color information. In Proceedings of the 2014 IEEE Asia Pacific Conference on Circuits and Systems (APCCAS), Ishigaki, Japan, 17–20 November 2014. [Google Scholar]
  24. Chou, Y.T.; Yang, J.F. Identity recognition based on generalised linear regression classification for multi-component images. IET Comput. Vis. 2016, 10, 18–27. [Google Scholar] [CrossRef]
  25. Krueger, D.C.; Montgomery, D.C.; Mastrangelo, C.M. Application of Generalized Linear Models to Predict Semiconductor Yield Using Defect Metrology Data. IEEE Trans. Semicond. Manuf. 2011, 24, 44–58. [Google Scholar] [CrossRef]
  26. China Association for the Deaf. Chinese Sign Language, 2nd ed.; Huaxia Press: Beijing, China, 2003. [Google Scholar]
  27. Ren, M. An Acceleration-Sensor-Based Trajectory Detection System of a Moving Object. Master’s Thesis, Nanjing University of Posts and Telecommunications, Nanjing, China, June 2013. [Google Scholar]
  28. Zhou, Z.; Mao, M. Dynamic time warping gesture authentication algorithm based on improved Mahalanobis distance. J. Comput. Appl. 2015, 35, 1467–1470. [Google Scholar]
  29. He, S.Q.; Liang, X.Y.; Yan, C.L.; Guo, B.; Liu, H. New method for gait recognition on combinability of multi-scale entropy and dynamic time warping algorithm. J. Chongqing Univ. 2018, 41, 84–91. [Google Scholar]
  30. Yangyang, X.; Yuansheng, L.; Guozhong, S. An Improvement Algorithm for Improving the Computing Efficiency of DTW Algorithm. Comput. Digit. Eng. 2019, 47, 530–534. [Google Scholar]
  31. Qi, M.Y.; Li, Y.X.; Ta, H. A similarity metric algorithm for multivariate time series based on information entropy and DTW. J. Zhongshan Univ. 2019, 58, 1–8. [Google Scholar]
  32. Ten Holt, G.A.; Reinders, M.J.; Hendriks, E.A. Multi-dimensional dynamic time warping for gesture recognition. In Proceedings of the Thirteenth Annual Conference of the Advanced School for Computing and Imaging (ASCI 2007), Heijen, The Netherlands, 13–15 June 2007; pp. 1–8. [Google Scholar]
  33. Rrdlh, G.C.; Kalogirou, S.A.; Christodoulides, P. Wind farm monitoring using Mahalanobis distance and fuzzy clustering. Renew. Energy 2018, 123, 526–540. [Google Scholar]
  34. Yan, W.; Xianghui, Q.; Yaxi, D. Image segmentation of FCM algorithm based on kernel function and Markov distance. Appl. Res. Comput. 2018, 37, 2. [Google Scholar]
Figure 1. Schematic showing the trajectory recognition steps.
Electronics 09 01400 g001
Figure 2. Schematic diagram of eight kinds of sign language (SL) movement trajectories. (a) Horizontal straight-line movement; (b) Vertical straight-line movement; (c) Horizontal wave-shape movement; (d) Vertical wave-shape movement; (e) Horizontal shaking; (f) Vertical shaking; (g) Horizontal circular arc movement; (h) Vertical circular arc movement.
Electronics 09 01400 g002
Figure 3. Schematic diagram of the data acquisition system.
Electronics 09 01400 g003
Figure 4. Schematic diagram of coordinate transformation. (a) Carrier coordinate system and (b) transformation of coordinate system.
Electronics 09 01400 g004
Figure 5. Graph of different g values.
Electronics 09 01400 g005
Figure 6. Establish template trajectory library.
Electronics 09 01400 g006
Figure 7. Collected raw signals of wave-shape movement at the two speeds. (a) Acceleration (ACC) signals of VWM, (b) ACC signals of fVWM, (c) Angular velocity (AV) signals of VWM, and (d) AV signals of fVWM.
Electronics 09 01400 g007aElectronics 09 01400 g007b
Figure 8. ACC curves after coordinate conversion. (a) Curves of VWM and (b) curves of fVWM.
Electronics 09 01400 g008
Figure 9. Three-dimensional (3D) trajectories diagram of VWM and fVWM.
Electronics 09 01400 g009
Figure 10. 3D trajectories diagram of VWM and fVWM warped by DTW for GLR model optimization (GLR-DTW).
Electronics 09 01400 g010
Figure 11. Expansions of the two output trajectory sequences on the time axis. (a) Input sequences, (b) output sequences of DTW, and (c) output sequences of GLR-DTW.
Electronics 09 01400 g011
Figure 12. The correct recognition number of GLR-DTW.
Electronics 09 01400 g012
Table 1. Description of eight kinds of trajectory and corresponding vocabulary.
NumberName of TrajectoryAbbreviationChinese SL Vocabulary 1Example
1Horizontal straight-line movementHLMDa 2; Chang 3Figure 2a
2Vertical straight-line movementVLMWen 4; Man 5Figure 2b
3Horizontal wave-shape movementHWMJiang 6; Ge 7Figure 2c
4Vertical wave-shape movementVWMBaxi 8; Yidali 9Figure 2d
5Horizontal shakingHSRenshi 10; Jianmian 11Figure 2e
6Vertical shakingVSJintian 12; Gaoxing 13Figure 2f
7Horizontal circular arc movementHCMYun 14; Renmin 15Figure 2g
8Vertical circular arc movementVCMYiqie 16; Dou 17Figure 2h
1 The Pinyin of Chinese characters will be explained here. 2 Big. 3 Long. 4 Warm. 5 Full. 6 River. 7 Song. 8 Brazil. 9 Italy. 10 Understanding. 11 Meeting. 12 Today. 13 Happy. 14 Cloud. 15 People. 16 Everything. 17 All.
Table 2. Distance measurement of the two trajectory sequences.
A’s HLMA’s HLMA’s HWMA’s VWMA’s HSA’s VSA’s HCMA’s VCM
Template HLM12.19023434.371554.331773.512494.582534.455705.325680.11
Template VLM3197.8416.94221802.921443.562534.472434.905669.265757.40
Template HVM1500.871834.0038.02774234.381034.201234.365098.205811.52
Template VWM1744.701434.904434.7841.32891206.50982.115985.744919.94
Template HS2344.232601.311022.391324.5826.39753344.394080.323891.13
Template VS2543.782450.851234.761014.703534.4329.00434191.204000.12
Template HCM5971.255008.245191.705888.944091.334229.3240.19742998.78
Template VCM5592.405729.095891.155191.533990.824077.042833.7845.2332
Table 3. The comparison of correct recognition number.
-Number of SamplesHMM [32]DTWGLR-DTW
HLM trajectory20191920
VLM trajectory20181919
HWM trajectory20171818
VWM trajectory20181517
HS trajectory20171617
VS trajectory20161818
HCM trajectory20151314
VCM trajectory20141515
Average accuracy-83.75%83.13%86.25%
Table 4. The comparison of time complexity (ms).
HMM [32]DTWGLR-DTW
HLM trajectory207.3104.7123.0
VLM trajectory198.4102.1122.7
HWM trajectory221.4131.4148.1
VWM trajectory208.9123.2153.2
HS trajectory204.6120.8139.3
VS trajectory193.0117.0134.8
HCM trajectory211.1131.2154.4
VCM trajectory216.8138.5150.6
Average time207.7121.1140.8

