Article

Multi-Channel Transfer Learning of Chest X-ray Images for Screening of COVID-19

1
Opticho, Pohang 37673, Korea
2
Department of Electrical Engineering, Creative IT Engineering, Mechanical Engineering, Graduate School of Artificial Intelligence, and Medical Device Innovation Center, Pohang University of Science and Technology (POSTECH), Pohang 37673, Korea
3
Department of Bioengineering, University of Washington, Seattle, WA 98195, USA
4
Artificial Intelligence Application Research Section, Electronics and Telecommunications Research Institute (ETRI), Daegu 42994, Korea
*
Authors to whom correspondence should be addressed.
Electronics 2020, 9(9), 1388; https://doi.org/10.3390/electronics9091388
Submission received: 22 July 2020 / Revised: 15 August 2020 / Accepted: 23 August 2020 / Published: 27 August 2020
(This article belongs to the Special Issue Optical Sensing for Biomedical Applications)

Abstract

:
The 2019 novel coronavirus (COVID-19) has spread rapidly all over the world. The standard test for screening COVID-19 patients is the polymerase chain reaction test. As this method is time consuming, as an alternative, chest X-rays may be considered for quick screening. However, specialization is required to read COVID-19 chest X-ray images as they vary in features. To address this, we present a multi-channel pre-trained ResNet architecture to facilitate the diagnosis of COVID-19 chest X-ray. Three ResNet-based models were retrained to classify X-rays in a one-against-all basis from (a) normal or diseased, (b) pneumonia or non-pneumonia, and (c) COVID-19 or non-COVID19 individuals. Finally, these three models were ensembled and fine-tuned using X-rays from 1579 normal, 4245 pneumonia, and 184 COVID-19 individuals to classify normal, pneumonia, and COVID-19 cases in a one-against-one framework. Our results show that the ensemble model is more accurate than the single model as it extracts more relevant semantic features for each class. The method provides a precision of 94% and a recall of 100%. It could potentially help clinicians in screening patients for COVID-19, thus facilitating immediate triaging and treatment for better outcomes.

1. Introduction

Coronavirus was detected as a human pathogen in the mid-1960s. It infects humans and a wide range of animals (including birds and mammals). Since 2002, two coronaviruses infecting animals have evolved and caused outbreaks in humans: SARS-CoV (Severe Acute Respiratory Syndrome) identified in Southern China in 2003 and MERS-CoV (Middle East Respiratory Syndrome) identified in Saudi Arabia in 2012 [1,2]. The new coronavirus disease of 2019 (COVID-19) was first identified in Wuhan, China in December 2019. Since then, COVID-19 has spread globally, resulting in the ongoing pandemic with a recorded rate that has never been seen before for any infectious disease. While the majority of cases result in mild symptoms, many progress to viral pneumonia and multi-organ failure. As of 16 July 2020, more than 13.6 million people across 200 countries have been infected, out of which 0.58 million have died, and 8 million have recovered [3]. These numbers change almost every minute. Since the virus is very infectious and spreads through contact and proximity, many people are in quarantine, significantly affecting the socio-economic welfare of the global population. The real-time reverse transcription-polymerase chain reaction (rRT-PCR) test is the gold standard method of screening the COVID-19 patients [4]. However, this method is slow, not accurate, and requires repeated tests. Thus, as an alternative to rRT-PCR, widely available chest X-rays may be considered for quick diagnosis or at least stratification of the patient [5]. However, since the COVID-19 chest X-rays are varied in features and presentation, specialization in reading COVID-19 chest X-rays is required, thus limiting their use and wider deployment [6]. The automated analysis of chest X-rays could be useful for diagnosing patients exhibiting signs of serious illness, to determine if the lungs show the characteristic “ground glass” features, which are known to occur in many symptomatic COVID-19 patients [7]. Hence, it could be of great importance to develop computer-aided diagnostic (CAD) systems to detect COVID-19 cases so that they cannot only be used to facilitate immediate triaging and treatment of the COVID-19 patients but also to isolate them to prevent the wide and quick spread of the disease.
Among recent developments in deep learning (DL), the convolutional neural network (CNN) has broad applications in computer vision and has opened opportunities for creating a new generation of CAD-like tools for various medical imaging tools [8,9,10,11,12,13,14]. Training CNN from scratch is very challenging because it requires a large number of labeled images for better performance, which are challenging to get in this pandemic. The available number of images for COVID-19 is insufficient, as discussed in the above-mentioned literature, limiting the CNN training. Thus, to overcome the limited dataset issue, transfer learning (TL) has been adopted [15]. While using TL, the model is first trained with a large number of annotated natural images from a computer vision dataset (ImageNet), and then fine-tuned (optimization) using the medical images. Narin et al. [16] developed a three CNN-based model using existing TL architecture and reported the highest classification accuracy for the ResNet model. They used chest X-ray images of only 50 COVID-19 patients and 50 normal (healthy) patients. Ucar and Korkmaz [17] developed a COVID-19 detection model based on deep SqueezeNet with Bayes optimization. Khan et al. [18] developed a model named CoroNet based on the Xception CNN architecture-based model to classify COVID-19 from others using chest X-ray images. Rahimzadeh and Attar [19] introduced a DL model based on the concatenation of Xception and ResNet50V2. TL-based models using chest X-ray datasets to discriminate COVID-19 are also developed by Ioannis et al. [20]. Ozturk et al. [7] constructed a DarkNet model for automatic detection of COVID-19-infected persons using chest X-ray images. Wang and Wong [21] introduced a ResNet-based model, called COVID-Net, for the detection of COVID-19 cases from open-source chest radiography images. Farooq and Hafeez [22] also used the existing ResNet-50 architecture for the same datasets. Xuanyang et al. [23] developed a data mining technique that is used to distinguish SARS and typical pneumonia based on X-ray images. Several studies have also shown that the presence of COVID-19 can be detected from CT-scans [24,25,26]. However, CT datasets are limited in number and are not readily available for training using CNN.
Previously, an ensemble model for X-ray images was employed by Chouhan et al. The authors of [27] employed an ensemble model for X-ray images to classify pneumonia and normal images. They combined five different pre-trained models and reported state-of-the-art performance using the ensemble method. Akhani and Sundaram [28] also developed an ensemble method using X-ray images by combining AlexNet and GoogLeNet neural networks to classify the images as TB or healthy.
In this manuscript, we have designed a multi-channel ensemble TL method by combining three pre-trained ResNet sub-models that are fine-tuned using three datasets. These sub-models can classify on a one-against-all basis (e.g., normal or disease, pneumonia or non-pneumonia, and COVID-19 or non-COVID19 classes). In the ensemble model [29], several classification models are integrated into one superior classifier [29] to extract more relevant features for each class and hence can identify COVID-19 features more accurately from the X-ray images.

2. Materials and Methods

In this section, first, we will introduce the dataset and DL models. Then, we will describe the details of the proposed methodologies.

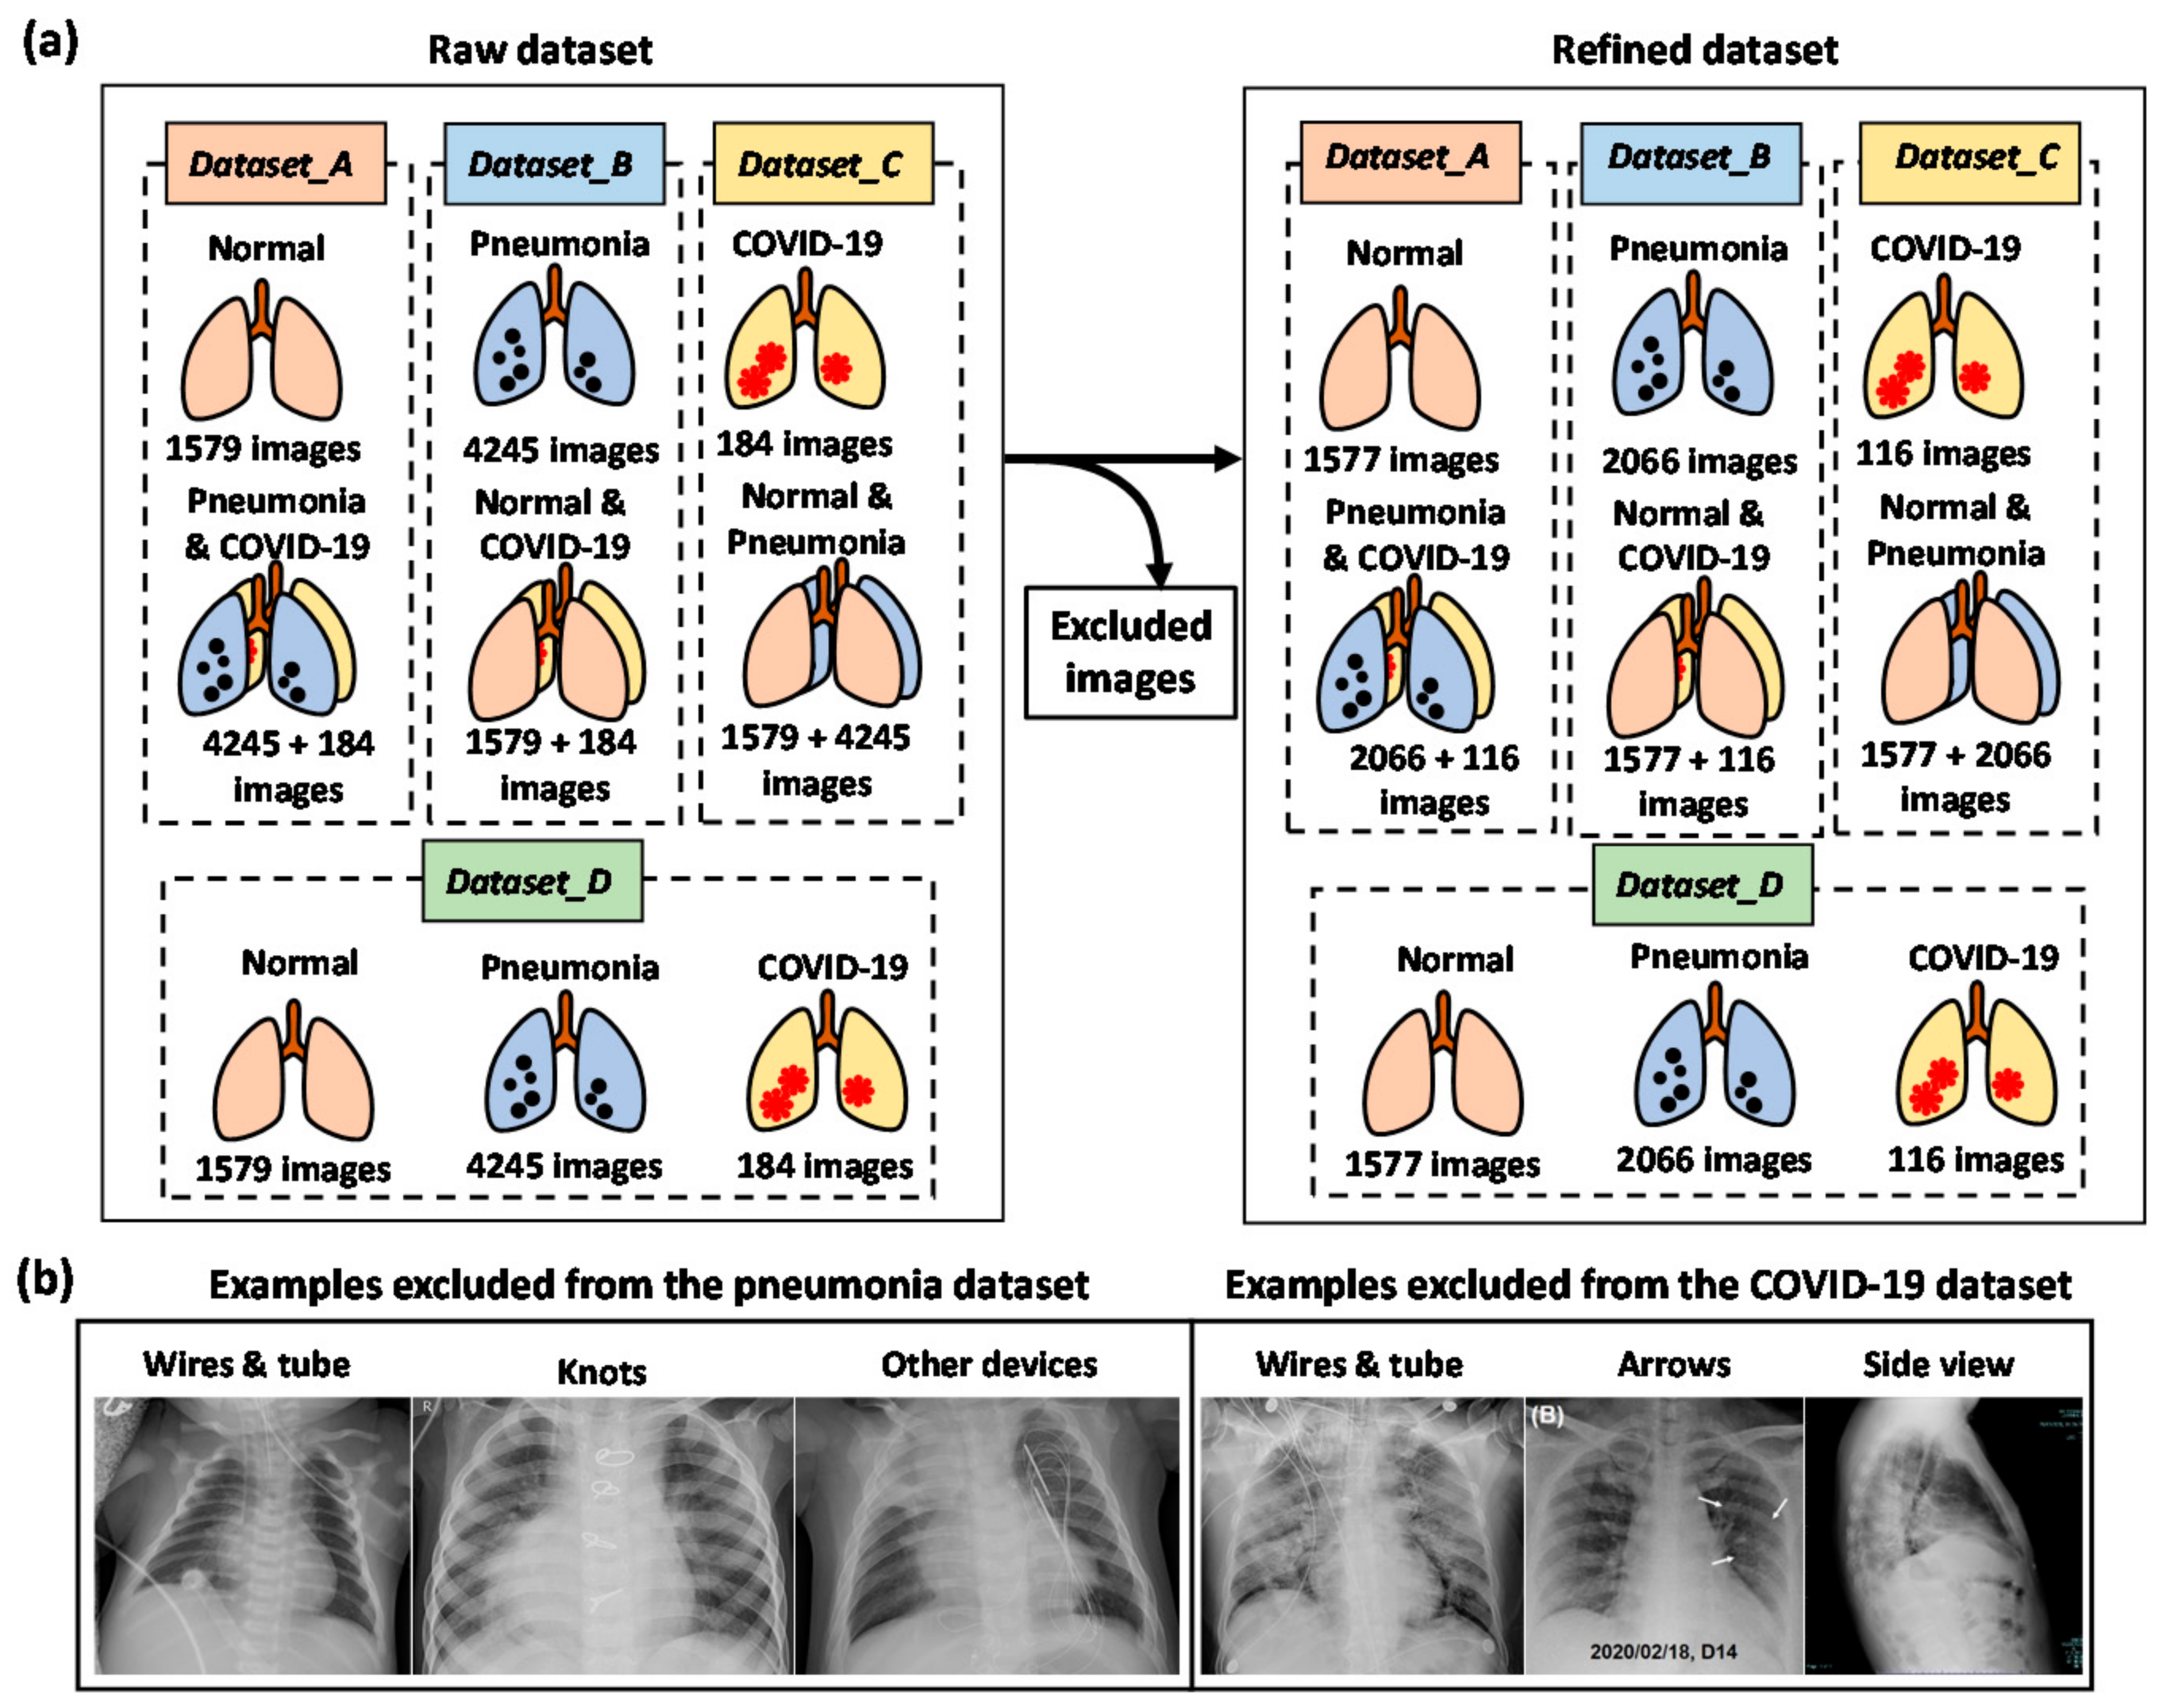
2.1. Dataset and Data Augmentation

We used the chest X-ray images that were adopted from three publicly available X-ray datasets: the RSNA Pneumonia Detection Challenge dataset [30], the COVID-19 image data collection [31], and COVID-19 X-rays [32]. These datasets are open source and fully accessible to the research community. The first dataset is from Kaggle [30], which consists of 1583 normal and 4273 pneumonia X-ray images. The second (62 images) and third datasets (204 images) are COVID-19 X-ray images from Kaggle [31], and GitHub [32], respectively. However, there were many duplicate images in these sources, and thus, after removing the duplicate images, the final number of the normal, pneumonia and COVID-19 X-ray images became 1579, 4245, and 184, respectively. Here, we have generated 4 datasets, namely Dataset_A (normal and disease), Dataset_B (pneumonia and non-pneumonia), Dataset_C (COVID-19, and non-COVID-19), and Dataset_D (normal, pneumonia and COVID-19) using these images. The detailed description of the datasets used in this study is presented in Figure 1. Moreover, we found distinct indicators like markers, wires, and arrows in many images. Thus, we removed the images with distinct indicators and prepared the refined datasets (Figure 1a). Figure 1b shows the example of deleted images that may overfit the training process. Here, the raw data is the original data without duplicated images and the refined data is the one where duplicates and images with the electrocardiogram (ECG) and markings are removed.
Data augmentation is commonly used in the medical domain to increase the size of the limited dataset [33]. This method generates additional labeled images without changing the semantic meaning of the images. In this manuscript, we used various data augmentation methods like random cropping, rotation, and horizontal flip. In the implementation, the CPU generated the augmented images while the previous batch of images was trained in the GPU. Hence, these data augmentation techniques did not affect the time complexity. We also used oversampling to deal with imbalanced data.

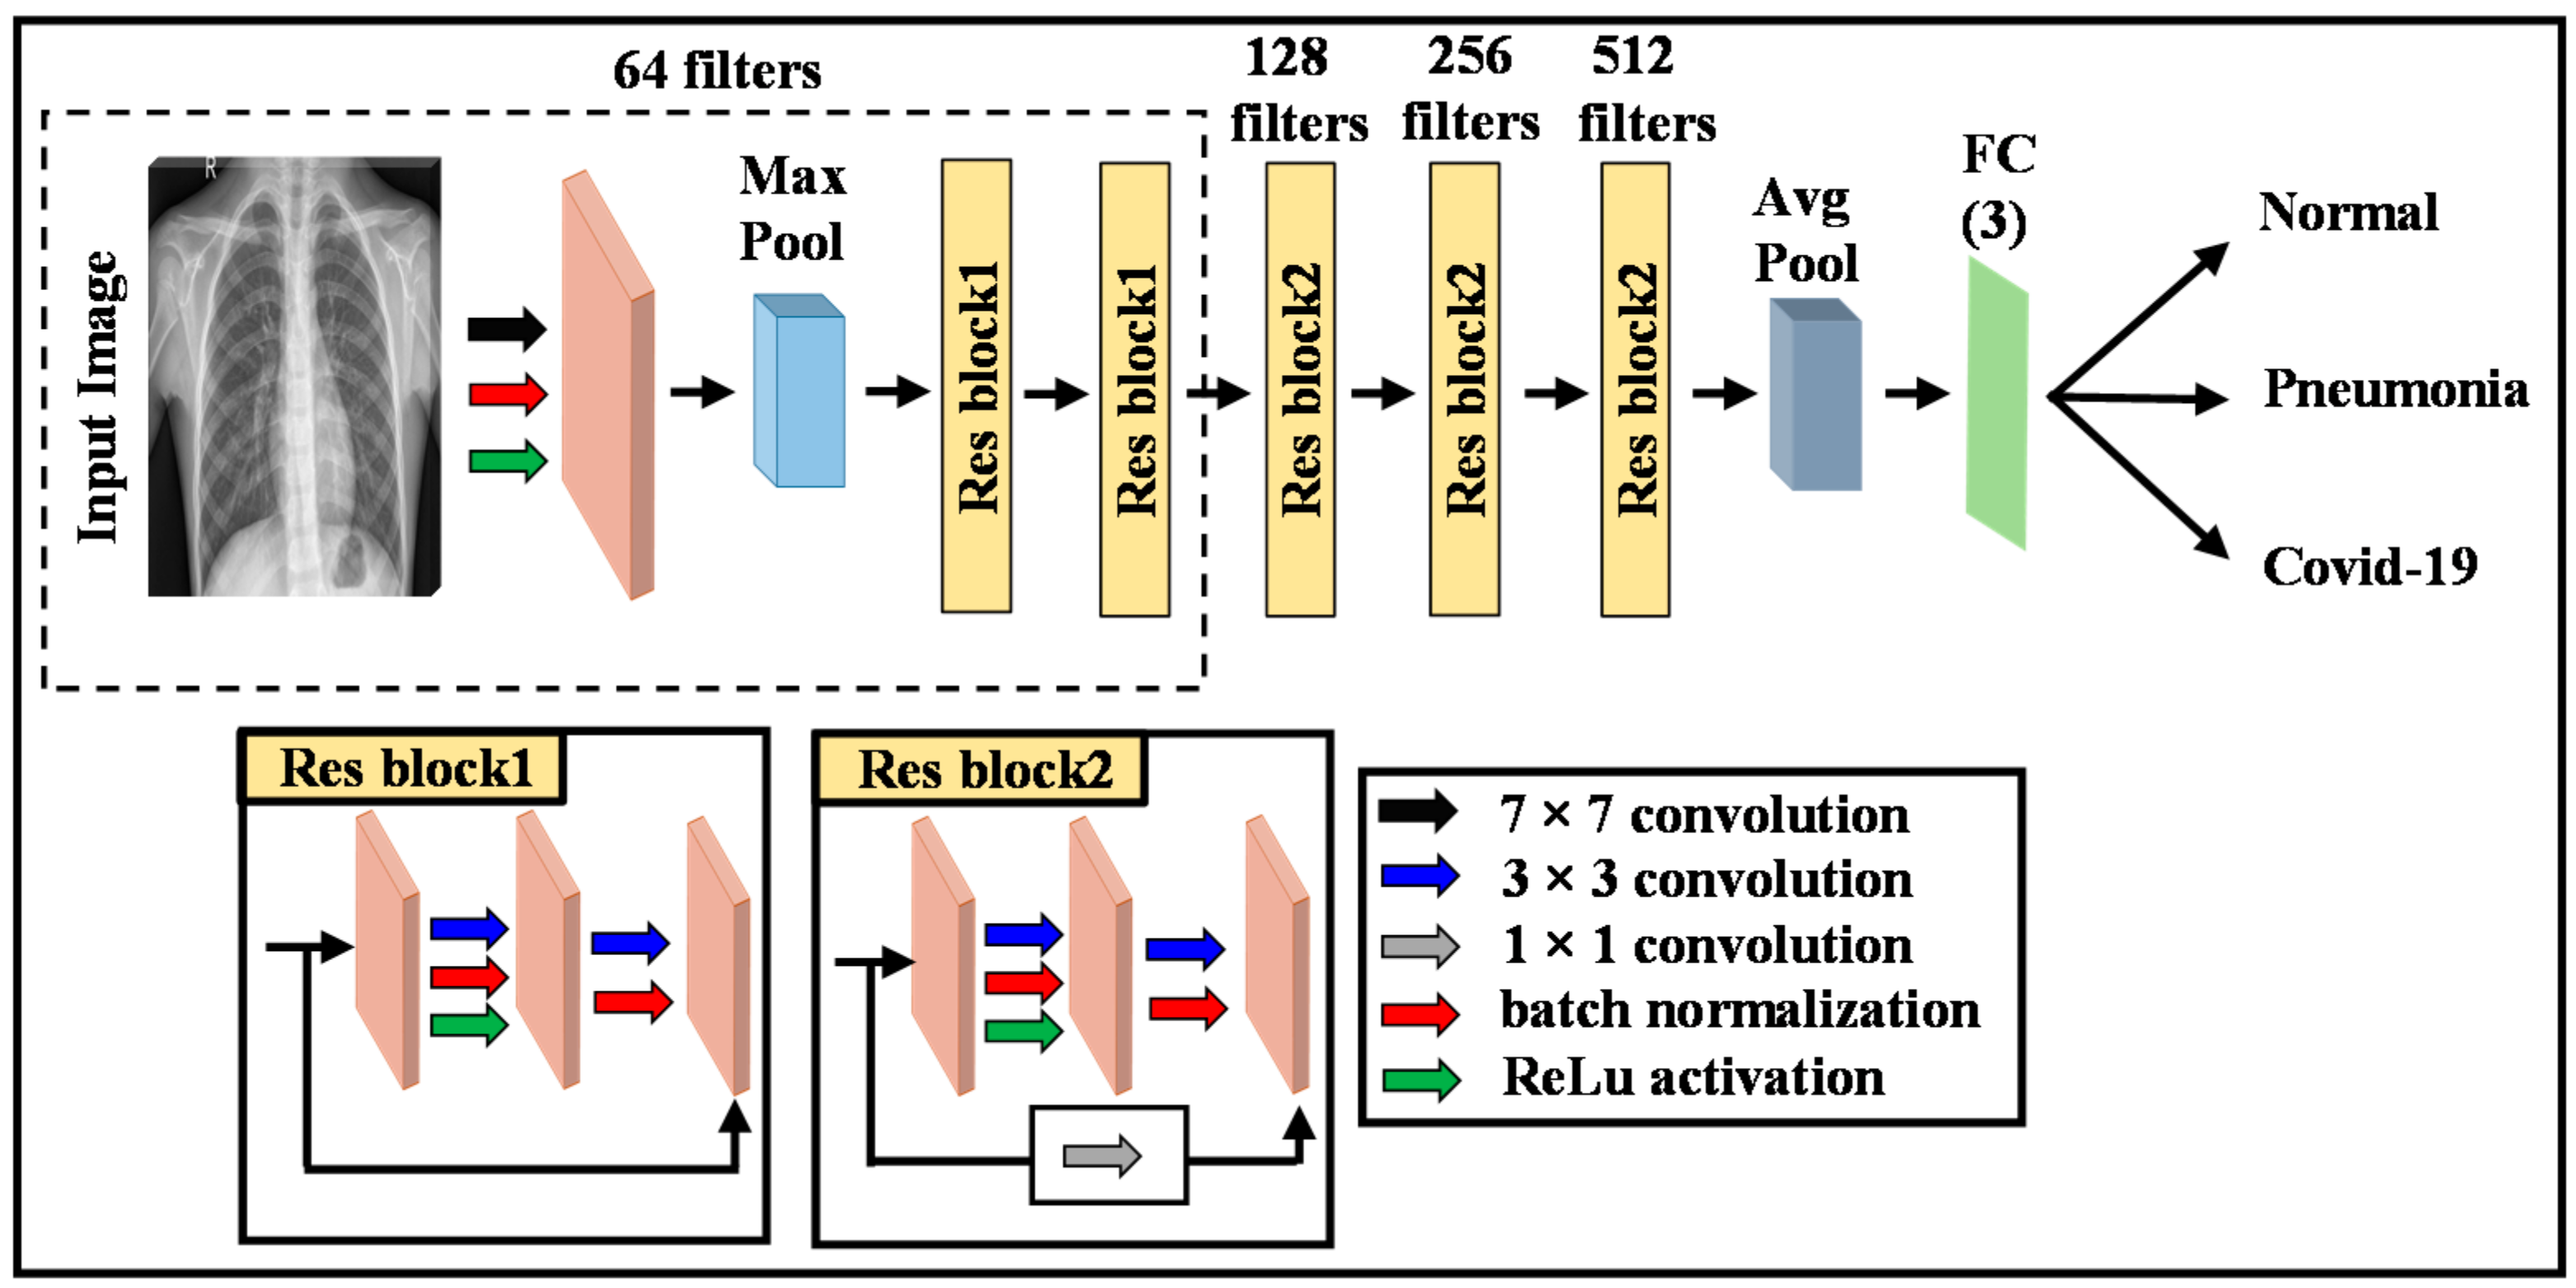
2.2. Deep Learning Model

The DL method automatically extracts features from the raw data and then performs the classification of the images. The main advantage of this method is that feature extraction and classification are performed in the same network. The CNN models are the state-of-the-art DL technique, comprising of many stacked convolutional layers to perform automatic feature extraction from image data [34]. They have been used in many radiology applications and are capable of achieving high performance in classifying diseases based on images [8]. The layers used to build CNN architecture are the input layer (an image is given as input to produce output), convolutional layers (convolve input image with filters to produce a feature map), rectifier linear unit (ReLU) activation layer (activates the neurons above a threshold value), pooling layers (reduce the size of an image by keeping the high-level features), and fully connected (FC) layers (produce the result). The accuracy of CNN depends on the design of the layers and training data [35]. The CNN generally requires large medical datasets with labels for training, which are difficult to create due to the time and labor cost. Recent studies have shown that TL can be used to overcome this limited dataset size problem.

2.3. Transfer Learning (TL)

In TL, the CNN is first trained to learn features in a broad domain e.g., ImageNet. The trained features and network parameters are then transferred to the more specific field. In the CNN model, low label features like edges, curves, corners are learned in the initial layer and the specific high label features are learned in the final layer. Among the different TL models, we chose ResNet since it is well recognized in medical image classification [36]. We employed ResNet-18 because of its relatively shallow architecture, and it can train the images faster without compromising performance. It consists of one 7 × 7 convolutional layer, 2 pool layers, 5 residual blocks, and one FC layer. The residual block has two 3 × 3 convolutional layers followed by a batch normalization layer and a ReLU activation function. We can skip these two convolution layers and add the input directly before the final ReLU activation function. The network structure of ResNet-18 is described in Figure 2. Classification accuracy of this network is high since this network uses bottleneck residual block, batch normalization (adjust the input layers), and the identity connection (to protect the network from the vanishing point gradient problem) [36].

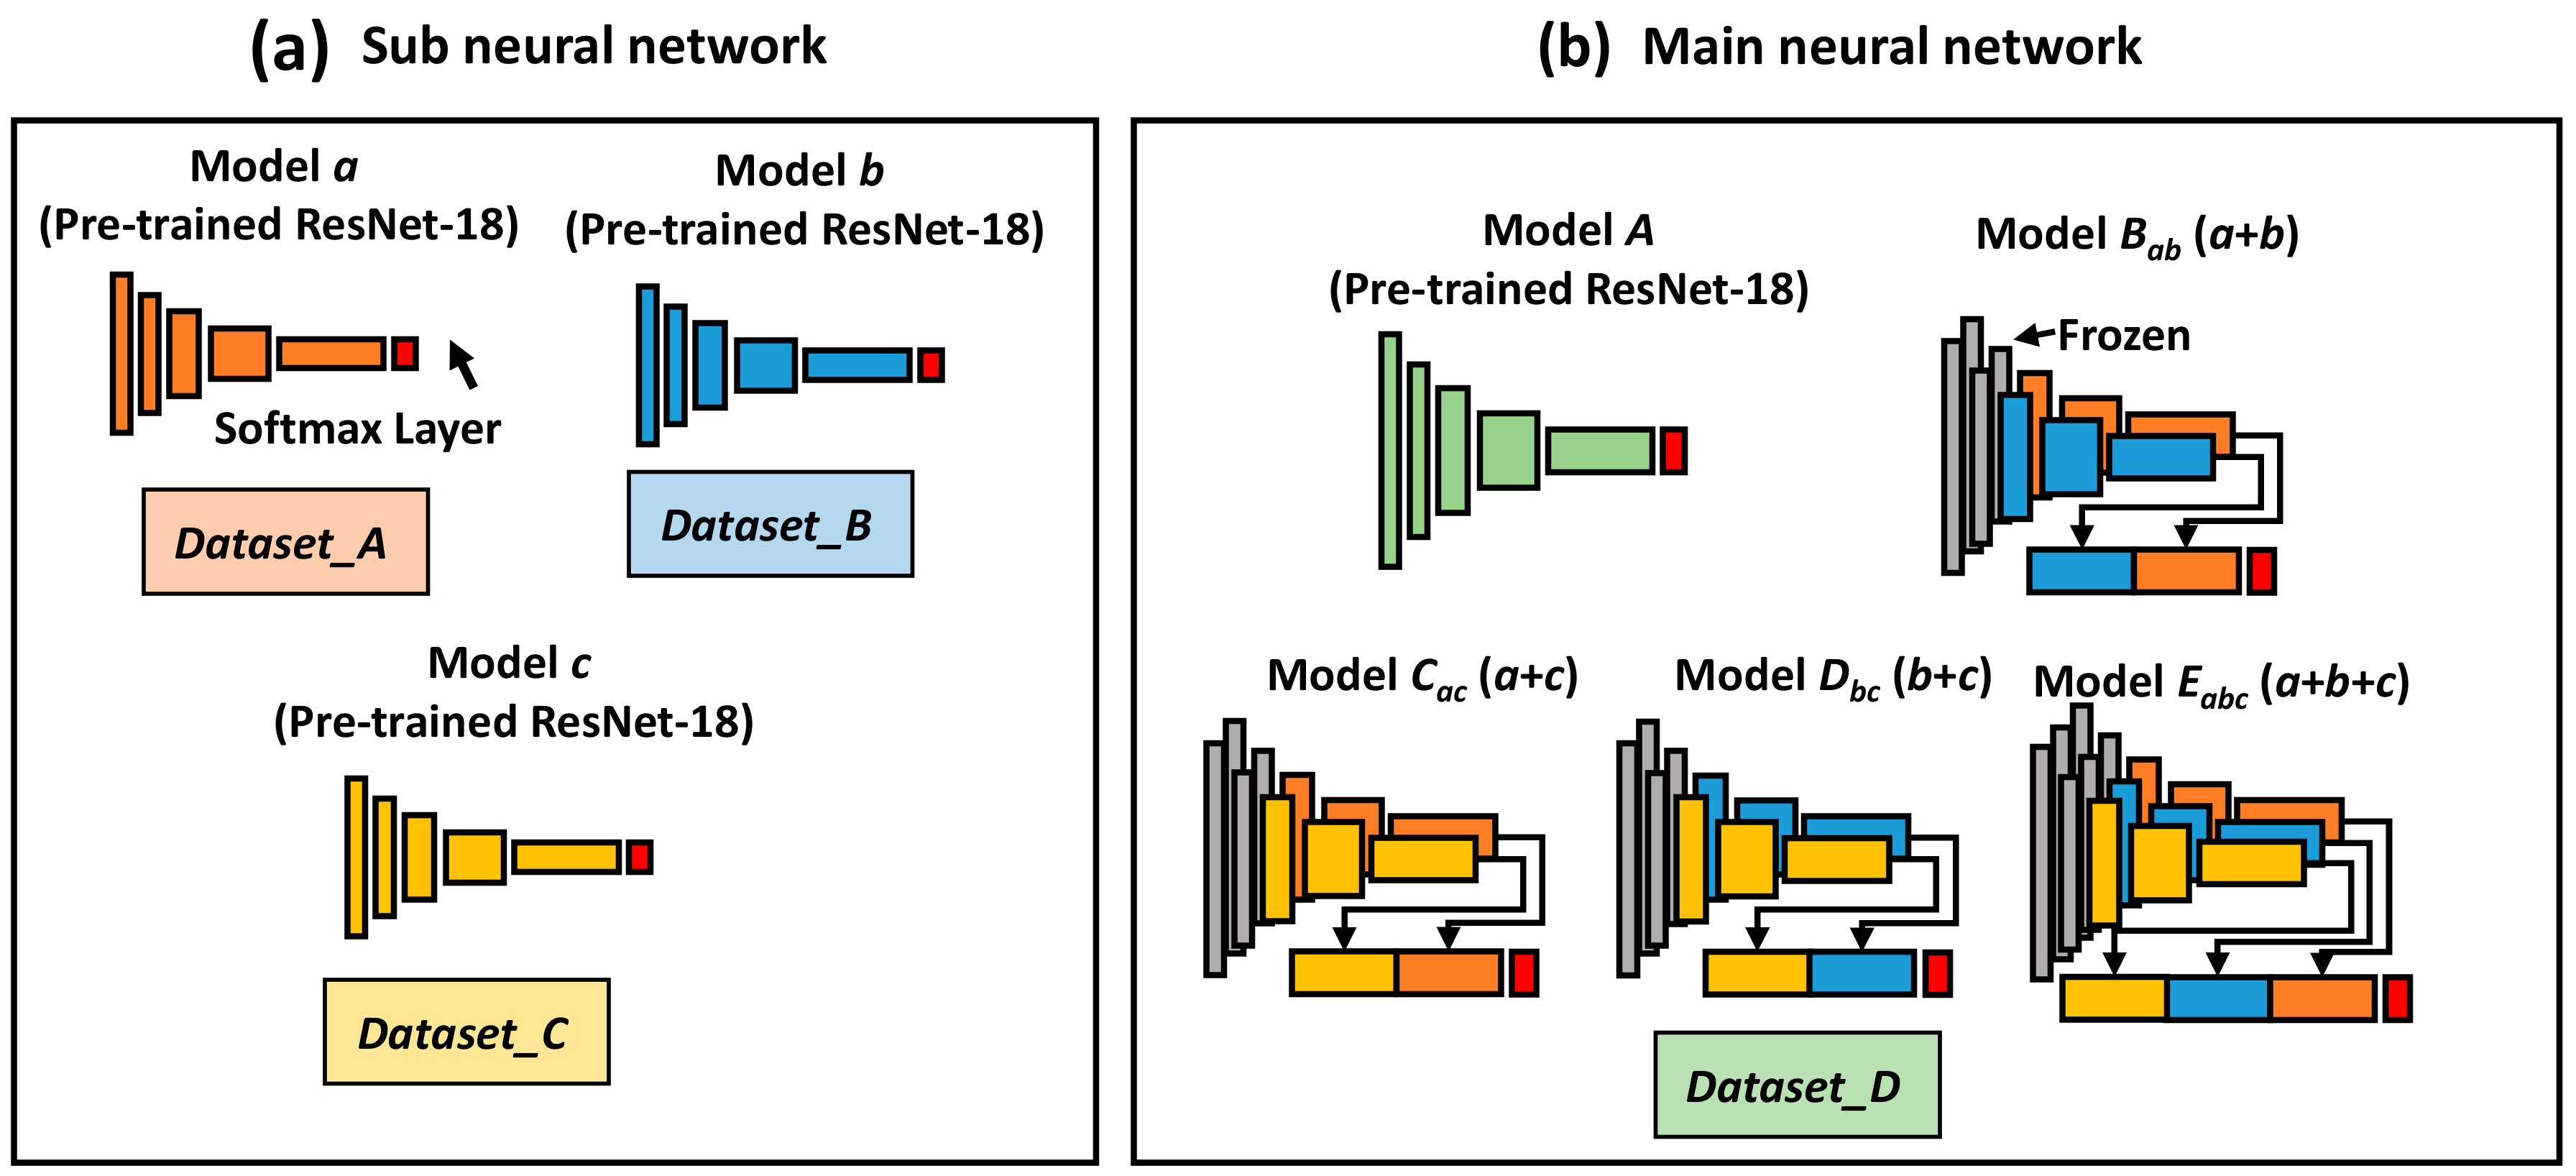
2.4. Proposed Methodology

The overall proposed methodology is outlined in Figure 3. We first fine-tuned the CNN architecture that was originally pre-trained (initialized) on the natural image data. Here, 3-ResNet models were fine-tuned based on three different classes (normal, pneumonia, and COVID-19) (Figure 3a). Model a was fine-tuned based on the Dataset_A to classify the normal from the diseased (i.e., pneumonia and COVID-19) cases. The Dataset_B was fed into the Model b to identify whether the image is related to pneumonia or not (i.e., normal and COVID-19). Model c was fine-tuned based on the Dataset_C to classify the COVID-19 cases from non-COVID19 (i.e., normal and pneumonia) cases. These 3 models were pre-trained in parallel to learn the respective features to classify normal, pneumonia, and COVID-19 images.
A single ResNet model (Model A, trained on the super dataset Dataset_D) can classify the COVID-19, normal and pneumonia images. However, we combined Models a + b, a + c, and b + c, to form new Models Bab, Cac, and Dbc, respectively (Figure 3b), as ensemble learning allows better prediction compared to a single model. In the ensemble models, every model contributes to the final output, and the weaknesses of the models are offset by the contribution of the other models. Here, the network parameters were transferred to the ensemble network and retrained using Dataset_D to extract more appropriate features to classify the images as normal, COVID-19, and pneumonia. Finally, we combined these three models, a + b + c, to construct our proposed Model Eabc, which extracts various semantic features from the three models. Model Eabc can extract more relevant features that can distinguish normal, pneumonia, and COVID-19 more accurately as it is a combination of three specialized sub-models.
The detailed steps for the proposed methodology are as follows:
  • Build Model a by fine-tuning the pre-trained ResNet model using the Dataset_A, which can classify the normal and diseased images.
  • Construct Model b to classify pneumonia and non-pneumonia images based on the pre-trained ResNet model by fine-tuning the Dataset_B.
  • Design ResNet-based Model c by fine-tuning the Dataset_C, which can classify the COVID-19 and non-COVID19 images.
  • Remove the classification layer of all models to expose activations of their penultimate layers.
  • Freeze the weights of Models a, b and c.
  • Build ensemble models (Models Bab, Cac, Dbc, and Eabc) by combining Models a + b, a + c, b + c and a + b + c.
  • Add a concatenation layer and a classification layer (softmax) into the architecture of the combined models.
  • Train (fine-tune) again the combined models using the Dataset_D, which can classify the normal, pneumonia, and COVID-19 images.

3. Results

In this section, we will describe in detail our experimental setup and results while testing the performance of our method.

3.1. Experimental Setup

We trained the DL models on a server equipped with a 32 GB RAM, Intel i7-9700 processor, and a GeForce RTX 2060 Super GPU. For training, we used weighted cross-entropy as a loss function and Adam as the optimization function. Here, the weight value for different classes was assigned based on the number of images present in their respective classes. A maximum of 500 epochs was allowed and early stopping criteria was employed, i.e., training was interrupted if the validation loss did not drop in 100 consecutive epochs and the weights of the best epoch were restored.

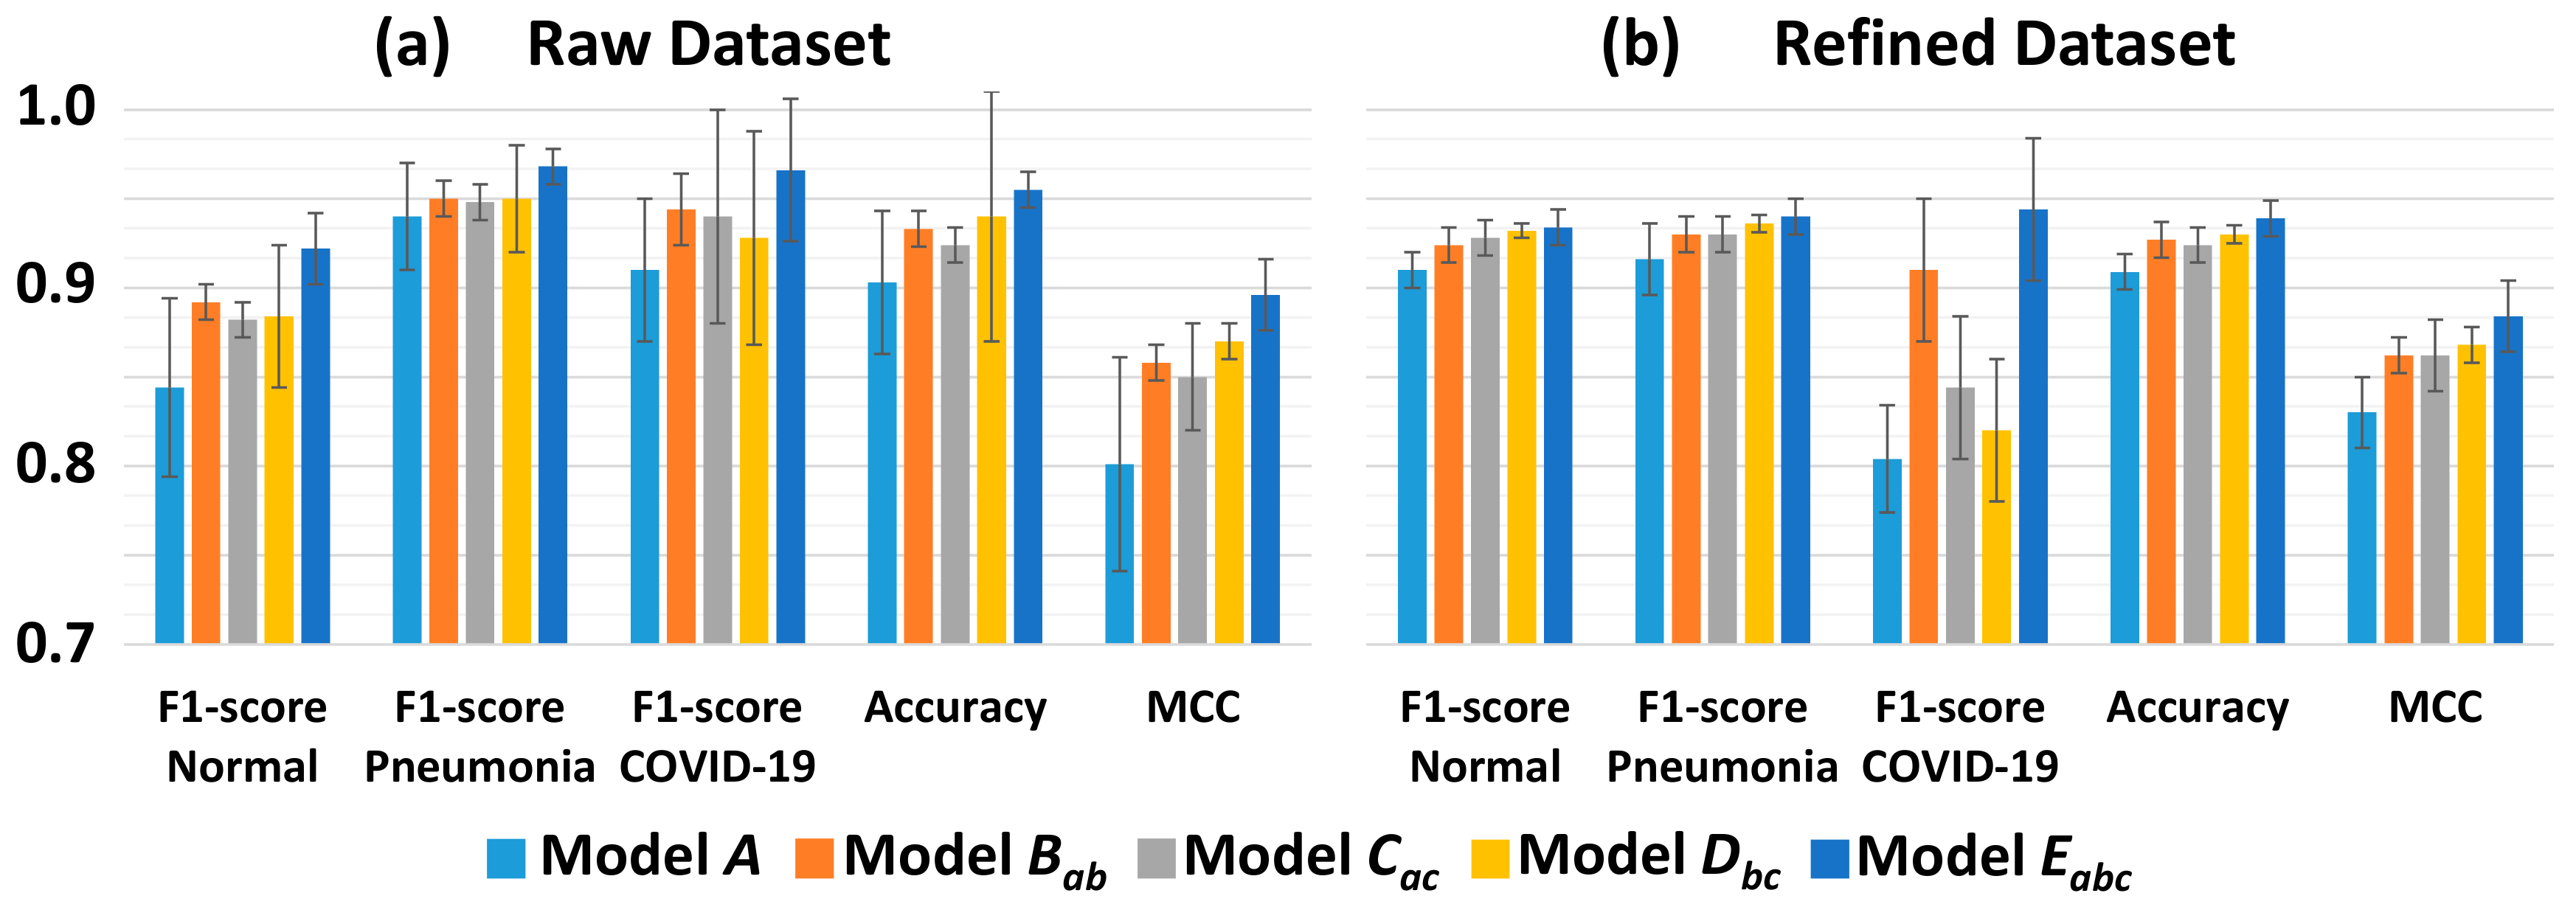
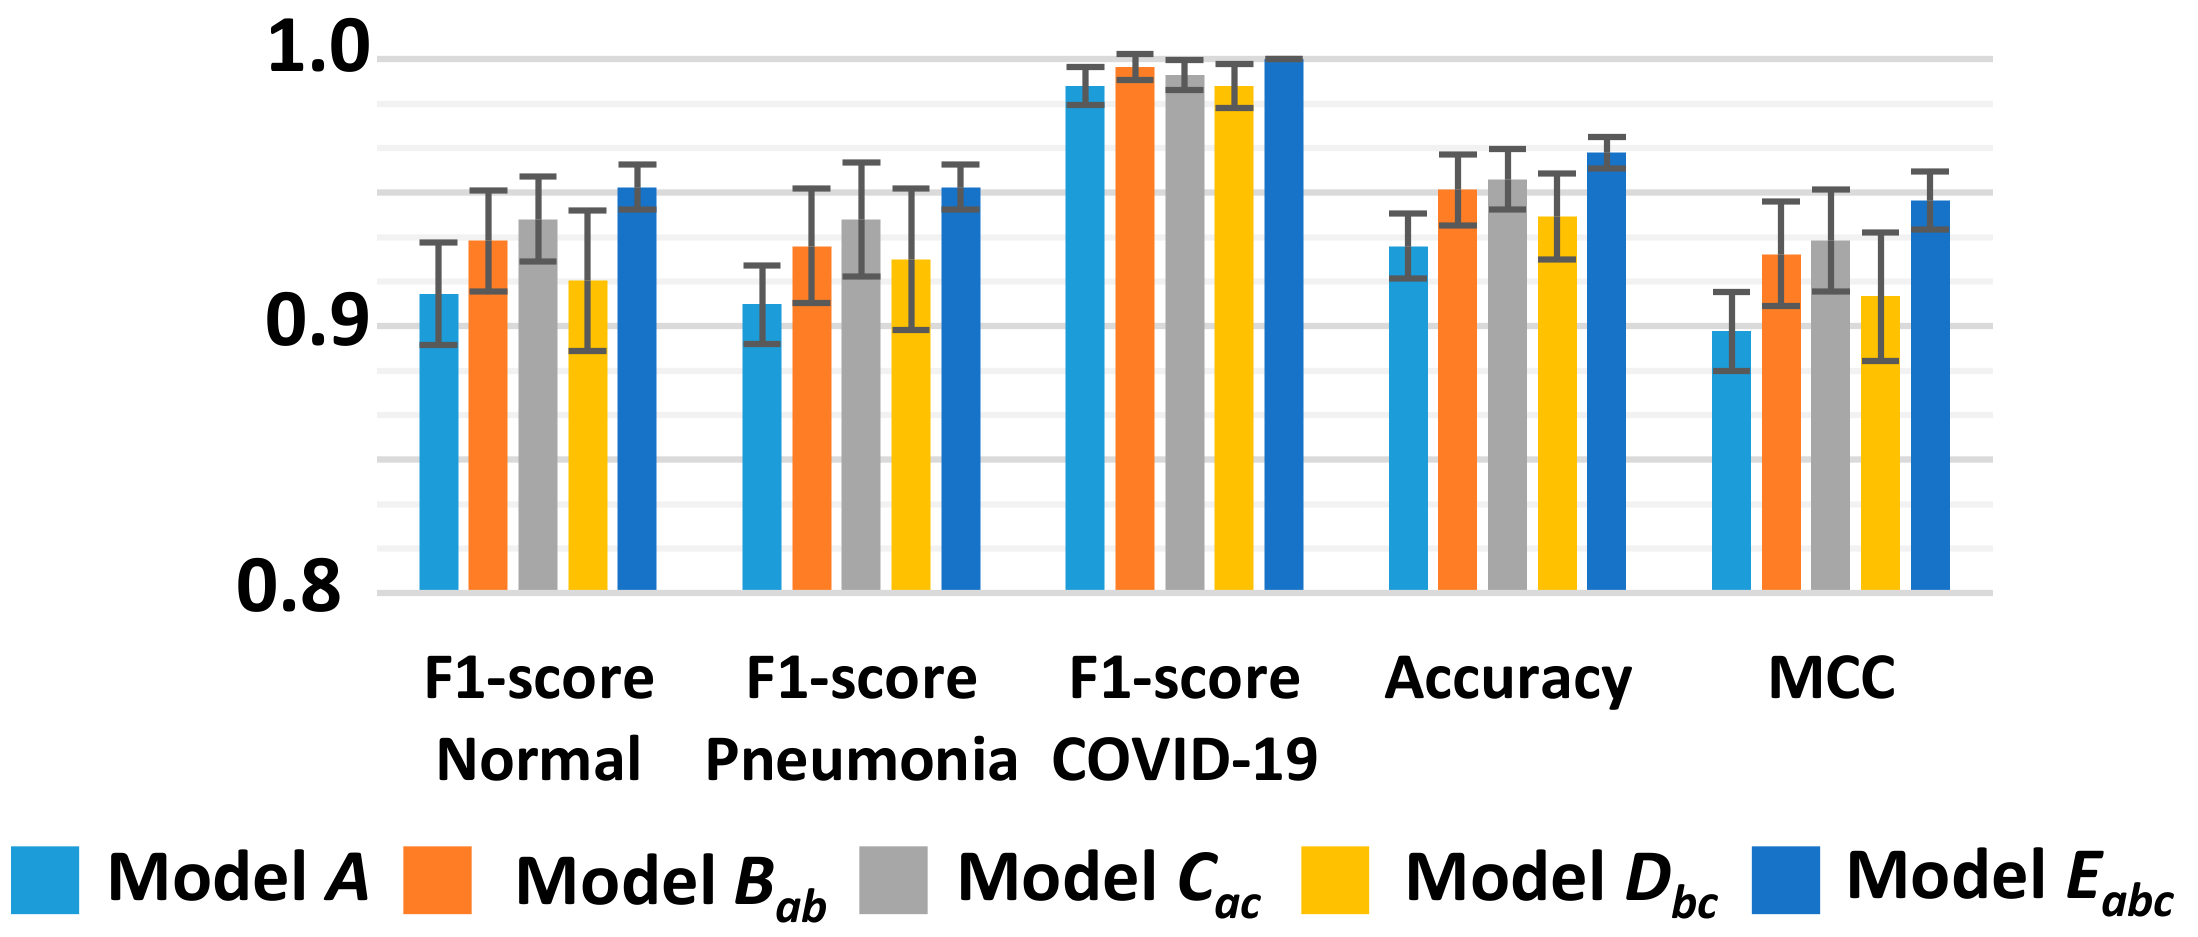
3.2. Classification Performance

The datasets (Dataset_A, Dataset_B, Dataset_C, and Dataset_D) were first divided into the training data and testing data with a ratio of 9:1. The datasets were divided in such a way (train:test = 9:1) that the images used to build the test set were never used to train any models (Models a, b, c, A, Bab, Cac, Dbc, and Eabc). Then, we used a five-fold cross-validation scheme to validate the performance. We randomly divided the training data into five parts. Among these five parts, four parts were assigned as the training set, and the remaining part was assigned as the validation set in such a way that the images used to build the training set were not used for the validation set. This process was repeated five times to train and measure the performance [37] of our proposed method. Table 1 shows the class distribution (training, validation, and test sets) of the raw and the refined datasets. The test sets of 158 normal, 424 pneumonia, and 18 COVID-19 images from the raw dataset and 157 normal, 206 pneumonia, and 11 COVID-19 images from the refined dataset (which were separated in the beginning) are used to measure the classification (normal, pneumonia, and COVID-19) performance of the single ResNet model (A) as well as the proposed ensemble models (Bab, Cac, Dbc, and Eabc).
The cross-validated performance metrics (i.e., precision, recall, F1-score, accuracy, and Matthews Correlation Coefficient (MCC)) of each model using the raw and refined dataset (Dataset_D) are shown in Table 2. The graph representation of corresponding cross-validated classification performance (F1-score, accuracy, and MCC) for each model using both raw and refined datasets are shown in Figure 4. In Model A, a single ResNet was trained to classify three cases simultaneously, with the accuracy and MCC of 90.3% and 0.801 for raw data and 90.9% and 0.83 for refined datasets, respectively. This model has a recall of 100% for COVID-19 but has a low precision value of 67.4% because of poor performance in discriminating pneumonia from COVID-19. All other models that were trained with the ensemble learning exhibit significantly better classification performance than the Model A. The ensemble Models Bab, Cac, and Dbc show higher accuracy and MCC than those of the Model A by about 2–4% and 4–7%, respectively, for both raw and refined datasets. From the results, we observe that the ensemble Models Bab, Cac, and Dbc improve the precision compared to the individual Model A. It is worth mentioning that the proposed ensemble Model Eabc, consisting of the three sub-models, has the highest F1-scores, accuracy, and MCC among all models for both raw and refined datasets.
As the decision/classification using a DL model is not binary, the predictive probability value (PPV) for each image is calculated and the images are classified as a respective class based on higher PPV values. In order to statistically validate the proposed ensemble methods (Models Bab, Cac, Dbc, and Eabc) with the single ResNet model (Model A), t-statistics [38] are evaluated using the distributions of those PPV values, which correspond to the true class labels, employing the following expression:
t = X 1 ¯ X 2 ¯ N 1 1 s 1 2 + N 2 1 s 2 2 N 1 + N 2 2 1 N 1 + 1 N 2 .
here, ( X ¯ 1 , X ¯ 2 ) are the means and (s1, s2) are the standard deviations of the PPV values for two methods, and (N1 = N2) is the number of test images. The means of the PPV values, t values, and related p values for the models are shown in Table 3. The alternative hypothesis implies that the means of PPV values for the ensemble models (Models Bab, Cac, Dbc, and Eabc) are superior as compared to those of Model A. The p values for the corresponding t values eventually reject the null hypothesis that all the approaches are equivalent i.e., they provide the same results with a significance level of 0.05 in favor of the alternative. It is evident from Table 3 that the means of PPV values for ensemble methods are higher than the single ResNet model. It is worth noting that the three-channel ensemble method (Model Eabc) has the highest mean of PPV values among all models.

4. Discussion

In this manuscript, we present a COVID-multichannel TL method for the classification of patients as normal, COVID-19, and pneumonia based on chest X-ray images. Here, we trained three ResNet-based sub-models (a, b, and c) to classify normal or disease, pneumonia or non-pneumonia, and COVID-19 or Non-COVID19 classes using three different datasets Dataset_A, Dataset_B, and Dataset_C, respectively (Figure 3). Then, we combined the sub-models (two or three of these sub-models) and retrained using the Dataset_D to extract more appropriate features to classify the images as normal, COVID-19, and pneumonia (Figure 3b). We observe that the ensemble models (Models Bab, Cac, Dbc, and Eabc) show better classification performance than the single ResNet model (Model A) trained on the same dataset. From this, it can be inferred that the superior performance in terms of accuracy, precision, recall, and F1-score of the proposed method is due to the ensemble learning strategy. It is well known that the ensemble strategy could reduce bias and/or variance in the prediction by utilizing multiple classifiers [29]. In this study, we trained the sub-models with the uniquely configured datasets so that the sub-models ac were trained specifically to screen the normal, pneumonia, and COVID-19 patients, respectively. Due to these specialized sub-models, the ensemble models could extract features to distinguish normal, pneumonia, and COVID-19 more accurately than the single ResNet-based model. The models’ (Bab, Cac, and Dbc) classification performances were also improved for the combination of the sub-models. It is worth mentioning that Model Eabc, consisting of three sub-models, appears to represent the best performance compared to other models (Table 2 and Figure 4).
To enhance the reliability of DL-based screening methods, sufficient consideration should also be given to the composition of datasets. In our result, the recalls for all models are calculated at 100%, and this excessive bias is likely to have a negative impact on other performance metrics. Perhaps, the cause of this problem could be 1) the small number of training images for the COVID-19 class, 2) the data separation process, or 3) image artifacts that are present only in that particular class. In this study, the original raw dataset has 184 COVID-19 images, which accounts for only 11.62% and 3.14% of the number of the normal and pneumonia images, respectively. Such a small number of the COVID-19 datasets may not be enough to train the neural networks. In terms of the data separation, the images from the same patient are divided into the training, validation, and test datasets because it is not mentioned whether the images are from the same patient or not in the public dataset we used. Besides, there are many artifacts in the chest X-ray images that may negatively affect the performance of classification tasks for feature-based DL models. We have examined the raw datasets manually and observed many images with wires, arrow signs, etc. (Figure 1b). These types of images are only present in one particular class, hence it may consider these artifacts as classification features and classify the test images according to these features, which are not true features. Therefore, we have deleted these noisy images, which are present in one class for the accurate outcome. We observe that the difference of F1-score between raw and refined datasets for the COVID-19 class is significantly higher as compared to other classes as there are many noisy images in the original COVID-19 class.
Additionally, we have tested the performance of the proposed ensemble methods using 41 new COVID-19 images (uploaded in the same GitHub repository https://github.com/ieee8023/covid-chestxray-dataset from 16 April 2020 to 5 May 2020), 50 normal images and 50 pneumonia images. From Figure 5, we observed that the ensemble models (Models Bab, Cac, Dbc, and Eabc) show better classification performance than the single ResNet model (Model A).
It is not feasible to compare the performance of the proposed method with other existing methods because the number of test images and the data sources are different. However, in Table 4, we have summarized the performance in terms of accuracy, sensitivity, and specificity along with the number of images and the architecture used for our proposed models and other existing DL models. In particular, here we consider only those methods that are used to classify three classes.
In conclusion, we propose an ensemble learning strategy to improve the classification performance in DL-based COVID-19 screening for chest X-ray images. Moreover, we discuss the potential limitation of the existing open COVID-19 X-ray image dataset by comparing the results before and after refining the dataset. X-ray is a relatively cheap and rapid medical imaging technique, so we can expect its rapid dissemination and high diagnostic throughput, which are important in the urgent pandemic situation. Our DL-based method could significantly improve the accuracy of the X-ray COVID-19 screening at a low cost. Accordingly, we believe that this method could enable intensive and efficient support for COVID-19 patients by saving human and temporal medical resources and reducing unnecessary quarantine periods of patients to minimize social cost losses. In future, we will investigate whether accuracy can be increased by adaptations to our fine-tuning scheme (e.g., changes to the loss function). We also hope to enhance the performance of our proposed model in terms of accuracy by incorporating more COVID-19 images. We also intend that our model is publicly available so that it can provide instant diagnosis and help affected patients immediately.

Author Contributions

Conceptualization and methodology, S.M. and C.K.; Formal analysis, S.M. and S.J.; Data curation, S.M. and S.L.; Software, Validation, Investigation, S.M., S.J., S.L. and C.K.; Writing—original draft, S.M., S.J. and S.L.; Writing—review and editing, R.M., C.K. and I.-S.J.; supervision, C.K. and I.-S.J. All authors have read and agreed to the published version of the manuscript.

Funding

This research was supported by the National Research Foundation grant (NRF-2019R1A2C2006269) funded by the Ministry of Science and ICT (MSIT), the Republic of Korea, Institute of Information and Communications Technology Planning and Evaluation (IITP) grant (No. 2019-0-01906, Artificial Intelligence Graduate School Program) funded by MSIT, the Republic of Korea, the Tech Incubator Program for Startup (TIPS) program (S2640139) funded by the Ministry of Small and Medium-sized Enterprises and Startups (SMEs) and Technology and the Information Promotion Agency (TIPA) for SMEs, and the Basic Science Research Program through the NRF of Korea funded by the Ministry of Education (2020R1A6A1A03047902).

Conflicts of Interest

S.M., S.L. and C.K. have financial interests in OPTICHO, which supported this work.

References

  1. Lai, M.M.C. SARS virus: The beginning of the unraveling of a new coronavirus. J. Biomed. Sci. 2003, 10, 664–675. [Google Scholar] [CrossRef] [PubMed]
  2. Zumla, A.; Hui, D.S.C.; Perlman, S. Middle East respiratory syndrome. Lancet 2015, 386, 995–1007. [Google Scholar] [CrossRef] [Green Version]
  3. World Health Organization. Coronavirus Disease 2019 (COVID-19): Situation Report, 72; World Health Organization: Geneva, Switzerland, 2020. [Google Scholar]
  4. Chana, J.F.; Yip, C.C.; To, K.K. Improved molecular diagnosis of COVID-19 by the novel, highly sensitive and specific COVID-19-RdRp/Hel realtime reverse transcription-polymerase chain reaction assay validated in vitro and with clinical specimens. J. Clin. Microbiol. 2020. [Google Scholar] [CrossRef] [Green Version]
  5. Xu, Z.; Shi, L.; Wang, Y.; Zhang, J.; Huang, L.; Zhang, C.; Liu, S.; Zhao, P.; Liu, H.; Zhu, L.; et al. Pathological findings of COVID-19 associated with acute respiratory distress syndrome. Lancet Respir. Med. 2020, 8, 420–422. [Google Scholar] [CrossRef]
  6. Bai, H.X.; Hsieh, B.; Xiong, Z.; Halsey, K.; Choi, J.W.; Tran, T.M.; Pan, I.; Shi, L.B.; Wang, D.C.; Mei, J.; et al. Performance of radiologists in differentiating COVID-19 from viral pneumonia on chest CT. Radiology 2020. [Google Scholar] [CrossRef] [PubMed]
  7. Ozturk, T.; Talo, M.; Yildirim, E.A.; Baloglu, U.B.; Yildirim, O.; Acharya, U.R. Automated detection of COVID-19 cases using deep neural networks with X-ray images. Comput. Biol. Med. 2020, 121, 103792. [Google Scholar] [CrossRef]
  8. Litjens, G.; Kooi, T.; Bejnordi, B.E.; Setio, A.A.A.; Ciompi, F.; Ghafoorian, M.; Van Der Laak, J.A.; Van Ginneken, B.; Sánchez, C.I. A survey on deep learning in medical image analysis. Med. Image Anal. 2017, 42, 60–88. [Google Scholar] [CrossRef] [PubMed] [Green Version]
  9. Baik, J.W.; Kim, J.Y.; Cho, S.; Choi, S.; Kim, J.; Kim, C. Super Wide-Field Photoacoustic Microscopy of Animals and Humans In Vivo. IEEE Trans. Med. Imaging 2020, 39, 975–984. [Google Scholar] [CrossRef]
  10. Kim, J.; Kim, J.Y.; Jeon, S.; Baik, J.W.; Cho, S.H.; Kim, C. Super-resolution localization photoacoustic microscopy using intrinsic red blood cells as contrast absorbers. Light. Sci. Appl. 2019, 8, 103–111. [Google Scholar] [CrossRef] [PubMed]
  11. Jeon, S.; Kim, J.; Lee, D.; Baik, J.W.; Kim, C. Review on practical photoacoustic microscopy. Photoacoustics 2019, 15, 100141. [Google Scholar] [CrossRef]
  12. Milletari, F.; Ahmadi, S.-A.; Kroll, C.; Plate, A.; Rozanski, V.; Maiostre, J.; Levin, J.; Dietrich, O.; Ertl-Wagner, B.; Bötzel, K.; et al. Hough-CNN: Deep learning for segmentation of deep brain regions in MRI and ultrasound. Comput. Vis. Image Underst. 2017, 164, 92–102. [Google Scholar] [CrossRef] [Green Version]
  13. Gupta, H.; Jin, K.H.; Nguyen, H.Q.; McCann, M.T.; Unser, M. CNN-Based Projected Gradient Descent for Consistent CT Image Reconstruction. IEEE Trans. Med. Imaging 2018, 37, 1440–1453. [Google Scholar] [CrossRef] [Green Version]
  14. Liu, J.; Pan, Y.; Li, M.; Chen, Z.; Tang, L.; Lu, C.; Wang, J. Applications of deep learning to MRI images: A survey. Big Data Min. Anal. 2018, 1, 1–18. [Google Scholar] [CrossRef]
  15. Pan, S.J.; Yang, Q. A Survey on Transfer Learning. IEEE Trans. Knowl. Data Eng. 2009, 22, 1345–1359. [Google Scholar] [CrossRef]
  16. Narin, A.; Kaya, C.; Pamuk, Z. Automatic detection of coronavirus disease (covid-19) using x-ray images and deep convolutional neural networks. arXiv 2020, arXiv:2003.10849. [Google Scholar]
  17. Ucar, F.; Korkmaz, D. COVIDiagnosis-Net: Deep Bayes-SqueezeNet based Diagnostic of the Coronavirus Disease 2019 (COVID-19) from X-Ray Images. Med. Hypotheses 2020, 140, 109761. [Google Scholar] [CrossRef] [PubMed]
  18. Khan, A.I.; Shah, J.L.; Bhat, M.M. CoroNet: A deep neural network for detection and diagnosis of COVID-19 from chest x-ray images. Comput. Methods Progr. Biomed. 2020, 196, 105581. [Google Scholar] [CrossRef]
  19. Rahimzadeh, M.; Attar, A. A modified deep convolutional neural network for detecting COVID-19 and pneumonia from chest X-ray images based on the concatenation of Xception and ResNet50V2. Inform. Med. Unlocked 2020, 19, 100360. [Google Scholar] [CrossRef]
  20. Apostolopoulos, I.D.; Mpesiana, T.A. Covid-19: Automatic detection from X-ray images utilizing transfer learning with convolutional neural networks. Phys. Eng. Sci. Med. 2020, 43, 635–640. [Google Scholar] [CrossRef] [Green Version]
  21. Wang, L.; Wong, A. COVID-Net: A tailored deep convolutional neural network design for detection of COVID-19 cases from chest radiography images. arXiv 2020, arXiv:2003.09871. [Google Scholar]
  22. Farooq, M.; Hafeez, A. COVID-ResNet: A Deep Learning Framework for Screening of COVID19 from Radiographs. arXiv 2020, arXiv:2003.14395. [Google Scholar]
  23. Xuanyang, X.; Yuchang, G.; Shouhong, W.; Xi, L. Computer Aided Detection of SARS Based on Radiographs Data Mining. In Proceedings of the 2005 IEEE Engineering in Medicine and Biology 27th Annual Conference, Shanghai, China, 17–18 January 2006; pp. 7459–7462. [Google Scholar]
  24. Shan, F.; Gao, Y.; Wang, J.; Shi, W.; Shi, N.; Han, M.; Xue, Z.; Shi, Y. Lung Infection Quantification of COVID-19 in CT Images with Deep Learning. arXiv 2020, arXiv:2003.04655. [Google Scholar]
  25. Gozes, O.; Frid-Adar, M.; Greenspan, H.; Browning, P.D.; Zhang, H.; Ji, W.; Bernheim, A.; Siegel, E. Rapid ai development cycle for the coronavirus (COVID-19) pandemic: Initial results for automated detection & patient monitoring using deep learning ct image analysis. arXiv 2020, arXiv:2003.05037. [Google Scholar]
  26. Wang, S.; Kang, B.; Ma, J.; Zeng, X.; Xiao, M.; Guo, J.; Cai, M.; Yang, J.; Li, Y.; Meng, X.; et al. A deep learning algorithm using CT images to screen for Corona Virus Disease (COVID-19). medRxiv 2020. [Google Scholar] [CrossRef] [Green Version]
  27. Chouhan, V.; Singh, S.K.; Khamparia, A.; Gupta, N.; Tiwari, P.; Moreira, C.; Damasevicius, R.; De Albuquerque, V.H.C. A Novel Transfer Learning Based Approach for Pneumonia Detection in Chest X-ray Images. Appl. Sci. 2020, 10, 559. [Google Scholar] [CrossRef] [Green Version]
  28. Lakhani, P.; Sundaram, B. Deep Learning at Chest Radiography: Automated Classification of Pulmonary Tuberculosis by Using Convolutional Neural Networks. Radiology 2017, 284, 574–582. [Google Scholar] [CrossRef]
  29. Fraz, M.M.; Remagnino, P.; Hoppe, A.; Uyyanonvara, B.; Rudnicka, A.R.; Owen, C.G.; Barman, S.A. An Ensemble Classification-Based Approach Applied to Retinal Blood Vessel Segmentation. IEEE Trans. Biomed. Eng. 2012, 59, 2538–2548. [Google Scholar] [CrossRef]
  30. Radiological Society of North America. RSNA Pneumonia Detection Challenge. 2018. Available online: https://www.rsna.org/en/education/ai-resources-and-training/ai-image-challenge/RSNA-Pneumonia-Detection-Challenge-2018 (accessed on 14 April 2020).
  31. Kaggle. Available online: https://www.kaggle.com/andrewmvd/convid19-xrays (accessed on 14 April 2020).
  32. Cohen, J.P.; Morrison, P.; Dao, L. COVID-19 image data collection. arXiv 2020, arXiv:2003.11597. [Google Scholar]
  33. Shorten, C.; Khoshgoftaar, T.M. A survey on Image Data Augmentation for Deep Learning. J. Big Data 2019, 6, 60. [Google Scholar] [CrossRef]
  34. Yamashita, R.; Nishio, M.; Do, R.K.G.; Togashi, K. Convolutional neural networks: An overview and application in radiology. Insights Imaging 2018, 9, 611–629. [Google Scholar] [CrossRef] [Green Version]
  35. Rawat, W.; Wang, Z. Deep convolutional neural networks for image classification: A comprehensive review. Neural Comput. 2017, 29, 2352–2449. [Google Scholar] [CrossRef] [PubMed]
  36. He, K.; Zhang, X.; Ren, S.; Sun, J. Deep Residual Learning for Image Recognition. In Proceedings of the 2016 IEEE Conference on Computer Vision and Pattern Recognition, Las Vegas, NV, USA, 27–30 June 2016; pp. 770–778. [Google Scholar]
  37. Tharwat, A. Classification assessment methods. Appl. Comput. Inform. 2020. [Google Scholar] [CrossRef]
  38. Kim, T.-K. T test as a parametric statistic. Korean J. Anesthesiol. 2015, 68, 540–546. [Google Scholar] [CrossRef] [PubMed] [Green Version]
Figure 1. Dataset preparation. (a) The raw and refined datasets used in this study. (b) Represented images excluded from the pneumonia (left) and COVID-19 (right) datasets.
Electronics 09 01388 g001
Figure 2. ResNet-18 architecture used in the proposed method. Res block1 is a regular ResNet block and Res block2 is a ResNet block with 1 × 1 convolution. FC stands for fully connected layer with 3 outputs.
Electronics 09 01388 g002
Figure 3. Neural networks preparation. (a) Sub neural networks (Models a, b, and c). These networks are trained to classify normal or diseased, pneumonia or non-pneumonia, and COVID-19 or non-COVID19 using Dataset_A, Dataset_B, and Dataset_C, respectively. (b) The main neural networks (Models A, Bab, Cac, Dbc, and Eabc). The main neural networks are trained to classify the three cases: normal, pneumonia, and COVID-19.
Electronics 09 01388 g003
Figure 4. The graph representation of cross-validated (mean) classification performance (F1-score, accuracy, and MCC) for each model trained with the (a) raw and (b) refined datasets. The error bar represents the standard deviation.
Electronics 09 01388 g004
Figure 5. Classification performance (mean) graph that represents F1-score of normal, pneumonia, and COVID-19, accuracy, and MCC for each model using 41 new COVID-19 images (uploaded in the GitHub https://github.com/ieee8023/covid-chestxray-dataset from 16 April 2020 to 5 May 2020). The error bar represents the standard deviation.
Electronics 09 01388 g005
Table 1. Class distribution (train, validation, and test sets) of the raw and refined datasets. In the beginning, we have separated 158 normal, 424 pneumonia, and 18 COVID-19 images from the raw dataset and 157 normal, 206 pneumonia, and 11 COVID-19 images from the refined dataset. Here, * represents the same image in the test sets.
DatasetClassRaw DatasetRefined Dataset
TotalTrainingTestTotalTrainingTest
TrainValidationTrainValidation
Dataset_ANormal15791137284158 *15771136284157 *
Pneumonia and COVID-1944293190797442
(424 * + 18 *)
21821572393217
(206 * + 11 *)
Dataset_BPneumonia42453057764424 *20661488372206 *
Normal and
COVID-19
17631270317176
(158 * + 18 *)
16931220305168
(157 * + 11 *)
Dataset_CCOVID-191841333318 *116842111 *
Normal and
Pneumonia
582441941048582
(158 * + 424 *)
36432624656363
(157 * + 206 *)
Dataset_DNormal15791137284158 *15771136284157 *
Pneumonia42453057764424 *20661488372206 *
COVID-191841333318 *116842111 *
Table 2. Cross-validated classification performance (mean ± SD) for each model using both raw and refined datasets. Comparison of the precision, recall, F1-score, accuracy, and Matthews correlation coefficient (MCC). The color background highlights the performance of the single ResNet model and the proposed ensemble model.
-Model A (Single ResNet)Model Bab (a + b)Model
Cac (a + c)
Model
Dbc (b + c)
Model Eabc (a + b + c)
Raw
Dataset
NormalPrecision0.776 ± 0.110.830 ± 0.040.812 ± 0.010.846 ± 0.100.874 ± 0.03
Recall0.944 ± 0.070.964 ± 0.020.980 ± 0.010.942 ± 0.070.976 ± 0.01
F1-score0.844 ±0.050.892 ± 0.010.882 ± 0.010.884 ± 0.040.922 ± 0.02
PneumoniaPrecision0.984 ± 0.020.988 ± 0.010.996 ± 0.010.984 ± 0.020.994 ± 0.004
Recall0.884 ± 0.070.920 ± 0.020.902 ± 0.010.918 ± 0.060.944 ± 0.01
F1-score0.940 ± 0.030.950 ± 0.010.948 ± 0.010.950 ± 0.030.968 ± 0.01
COVID-19Precision0.838 ± 0.070.896 ± 0.040.894 ± 0.100.893 ± 0.120.940 ± 0.08
Recall1.0001.0001.0001.0001.000
F1-score0.910 ± 0.040.944 ± 0.020.940 ± 0.060.928 ± 0.060.966± 0.04
Accuracy0.903 ± 0.040.933 ± 0.010.924 ± 0.010.940 ± 0.070.955 ± 0.01
MCC0.801 ± 0.060.858 ± 0.010.850 ± 0.030.870 ± 0.010.896 ± 0.02
Refined
Dataset
NormalPrecision0.874 ± 0.060.876 ± 0.020.884 ± 0.030.896 ± 0.010.902 ± 0.03
Recall0.950 ± 0.040.982 ± 0.010.980 ± 0.010.970 ± 0.010.964 ± 0.03
F1-score0.910 ± 0.010.924 ± 0.010.928 ± 0.010.932 ± 0.0040.934 ± 0.01
PneumoniaPrecision0.970 ± 0.030.982 ± 0.010.984 ± 0.010.978 ± 0.010.972 ± 0.02
Recall0.878 ± 0.060.882 ± 0.020.880 ± 0.030.896 ± 0.010.912 ± 0.03
F1-score0.916 ± 0.020.930 ± 0.010.930 ± 0.010.936 ± 0.0050.940 ± 0.01
COVID-19Precision0.674 ± 0.050.834 ± 0.080.734 ± 0.060.694 ± 0.060.896 ± 0.07
Recall1.0001.0001.0001.0001.000
F1-score0.804 ± 0.030.910 ± 0.040.844 ± 0.040.820 ± 0.040.944 ± 0.04
Accuracy0.909 ± 0.010.927 ± 0.010.924 ± 0.010.930 ± 0.0050.939 ± 0.01
MCC0.830 ± 0.020.862 ± 0.010.862 ± 0.020.868 ± 0.010.884 ± 0.02
Table 3. Results for means of predictive probability value (PPV) and t-test evaluated using the distributions of PPV for the single ResNet (Model A) and ensemble ResNets (Models Bab, Cac, Dbc, and Eabc). The color background highlights the performance of the single ResNet model and the proposed ensemble model.
ModelsPPVAEabc
t-Valuep-Valuet-Valuep-Value
A0.898 ± 0.18--4.4420.00001
Bab0.915 ± 0.161.6840.0462.1840.025
Cac0.918 ± 0.201.9130.0282.1450.016
Dbc0.918 ± 0.201.9130.0282.1450.016
Eabc0.942 ± 0.164.4420.00001--
Table 4. Classification performance (Accuracy, Precession, and Recall) of proposed and existing methods used for 3 class classification.
Methods
Used In
No. of ImagesModelAccuracy
(%)
Precision
(%)
Recall
(%)
[7]500 Normal, 500 Pneumonia, 125 COVID-19 DarkCovidNet87.0289.9685.35
[17]1583 Normal, 4290 Pneumonia, 76 COVID-19 COVIDiagnosis-Net98.2699.35100
[18]310 Normal, 330 Pneumonia Bacterial, 327 Pneumonia Viral Images, 284 Covid-19CoroNet89.690.089.92
[19]8851 Normal, 6054 Pneumonia, 180 COVID-19Xception and ResNet50V291.435.2780.53
[20]504 Normal, 700 Pneumonia, 224 COVID-19VGG-1993.4893.2792.85
[21]8066 Normal, 5538 COVID-19(-), 358 COVID-19COVID-Net93.398.991
Proposed1579 Normal, 4245 Pneumonia, 184 COVID-19
(raw dataset)
Ensemble
3 ResNet-18
95.594.0100
1577 Normal, 2066 Pneumonia, 116 COVID-19
(refined dataset)
93.989.6100

