1. Introduction
In recent years, there has been a great development of piezoelectric energy harvesters to transform vibration kinetic energy into useful electric energy. Many applications have been proposed in the fields of aerospace [
1], ground vehicles [
2,
3], structures and machines [
4], biomedical devices [
5], sport equipment [
6]. Vibration energy harvesting is an eco-friendly technology and lead-free piezoelectric materials are under development [
7].
Vibration energy harvesters are very useful when, on the one hand very small amounts of energy are needed, and on the other hand different kinds of power supply are problematic (e.g., long wiring, frequent battery replacement). Vibration energy harvesting technologies can be used in combination with other technologies in order to make up an efficient power supply (e.g., harvesters can be used to recharge batteries).
The bicycle is very popular sport equipment and also an efficient means of transport that strongly contributes to eco-friendly mobility in urban and sub-urban areas. The rolling motion of the wheels on a rough road generates significant vibration levels in many parts of the bicycle and some researches have been carried out to improve riding comfort [
8,
9]. Vibration levels are low only in very particular conditions, as in racing bicycles in indoor tracks or in top-level city bicycles equipped with shock absorbers and running in good quality bicycle lanes. Typically, bicycles run on rough roads generating relevant vibration levels for rather long times and require small amounts of electrical energy (e.g., to feed on-board computers or speedometers), or require more relevant amounts of electrical energy for a short time (e.g., during night to feed lights). Various physical phenomena can be exploited to scavenge energy form bicycle motion [
10,
11]. The possibility of using in bicycles piezoelectric harvesters was studied in 2008 by Minazara, Vasic and Costa [
12]. Experimental tests carried out by the same authors were reported in [
13] and showed that the harvested power was enough to feed a small on-board computer. Simulation results dealing with a piezoelectric device that harvests energy from low frequency bicycle vibrations were presented in [
14].
The first studies on bicycle energy harvesting highlighted that most of vibrations’ energy is concentrated in a low frequency band [
12] (maximum frequency lower than
Hz) whereas the commercially available harvesters have higher natural frequencies (about 100 Hz). The improvement of the performance of the energy harvesting system requires a proper tuning of the harvester natural frequency to the dominant frequency of bicycle vibrations [
15,
16]. Therefore, the development of tuning devices is a key issue in vibration energy harvesting from bicycles.
This paper focuses on piezoelectric harvesters and is organized as follows.
Section 2 deals with experimental methods to measure acceleration power spectral densities (PSDs) of bicycle vibrations on the road. In
Section 3 the results of a wide series of experimental tests are reported. These tests aimed at characterizing bicycle vibrations in the frequency domain, considering the effect of some important parameters as bicycle geometry, bicycle speed, accelerometer location. In
Section 4 the problem of harvester tuning is addressed. The advantages and the limits of the tip mass, which is the simplest tuning device [
16], are discussed. Then, more complex tuning devices are analysed. They are based on the idea of connecting the tip mass to the harvester by means of an elastic connection, making up an auxiliary oscillator, since auxiliary oscillators can strongly reduce the harvester frequency with a limited amount of added mass [
17]. In
Section 5 a mathematical model of the harvester with the tuning device is developed, in which the harvester is modelled as a continuous beam and the tuning device as a lumped parameter system [
15,
16,
17,
18]. According to simulation results, harvesters tuned to bicycle vibrations are developed in
Section 6. These harvesters are tested in laboratory in order to measure their frequency response functions (FRFs).
Section 7 presents experimental methods and results.
Section 8 deals with the prediction of harvester electric power. The availability of the acceleration PSDs of some points of the bicycles in various conditions and of the experimental FRFs of some harvesters with tuning devices makes it possible to test the potentialities of energy harvesting systems in many scenarios without mounting the harvesters on the bicycles and carrying out specific road tests. Finally, conclusions are drawn.
2. Measurement of Bicycle Vibrations
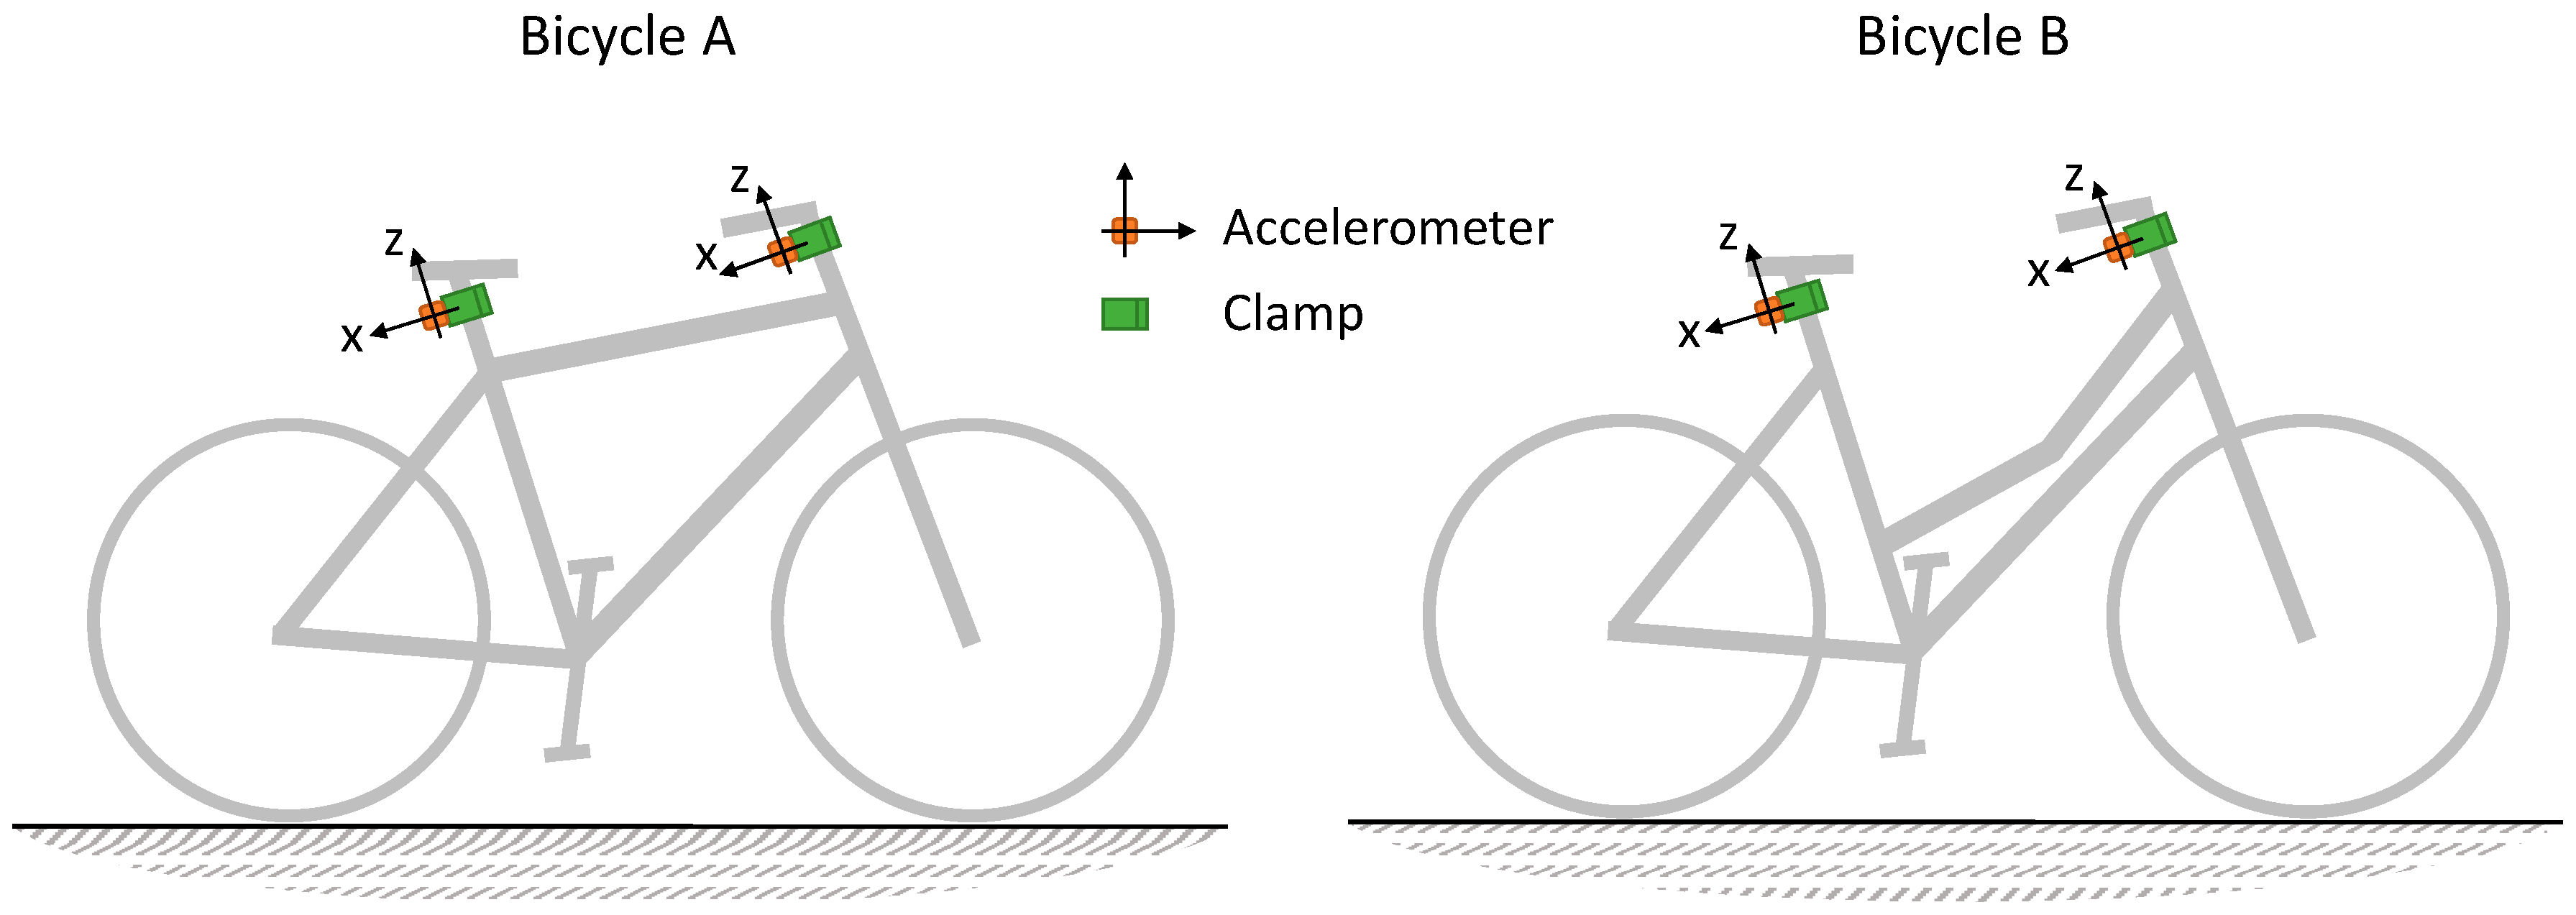
On-road vibrations are measured on the two locations specified in
Figure 1: the steerer tube (close to the handlebar stem), and the seatpost (close to the saddle). The tests involve two city bicycles with steel frames (whose characteristics are reported in
Table 1), both ridden by the same rider (male, mass: 65 kg, height: 1.72 m, age: 60). The road-testing protocol requires riding along a 150 m plane and straight stretch of a paved bicycle lane, pedalling continuously. The rider is instructed to aim at maintaining a constant target speed: three speeds (10 km/h, 15 km/h and 20 km/h) are selected, based on the typical speed range of urban riding. Three runs are performed for each speed, in order to check repeatability. Acceleration is recorded with a sampling frequency of 1630 Hz, using a MEMS triaxial accelerometer and datalogger (Midé Slam Stick C, LOG-0003-16G-8GB-PC, resolution 0.04 m/s
2), fixed to the vehicle through a custom-built clamp. For each measurement point, two acceleration components in the plane on the vehicle are logged, one parallel (‘z axis’, roughly vertical) and one perpendicular (‘x axis’, roughly horizontal) to the frame tubes, as depicted in
Figure 1.
3. PSD of Bicycle Vibrations
The power spectral density of the acceleration components measured in road tests is computed using the Welch algorithm [
19].
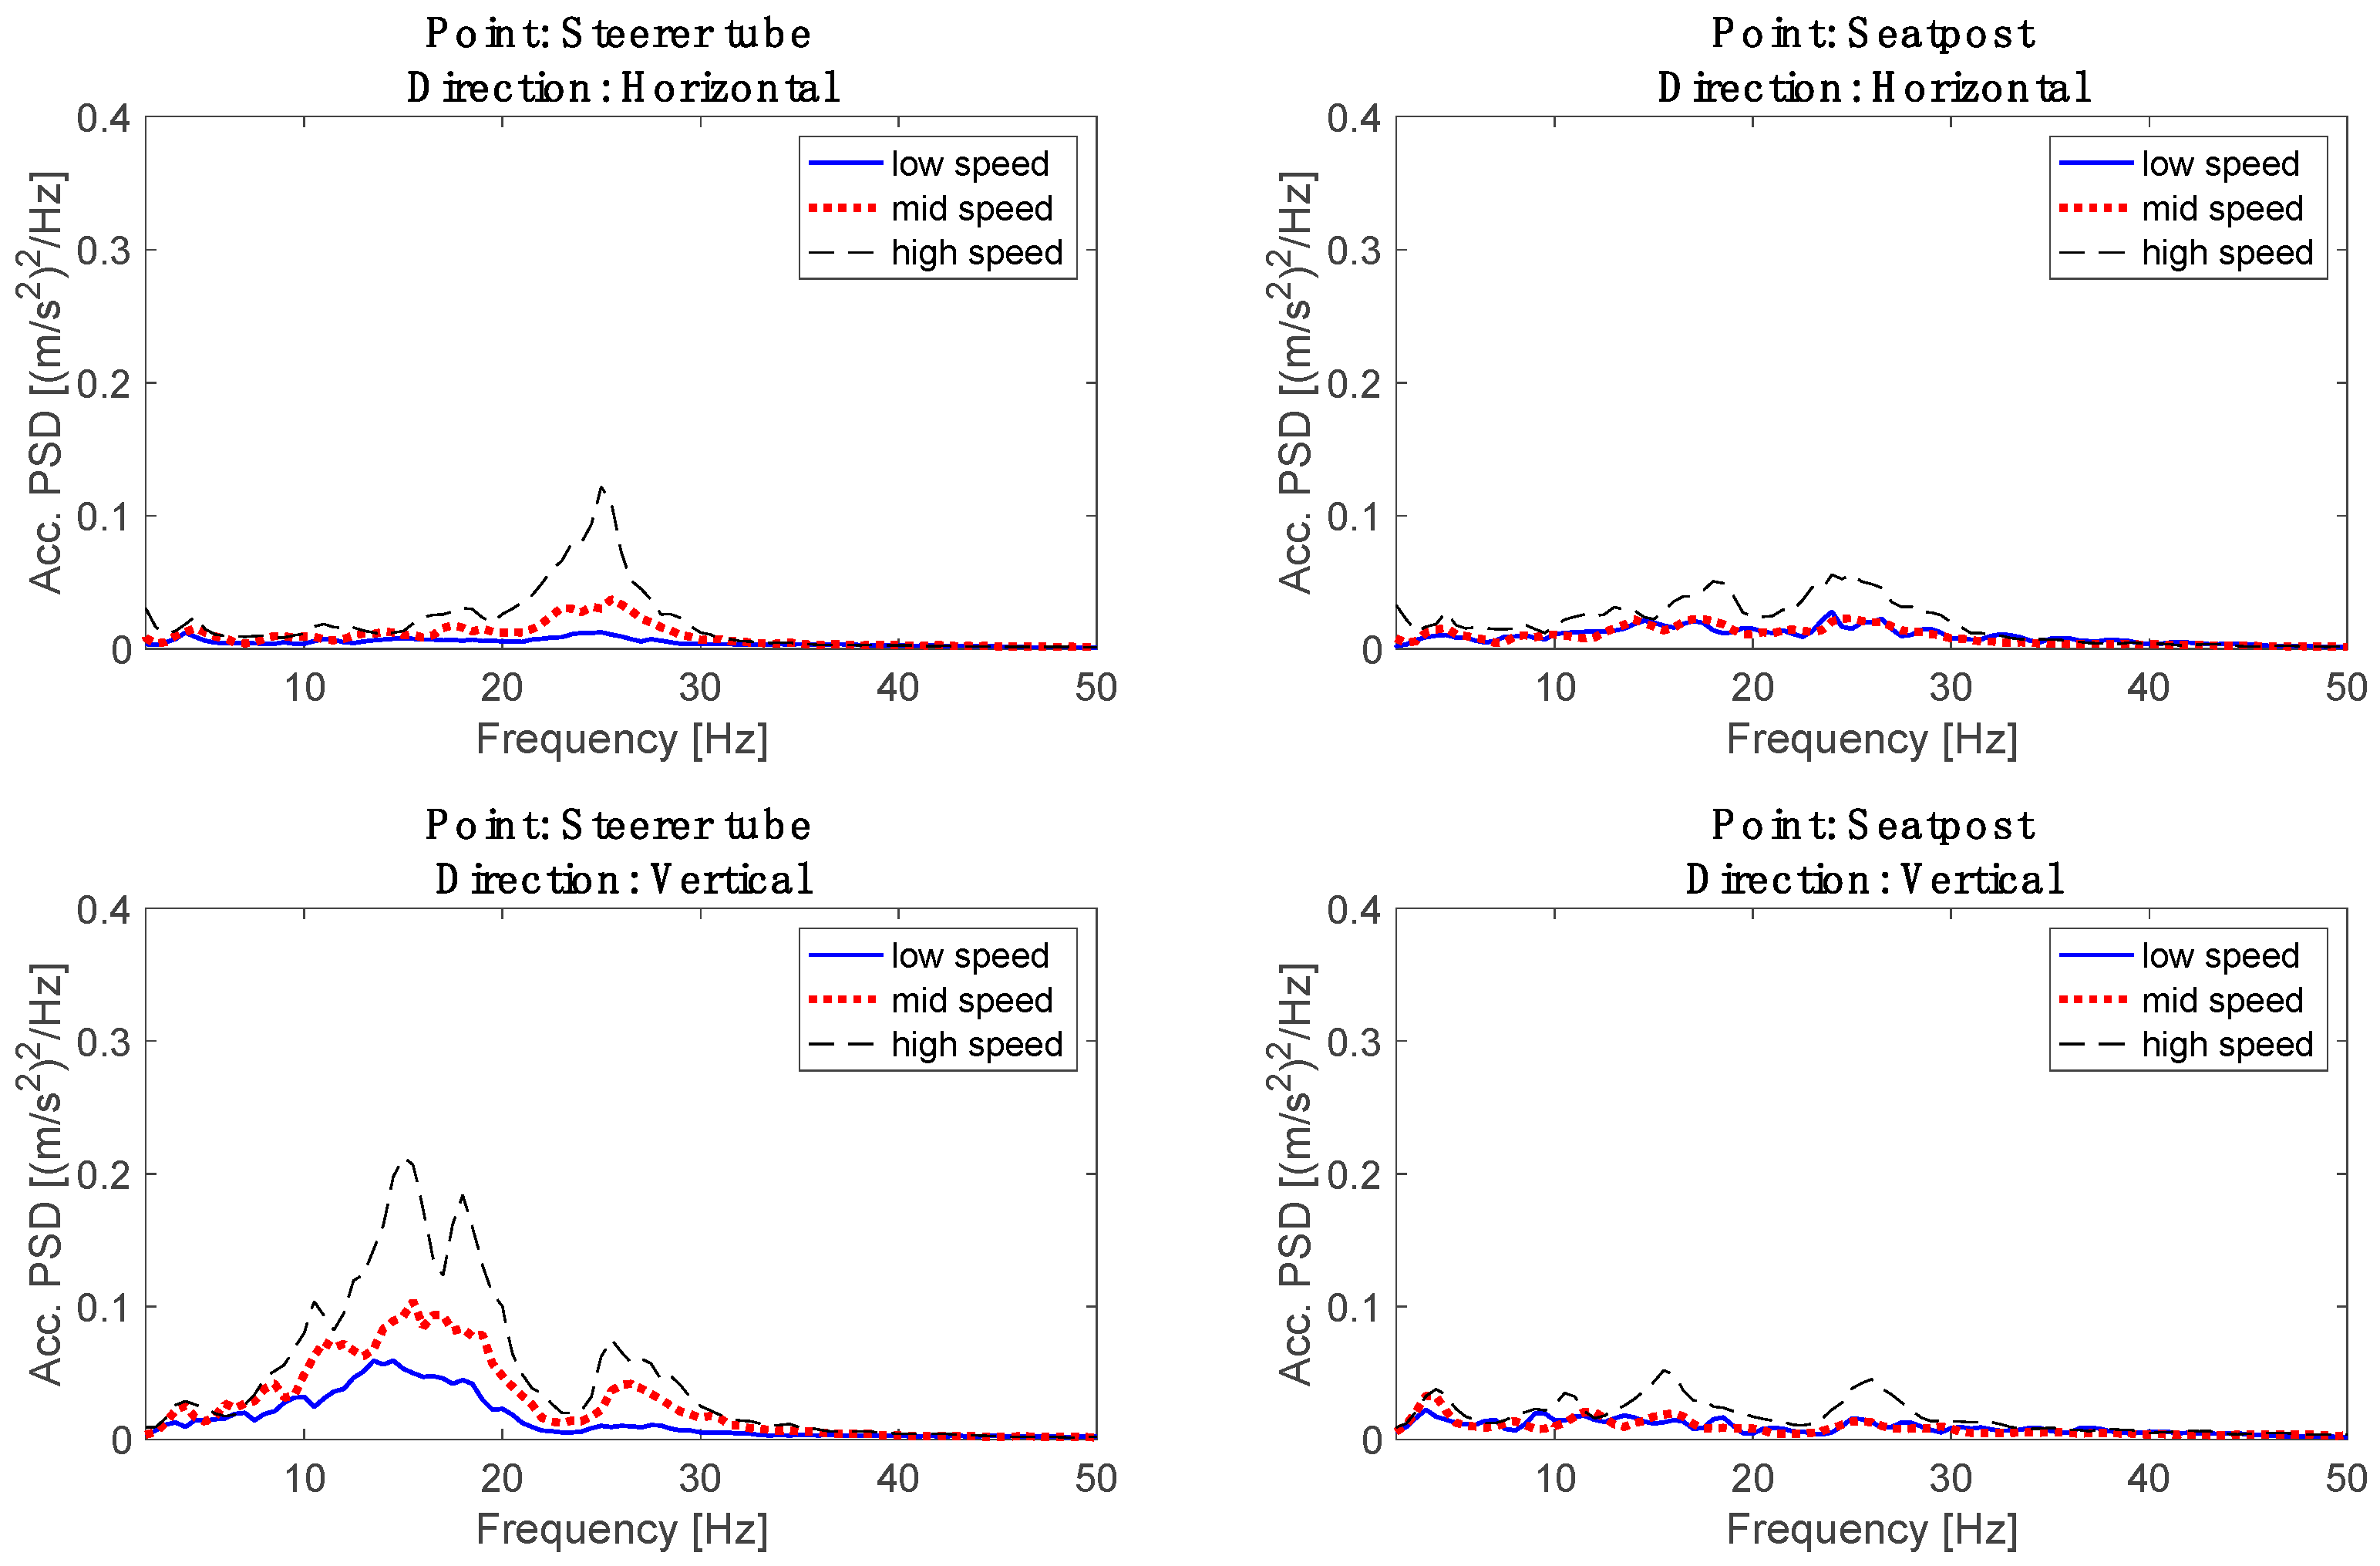
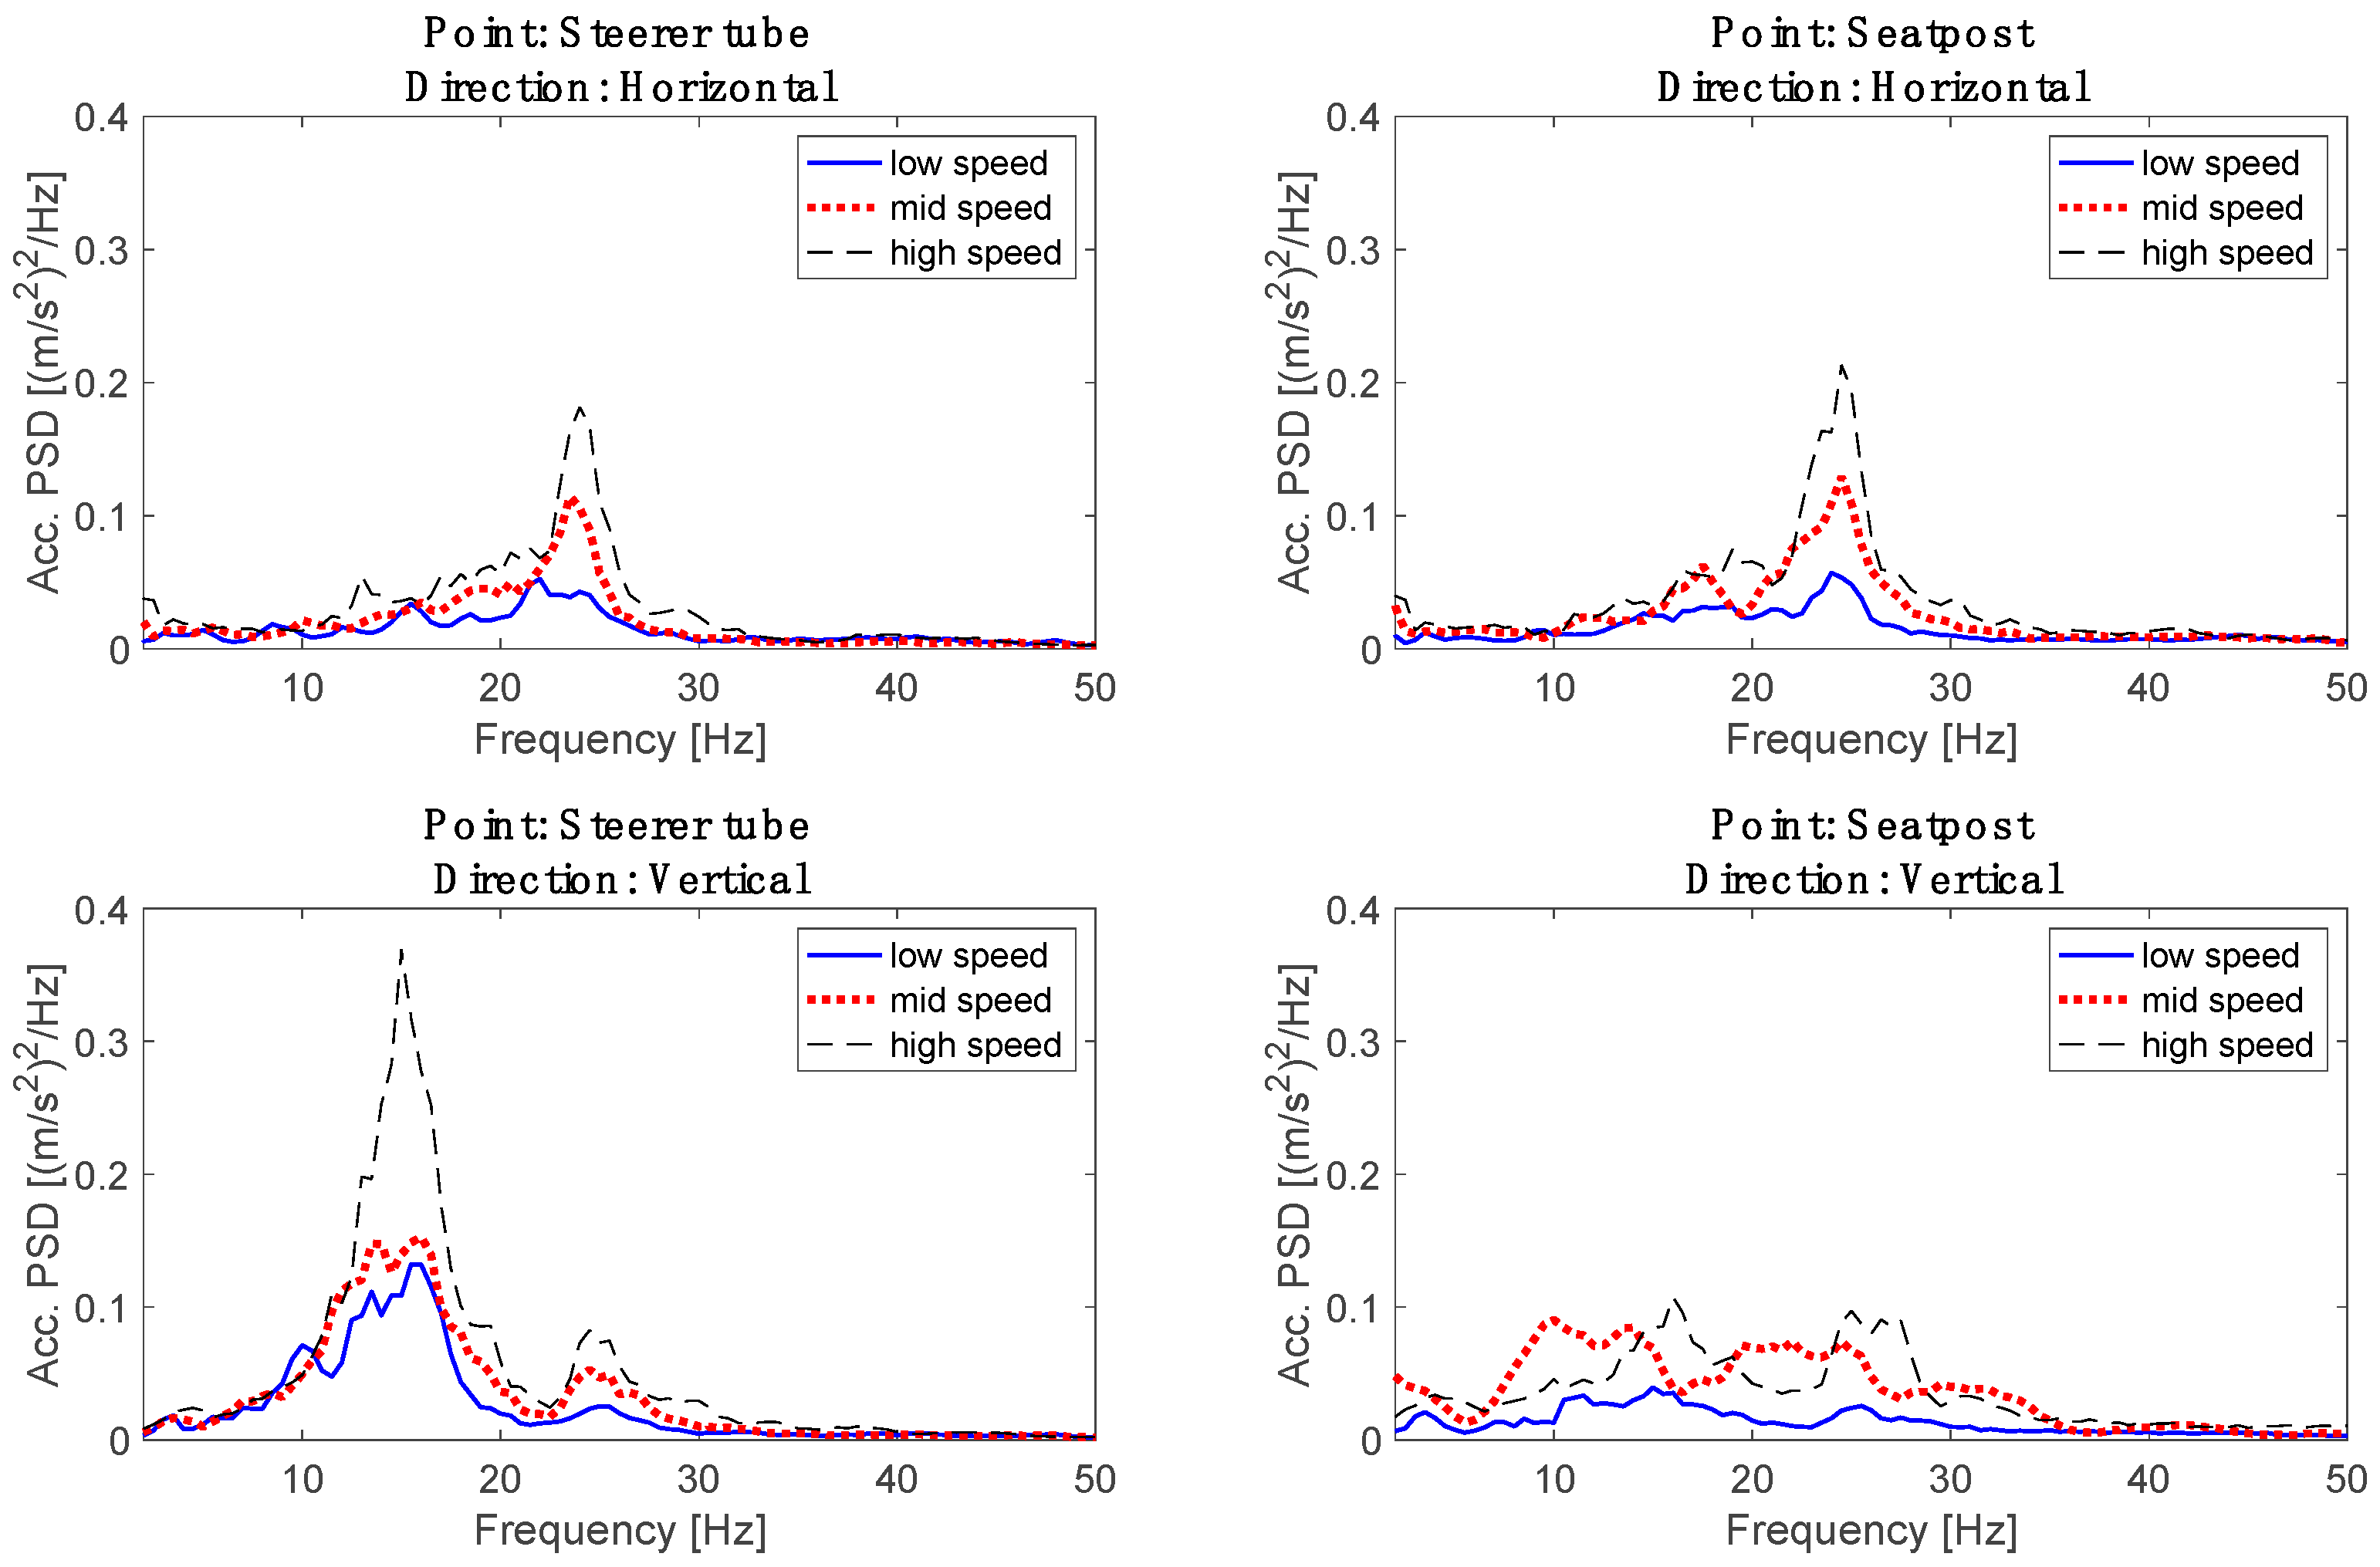
Figure 2 and
Figure 3 report the PSDs of the two acceleration components measured on the selected locations of bicycles A and B respectively.
A notable characteristic of these spectra is the fact that the vibration level increases with speed. The vehicle-rider system is excited by road unevenness, and the typical shape of the power spectral density of road profiles [
20] involves perturbations that decrease in amplitude for increasing wavelength. As a consequence, the higher the vehicle speed, the higher the road input at a given time frequency, which in turn causes a higher vehicle response. It must be noticed that, while the amplitude of the peaks modifies with speed, their frequency remains unchanged. Indeed, the frequency of the peaks of the acceleration PSDs can be related to the frequency of the in-plane vibration modes of the bicycle [
21], which are essentially independent from speed.
Another evident feature of these acceleration PSDs is that almost all the power is contained in the range 0–40 Hz, as a consequence of the tyre filtering effect [
9]. The pneumatic tyre acts like a low-pass filter on the road profile, filtering low-wavelength perturbations thanks to its geometry and compliance. Consequently, vehicle vibrations are negligible above a certain frequency, since the system is not excited in this frequency range.
Analysing in more detail
Figure 2 and
Figure 3, it is possible to notice that vibrations are more relevant at the steerer tube than at the seatpost. Moreover, vibrations are prevalent in the vertical direction. As an exception to these general trends, Bicycle B exhibits high vibrations in the horizontal direction at the seatpost. This can be associated to the excitation of a vibration mode, typical of the step-through design, which mainly involves horizontal vibrations of the seatpost and steerer tube (the ‘scissor mode’ identified in [
21]).
The main peaks of the PSDs of vertical accelerations are in the range 10–20 Hz, while the maximum amplitude of the PSDs of horizontal accelerations is reached around 25 Hz. This aspect is particularly critical in order to achieve a proper tuning of the harvester device.
Vibrations measured on the tested bicycles running on bicycle lanes have root mean square values (RMS) in the range (1–2 m/s2). Commercial piezoelectric harvesters excited by vibrations with similar RMS values exhibit a linear behaviour, so that linear mathematical models can be used to predict their behaviour when mounted on bicycles.
4. Harvester Tuning to the Bicycle
The analysis in the frequency domain of road tests results clearly highlighted that for both bicycles most of vibration energy is contained into a low frequency band. The increase in bicycle speed increases the amplitude of vibrations but does not shift the peaks of the acceleration PSDs, which are related to the modes of vibration of the bicycle.
Piezoelectric energy harvesters can operate in the 33 mode and in the 31 mode [
22]. In the former mode the mechanical stress and the voltage act in the same direction, whereas in the latter mode the mechanical stress and the voltage act in perpendicular direction. Most of commercial harvesters are cantilever harvesters operating in the 31 mode, even if the electro-mechanical coupling coefficient for the 31 mode is lower than for the 33 mode. This happens because the bending stiffness of cantilever harvesters operating in the 31 mode is small and the resonant frequency results much smaller than the one of piezo-stacks operating in compression-traction (33 mode). Nevertheless, also the resonant frequency of cantilever harvesters is typically in the range 50–200 Hz, which is well above the frequency band of bicycle vibrations [
23]. It is worth noticing that a cantilever harvester is a distributed-parameter system with infinite natural frequencies, and the lowest natural frequency is usually named resonant frequency.
In order to improve the energy transfer from the vibration source to the harvester, the harvester resonant frequency has to be tuned to vibration frequency. If the vibration source is characterized by a wide-band spectrum, the resonant frequency of the harvester has to stay inside this band.
Once the resonant frequency of the harvester has been moved inside the band of the vibration source, the collection of energy can be improved by widening the working bandwidth of the harvester. In recent years some strategies for broad-band harvesting have been proposed [
24]. They can be classified into linear strategies (arrays of harvesters, coupled oscillators [
25,
26]), non-linear strategies (bi-stable harvesters, impact harvesters, liquid-filled tip masses [
27,
28]) and electronic strategies (switch networks, active tuning [
29]).
The focus of this research is on the first phase, i.e., on harvester tuning to bicycle vibrations.
The simplest method that can be adopted to tune the harvester to the dominant frequency of the vibration source is the addition of a tip mass [
16]. This method is simple, mathematical models that predict the effect of the tip mass are available, and the addition of the tip mass leads to an increase in the generated voltage. Nevertheless, the tip mass has two important drawbacks. If a large reduction in the resonant frequency is demanded, a large and cumbersome tip mass is needed. Since tip mass inertia force adds to the inertia force due to the distributed harvester mass, the stress inside the harvester strongly increases and the piezoelectric material can be damaged. This effect is important when a large tip mass is needed.
A large reduction in the resonant frequency of the harvester can be achieved also by coupling the harvester with an auxiliary mechanical oscillator. The concept of the auxiliary oscillator is similar to the concepts of dynamic vibration absorber [
18] and Helmholtz resonator [
30] that are widely used to control mechanical and acoustic vibrations.
Several researchers recently explored the effect of the auxiliary oscillator with different purposes. The possibility of widening the operating bandwidth was investigated in [
26,
31]. The possibility of developing harvesters tuned to the harmonic components of periodic vibrations was studied in [
15]. The possibility of lowering the first resonant frequency of the harvester was analysed in [
17,
32].
It is worth noticing that the auxiliary oscillator is a linear system. Hence, as far as the harvester itself exhibits a linear behaviour, the coupled system will have a linear behaviour. This property leads to some advantages, such as the possibility of representing the behaviour of the coupled system in the frequency domain by means of a frequency response function (FRF).
In [
17] a translational spring-damper-mass system was fixed to the tip of a cantilever harvester and a strong reduction in the first resonant frequency was detected (about 1000 Hz). This technology is very promising in the field of bicycle harvesting, where large reductions in the first resonant frequency are requested.
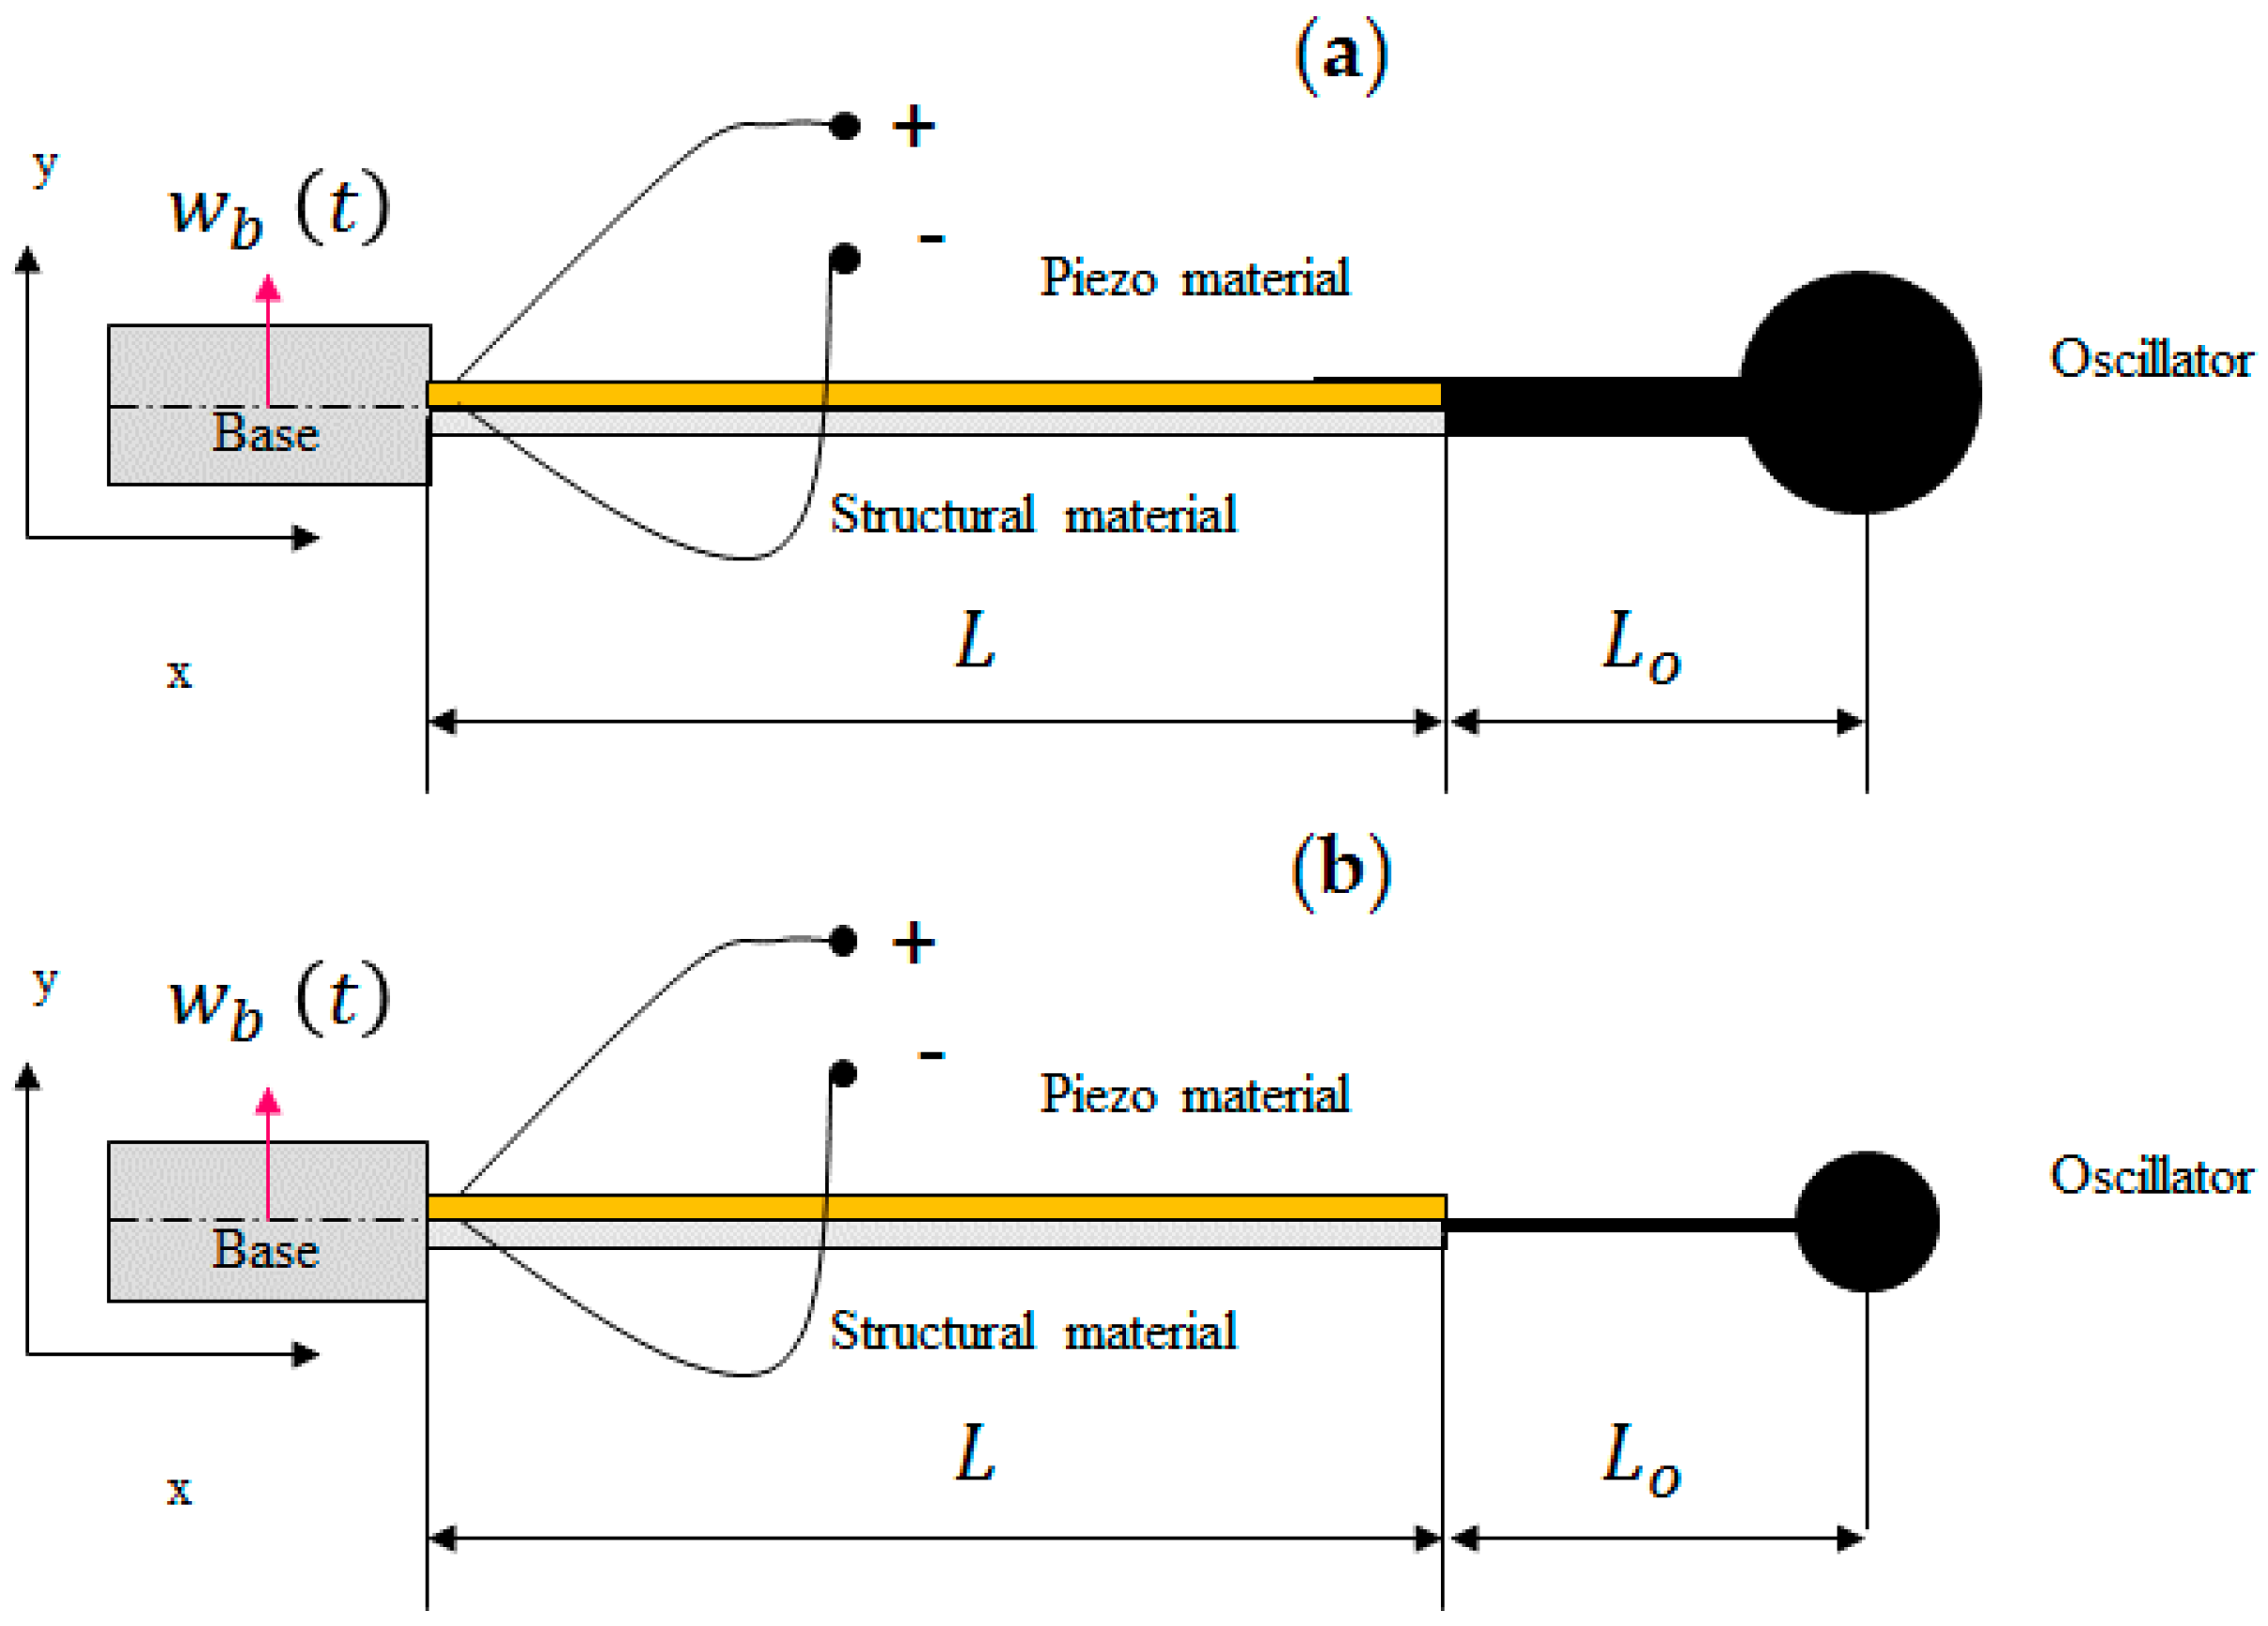
A cantilever oscillator composed of a mass mounted on a thin plate that has elastic and damping properties is sturdier and simpler to build than the translational spring-damper-mass system of [
17]. For this reason, the cantilever oscillator is adopted for tuning bicycle harvesters and a coupled model of the harvester with cantilever oscillator is developed. It is worth noticing that, if the cantilever is very short and stiff, this model can represent the harvester with added tip mass as well.
5. Mathematical Model
Some studies [
15,
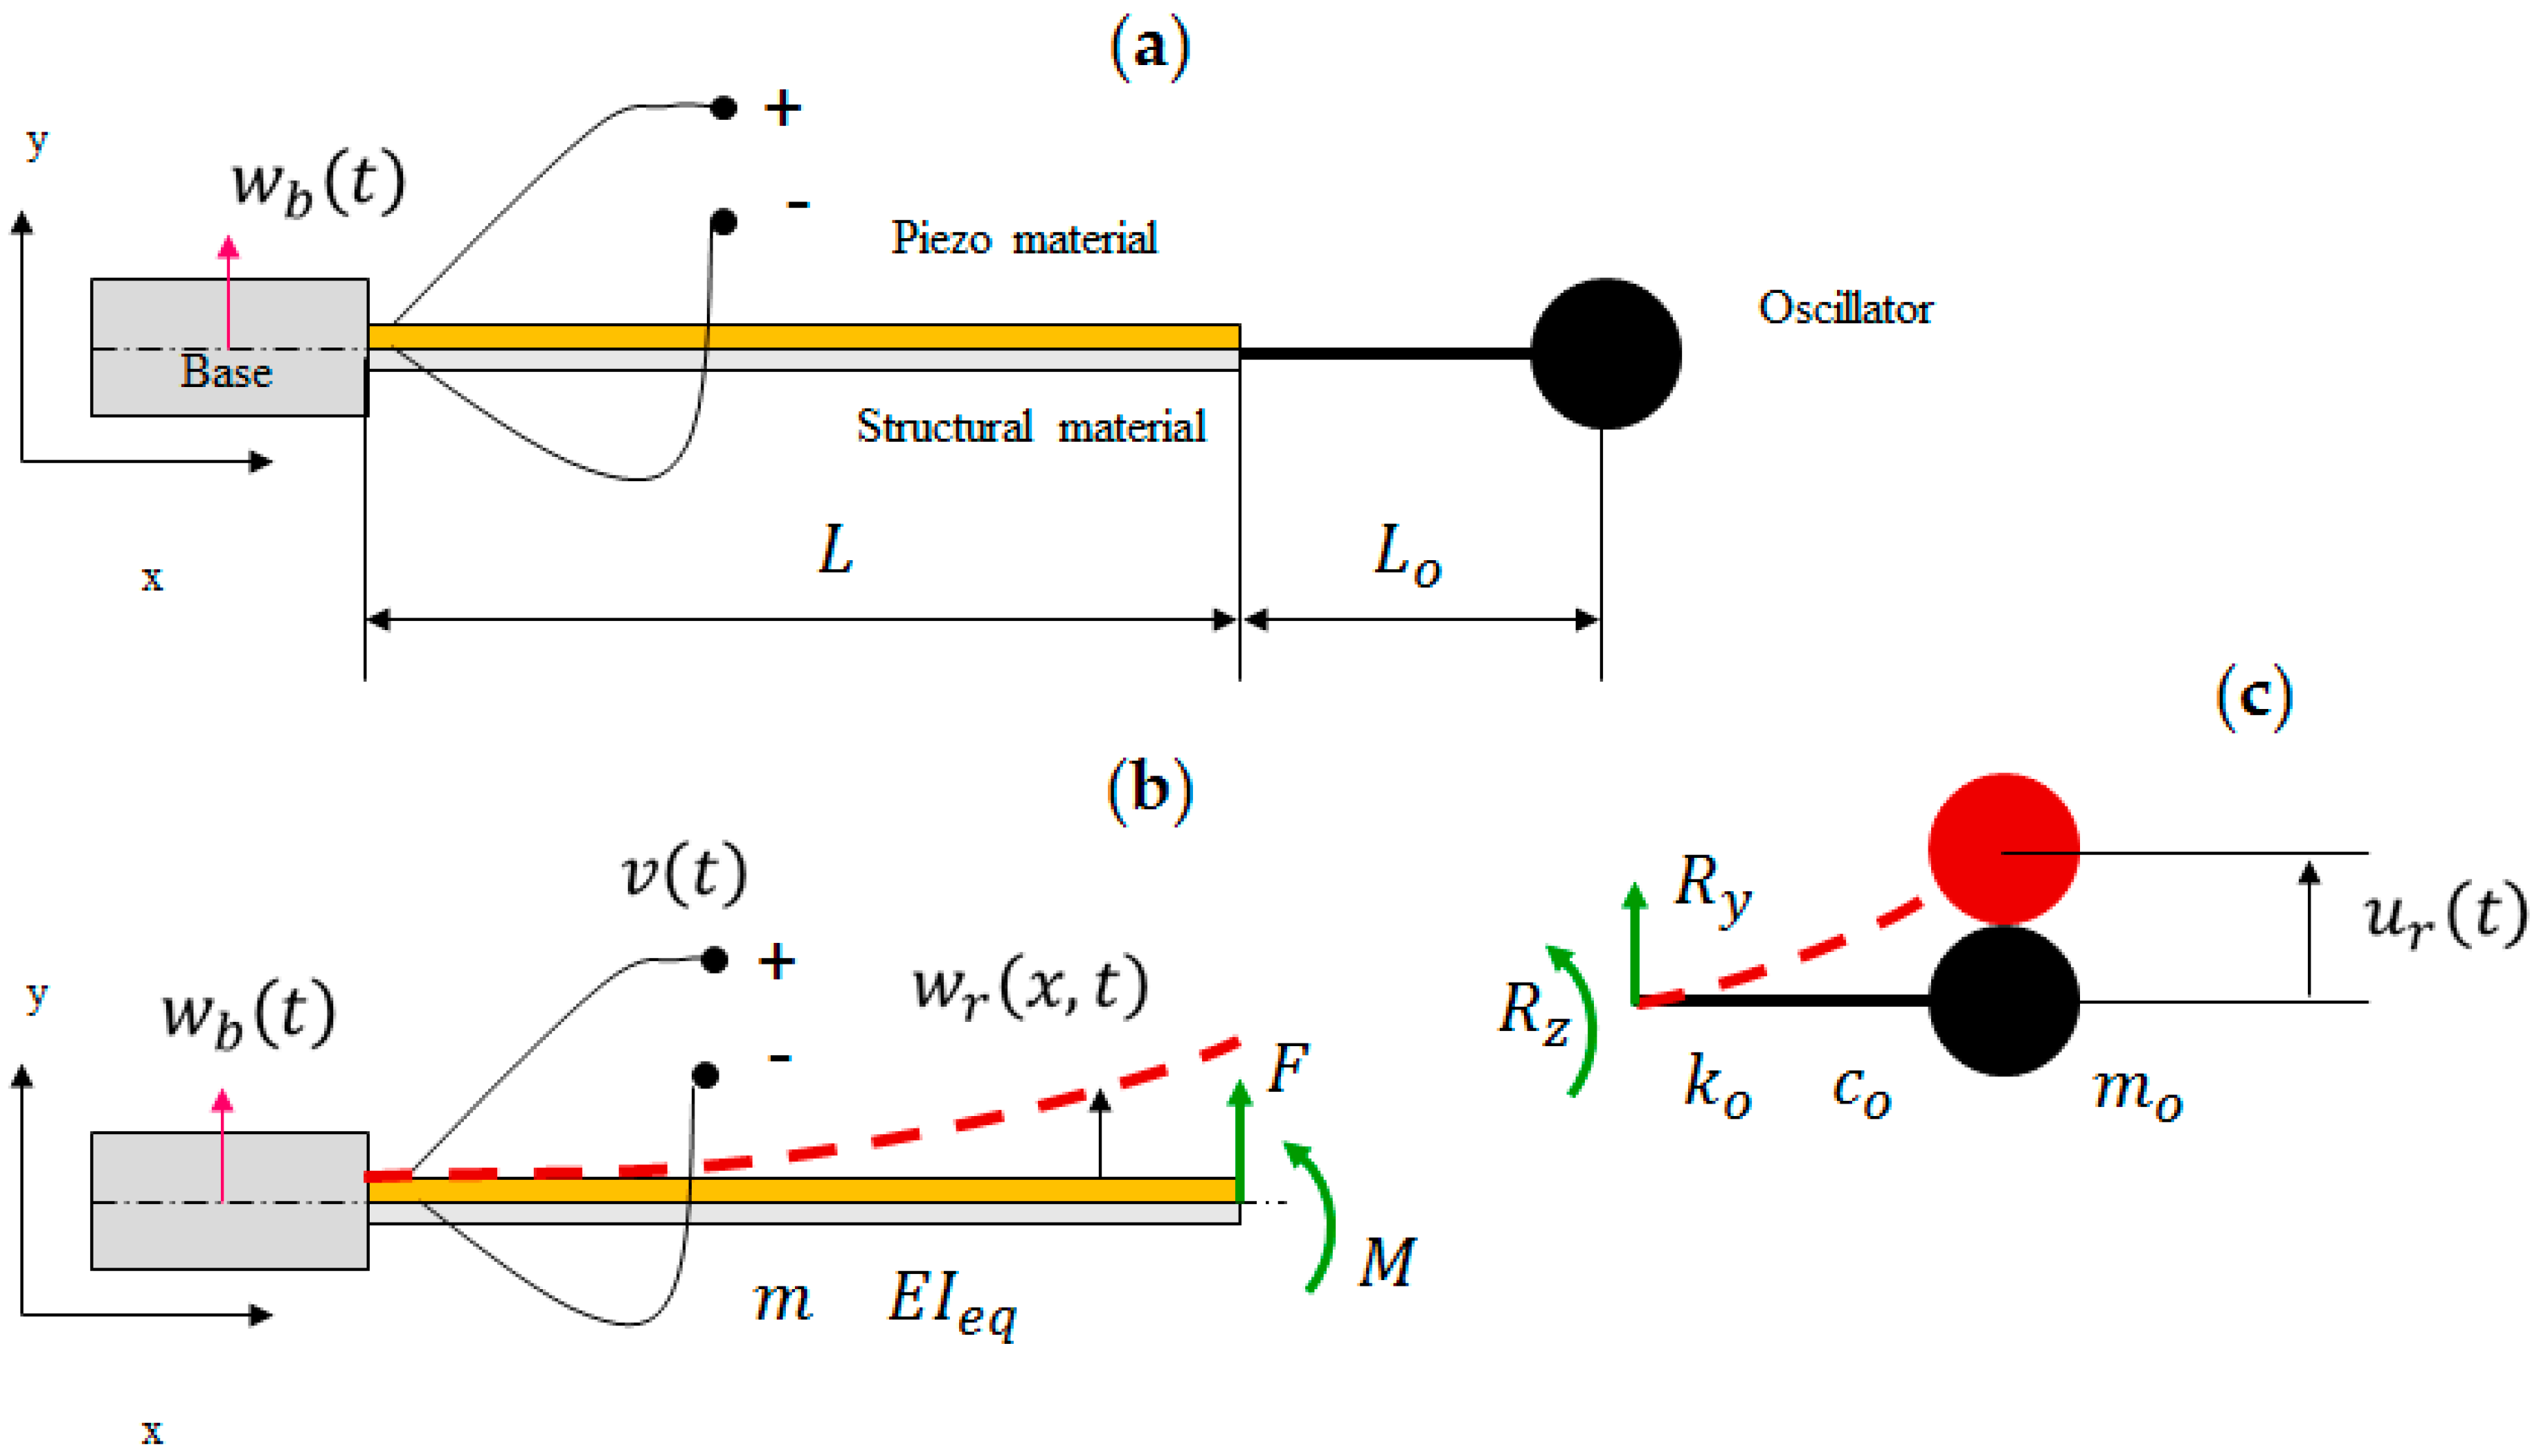
16] highlighted that the harvester’s response is dominated by the first mode of vibration even when the harvester is coupled with another oscillator. Thus, the dynamic model of
Figure 4 is developed, in which the harvester is described by its first mode of vibration and the oscillator is described with a lumped element approach.
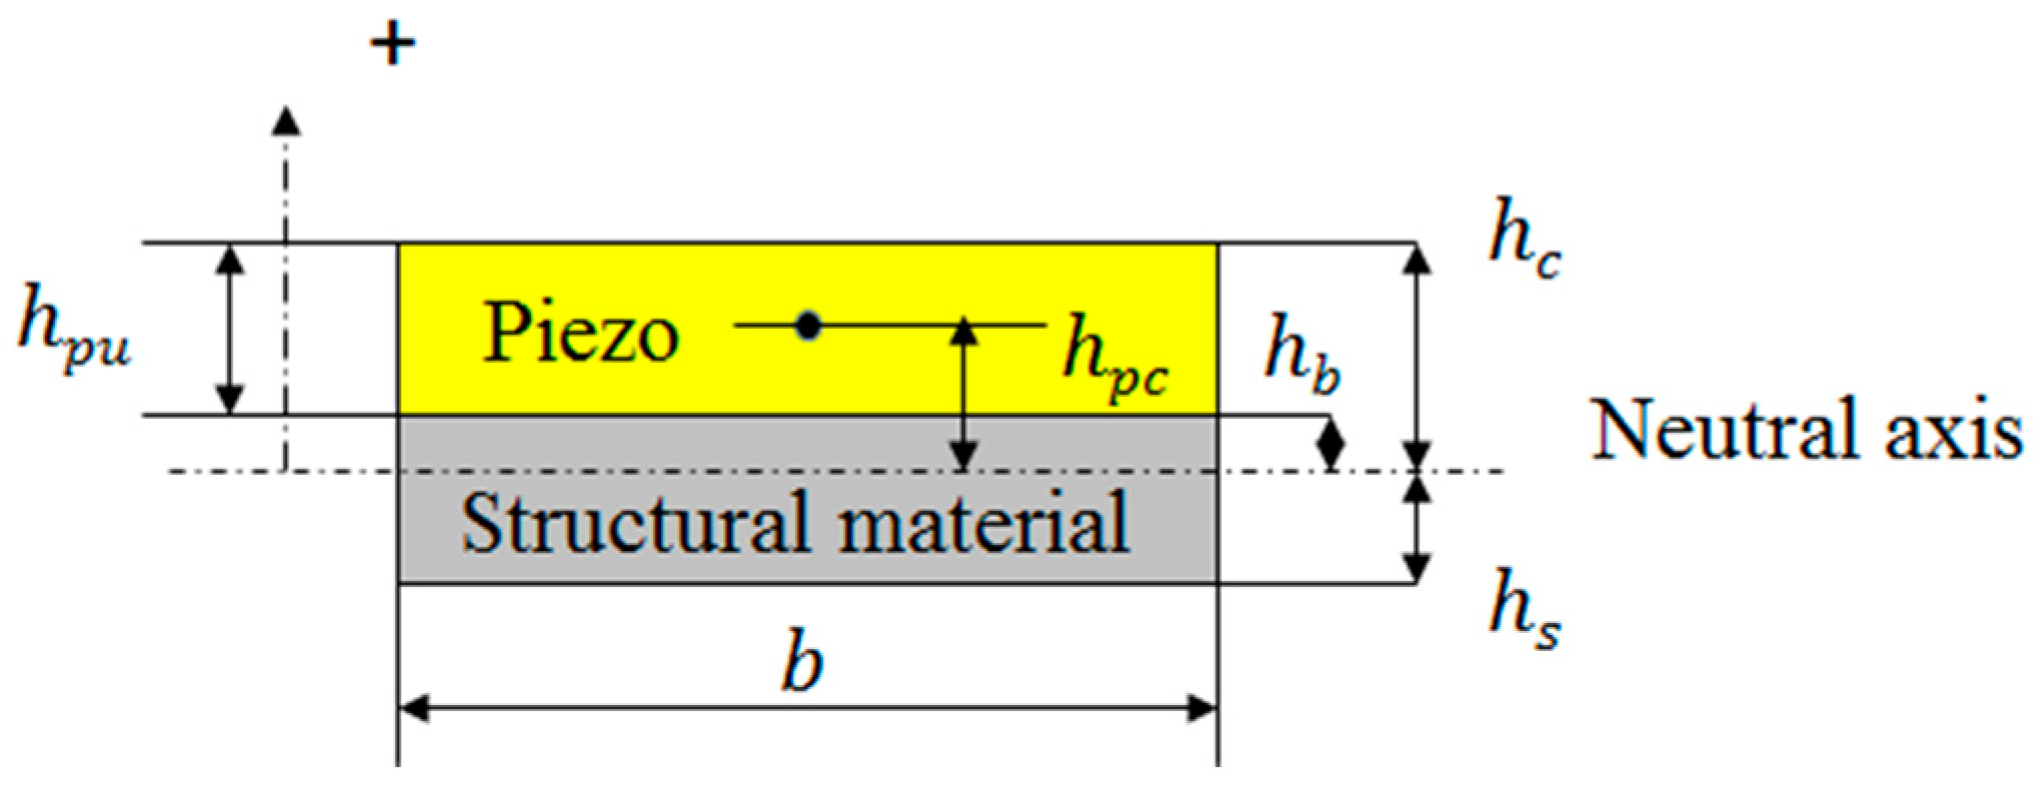
The cantilever harvester is a distributed parameter system, whose forced vibrations caused by base excitation are described by this partial differential equation:
where
is the displacement of any point along the harvester axis with respect to the base,
is the harvester length,
is the equivalent bending stiffness of the composite cross-section (see
Figure 5),
is the mass per unit length and
is the strain-rate damping coefficient, air damping is neglected because usually it has a small effect on harvester performance [
33].
is the Dirac delta function,
is the generated voltage and
is the piezoelectric coupling term [
16].
At the right-hand side of (1) there are the forcing term due to base excitation
and specific terms due to the interaction with the oscillator [
15].
is the force exerted by the oscillator on the harvester tip.
is the torque exerted by the oscillator on the harvester, its effect is represented by a couple of vertical forces with arm
, with
.
The piezo-electric coupling term is given by:
where
and
are the width and thickness of the piezo layer respectively.
and
are the positions of the bottom and top of the piezo layer with respect to the neutral axis of the composite cross-section (
Figure 5).
According to the proportional damping assumption, the equations of motion can be solved with the modal expansion approach [
33]. Generally speaking, displacement
is represented by a series of eigenfunctions:
where
is the
i-th mass-normalized mode of vibration and
is the
i-th modal coordinate. Since only one mode of vibration is considered:
Equation (4) transforms the partial differential equation into this ordinary differential equation:
In Equation (5)
is the undamped natural frequency of the first mode of vibration and
is modal damping. Coefficient
is the backward modal electromechanical coupling term [
16].
The ordinary differential equation of the oscillator is:
In which is the displacement of the mass of the oscillator with respect to the harvester tip, constants are oscillator mass, damping and stiffness respectively.
The inertia force and torque exerted by the oscillator on the harvester are:
is the length of the cantilever oscillator. If only the first mode of vibration is considered, (7), (8) and (9) become:
With these expressions of
and
Equation (5) becomes:
In [
16] the electrical behaviour of unimorph piezoelectric cantilevered harvester loaded by a resistor is simulated by using an equivalent R-C circuit connected to a current generator
. The electric circuit equation relates the harvester displacement to the electric voltage
, as:
where
and
are the internal capacitance of the piezo layer and the resistance of the external electric load, respectively. At the right-hand side
,
and
are the piezoelectric constant, the width of the piezoelectric layer and the distance between the neutral axis of the composite cross-section and the centre of the piezoelectric layer (
Figure 5).
If
is calculated considering only the first mode of vibration, and by noting that
due to clamped boundary condition, the right-hand side in (14) becomes:
where
is the electro-mechanic coupling term of the first mode defined in [
16] as:
The aim of the mathematical model is the calculation of the FRF between the voltage generated by the harvester and base acceleration. Therefore, a harmonic solution of the system of (10), (13) and (14) is looked for by setting:
The equation of the oscillator in the frequency domain becomes:
and gives:
The electrical equation in the frequency domain becomes:
and gives:
When the harmonic solution is inserted into (13), the following equation results:
where
is a constant:
In this equation
and
can be expressed as functions of
by means (19) and (21) respectively. After manipulation, the FRF between
and the acceleration input (
) can be calculated:
Finally, the voltage FRF between
and
can be calculated by using (21) and (24):
The FRF between the open-circuit voltage and the input acceleration can be calculated as the limit of (25) for
:
6. Calculated Results
In the framework of this research the possibility of harvesting energy form bicycle vibrations by means of a MIDE PPA-1001 cantilever harvester was investigated. This harvester was selected because its size is compatible with a bicycle and because it is a typical unimorph harvester, whose properties are well known and reported in scientific papers [
34,
35]. Moreover, this harvester is sturdy and fairly cheap. The active piezoelectric layer is made of PZT and is 0.15 mm thick (
0.15 mm in
Figure 5). The structural layer is made of steel and is 0.15 mm thick. The natural frequency of PPA-1001 is about 120 Hz, and depends on the position of the clamp. Since this frequency is well above the frequency band that contains most of the energy associated with bicycle vibrations, the effect of tip masses and auxiliary oscillators was simulated by means of the mathematical model.
In order to design a suitable auxiliary oscillator, the following criterion was followed. The aim was to modify the modal behaviour of the harvester so that the new system presents its first bending mode at about 20 Hz. To achieve this result, the appropriate stiffness and mass must be selected for the oscillator. Simple calculations based on a lumped-elements model were employed to find the oscillator characteristics. The whole system is considered as a single cantilever beam having a mass attached to its free end. The stiffness of the beam is equal to the stiffness series of the harvester and of the added elastic element. The mass at the tip of the simplified model accounts for both the actual mass that is added to the system and a share of the mass of the beam structure (sum of the masses of the harvester and the oscillator elastic element). Using this model, the oscillator characteristics can be calculated from:
where
,
and
are the stiffness and mass of the harvester,
and
are the stiffness and mass of the oscillator elastic element, and
is the additional mass at the free end of the oscillator. The solution is not unique: the same natural frequency of the system can be obtained using either a stiff high–mass oscillator or a compliant low–mass oscillator. The two oscillators are represented in
Figure 6 and their characteristics are summarized in
Table 2. In the following, the two solutions are analysed and compared.
The effect of the tuning devices was then predicted by means of the mathematical model of
Section 5.
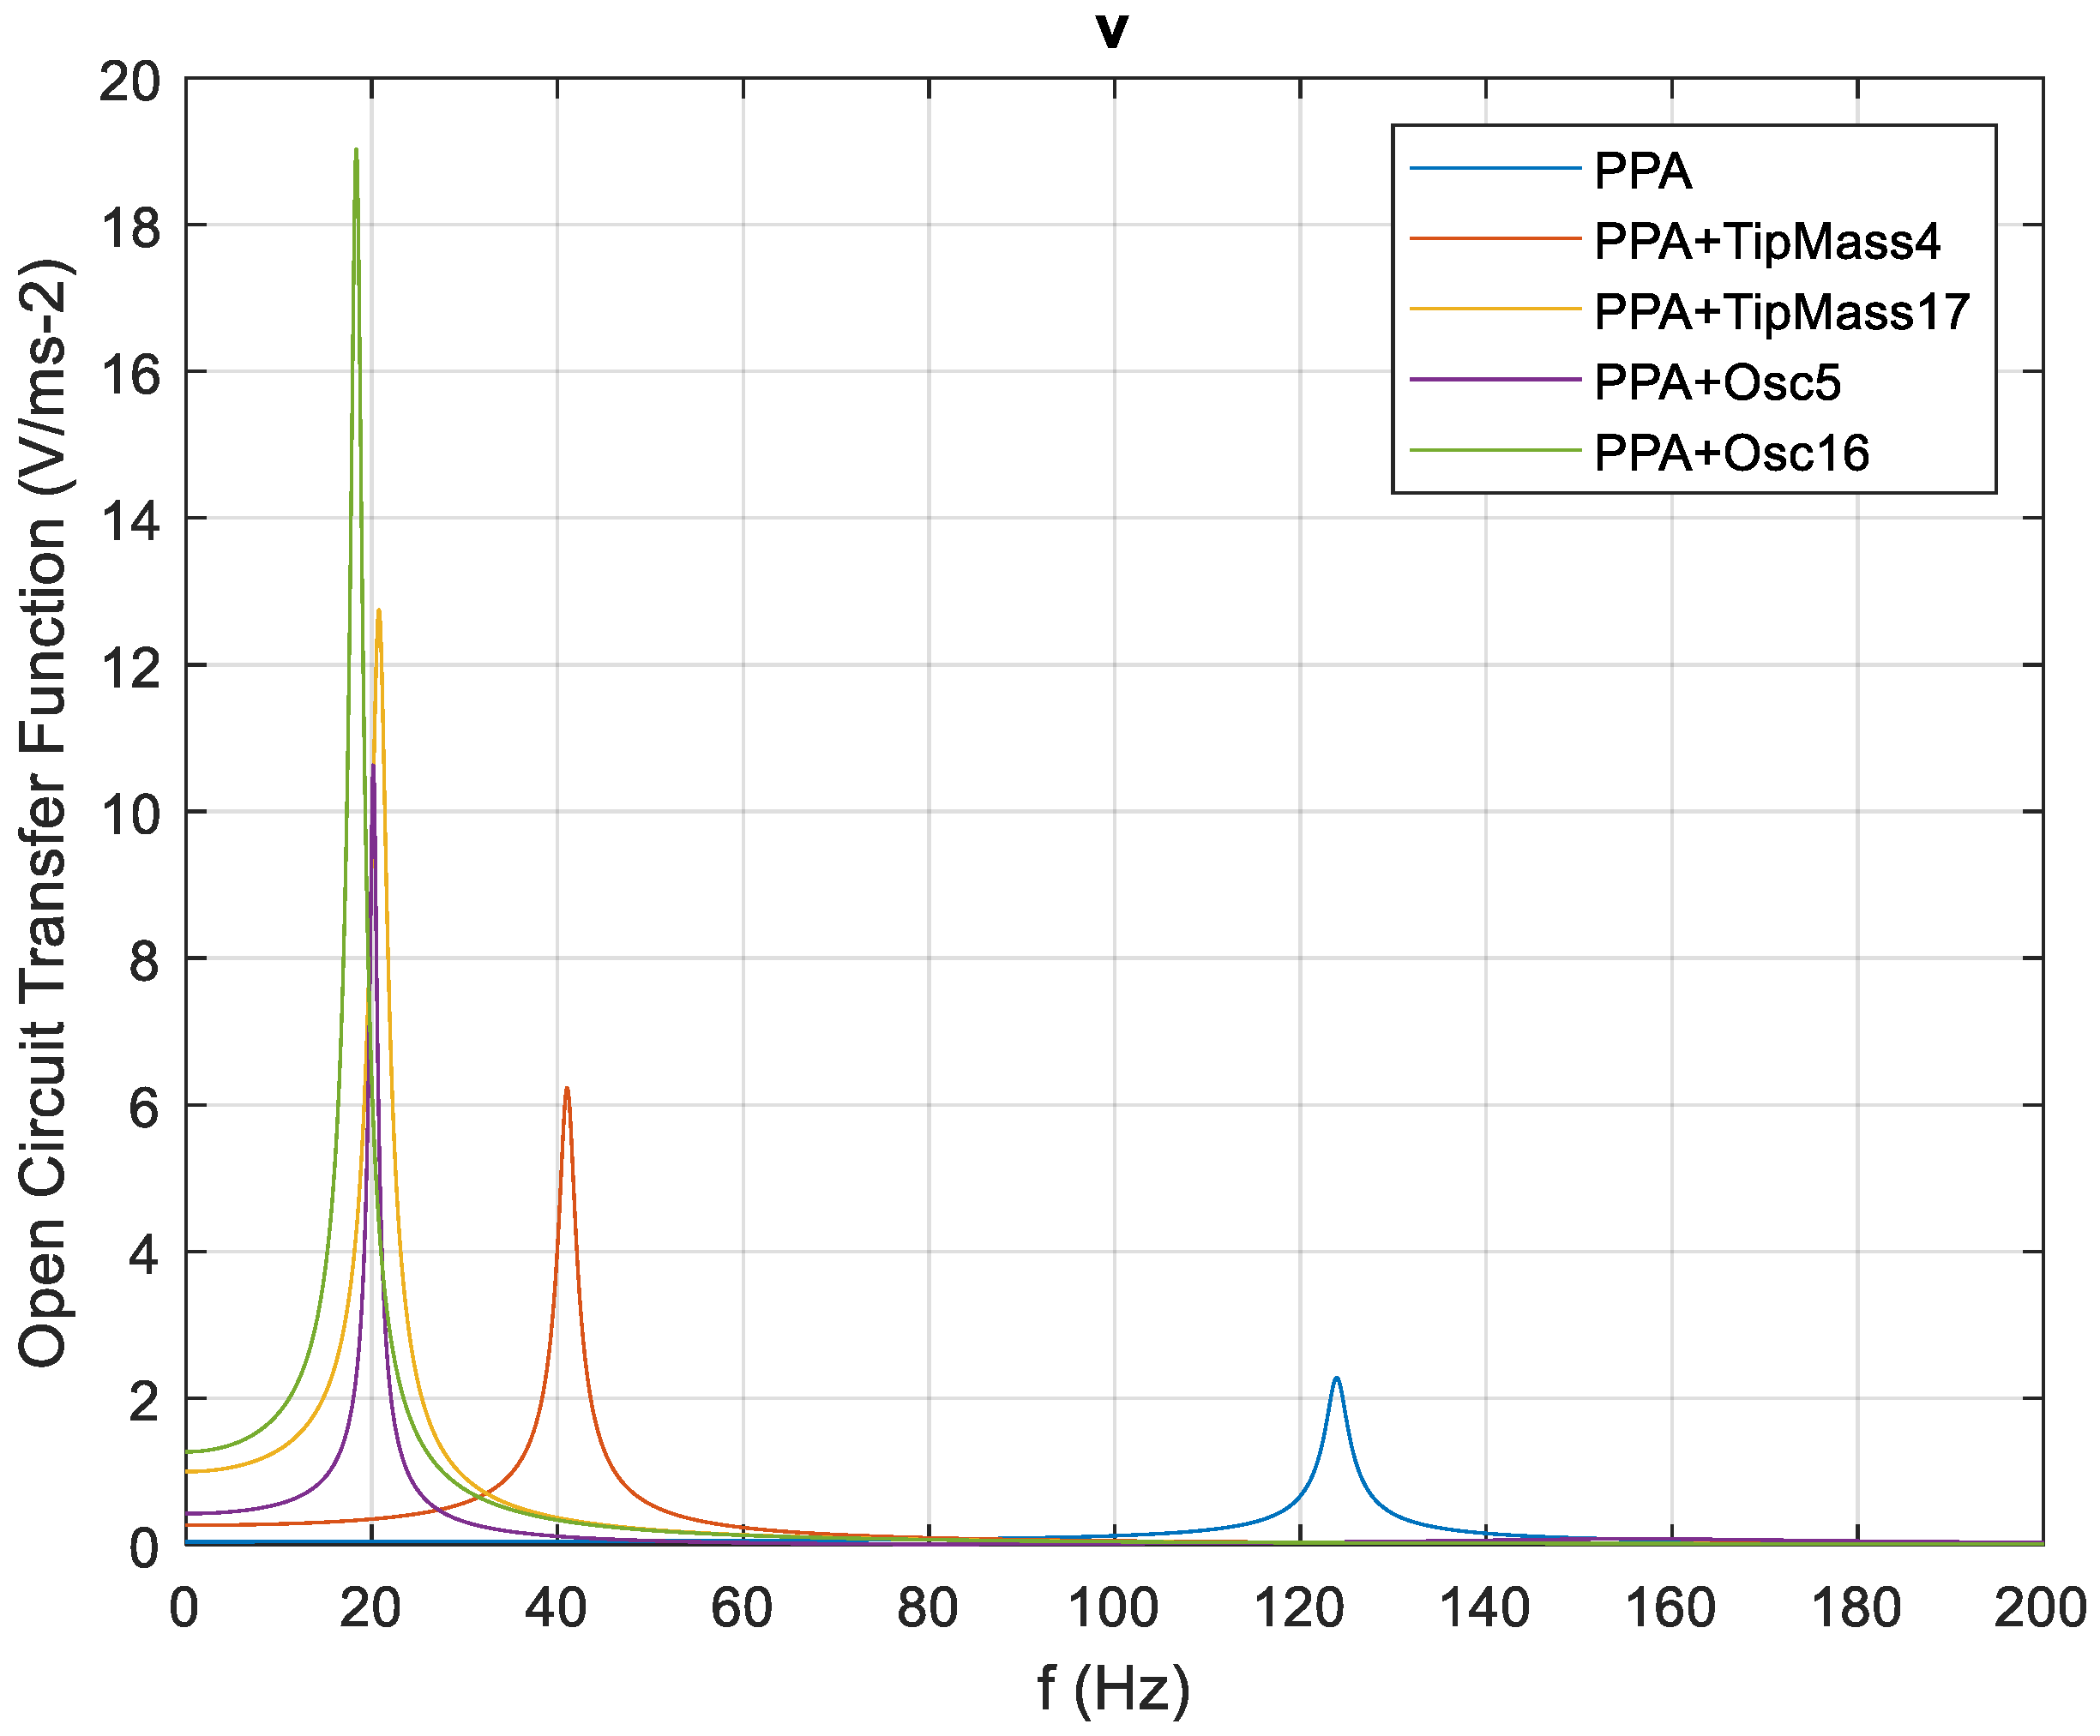
Figure 7 shows the modulus of the calculated open-circuit FRF (
) of the harvester equipped with the tuning devices.
The simple harvester shows the resonance peak at 123.9 Hz with an amplitude of 2.3 V/(ms−2), the amplitude of in the range of bicycle vibrations is negligible. The addition of a tip mass of 4 g is able to move the resonance peak of the harvester at the border of the frequency band that contains bicycle vibrations (41.1 Hz), the amplitude in resonance is 6.23 V/(ms−2). A large tip mass (17 g) is able to move the resonant frequency at the centre of the band of bicycle vibrations (20.8 Hz). Amplitude in resonance reaches a large value (12.8 V/(ms−2)), owing to the large inertia force of the tip mass. Oscillator A (with 16 g) moves the resonance peak to 18.3 Hz and increases further the amplitude in resonance (19.0 V/(ms−2)). Finally, oscillator B (mass 5 g) generates a resonance peak at 20.2 Hz with amplitude 10.6 V/(ms−2).
The decrease in the resonant frequency is the desired effect of the tuning device, and both the large tip mass and the oscillators fulfil the requirements for bicycle harvesting. The large increase in the resonance peak of
on one hand leads to a beneficial increase in the generated power, but on the other hand leads to an increase in the mechanical stress inside the piezoelectric layer. The mechanical stress in a piezoelectric material can be computed as:
in which
is mechanical strain,
is electric field
is the Young modulus at constant electric field,
is the piezoelectric constant.
The strain inside the piezo layer is given by this equation [
33]:
in which
is the distance with respect to the neutral axis of the composite cross section (
Figure 5). The maximum strain takes place at the clamp (
and at the top pf the piezo layer (
).
The electric field intensity is given by [
16]:
in which
is the thickness of the piezo layer (
Figure 5) When a harmonic input is considered, (28) becomes:
where
,
and
are the amplitudes of stress, strain and electric field, respectively. From (30) the strain amplitude is given by:
From (31) the electric field amplitude is given by:
Therefore, the amplitude of the maximum stress in the piezo layer becomes:
Since both
and
can be calculated by means of frequency response functions, the frequency response function (
) between maximum stress and input acceleration can be calculated as well:
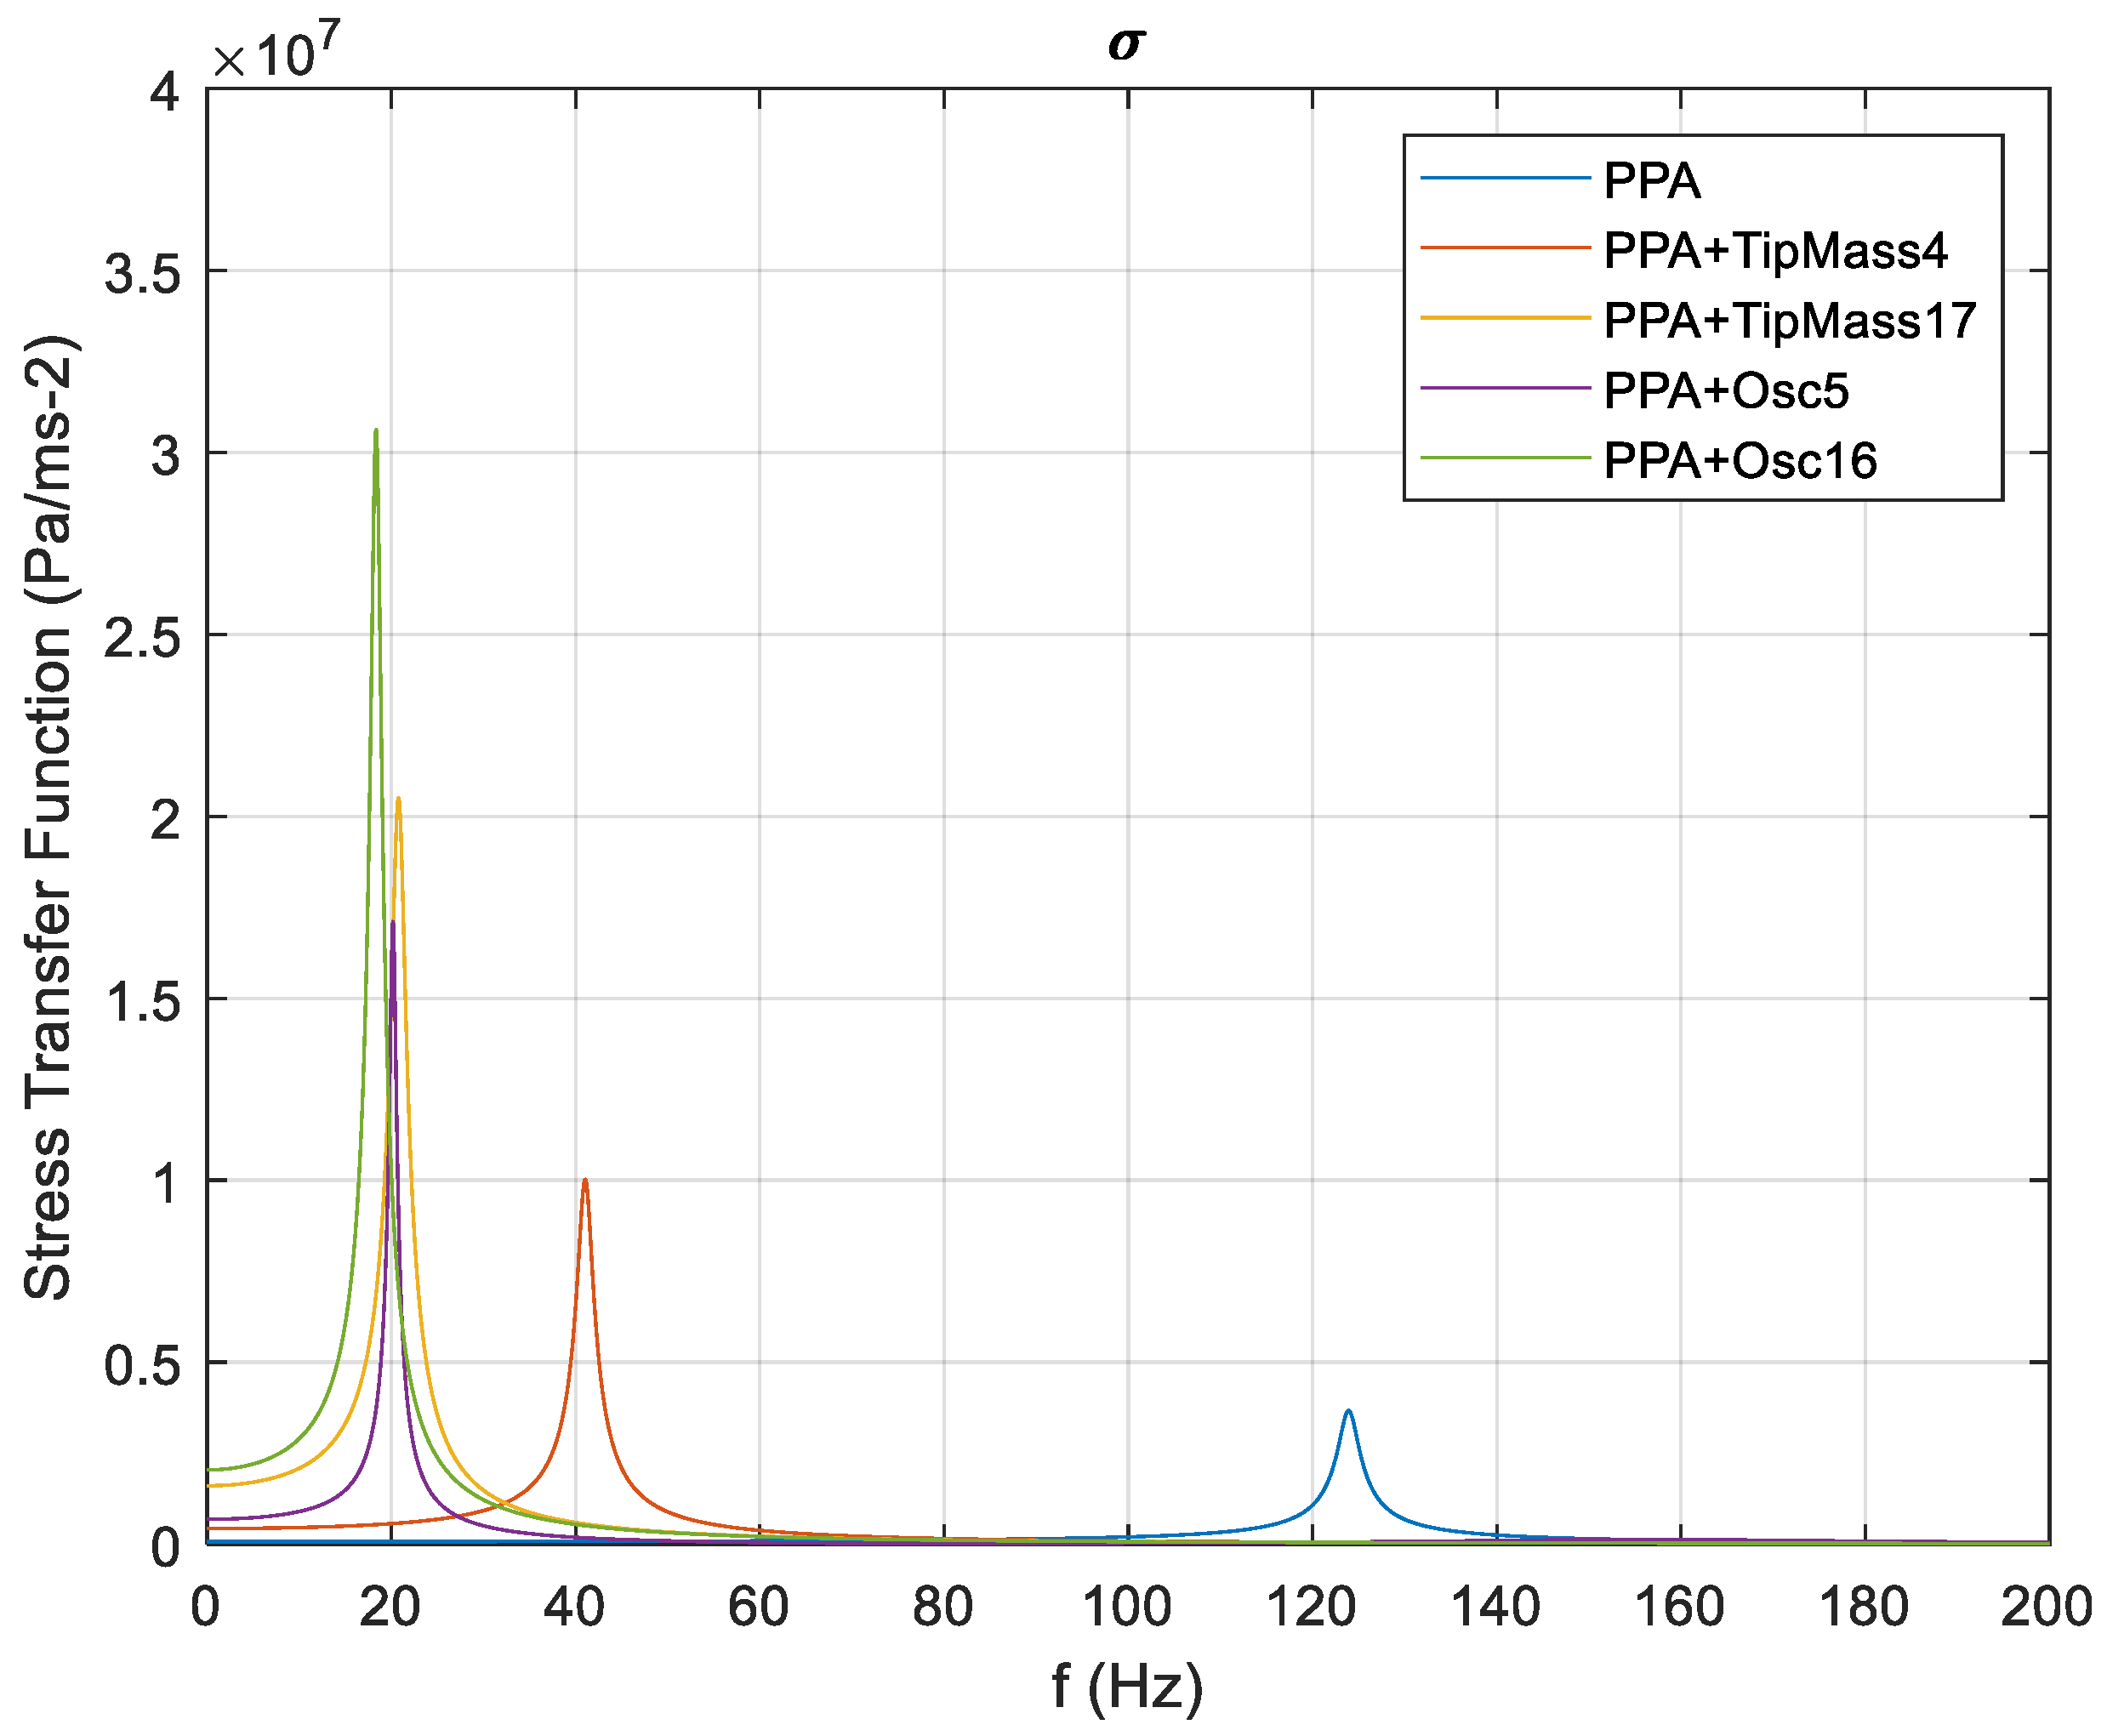
Figure 8 shows the stress FRFs obtained with the various tuning devices. Oscillator B achieves the best trade-off between generated voltage and maximum stress in resonance condition.
It is worth noticing that, if the base acceleration is about 1 ms
−2, the maximum stress with the large tip mass reaches the value of 20 MPa, whereas with oscillator A it reaches the value of 30 MPa. These values are not very far from the stress amplitude that leads to failure in the PZT after 40,000 cycles, which is in the range 45–60 MPa, depending on the electrode material [
36]. Since 40,000 cycles at the frequency of 20 Hz correspond to less than one hour of working, fatigue failure of the PZT layer is an important issue. For this reason, oscillator B is promising, since it achieves the best trade-off between tuning, generated voltage and maximum stress in resonance condition.
7. Experimental Evaluation of Tuning Devices
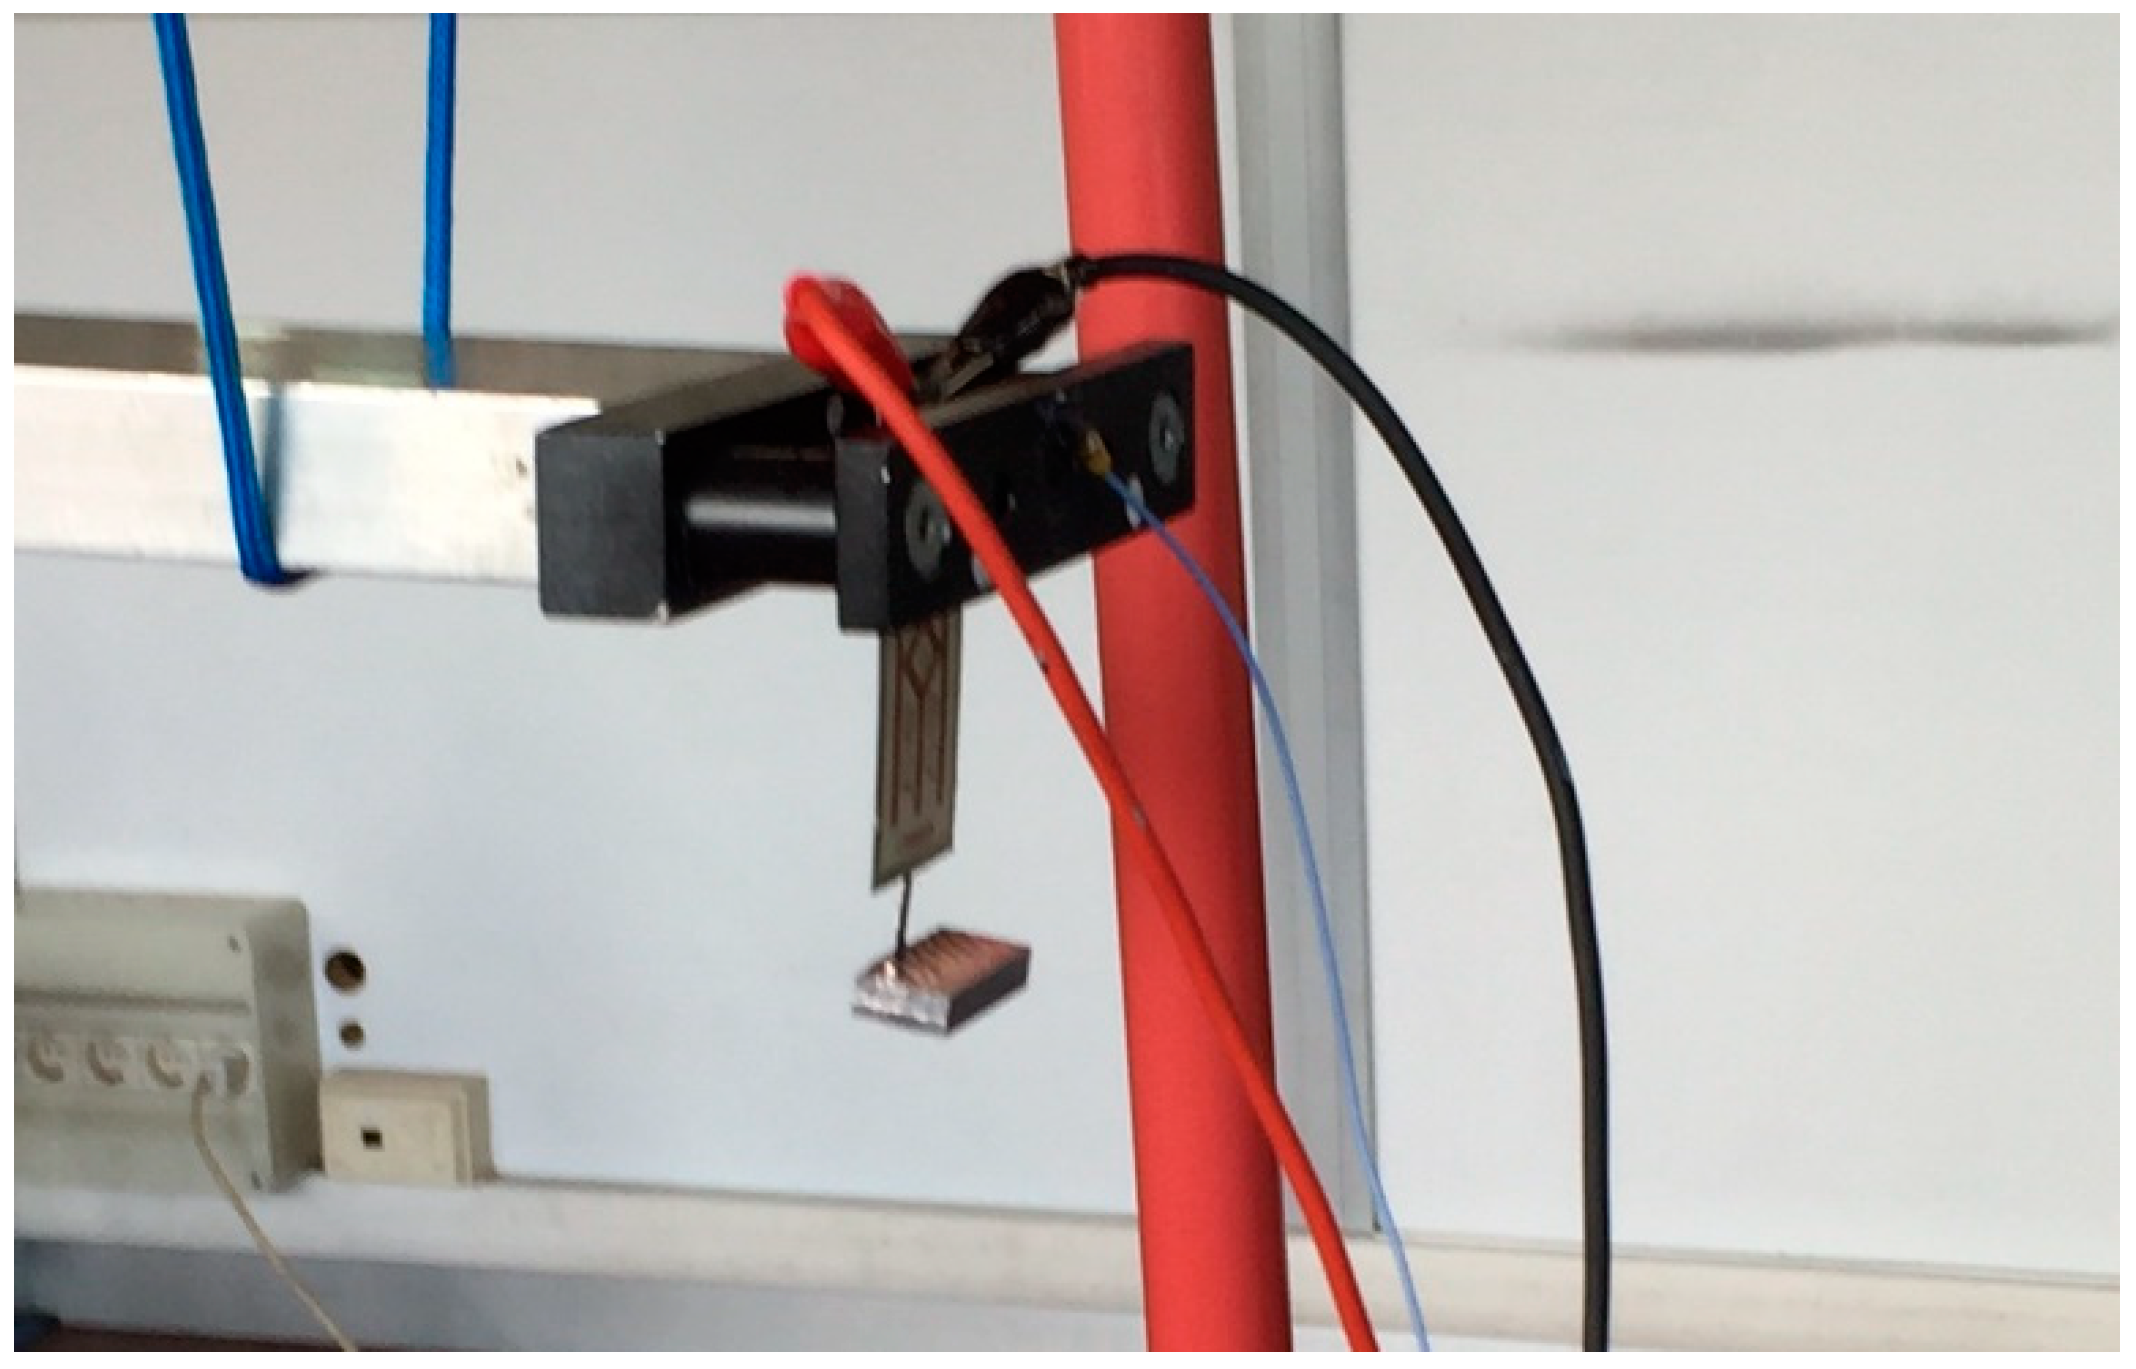
The voltage FRF introduced in the previous section can be experimentally evaluated by means of the impulsive method, which is widely used in the field of modal testing [
21,
37]. The experimental apparatus for impulsive tests is shown in
Figure 9.
In order to perform the impulsive tests, the harvester with tuning devices was clamped at one end of an aluminium bar. The bar was suspended from a frame by means of ropes, and with this arrangement it was free to oscillate in the longitudinal direction at very low frequency (about 2 Hz). The impulsive force was exerted on the free end of the bar by means of a hammer for modal testing [
3]. In this way the hammer impact generated longitudinal vibrations inside the bar that excited the base of the harvester. Base acceleration was measured by means of a small piezoelectric accelerometer (PCB 352C23). The signal of the accelerometer and the open circuit voltage generated by the harvester were acquired by means of a DAQ board (NI 9234). The voltage FRF between the generated voltage and the measured acceleration was calculated by means of Signal Express.
It is worth noticing that the FRF obtained with the impulsive method characterizes the behaviour of the system and can be used to mimic the response to different sources of excitation as far as the system exhibits a linear behaviour [
3,
16].
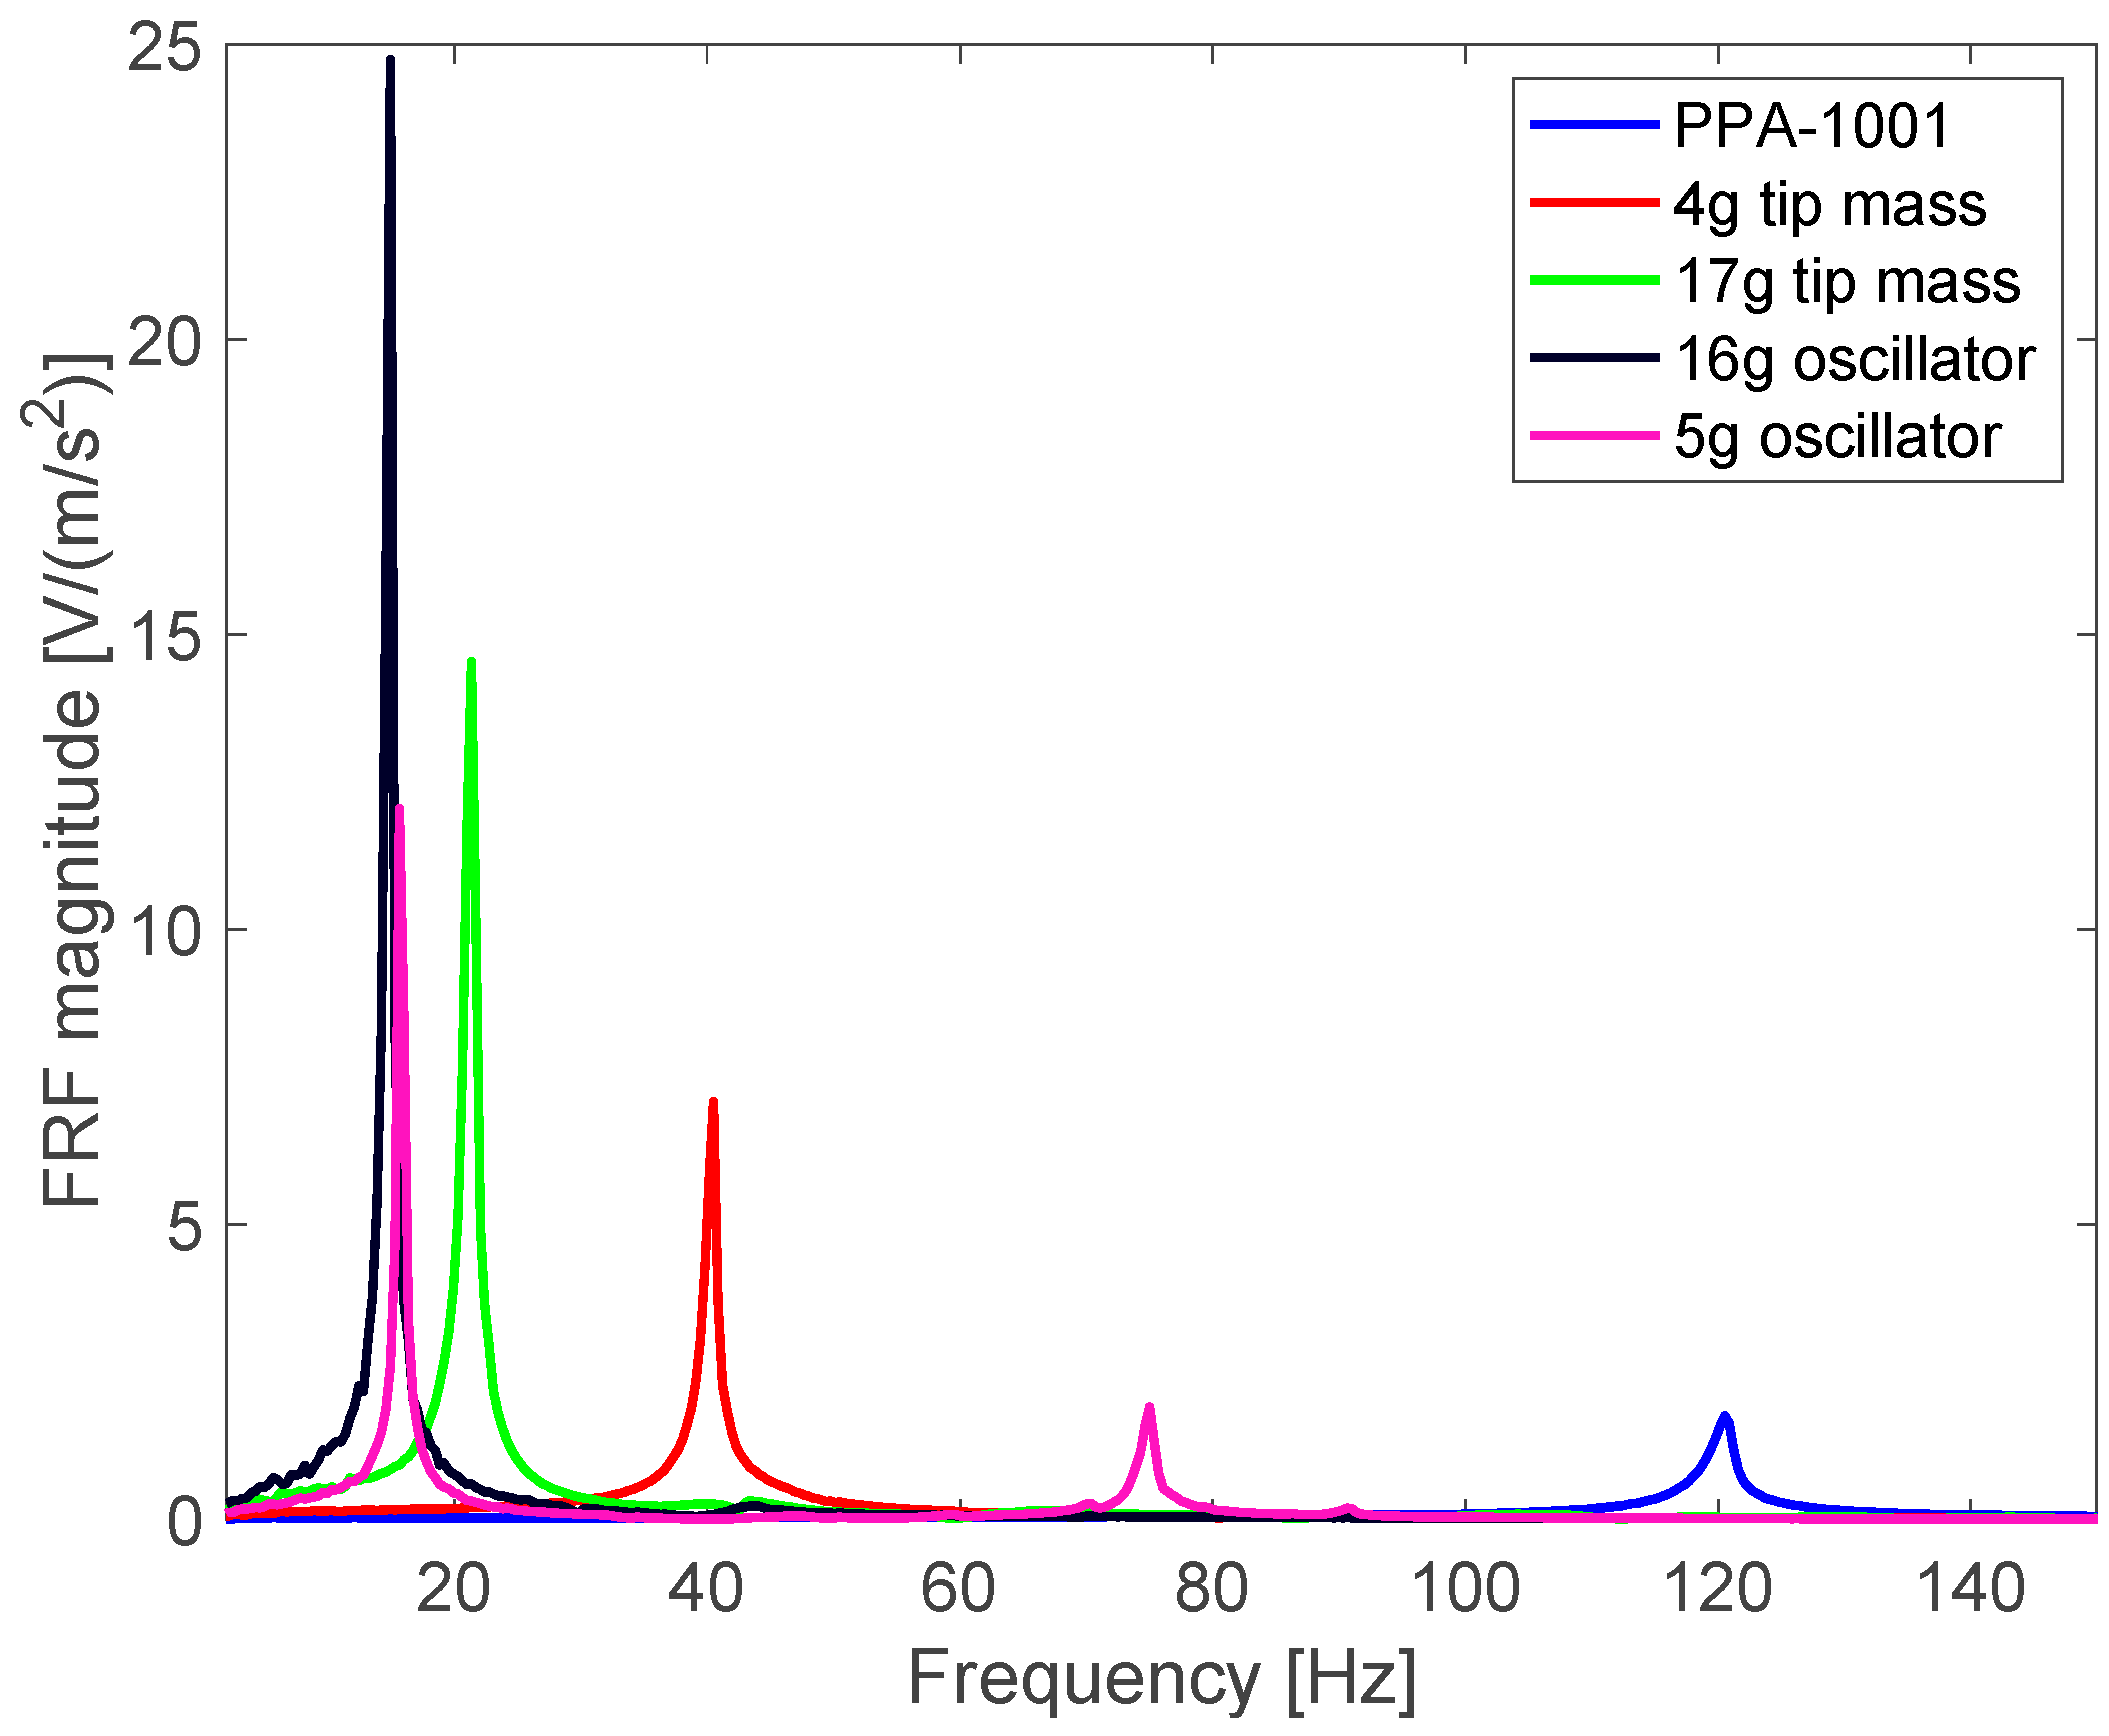
The five configurations that have been studied by means of the mathematical model were experimentally tested as well. Each configuration was experimentally tested at least five times, and a very good repeatability of results was found.
Figure 10 summarizes the experimental results showing an experimental FRF for each configuration. The small and the big tip masses are able to lower the resonant frequency to 40.5 and 21.3 Hz respectively. Oscillator A is able to generate a resonance peak at 14.9 Hz, whereas oscillator B generates a resonance peak at 15.6 Hz.
Oscillator B is able to generate a secondary resonance peak at 76 Hz. The amplitude of this peak is much smaller than the amplitude of the main peak and its frequency is outside the band of bicycle vibrations. Some specific experimental tests showed that this secondary peak is related to a torsion mode of the oscillator, which cannot be predicted by the 2D model of
Section 5.
The measured resonance frequencies and corresponding amplitudes are summarized in
Table 3 and compared with calculated results from the model of
Section 5.
There is a general agreement between measured and calculated results, which confirms the validity of the mathematical model and of the designed tuning devices. Small differences in the values of the resonant frequencies may be caused by small errors in the identification of geometrical and mechanical properties and by the presence of three-dimensional effects due to the finite width of the harvester, which are not taken into account by the model. Small differences in the values of the amplitudes in resonance are chiefly related to the determination of the damping of the vibrating system, which depends also on the connection between the tuning device and the harvester.
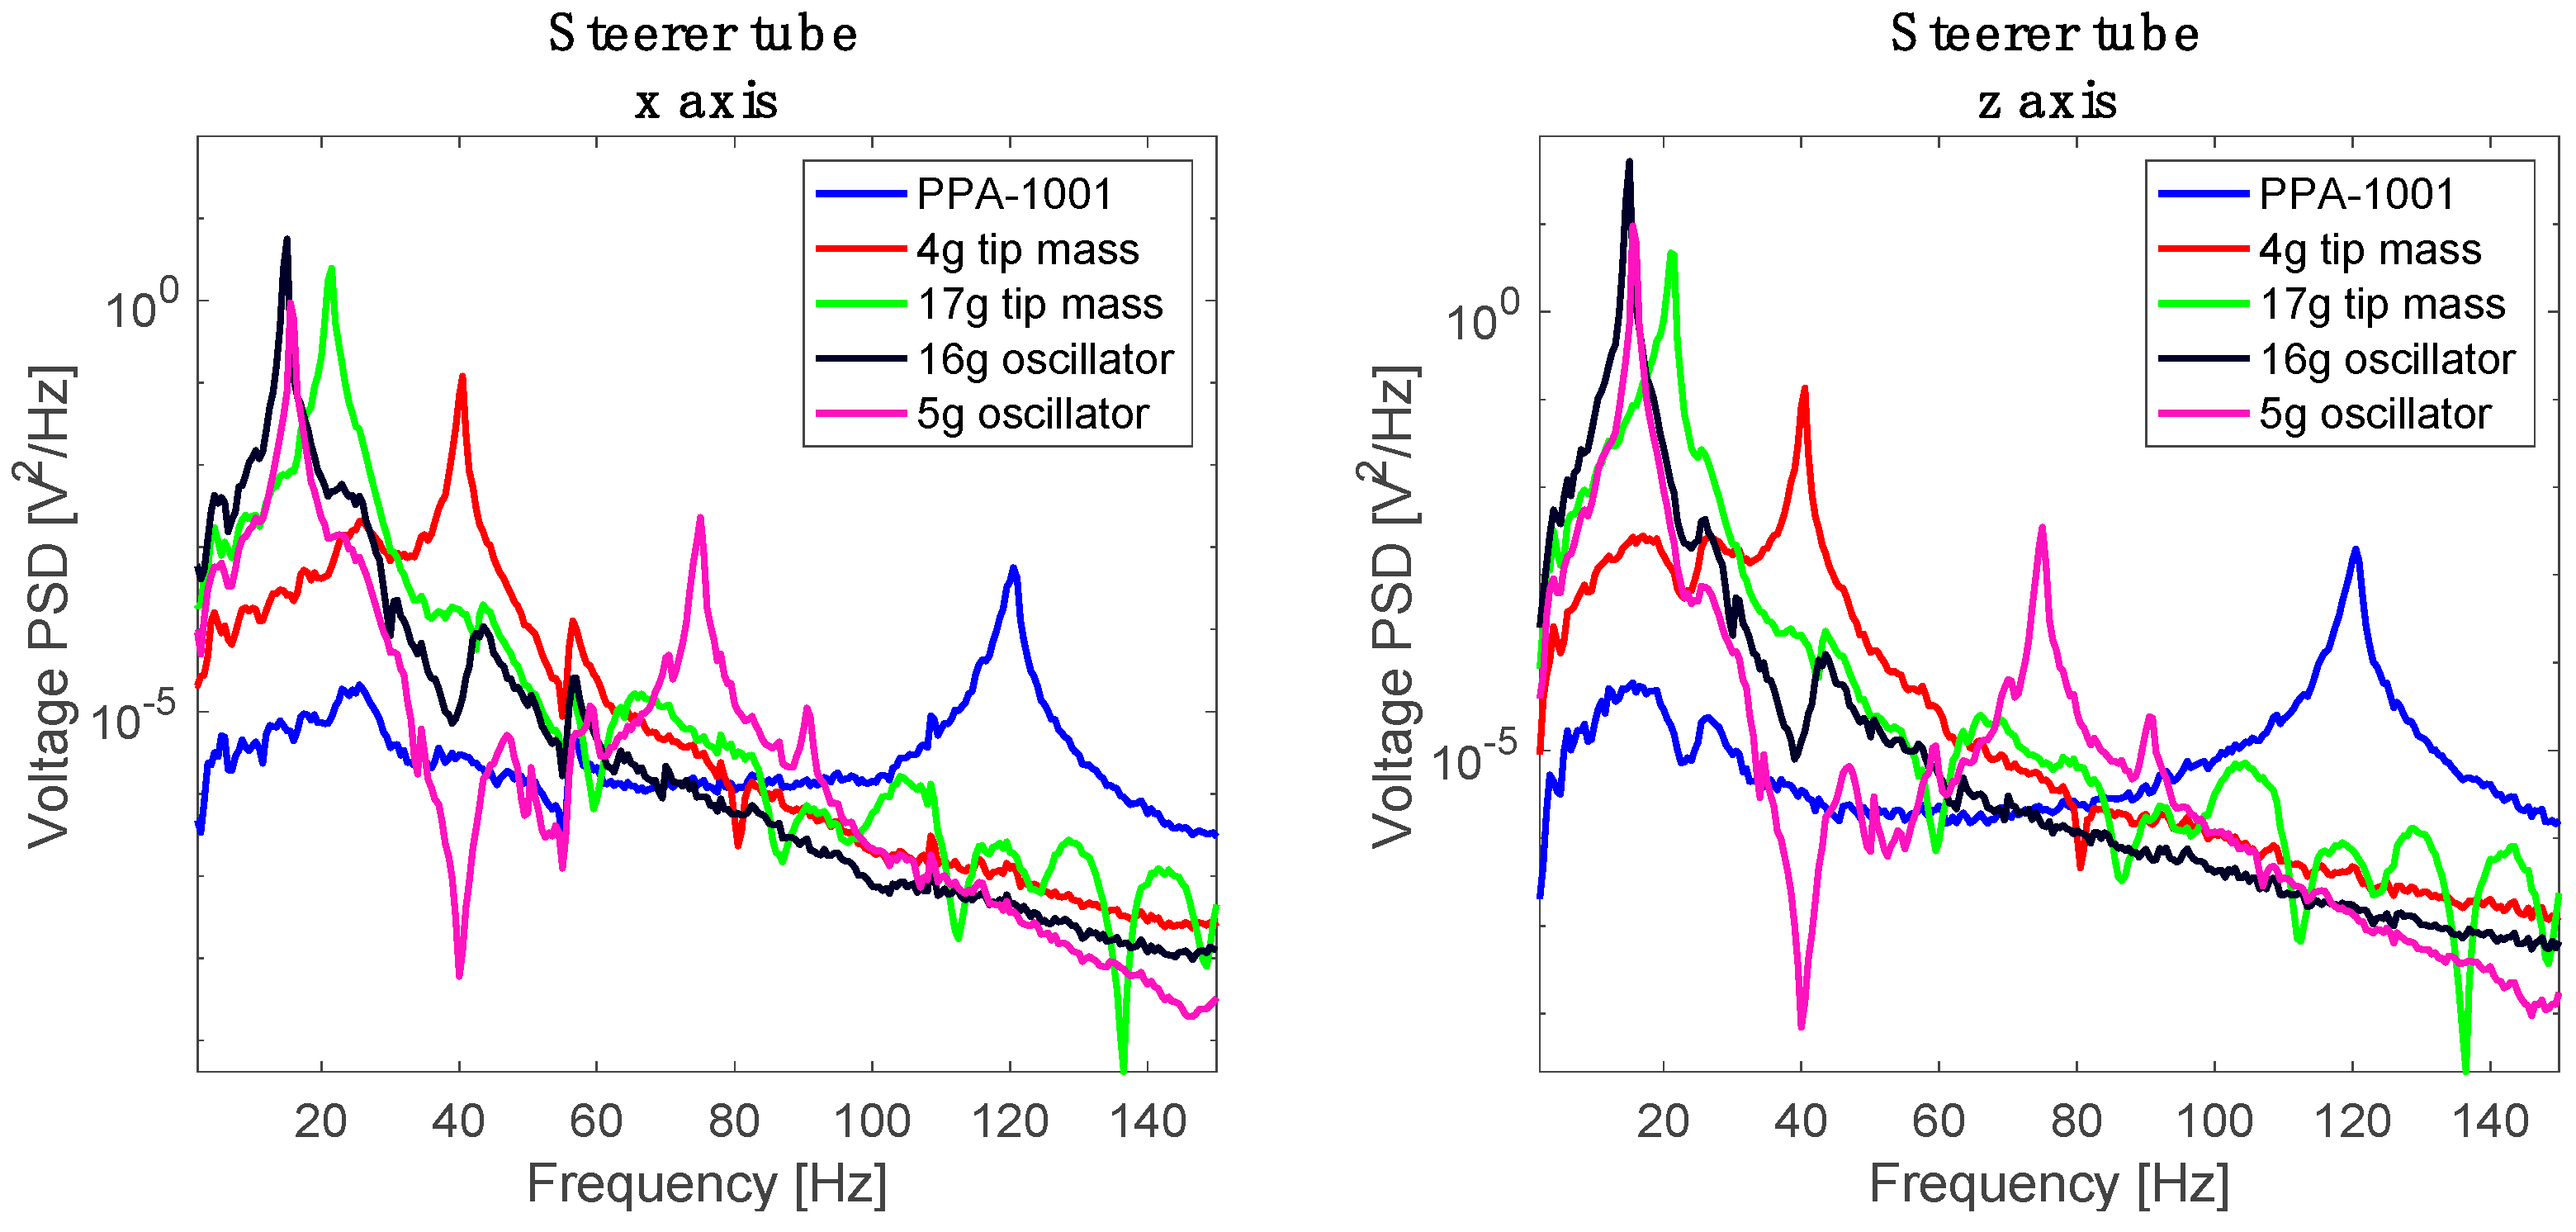
The concept of voltage FRF is very interesting, because it allows the designer to predict the voltage generated on the road by means of the following equation:
is the PSD of open circuit voltage, is the PSD of the (measured) bicycle acceleration, can be calculated or measured. Hence, Equation (37) makes it possible to predict the voltage generated on the bicycle without physically mounting the harvester on the bicycle.
Results obtained with different tuning devices are depicted in
Figure 11. Voltage PSD will be used in the next section for estimating the generated power.
8. Prediction of Generated Power
The electrical power harvested by a piezo-harvester is very low (in the order of a few mW), so highly-efficient power management units (PMU) have to be used for energy conversion. The output voltage of the piezo-harvester is a random signal with a main harmonic component at the resonance vibration frequency of the cantilever. On the other hand, electronic loads (such as a battery for energy storage and/or a portable device which can be mounted on a bicycle) are typically fed by DC voltage; therefore, interface electronic circuits between the piezo-harvester and the load are made up by a rectifier (for AC to DC voltage conversion), an electrolytic capacitor for voltage levelling and energy storage, and DC-DC converter for impedance matching with the electronic load resistance.
Among different techniques proposed in the literature for energy extraction, the synchronized switch harvesting on inductor (SSHI) technique has shown to be the most appealing one for power boosting [
38].
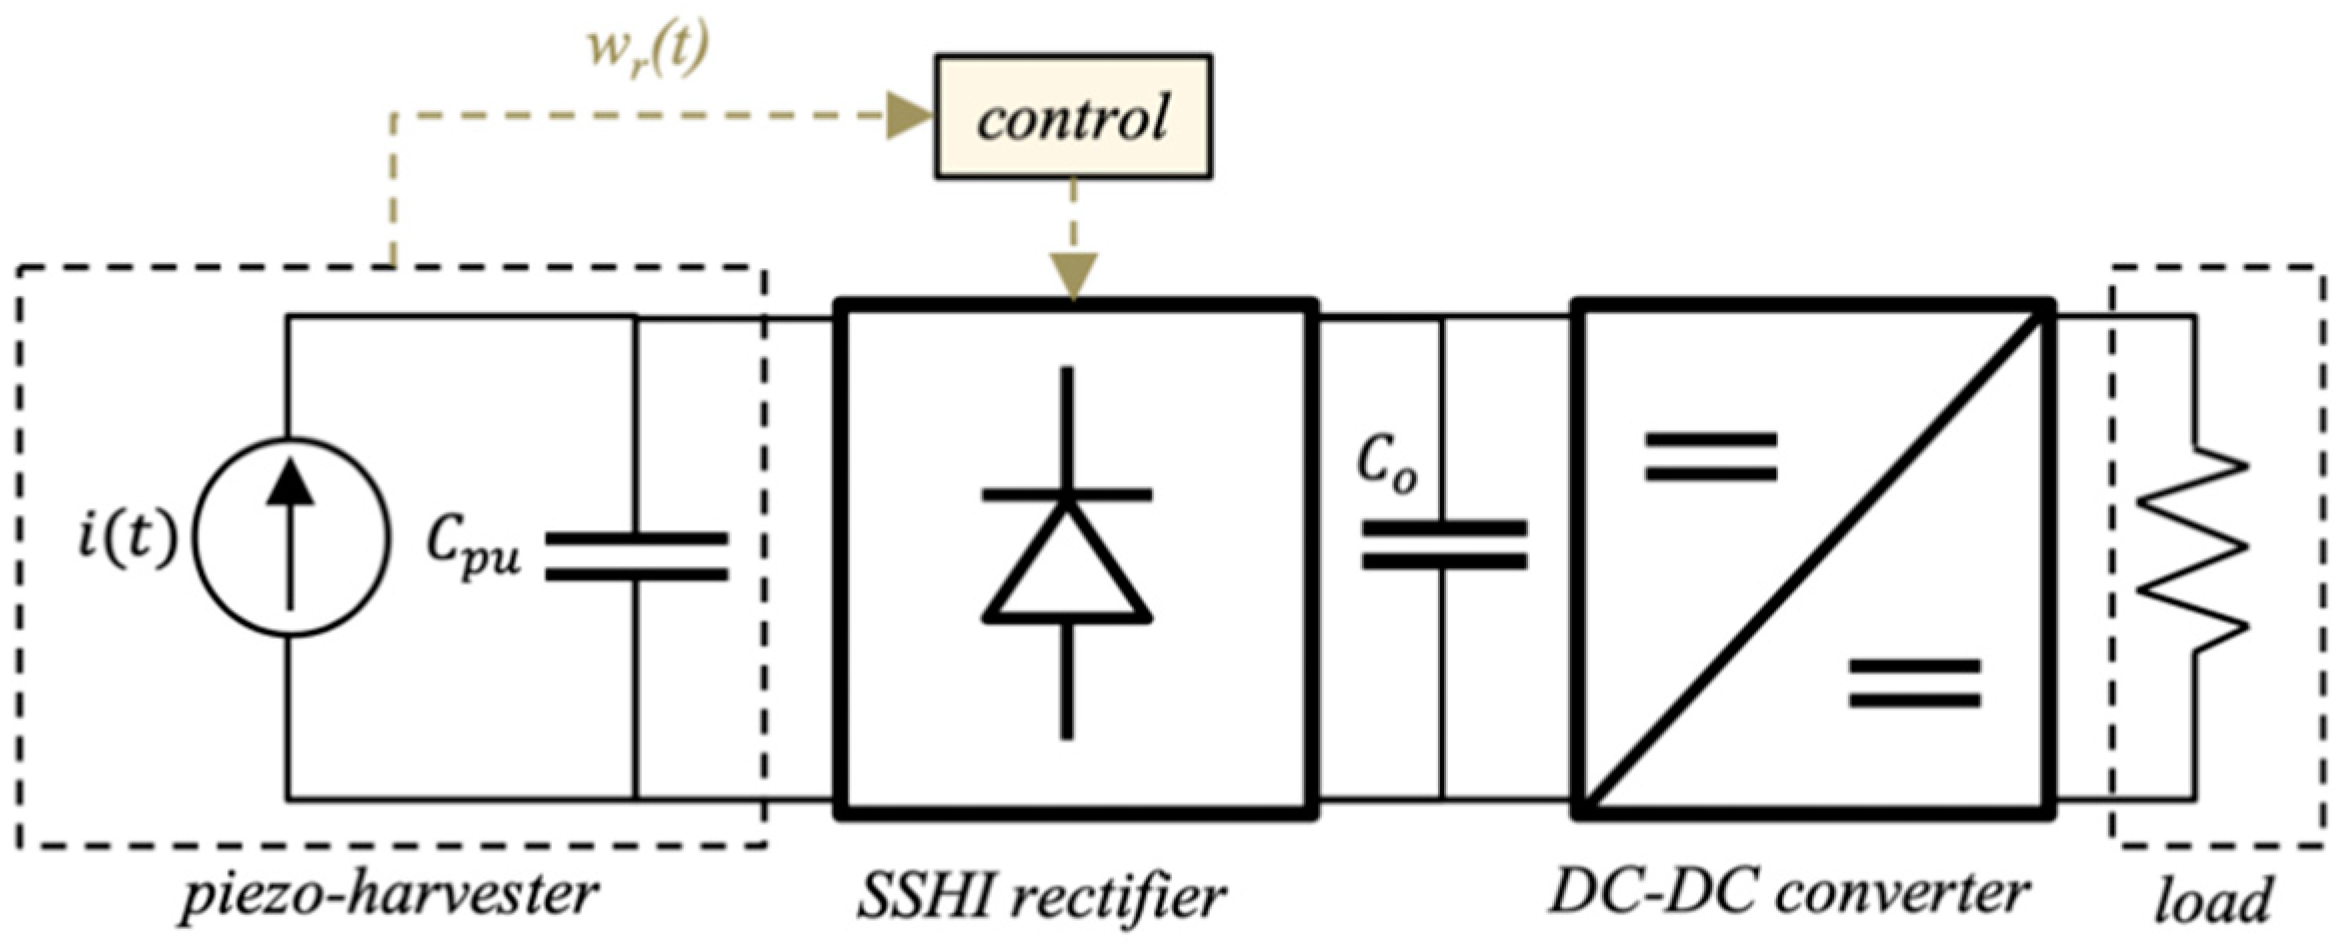
Figure 12 shows a typical circuit arrangement for a PMU based on a SSHI rectifier. The piezo-harvester, assumed in unimorph configuration, is schematized by a parallel circuit in which parameters have already been defined in
Section 5, i.e., the current generator
i(t) represents the charge generation due to piezoelectric effect, which converts mechanical energy from vibrations to electrostatic energy, and the capacitance
represents the charge build up over the piezo-layer. With the SSHI extraction technique the harvester is operated most of the period in open-circuit circuit conditions and the electric charge is extracted by triggering a switch when the capacitor is at the maximum voltage level in order to harvest the maximum energy. This condition is achieved when the cantilever tip displacement
in
Figure 12 is maximum or, equivalently, the harvester velocity is zero. Voltage polarity inversion is realized by an inductor which resonates together with the internal capacitor
. The inductance value is typically chosen in such a way that the L-C resonance frequency is much higher than the vibration frequency. Due to a typical weak mechanical coupling the energy extraction does not perturb the mechanical dynamics of the harvester and thus its velocity is assumed to be unaltered.
Two kinds of configurations are typically adopted for SSHI rectifiers: series (S) or parallel (P), which provide similar behaviours. The maximum average power generated by the SSHI rectifier, under the assumption of harmonic excitation, can be expressed as a function of the average RMS value of the open-circuit voltage, i.e., a random signal, according to the following procedure.
In open-circuit conditions (i.e., with
,) the electric equation of the piezo-harvester (14), combined with the expression of the generated current (15), becomes:
which, by noting that under single-mode assumption,
, can be expressed in terms of the relative tip displacement of the cantilever as:
where
is the force factor, defined in [
16] for a lumped parameter electro-mechanical model of the piezo-harvester. Under the assumption of harmonic excitation, (39) makes it possible to rearrange the expression for estimating the maximum average harvested power generated by a S-SSHI rectifier, proposed in [
16], as a function of the maximum stored energy in the capacitor (
), as:
where
is the vibration frequency,
is the inversion coefficient, and
with
maximum open-circuit voltage value. The factor 2 in (40) takes account of the fact that energy is harvested twice during a period, i.e., when the condition of zero-vibration velocity occurs and voltage magnitude is maximum or minimum. The inversion coefficient, which accounts for the amount of voltage conserved on the capacitor after polarity inversion, theoretically ranges from 0 to 1; therefore, the maximum energy is magnified by a factor
, which is the key feature of the SSHI harvesting technique. Energy enhancement produced by the SSHI rectifier on the piezo-harvester is due to the resonance condition occurring between the piezo-layer capacitance and the rectifier inductance.
It is worth noting that (39) is based on the assumption of AC voltage input; however, mechanical vibrations produce a random signal with a main harmonic component at the resonance frequency. It can be proven that 90% of energy in the frequency spectrum is concentrated around this frequency [
13]. This practical consideration motivates the following approximation in the power estimation: by considering an energy balance, the energy harvested from the random vibration is assumed to be generated by an (equivalent) AC voltage. With this assumption,
, where
is the open-circuit equivalent RMS voltage. According to Parseval’s theorem, an average RMS value can be estimated from the open-circuit voltage power spectral density
, as:
By using (40), the maximum average harvested powers generated by the different piezo-harvester arrangements presented in
Section 6 can be compared.
Table 4 shows the importance of a proper tuning of the harvesting device. The standard configuration (a) and the set-up with a small tip mass harvest 100 and 10 times less power respectively, compared to the properly tuned harvester with a large tip mass (c). The configuration with oscillator A (d) performs better than the configuration with large tip mass (c) in terms of harvested power (especially in the vertical direction), being able to harvest up to 6 times more power. Finally, the configuration with oscillator B (e) is comparable to the configuration with large tip mass (c) in the vertical direction, but performs more poorly in the horizontal direction, harvesting up to 5 times less power. It is worth recalling that the higher harvested power comes to the expense of a higher mechanical stress in the piezo-harvester (see
Figure 8). This might progressively damage the device through fatigue and ultimately impact the total energy harvested during the lifetime of the harvester. As predictable from the acceleration PSDs of
Figure 2 and
Figure 3, vehicle speed has a significant influence on the generated power. For instance, using the harvester with oscillator A to harvest the z axis vibrations of the steerer tube of Bicycle A, the mean generated power is 0.531 mW at low speed (10 km/h), 0.891 mW at medium speed (15 km/h), and 1.977 mW at high speed (20 km/h).
9. Conclusions
The analysis of the results of road tests in the frequency domain clearly highlighted the need for specific tuning devices able to tune commercial piezoelectric harvesters to bicycle vibrations. The mathematical model and the experimental tests showed that an auxiliary oscillator composed of a cantilever spring and a lumped mass is useful to tune piezoelectric harvesters to bicycle vibrations. In particular, an auxiliary oscillator with a small mass (5 g) roughly has the same effects of a larger tip mass (17 g) in terms of generated voltage and stress inside the piezoelectric material. Conversely, an auxiliary oscillator with a large mass (16 g) generates more voltage than the same harvester equipped with a large tip mass, but increases the stress inside the piezoelectric material.
The power that can be generated by a tuned harvester mounted on a bicycle was calculated using the PSDs of bicycle vibrations measured on the road and the FRFs of the tuned harvesters measured in the laboratory. The power generated by the single tuned harvester is rather small (), but sets of tuned harvesters can be installed in order to increase the harvested power. There is this possibility because the tuning devices do not increase too much the encumbrance of the harvester and because the road tests showed that there are significant levels of vibrations in many points of the bicycle, both in the vertical and in the longitudinal direction.
Future developments of this research will deal with the development of more complex tuning devices (e.g., with liquid tip masses) and with the road tests of a bicycle equipped with a set of tuned harvesters.


