Article

Three-Dimensional Reconstruction of Fleece Fabric Surface for Thickness Evaluation

1
School of Mechanical Engineering, Xi’an Polytechnic University, Xi’an 710078, China
2
School of Mechanical Engineering, Shandong University, Jinan 250100, China
3
Department of Manufacturing Engineering and Automation Products, Opole University of Technology, 45758 Opole, Poland
4
School of Mechanical, Materials, Mechatronic and Biomedical Engineering, University of Wollongong, Wollongong, NSW 2522, Australia
*
Author to whom correspondence should be addressed.
Electronics 2020, 9(9), 1346; https://doi.org/10.3390/electronics9091346
Submission received: 29 July 2020 / Revised: 17 August 2020 / Accepted: 18 August 2020 / Published: 20 August 2020
(This article belongs to the Special Issue Advanced Signal Processing and Circuit Analysis)

Abstract

:
Aiming at solving the problem of manually measuring the fabric surface thickness, this paper proposes a three-dimensional (3D) reconstruction method based on the tangential two-dimensional (2D) sequence images. Firstly, the characteristic region of the fabric surface is extracted. Secondly, the image is splitting based on the maximum between-class variance method. Thirdly, the splitting image is processed by the morphological method. Fourthly, the canny operator is used to obtain the edge detection for calculating the edge contour coordinate. Finally, the surf function is used to reconstruct the 3D model of the fabric surface. To evaluate the performance of the proposed 3D model, the thickness and relief degree of the fabric surface are used, and the comparison between the proposed method and the manual measurement is carried out. The results demonstrate that, under a reasonable relief degree condition, the proposed method is more effective to evaluate the thickness of the fabric surface and the estimated thickness is more accurate than the manually measured one.

1. Introduction

After the fabric is scratched, brushed, and brushed, it will produce soft and dense fleece on the surface. The fleece fabric has the advantages of keeping warm and blocking the sun, so the fleece fabric is widely used in textiles, such as clothing, blankets, toys and so on. However, the fleece covered on the fabric will affect the thickness of the fabric and limit the quality of the products made by the fabric. At present, the method for detecting the surface quality of fleece fabrics relies on experts to judge by naked eyes and touch [1,2,3]. Because this method is very time consuming and requires a lot of work pressure, and the physical condition of the testing experts will affect the test results, it is extremely necessary for the automatic detection of the surface quality of the fleece fabric [4].
Textile surface quality testing can be divided into 2D and 3D testing of fleece fabric surface quality. In two dimensions, Jasinska [5] has used a grating method to analyze the two-dimensional image of the fleece surface of the knitted fleece pilling fabric on a computer, and calculated the surface pilling status of the fleece fabric. Jin [6,7] has used the seed segmentation method and the Mean shift method to segment the fabric fleece balls on the fleece fabric image. Sarraft [8] has researched the fabric defect detection system on the loom and he has used wavelet decomposition on the image to identify the fabric surface defects. Chi [9] has used Fourier to detect defects on the fabric surface. Uster’s Fabriscan automatic cloth inspection system has used neural network methods to detect defects on the fabric surface [10]. It can be seen that the two-dimensional detection technology is relatively mature. Many devices for detecting defects on the fabric surface have entered the market. However, the fleece fabric is actually a 3D structure, and the two-dimensional detection method will lose part of the fleece information, especially the lack of depth information [11]. At present, it has become a research central issue to realize the quality inspection of fabric surface in three dimensions.
In three dimensions, Kang [12] has used laser line scanning technology to obtain a 3D image of the fabric surface and has successfully obtained useful information, such as the number and area of hair balls on the fabric surface. Yu [13] has used the method of micro-section to obtain the depth sequence images of the fabric surface under different focus and has completed the 3D reconstruction of the fabric surface to get the depth information of the hair balls on the fabric surface. Kim [14] has applied 3D point cloud processing technology to 3D images and used this technology to evaluate the fabric pilling performance. Tilocca [15] has used a laser sensor to obtain the surface image of the fleece fabric, and then input the transformed 3D contour data of the fabric into the neuron, and has used the BP neural network to identify the defects on the surface of the fabric. Ouyang [16] has studied the 3D surface of the fabric and successfully detected the pilling and wrinkling properties of the fabric. Saharkniz has used a contactless laser triangulation scanner to separate the hair balls from the fabric surface and texture [17]. In addition, many other fields with dissimilar features have also studied a large number of 3D reconstruction techniques and applications. For example, Taylor [18], Ems-Mcclung [19] and Deng [20] used 3D reconstruction technology in the medical field. Donnelly [21] used 3D reconstruction technology in the field of physics. He [22], Udayan [23] and others used 3D reconstruction technology in the engineering field. In summary, the 3D shape reconstruction can effectively obtain the depth information of the fabric surface, and it can also describe the information such as fleecing and pilling on the fabric surface. However, some defects on the surface of the pile fabric will affect the thickness of the fabric, and 3D topography scanning requires equipment such as an electron microscope. They are not only expensive, but this is an offline measurement. At present, the online thickness measurement is rarely reported in literature.
For the online measurement of the thickness of fleece fabrics, we used a tangential scanning two-dimensional imaging method and realized a 3D reconstruction of the fabric surface. First of all, this experiment relies on the principle of light-cut imaging. Through these principles, you can get the tangent graph of the fleece fabric, which is processed to obtain the contour curve of the upper edge of the fleece fabric. We obtain the 3D contour of the upper surface of the fleece by constructing a multi-dimensional array and using MATLAB software. In the vertical direction, the tangential image of the roller is used as a reference to establish the thickness parameter model of the fleece fabric; in the horizontal direction, the least squares of the upper surface of the fleece are used as the reference and the parameter model of the fleece undulation is constructed. Finally, we obtain the thickness, undulation and other information through the 3D reconstruction of the fleece, and compare it with the manual measurement results.

2. Materials and Methods
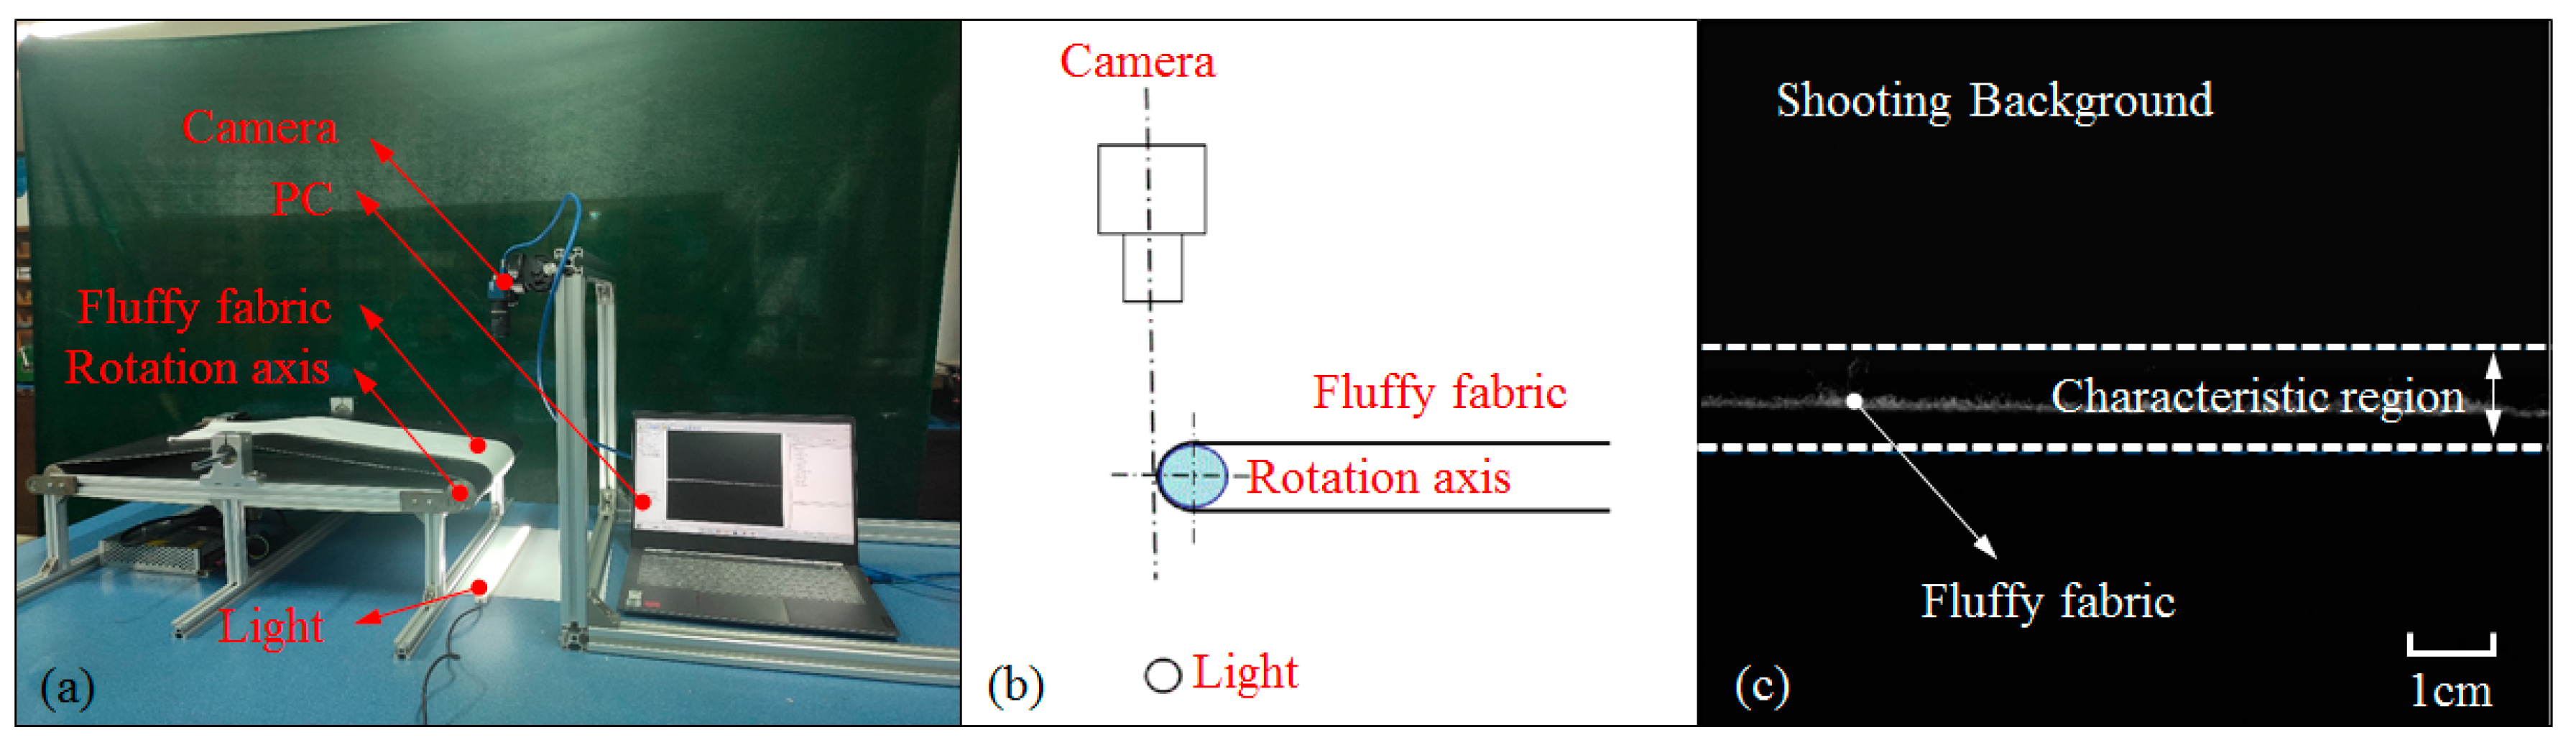
2.1. Bench Tester

The experimental platform used in this experiment is shown in Figure 1a. The used fleece fabric is wrapped on the transmission belt, and its size is 310 mm × 180 mm (L × H). Its movement is based on 57 stepper motors, and its speed is adjusted by the controller. Its speed range is between 0 and 1000 r/min; the visual acquisition system of this experiment uses Daheng Mercury MER-502-79U3M POL, this industrial camera is produced by Beijing Daheng Image Vision Co., Ltd., China. The rate is 79 fps; the lens of this experiment uses a Computar lens, and its focal length is 25 mm; the light source of this system is a strip-shaped LED light source, which can ensure the uniformity of brightness and illumination direction; the resolution of the image is 2048 * 2048; the experiment uses the camera’s own image acquisition software, which has an object resolution of K = 0.0329 mm/pixel, and the image processing system is completed by Matlab2016. During the experiment, the acquisition frequency of the camera was 10 Hz, and the picture was stored in the PC; the translation speed of the fleece fabric to be tested was 3.263 m/s.
The working principle diagram of this experiment is shown in Figure 1b. The tested fabric is laid flat on the conveying device. The light source is placed under the roller. The industrial camera and the light source are installed on both sides of the tested fabric. They form a backlight image. Avoid interference by the surface texture and color characteristics of the tested fabric, and highlight the edge contour characteristics.
In Figure 1c, the background and base fabric area in it takes up a large area; however, the fleece area occupies a small part. We select the middle part of the white dashed line in the figure as the feature area. In order to ensure the integrity of the fleece area, and to intercept the rectangular image with the fleece area as the symmetry axis and the pixel size of 2048 * 300 as the feature area, in order to reduce the calculation amount. In this area, the thickness of the fleece is displayed in the vertical direction, and the distribution state is displayed in the horizontal direction.

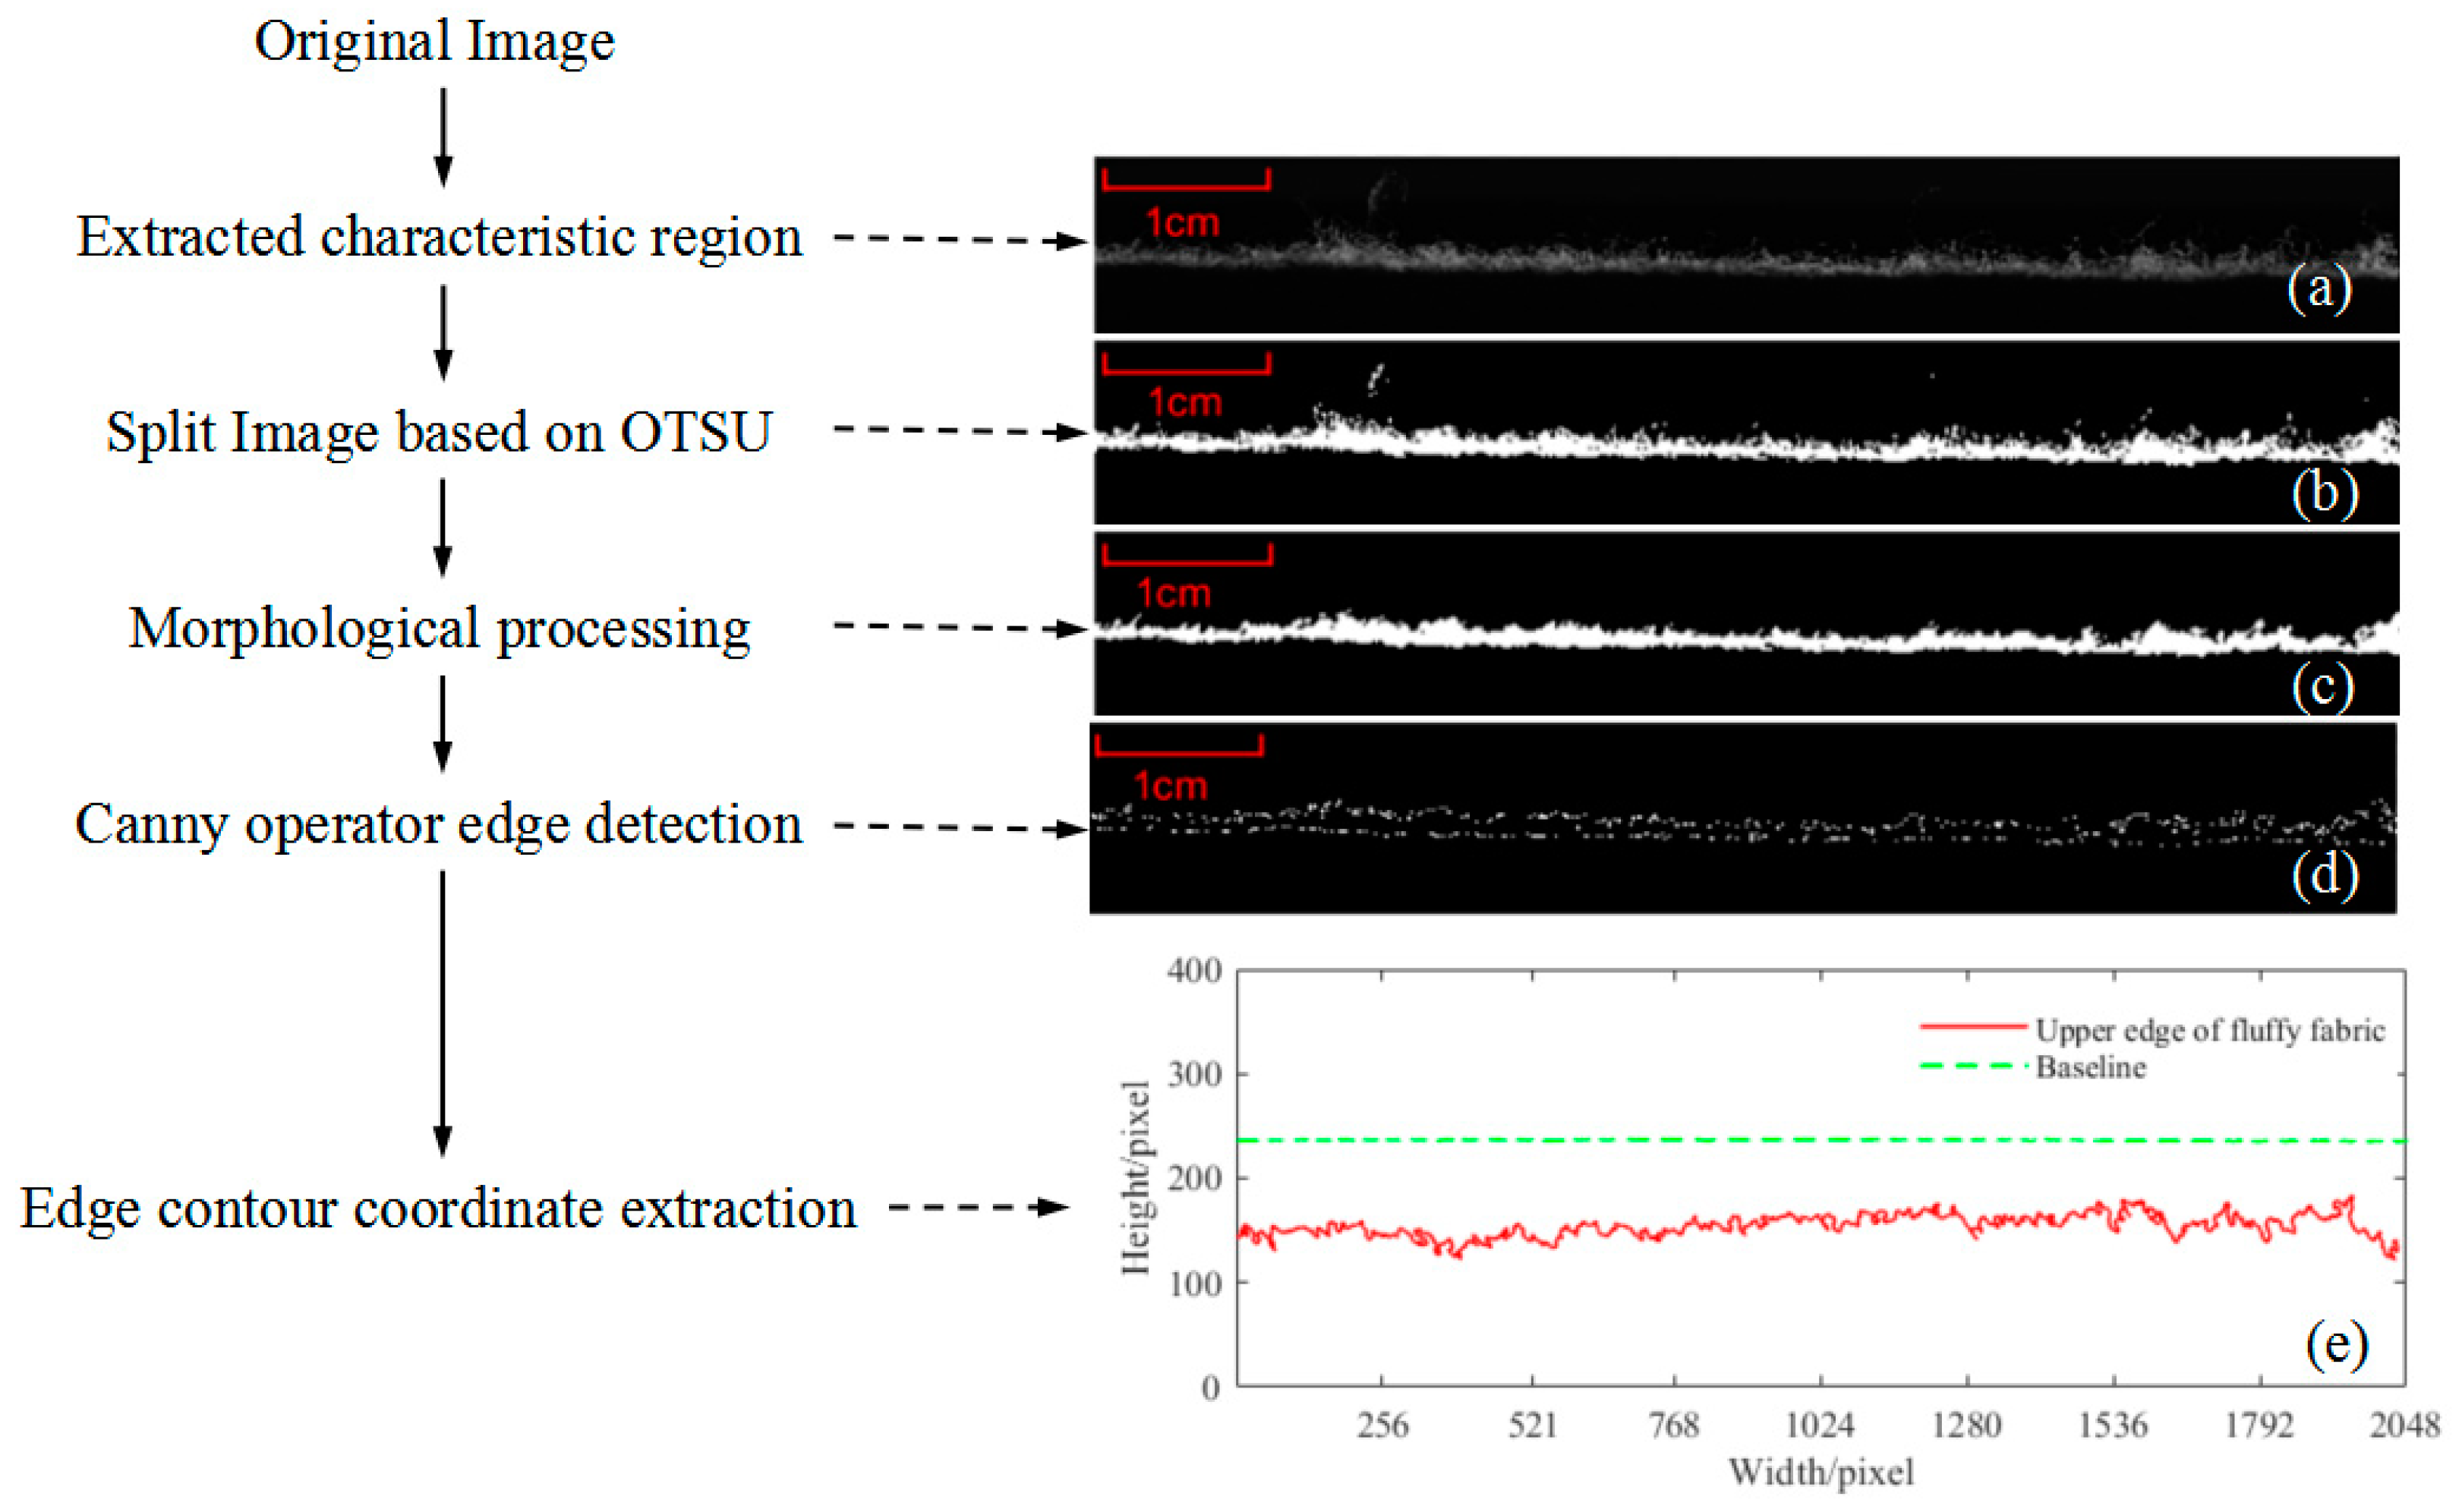
2.2. 2D Image Processing

In order to realize the 3D reconstruction of the surface of the fleece fabric, the surface outline of a single frame of fleece fabric needs to be extracted and the feature regions are pre-processed to improve the contrast of the image, as shown in Figure 2a. Based on the gray histogram features of the fleece region, the image is segmented using the maximum inter-category variance method [24] to separate the fluff region from the background, as shown in Figure 2b. Then, Figure 2b is opened and closed through the morphological method [25]. By constructing linear structural elements to compensate for defects such as holes and surface stray hairs in the fleece region in Figure 2b, a complete fleece region will be obtained, as shown in Figure 2c. Through the above image processing, a fluff image with clear edge contour can be obtained. Subsequently, in order to better extract the edge curve of the fluff image, the Canny operator [26] is used to detect the edge contour of the fleece fabric and obtain the edge contour boundary of the fleece fabric, as shown in Figure 2d. Finally, the chain contour principle [27] is used to extract the edge contour coordinate points in the image to obtain the edge contour curve on the fleece fabric, as shown in Figure 2e. Since the default matrix is in the origin of the coordinate system in MATLAB, the resulting curve is a mirror image of the actual curve.

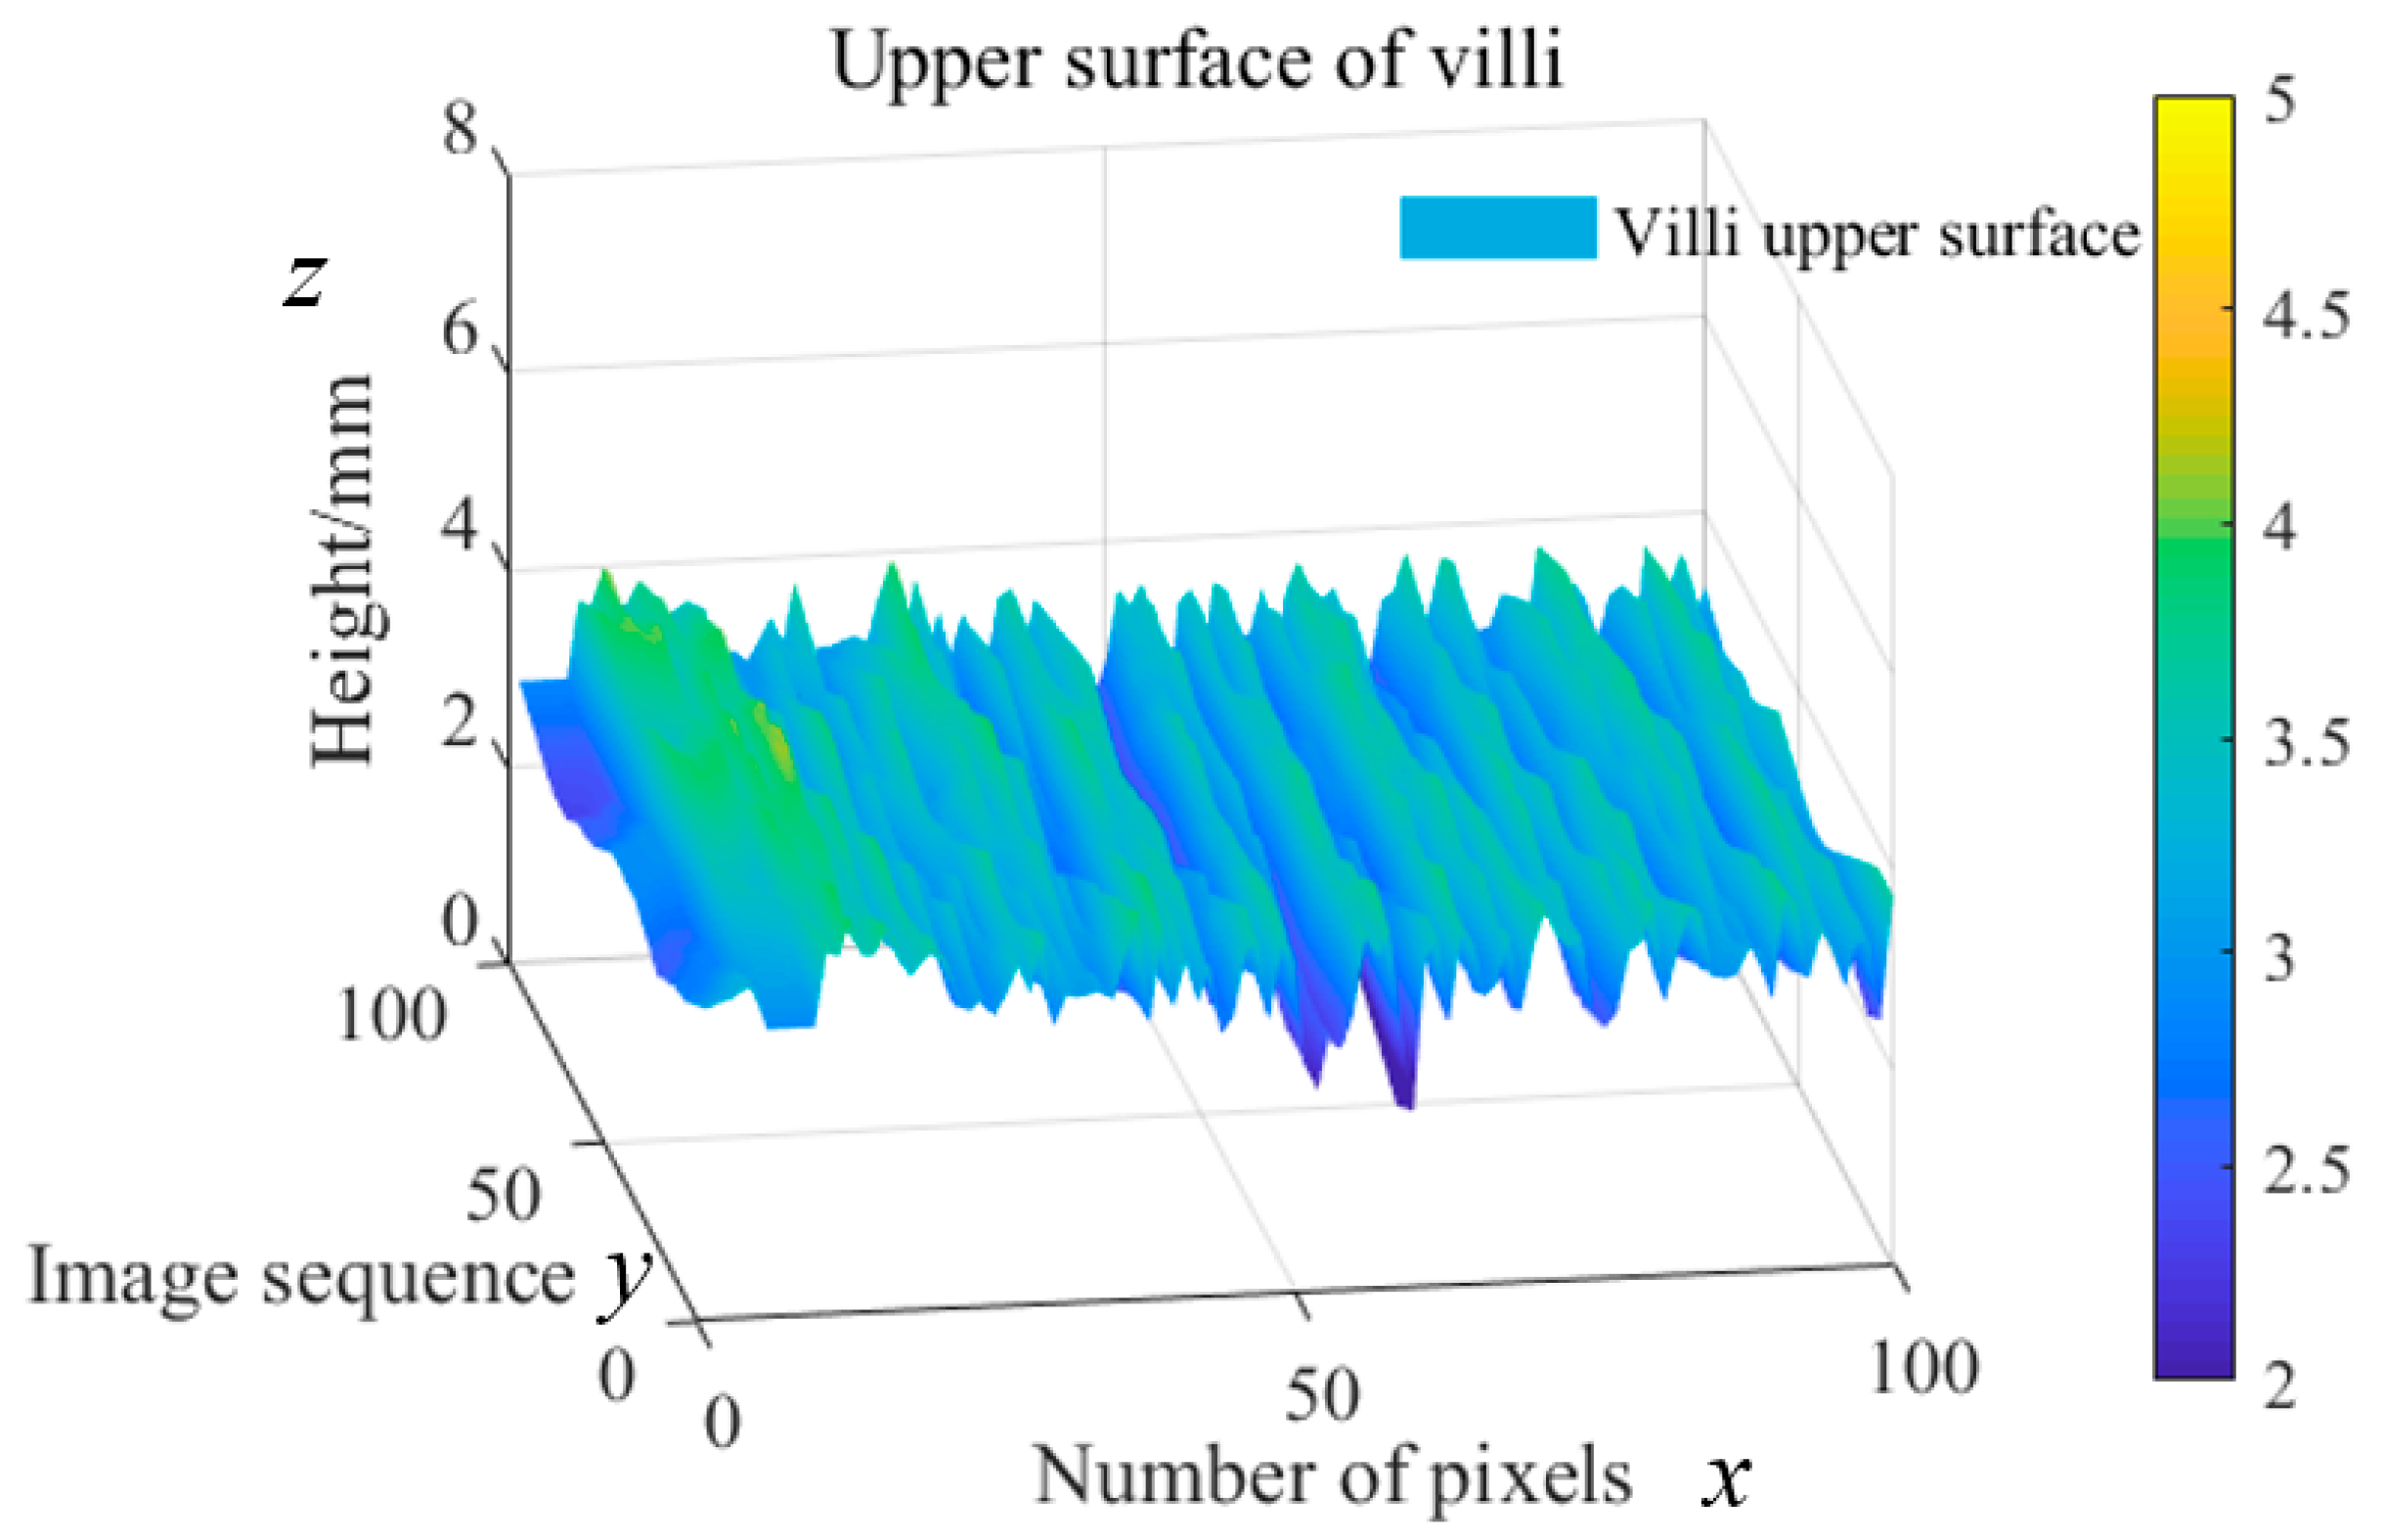
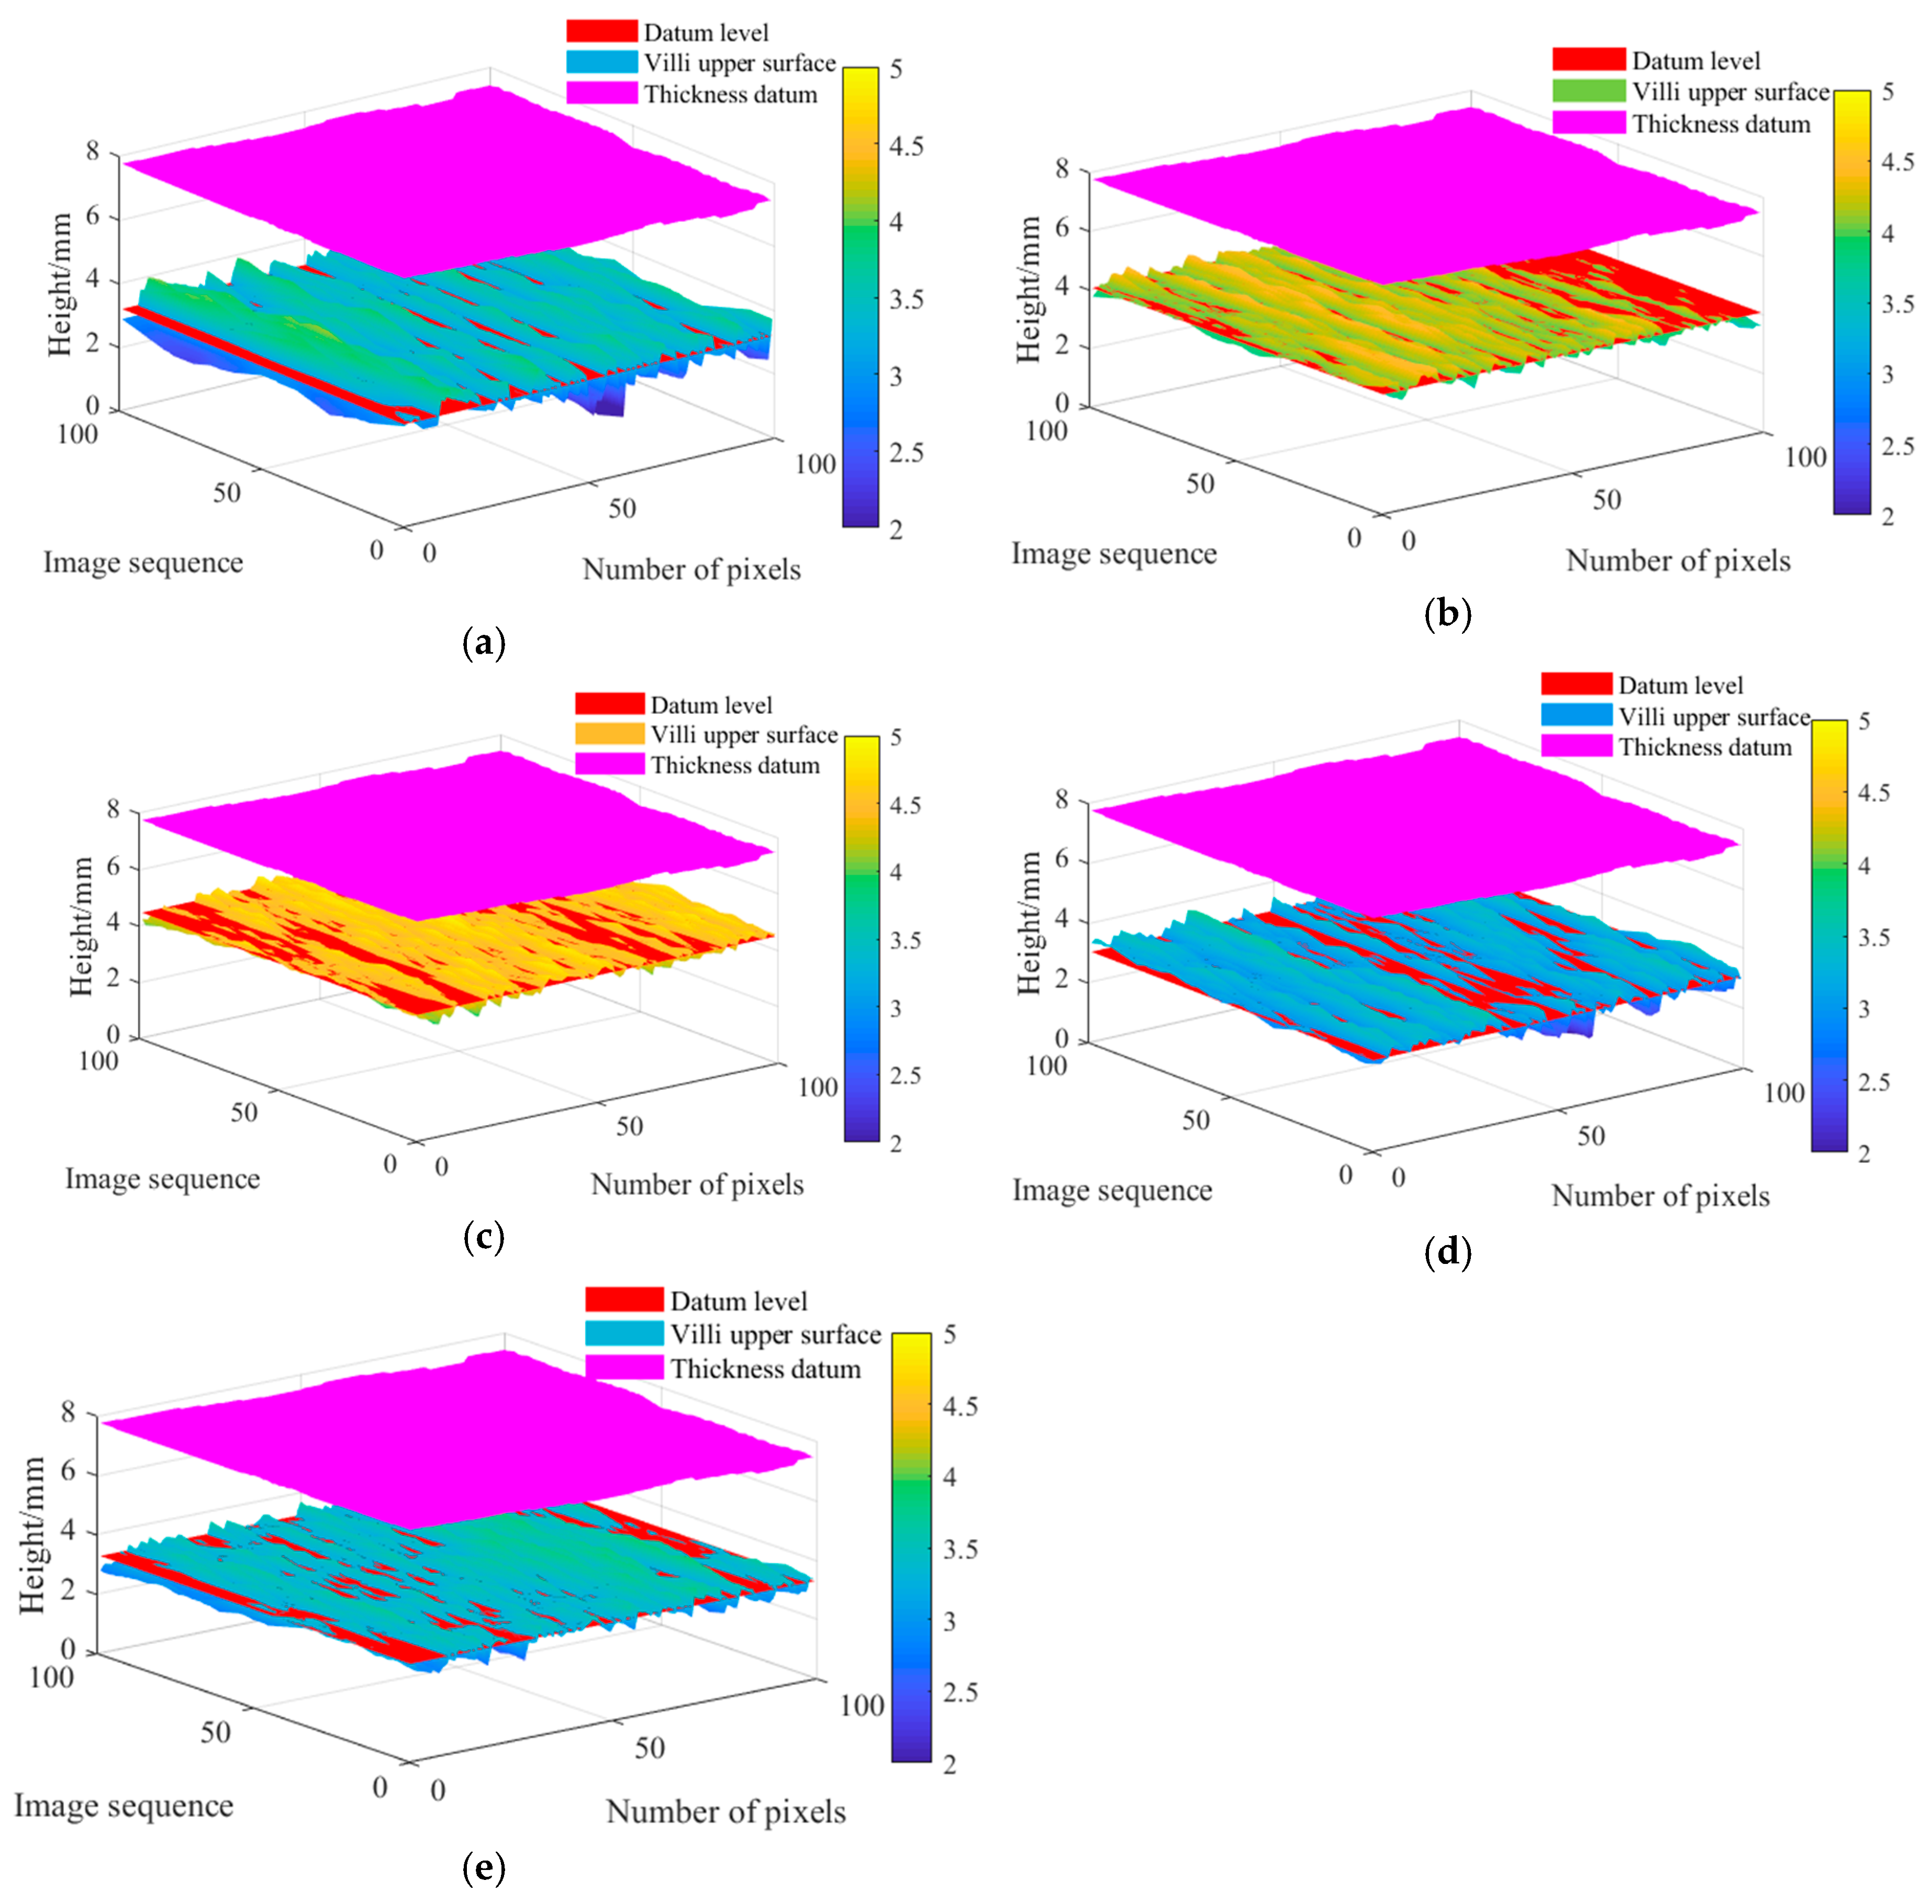
2.3. 3D Image Reconstruction

Traditional 3D reconstruction methods usually use laser scanning equipment to scan the surface of the object or to fit the cross-sectional images of many object surfaces and use these to restore the 3D shape of the object surface [28,29,30]. This experiment fits many continuous fleece fabric tangential graphs from the perspective of slitting. The acquisition time of the experiment is 10 s, and the acquisition distance is 32.63 mm/s. The method used in this article is this. First, we construct a multi-dimensional array, which is called a 3D voxel matrix M, and then use the surf function in MATLAB software to build model. As shown, Figure 3 is a 3D reconstruction of fabric surface.
As can be seen from Figure 3, the figure reflects the thickness deviation of the fleece area in the z-axis direction and reflects the difference in the tangential graphs of the fleece fabrics collected at different frame numbers in the x and y-axis directions. To evaluate the thickness of the fleece fabric, the thickness parameter needs to be constructed in the z-axis direction. In addition, in order to reflect the difference of different fleece fabrics, the construction of the undulation parameter is in the x and y-axis directions.

3. Surface Quality Estimation

First of all, this experiment needs to set the datum. When calculating the thickness of the fleece fabric, the plane where the axial tangent of the roller is located is used as the reference plane, as shown in Figure 4. In order to obtain the thickness of the fleece fabric, the experiment uses the cut surface l2 of the roller as the thickness reference line of the fleece fabric. Then, the difference between the upper edge profile curve l1 of the fleece and the reference line is calculated, and the calculation result is the thickness curve L of the fleece fabric. As shown in Figure 2e, the green dotted line in the figure is the thickness reference line of the fleece fabric.
When measuring the fleece coverage, the least square surface of the surface of the fleece fabric is selected as the reference surface. Let the 3D surface of the fleece fabric be z(x, y), and the equation of the least-squares reference plane is referred to Equation (1).
f ( x , y ) = a + b x + c y ,
Calculate the model coefficients a, b, and c according to the principle of least squares and substitute them into Equation (1) to obtain the least squares plane equation of a certain point.

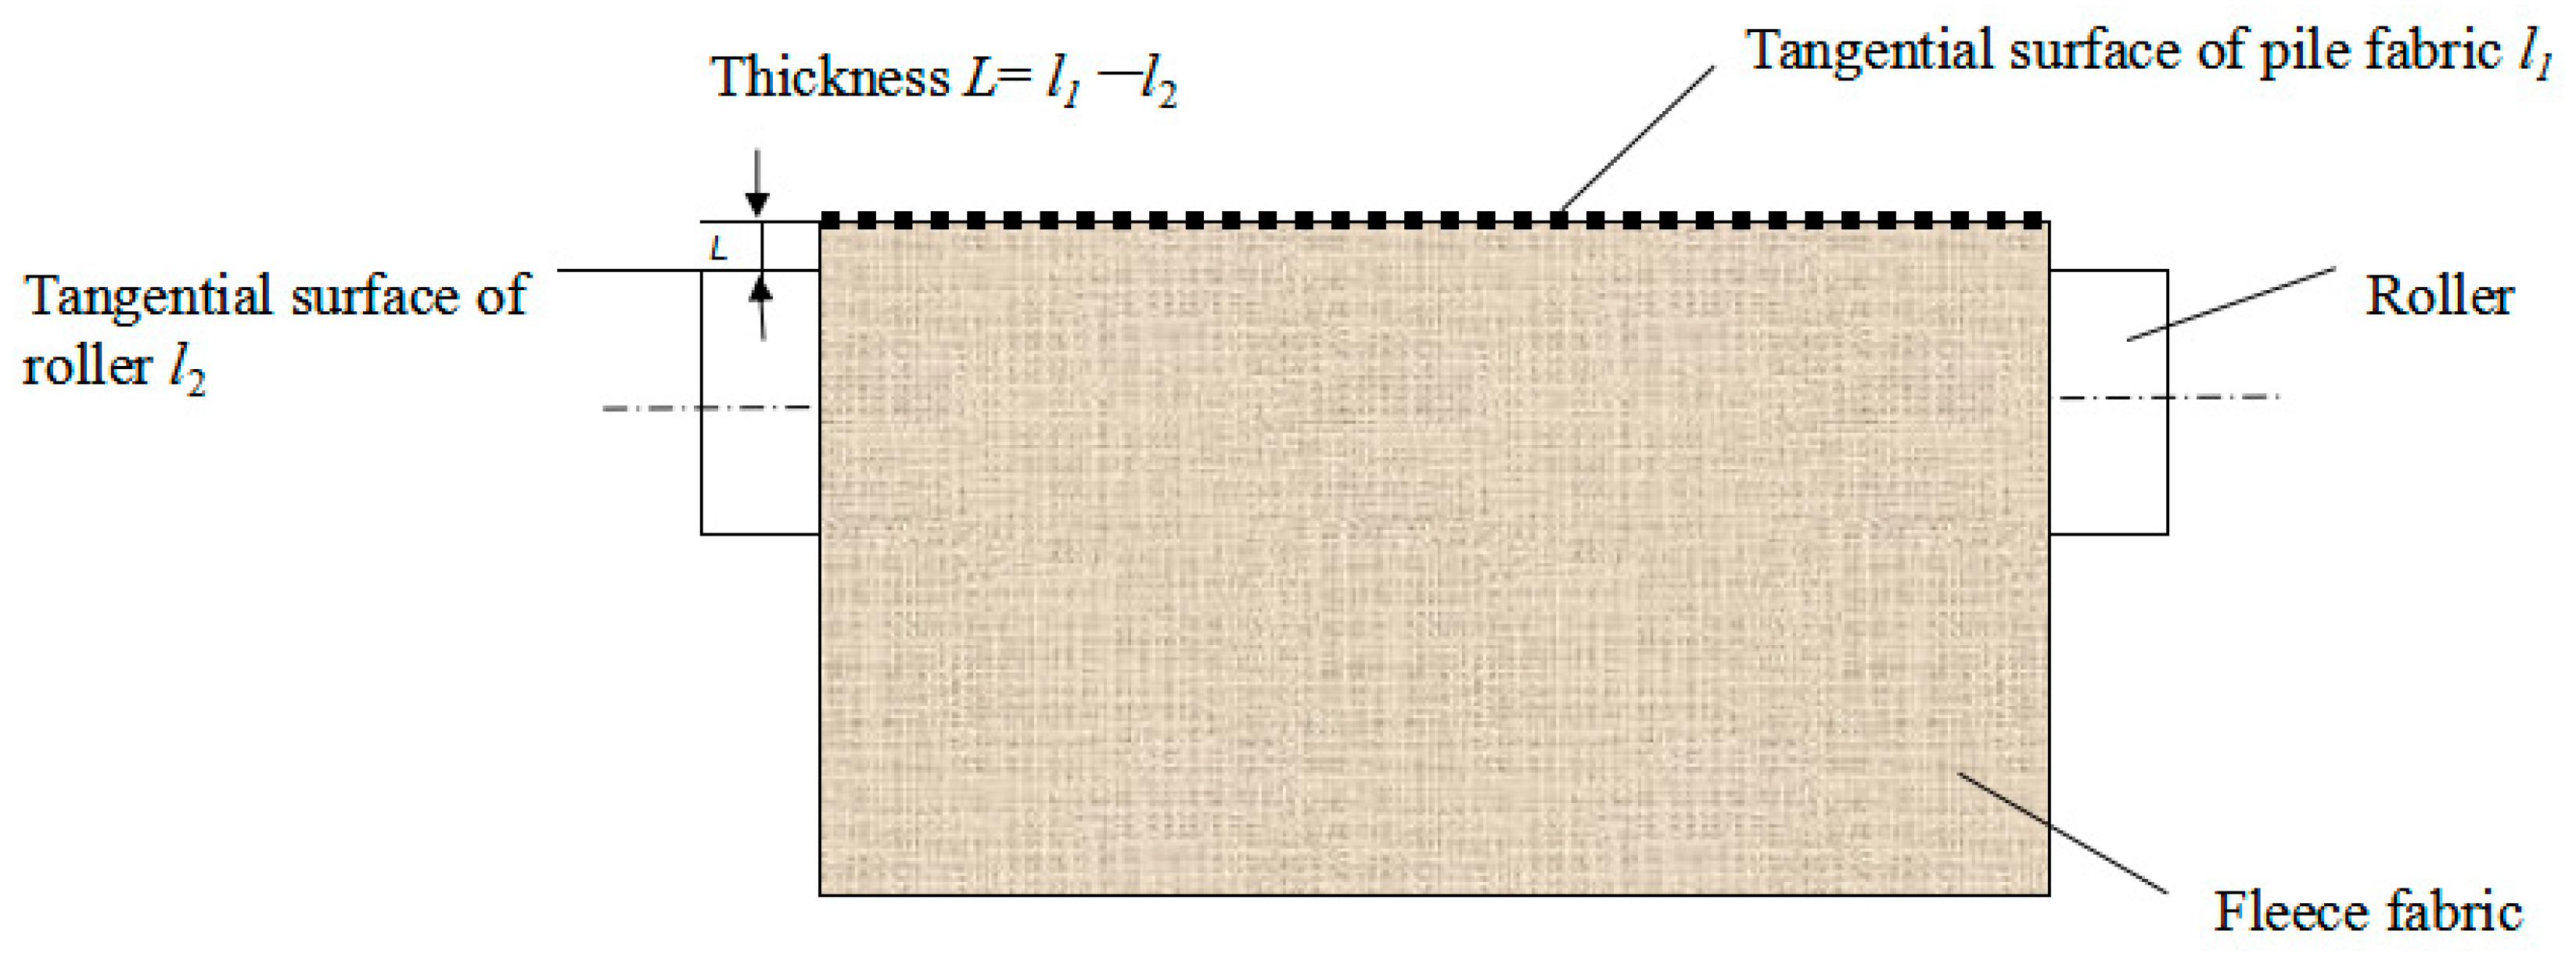
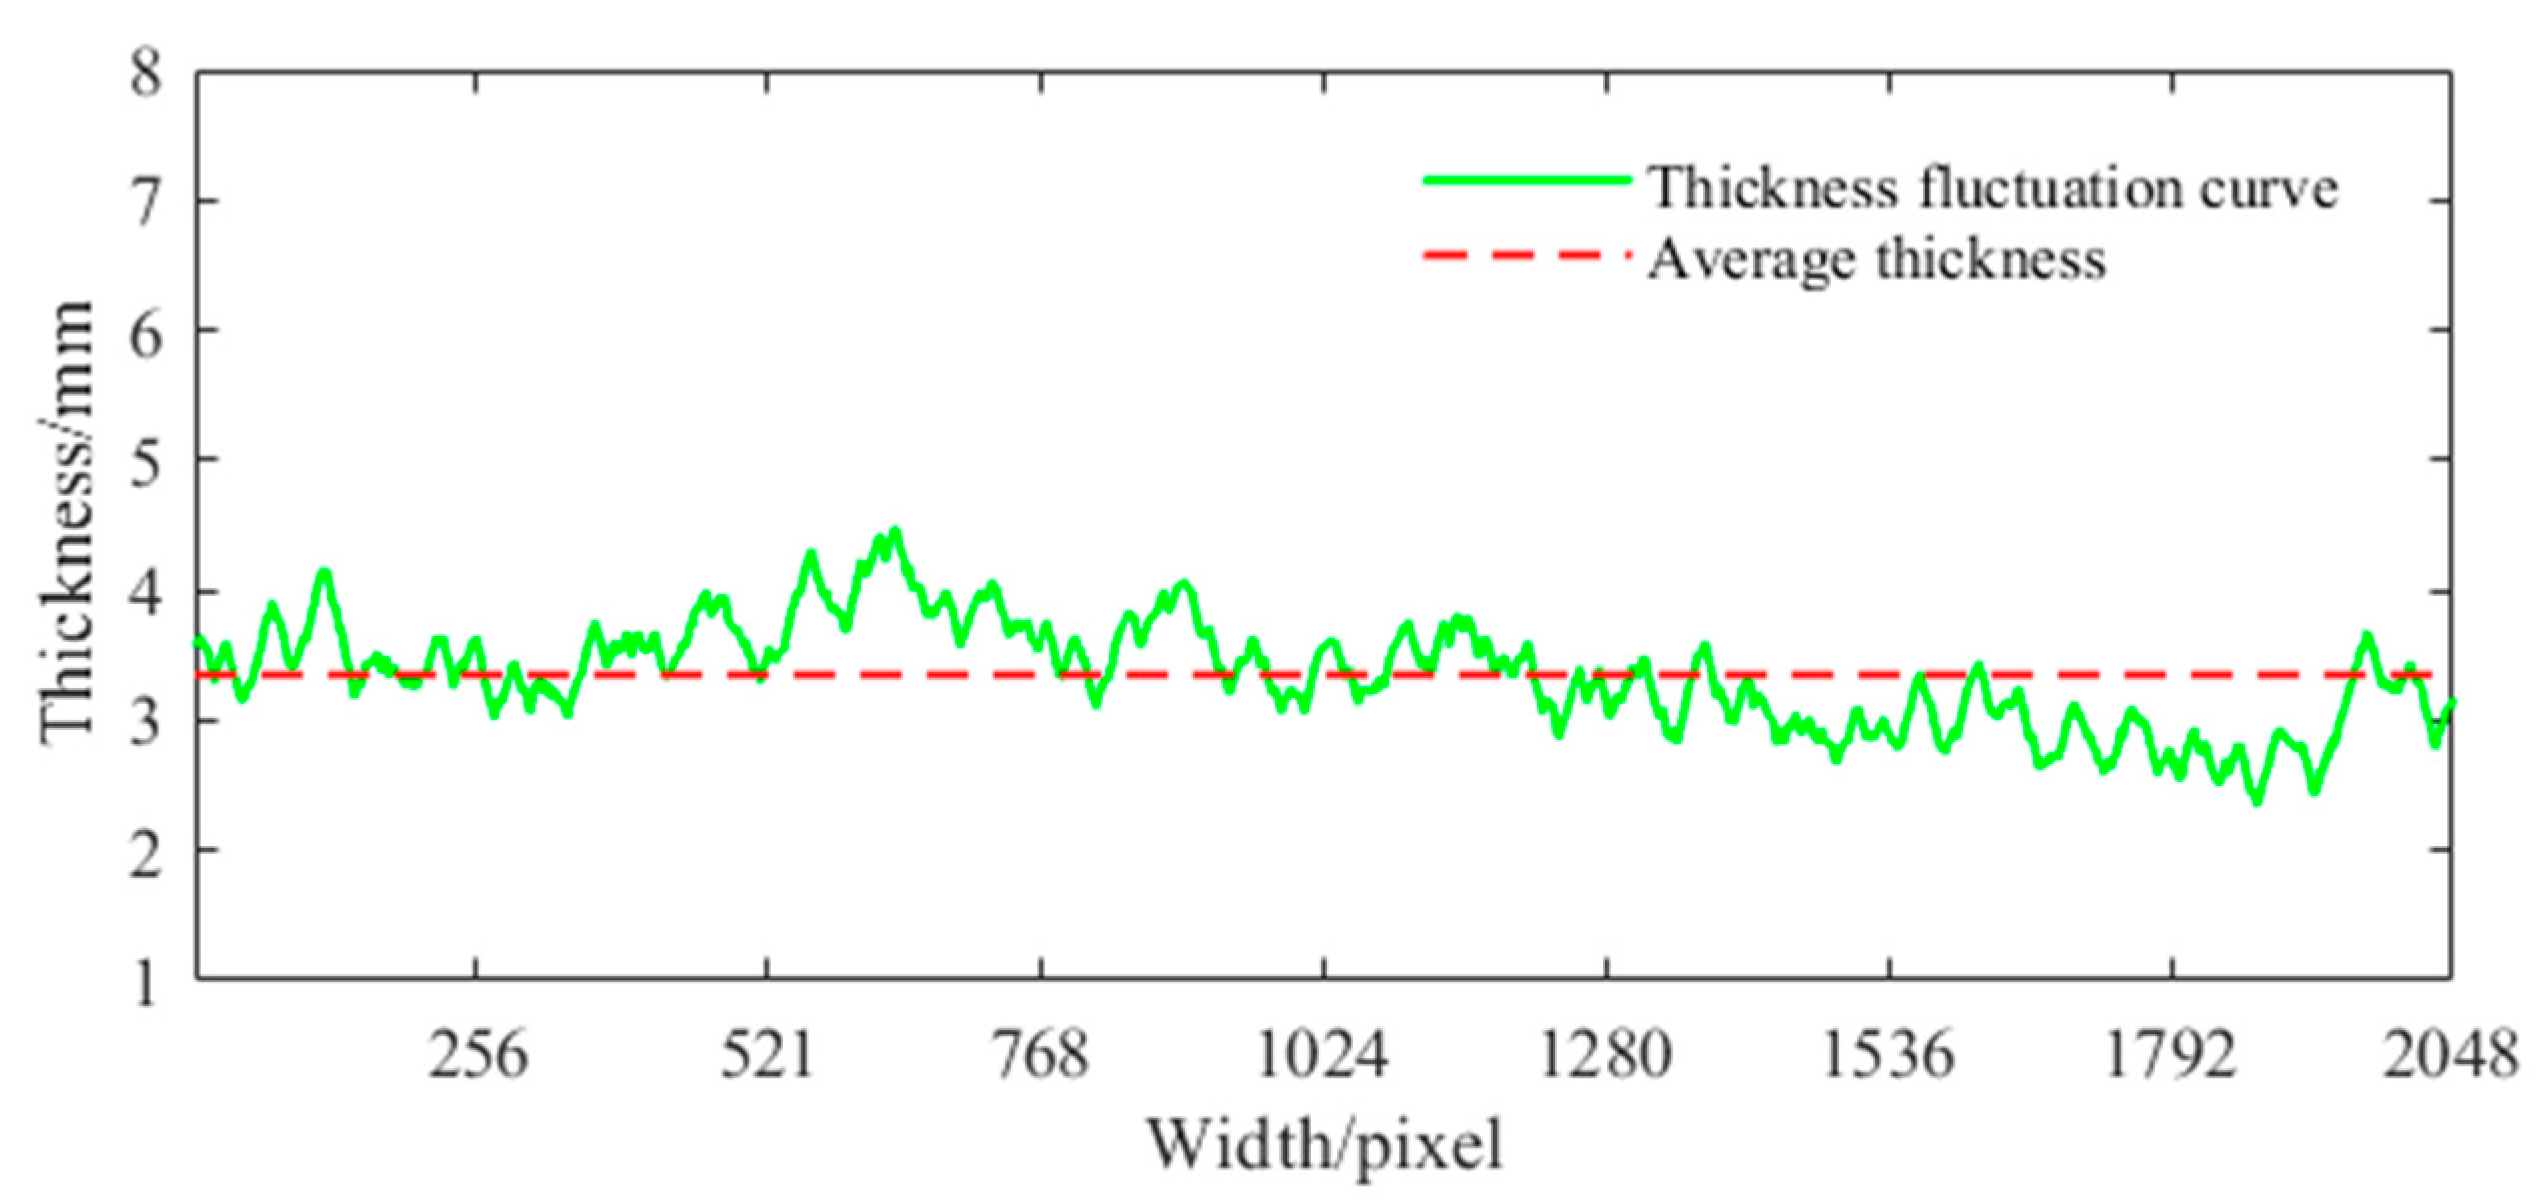
3.1. Modelling of Fabric Thickness

According to the principle of measuring the thickness of a fleece fabric, it can be known that the difference between the distance from each point of the upper edge contour of the fleece to the reference line and the thickness of the fabric is the thickness of the fleece. Let us assume the upper edge curve of the fleece to be g(x, y) and the reference line to be t(x, y), then the change curve of the fleece thickness L(x, y) is:
L ( x , y ) = | g ( x , y ) t ( x , y ) | ,
The average thickness of fleece fabric h ¯ ( x , y ) is:
h ¯ ( x , y ) = K i = 1 n | g ( x i , y i ) t ( x i , y i ) | n ,
where n is the number of edge points and K is the object surface resolution.
The thickness of the fleece area h ¯ ( x , y ) is characterized by the average thickness. The larger the value is, the thicker the fleece area is and the thinner the fleece fabric is. The obtained graph of the thickness variation of the fleece fabric is shown in Figure 5.
Similarly, in the 3D model of the fleece fabric, the average thickness of the fleece fabric H ¯ ( x ,   y ) is expressed as:
H ¯ ( x , y ) = i = 1 n h i ¯ n ,

3.2. Parametric Model of Undulation Degree of Fabric Surface

The undulating surface l(x, y, z) of the fleece fabric can be expressed as:
l ( x , y , z ) = z ( x , y ) f ( x , y ) ,
The expression of Equation (5) is:
G q = 1 S S l 2 ( x , y , z ) d x d y ,
In this formula, S is the orthographic projection of the sampling area on the reference plane, and Gq is the standard deviation of the points on the surface profile of the fleece. Gq can indicate the degree of the contour of the upper edge of the fleece deviating from the reference plane, that is the degree of fluctuation of the surface contour of the fleece. The smaller the profile fluctuation of the fleece surface, the flatter the fleece surface, and the better the fleece coverage.

4. Experimental Results

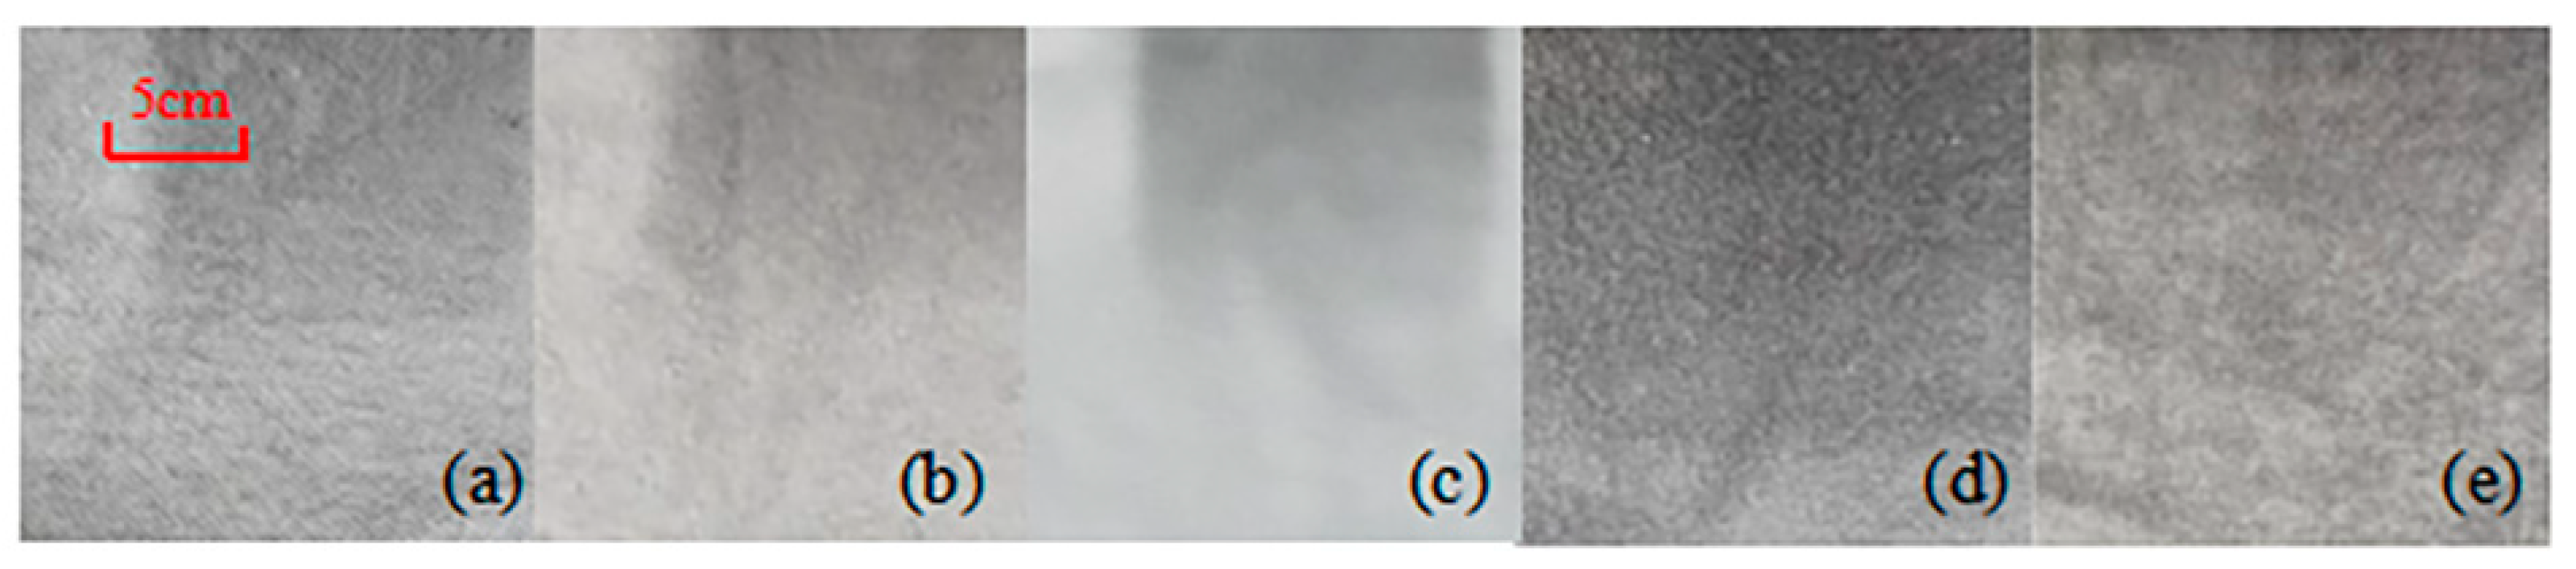
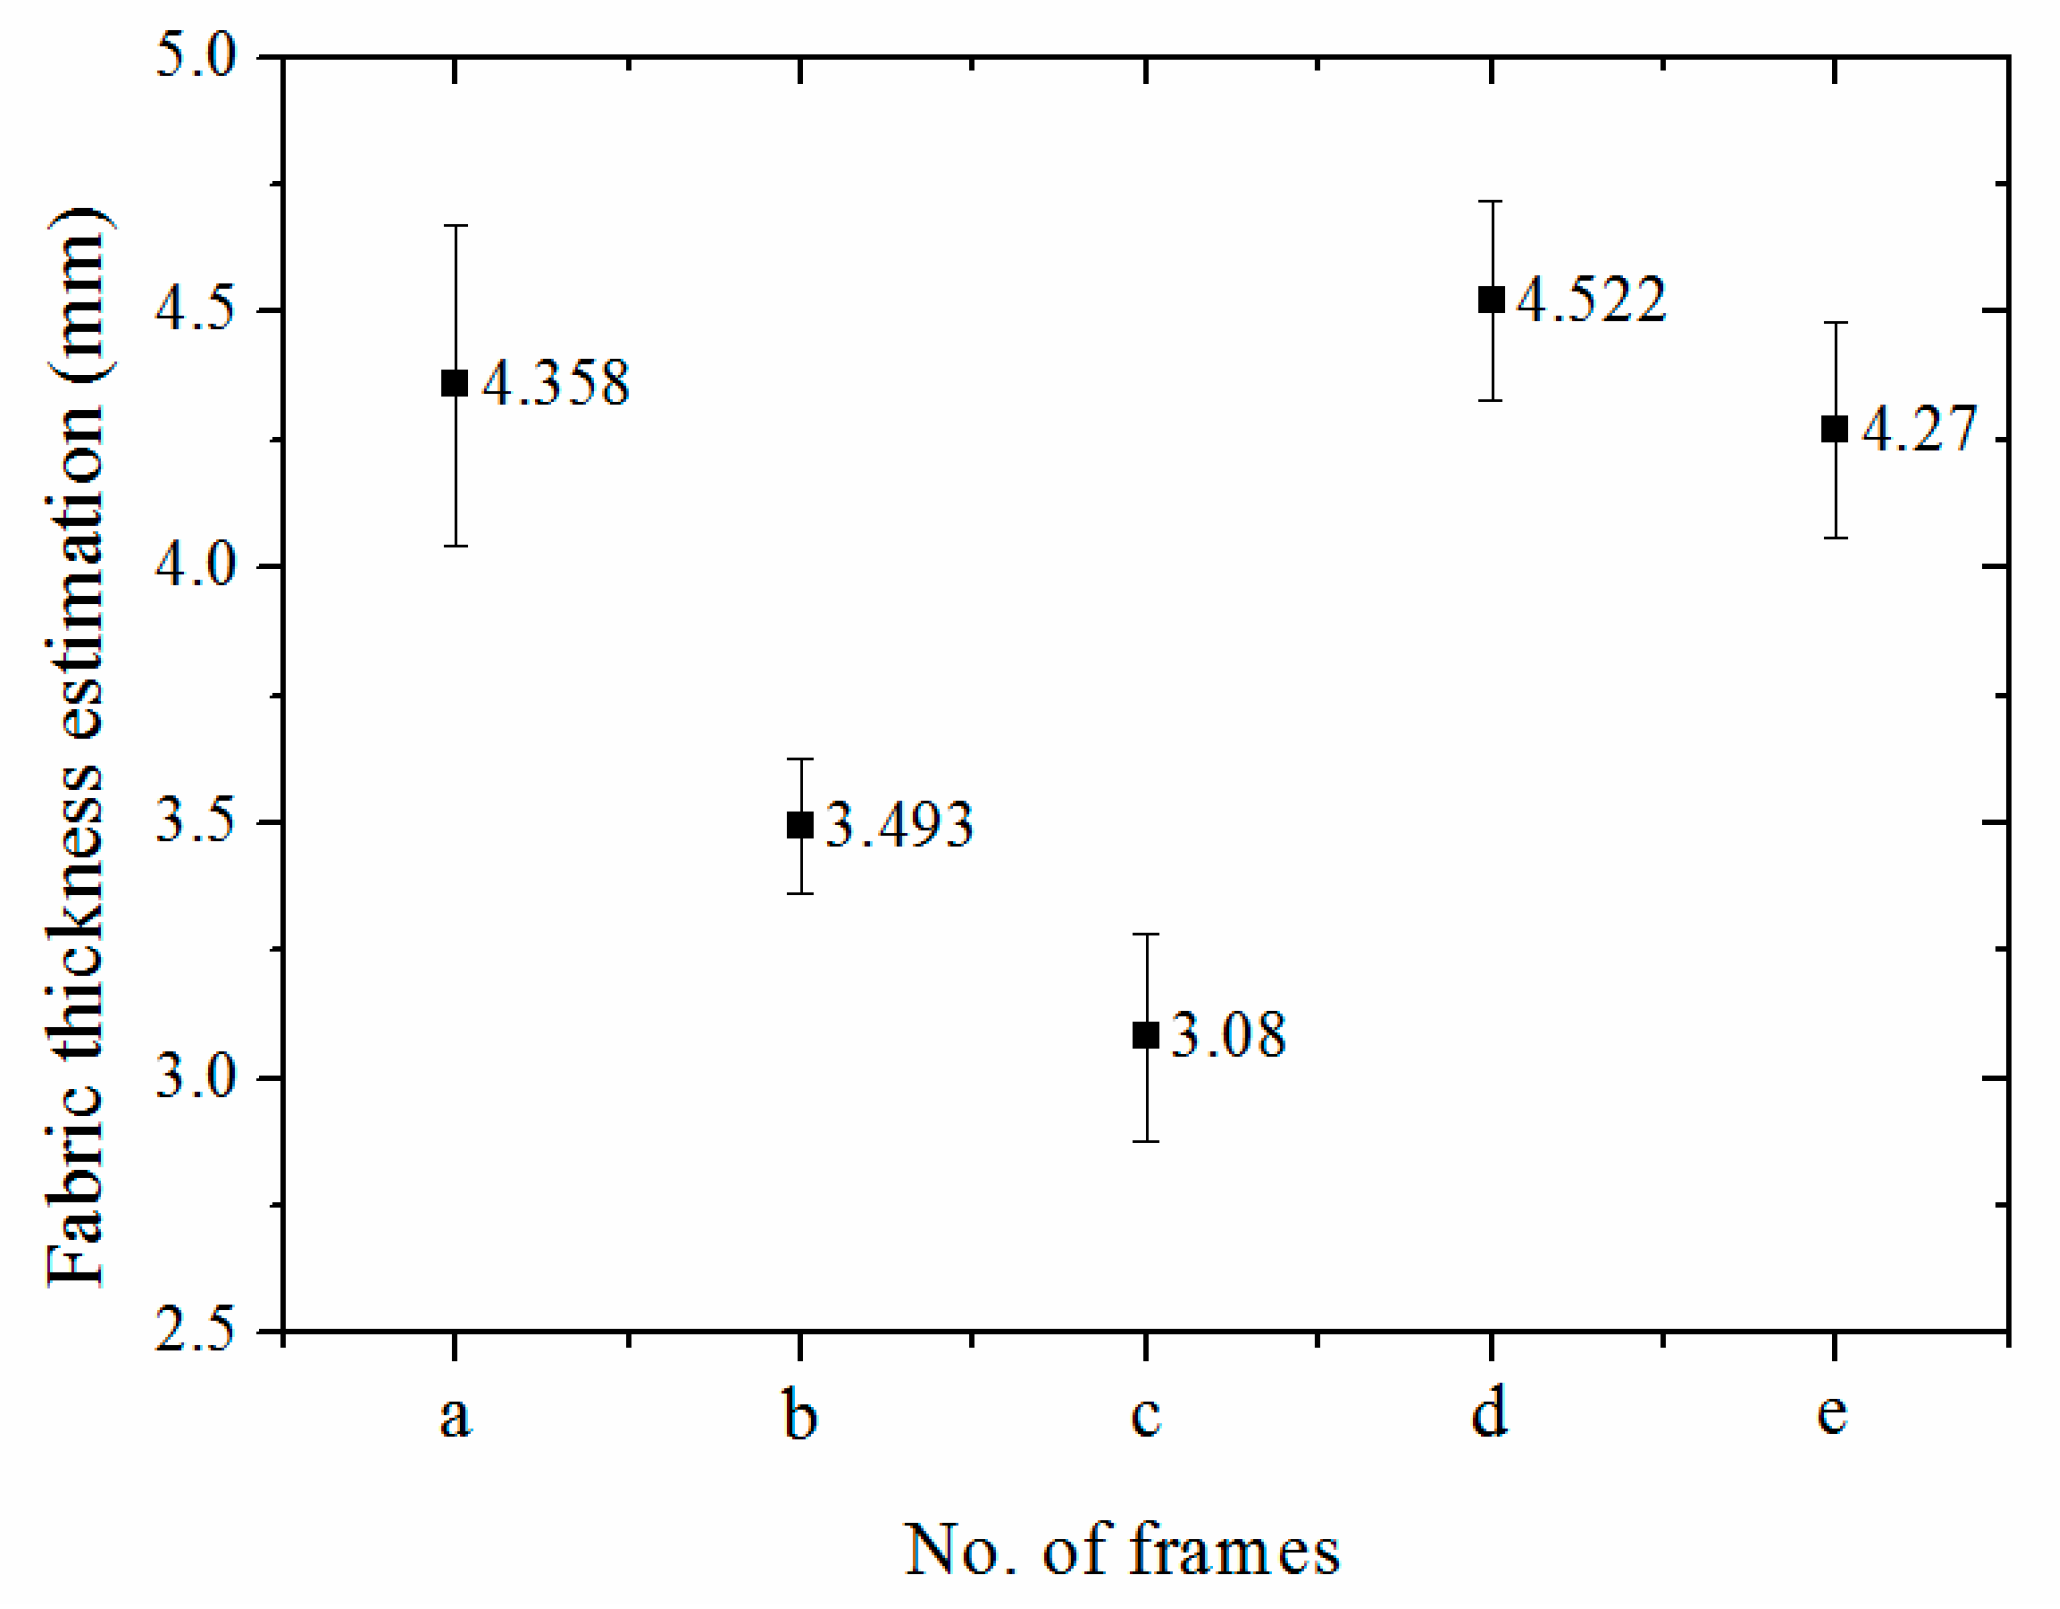
4.1. Fabric Thickness Estimation
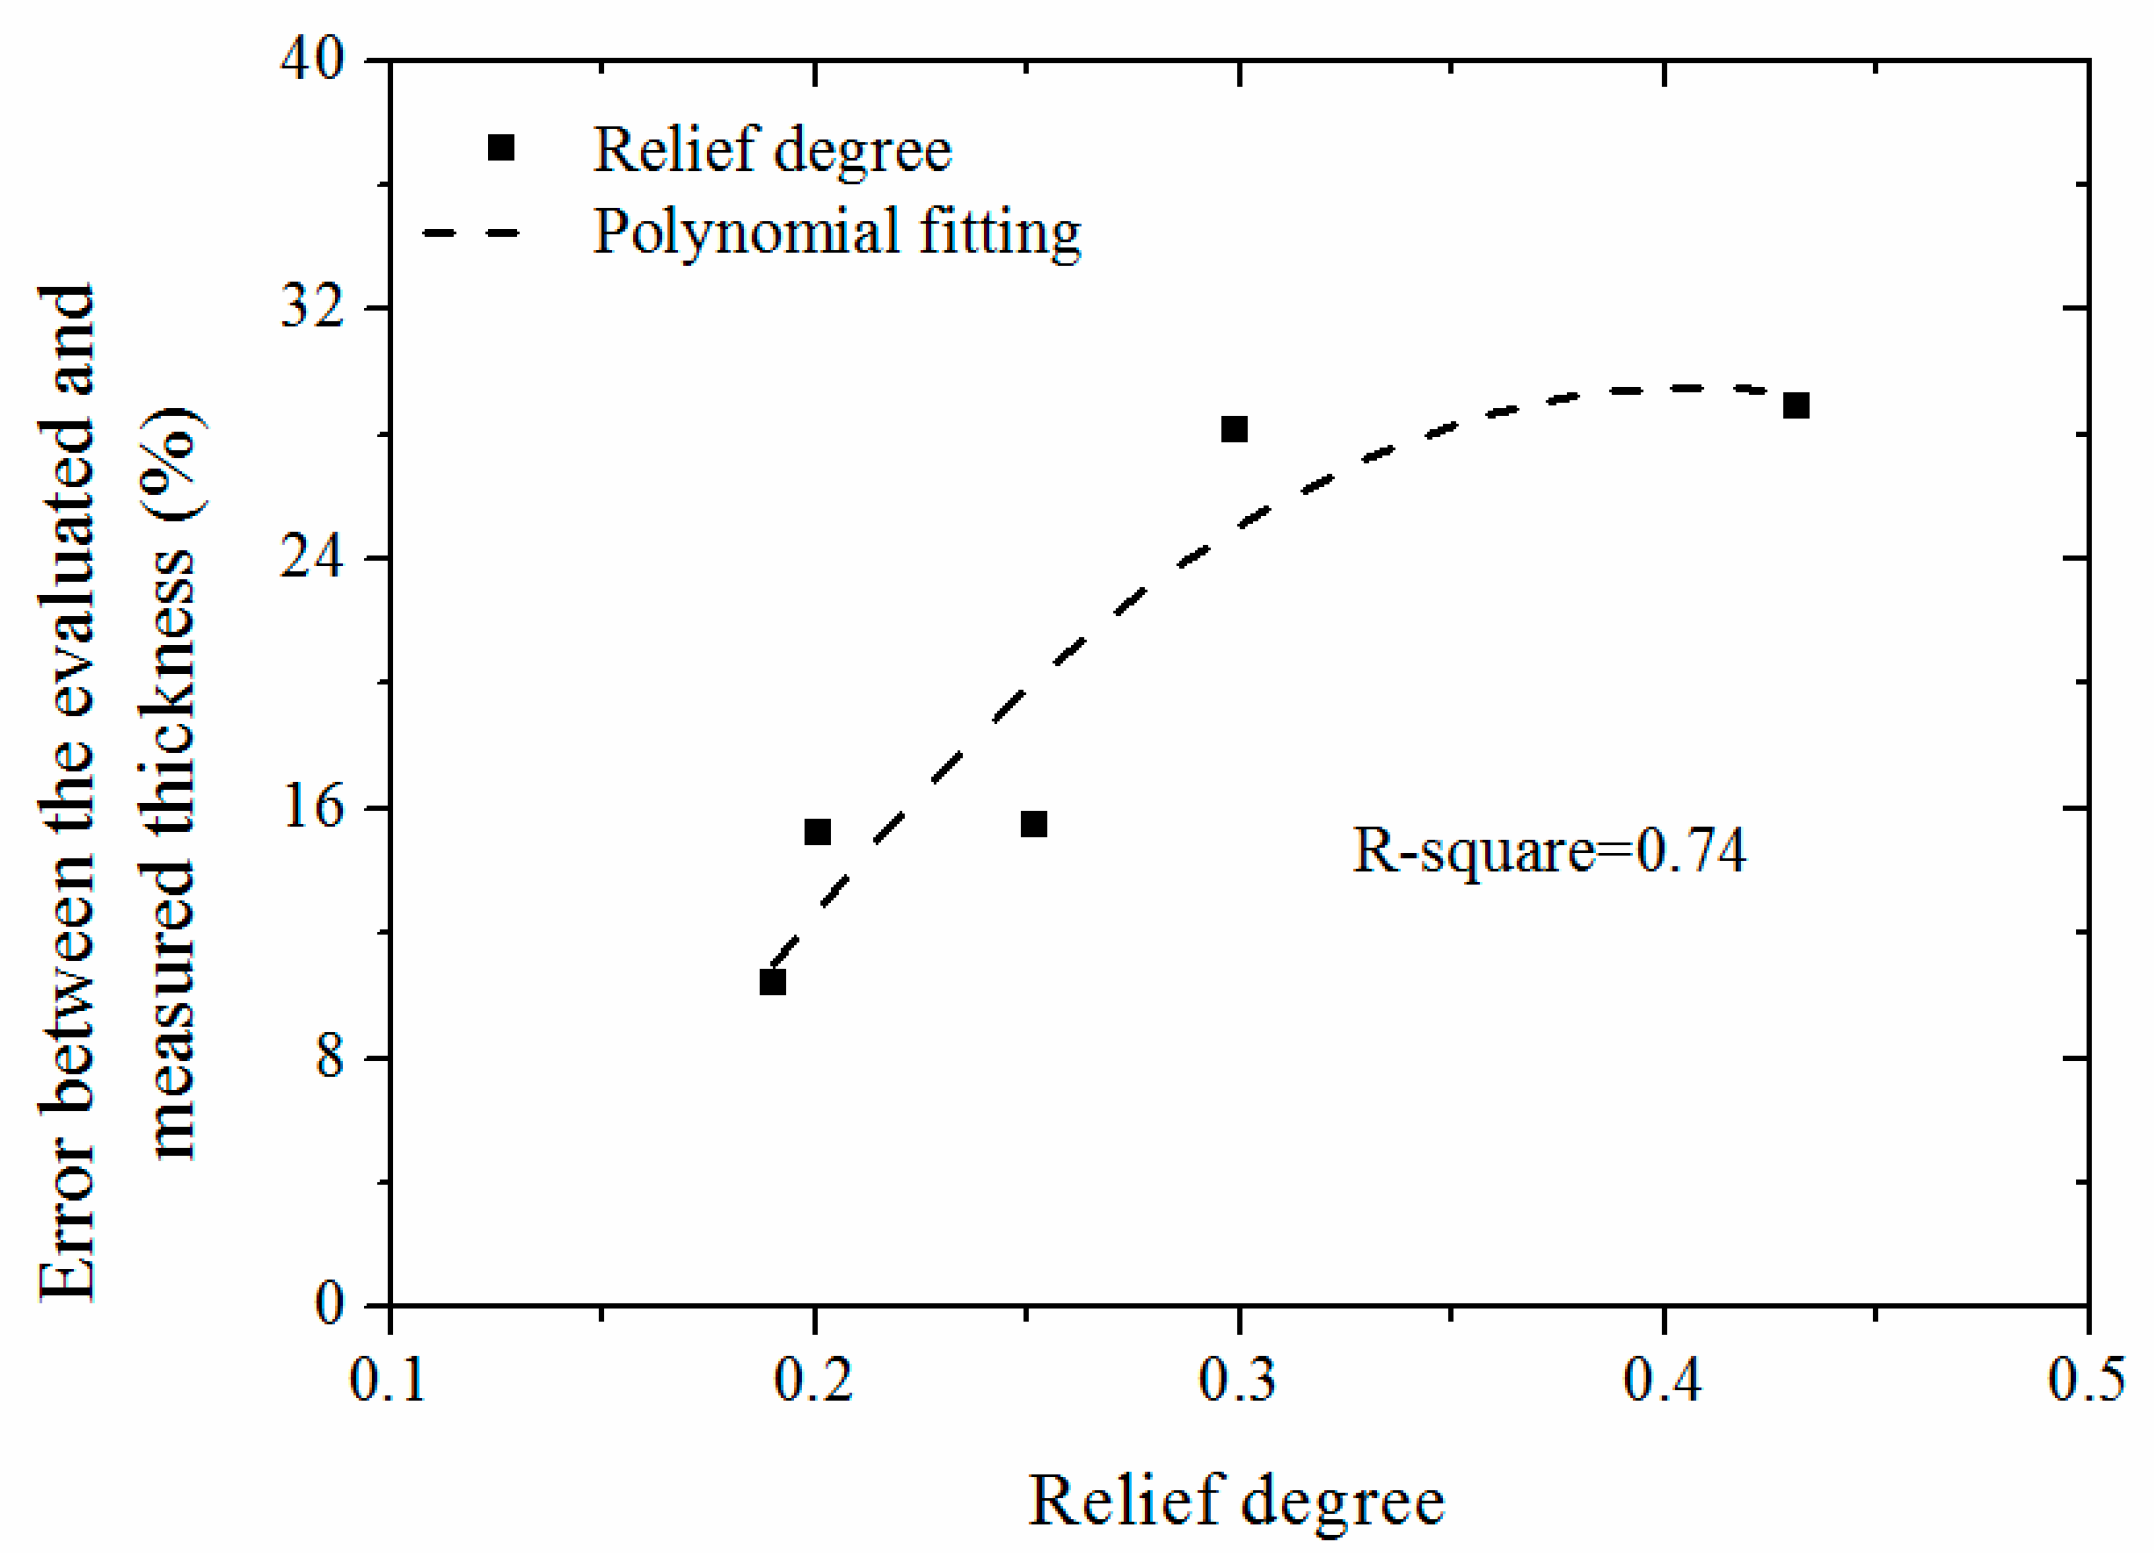
Figure 6 shows samples of different fleece fabrics produced by a company, and named them as samples a–e.
The details of the 2D results are shown in Appendix A, and the 3D reconstruction results about the fabric thickness estimation with five samples are shown in Figure 7. In these figures, the red plane represents horizontal reference plane, and the actual surface thickness curve is below the red plane due to the mirror reconstruction.
From Figure 7, the 3D reconstruction of the fabric surface of samples is obvious. The order of thickness about the thickness of the fabric surface is d > a > e > b > c. In addition, the relief degree keeps the different trend with the thickness like a > e > d > c or b. For comparison with the actual measured thickness of the fabric, the statistical analysis about the fabric thickness is done and the results are shown in Figure 8.
According to the two-dimensional data table as shown in Table A1, the fabric thickness estimation table is obtained as shown in Figure 8. From Figure 8, the thickness of the fabric surface of the samples is 4.36, 3.49, 3.08, 4.52 and 4.27 mm, respectively. The order of thickness about the variance is a > e > c > d > b.

4.2. Discussion

The thickness of the five samples is measured by the manual micrometer. The results are compared with the 3D reconstruction thickness of the fleece fabric. The relief degree is used to explain the impact of the measurement and estimation. The comparison results are shown in Table 1.
As can be seen in Table 1, the estimated thickness of the fabric surfaces is larger than the measured values. This is caused by the characteristics of different evaluation methods. The manually measured method adopts the micrometer to obtain the thickness, in which process each fabric surface is pressed to lead the villi clinging to the surface. The proposed estimation method adopts the 3D reconstruction technology to obtain the thickness based on the tangential 2D images, and, in this process, the villi of the fabric surface will be extended. The extended status may be more realistic than the pressed status. In addition, the error between the estimated and measured thickness is 28.9%, 15.2%, 10.4%, 28.1% and 15.5%, respectively. As can be seen, the error increases with the increasing of the relief degree. This means that the villi status significantly affects the evaluation of the thickness.
The relationship between the error and relief degree is shown in Figure 9. One can note that, with a reasonable relief degree, the error between the estimated and measured thickness is acceptable. However, in mass production, it is difficult/impossible to measure the fabric surfaces manually using labors, while the proposed estimation method is able to perform real-time monitoring of the fabric surfaces. As a result, the proposed 3D reconstruction method can solve the labor problem in fabric surface measurement and has significant practical importance.
As can be seen, the proposed method is very practical for many real-world applications where 3D reconstruction is required, such as the 3D scaffold construction and 3D printer. A camera is simply used in these applications to provide an online measurement of the 3D images. As a result, the proposed method can offer a more effective and efficient alternative for real-world applications of 3D scaffold construction and 3D printer.

5. Conclusions

A 3D reconstruction method is proposed in this paper to estimate the fabric surface thickness. The proposed 3D reconstruction is based on the 2D image processing; with the aid of Canny operator, the edge contour coordinate of the 2D image can be obtained to reconstruct the 3D image of the fabric surface. Because the proposed method does not require expensive 3D image sensors and costly 3D reconstruction software, it is very efficient and practical for real-world applications. Experimental validation has been performed to evaluate the performance of the proposed method. The analysis result demonstrates that the proposed 3D reconstruction method is able to produce comparable estimation accuracy of the fabric surface thickness as the traditional manual measurement method. Hence, the proposed method can realize the automation of the manufacturing of fabric surface production. The future plan will apply the proposed method in field test and practical application.

Author Contributions

Conceptualization, Z.L. and S.J.; methodology, Y.C.; software, J.Y.; validation, Y.L., P.F. and Z.L.; formal analysis, S.J., Z.L., and M.K.G.; investigation, Y.C.; resources, M.K.G., and P.F.; data curation, Y.C., J.Y., and Y.L.; writing—original draft preparation, S.J.; writing—review and editing, Z.L., and M.K.G.; supervision, Z.L.; funding acquisition, S.J., and Z.L. All authors have read and agreed to the published version of the manuscript.

Funding

This research was funded by Shanxi R&D project, China, grant number 2020GY-172, Major Scientific and Technological Innovation Project of Shandong Province, China, grant number 2019JZZY010820, Technology Innovation Leading Program of Xi’an, China, grant number 201805030YD8CG14(5), Xi’an Key Laboratory of Modern Intelligent Textile Equipment, China, grant number 2019220614SYS021CG043, and Australia Research Council, grant number DE190100931.

Conflicts of Interest

The authors declare no conflict of interest.

Appendix A

Table A1. Analysis of 2D images.
Fabric SampleNumber of FramesSingle Frame Thickness/mm
a1–105.045.025.014.954.924.154.134.094.124.12
11–204.033.913.993.903.894.284.244.474.384.21
21–304.214.554.504.564.384.714.384.364.384.37
31–404.354.064.204.144.414.404.664.564.564.44
41–504.004.054.084.124.504.894.685.104.434.07
51–604.624.744.315.335.064.104.084.174.385.10
61–704.654.634.614.114.054.274.114.104.654.38
71–804.254.474.584.054.364.444.354.244.484.11
81–904.214.164.184.104.344.003.883.874.154.09
91–1004.544.604.564.073.984.004.234.244.404.48
b1–103.733.713.693.653.613.673.673.653.623.56
11–203.553.543.493.493.523.413.403.793.793.73
21–303.733.583.633.393.403.463.413.363.663.67
31–403.353.393.323.313.363.603.403.393.423.42
41–503.363.433.293.293.293.453.463.373.293.29
51–603.533.433.383.393.363.543.563.523.463.46
61–703.373.363.603.603.513.633.633.343.343.44
71–803.443.543.643.683.573.533.563.413.383.44
81–903.463.363.413.413.353.243.413.403.343.38
91–1003.623.553.453.553.633.553.593.643.633.62
c1–103.253.343.313.363.393.463.423.343.353.33
11–203.303.323.253.173.323.323.303.433.553.43
21–303.203.2403.233.213.223.163.183.133.203.23
31–402.953.003.023.173.022.882.912.932.932.89
41–503.022.982.972.892.992.742.772.883.012.90
51–603.043.002.962.793.013.113.143.143.133.06
61–703.233.1903.143.063.173.253.213.203.213.19
71–803.213.223.173.103.293.113.133.093.263.07
81–902.802.942.822.962.822.732.772.712.702.72
91–1002.772.802.802.852.882.852.812.922.842.86
d1–104.634.624.694.674.704.494.454.434.434.49
11–204.554.604.554.614.574.504.474.514.454.42
21–304.484.574.594.684.764.244.264.264.344.41
31–404.744.584.594.594.304.524.504.484.494.52
41–504.484.614.714.704.594.884.585.064.344.48
51–604.615.024.514.964.664.574.534.594.775.01
61–704.594.574.584.654.654.364.394.434.574.53
71–804.494.494.434.384.384.484.534.574.464.35
81–904.094.164.294.424.394.234.233.994.224.22
91–1004.674.644.704.164.144.584.894.864.384.65
e1–104.644.684.624.674.674.544.454.554.554.45
11–204.324.334.354.334.384.554.534.544.564.47
21–304.334.794.304.614.834.424.374.594.554.34
31–404.254.304.314.434.374.254.254.184.204.21
41–504.144.134.304.134.134.094.114.094.194.14
51–604.254.154.143.994.184.364.364.224.334.03
61–704.164.184.334.104.163.864.244.114.074.24
71–804.023.804.093.904.004.144.034.144.144.11
81–904.224.103.744.144.194.174.233.884.344.24
91–1004.234.114.314.104.024.364.324.354.274.38

References

  1. Yang, S.L.; Ma, S.; Ding, C.P. Textile surface fleece rate test system using machine vision. Text. J. 2017, 38, 119–123. [Google Scholar]
  2. Zhao, B.; Zheng, L.X.; Pan, X.L. New fabric defect detection algorithm based on image saliency area features. J. Comput. Appl. 2012, 32, 90–93. [Google Scholar]
  3. Tropp, M.; Brumerčík, F.; Šteininger, J.; Weis, P.; Glowacz, A. Heat distribution in the deep drawing device components working by high temperatures. IOP Conf. Ser. Mater. Sci. Eng. 2018, 393, 012075. [Google Scholar] [CrossRef]
  4. Banumathi, P.; Nasira, G.M. Fabric Inspection System using Artificial Neural Networks. Int. J. Comput. Eng. Sci. 2012, 2, 20–27. [Google Scholar]
  5. Jasinska, I. Assessment of a fabric surface after the pilling process based on image analysis. Fibres Text. East. Eur. 2009, 17, 55–58. [Google Scholar]
  6. Jing, J.; Li, P.; Long, G. The improved algorithm for color-texture image segmentation. In Proceedings of the IEEE 3rd International Conference on Communication Software and Networks, Xi’an, China, 27–29 May 2011. [Google Scholar]
  7. Jin, J.; Kang, X. Fabric Pilling Image Segmentation Based on Mean Shift. In Proceedings of the International Conference on Electronic Commerce, Web Application, and Communication, Guangzhou, China, 16–17 April 2011; Volume 104, pp. 80–84. [Google Scholar]
  8. SariSarraf, H.; Goddard, J.S. Vision system for on-loom fabric inspection. IEEE Trans. Ind. Appl. 1999, 35, 1252–1259. [Google Scholar]
  9. Chan, C.H.; Pang, G. Fabric defect detection by Fourier analysis. In Proceedings of the 1999 IEEE Industry Applications Conference, Phoenix, AZ, USA, 6 August 2002. [Google Scholar] [CrossRef] [Green Version]
  10. Kuo, C.F.J.; Su, T.L.; Chang, C.D. Intelligence control of on-line dynamic gray cloth inspecting machine system module design. II. Defects inspecting module design. Fibers Polym. 2008, 9, 768–775. [Google Scholar] [CrossRef]
  11. Bharathi, S.; Vasuki, A. 2D-to-3D Conversion of Images Using Edge Information. In Proceedings of the IJCA Proceedings on International Conference in Recent trends in Computational Methods, Communication and Controls (ICON3C 2012), Coimbatore, Nadu, India, 1–5 April 2012; pp. 27–32. [Google Scholar]
  12. Kang, T.J.; Cho, D.H.; Kim, S.M. Objective Evaluation of Fabric Pilling Using Stereovision. Text. Res. J. 2004, 74, 1013–1017. [Google Scholar] [CrossRef]
  13. Yu, L.J.; Wang, R.W. A novel three-dimensional reconstruction algorithms for nonwoven fabrics based on sequential two dimensional images. In Proceedings of the International Conference on Advanced Materials, Structures and Mechanical Engineering, Incheon, Korea, 29–31 May 2015. [Google Scholar]
  14. Kim, S.; Chang, K.P. Evaluation of fabric pilling using hybrid imaging methods. Fibers Polym. 2006, 7, 57–61. [Google Scholar] [CrossRef]
  15. Tilocca, A.; Borzone, P.; Carosio, S. Detecting fabric defects with a neural network using two kinds of optical pattems. Text. Res. J. 2002, 72, 545–550. [Google Scholar] [CrossRef]
  16. Ouyang, W. Evaluating Fabric Pilling/Wrinkling Appearance Using 3D Images. Master’s Thesis, The University of Texas, Austin, TX, USA, 2013. [Google Scholar]
  17. Saharkhiz, S.; Abdorazaghi, M. The Performance of Different Clustering Methods in the Objective Assessment of Fabric Pilling. J. Eng. Fibers Fabr. 2012, 7, 35–41. [Google Scholar] [CrossRef] [Green Version]
  18. Taylor, K.A.; Schmitz, H.; Reedy, M.C.; Goldman, Y.E.; Franzini-Armstrong, C.; Sasaki, H.; Tregear, R.T.; Poole, K.; Lucaveche, C.; Edwards, R.J.; et al. Tomographic 3D reconstruction of quick-frozen, Ca2+-activated contracting insect flight muscle. Cell 1999, 99, 421–431. [Google Scholar] [CrossRef] [Green Version]
  19. Ems-Mcclung, S.C.; Walczak, C.E. Catastrophic kinesins: Piecing together their mechanism by 3D reconstruction. Cell 2004, 116, 485–486. [Google Scholar]
  20. Deng, J.; Newton, N.M.; Hall-Craggs, M.A. Novel technique for three-dimensional visualisation and quantification of deformable, moving soft-tissue body parts. Lancet 2000, 356, 127–131. [Google Scholar] [CrossRef]
  21. Donnelly, C.; Guizar-Sicairos, M.; Scagnoli, V. Three-dimensional magnetization structures revealed with X-ray vector nanotomography. Nature 2017, 547, 328–331. [Google Scholar] [CrossRef]
  22. He, P.; Shen, Y.; Gu, Y. 3D fracture modelling and limit state analysis of prestressed composite concrete pipes. Front. Struct. Civil. Eng. 2019, 13, 165–175. [Google Scholar] [CrossRef]
  23. Udayan, J.D.; Kim, H.S.; Kim, J.I. Animage-based approach to the reconstruction of ancient architectures by extracting and arranging 3D spatial components. Front. Inf. Technol. Electron. Eng. 2015, 16, 12–27. [Google Scholar] [CrossRef]
  24. Buxton, F.; Bernard, F. Development of an Extension of the Otsu Algorithm for Multidimensional Image Segmentation of Thin-Film Blood Slides. In Proceedings of the 2007 International Conference on Computing: Theory and Applications (ICCTA 2007), Kolkata, India, 5–7 March 2007. [Google Scholar]
  25. Ya, B.D.; Ming, F.L.; Xiao, L.Z. Faults diagnosis of rolling element bearings based on modified morphological method. Mech. Syst. Signal. Process. 2011, 25, 1276–1286. [Google Scholar]
  26. Ding, L.; Goshtasby, A. On the Canny edge detector. Pattern. Recognit. 2001, 34, 721–725. [Google Scholar] [CrossRef]
  27. Wang, J.; Song, W.; Zhao, L. Application of Improved Freeman Chain Code in Edge Tracking and Straight Line Extraction. J. Signal. Process. 2014, 30, 422–430. [Google Scholar]
  28. Liu, W.; Cheng, Y.; Sawant, A. A robust real-time surface reconstruction method on point clouds captured from a 3D surface photogrammetry system. Med. Phys. 2016, 43, 2353–2360. [Google Scholar] [CrossRef] [Green Version]
  29. Xiao, G.J.; Dong, Q.; Wang, Y.N.; Sui, Y.M.; Ning, J.J.; Liu, Z.Y.; Tian, W.J.; Liu, B.B.; Zou, G.T.; Zou, B. One-Step Solution Synthesis of Bismuth Sulfide (Bi2S3) with Various Hierarchical Architectures and Their Photoresponse Properties. RSC Adv. 2012, 2, 234–240. [Google Scholar] [CrossRef]
  30. Cipolla, R.; Robenson, D.P.; Boyer, E.G. Photobuilder-3D Models of Architectural scenes from uncalibmted Images. In Proceedings of the IEEE International Conference on Multimedia Computing and Systems, Florence, Italy, 7–11 June 1999; pp. 25–30. [Google Scholar]
Figure 1. Experimental platform of the fleece fabric visual system: (a) an overview image; (b) a schematic diagram; (c) an acquired image.
Electronics 09 01346 g001
Figure 2. Overview of the proposed method for extracting the fleece edge contour. (a) Original image; (b) Image segmentation; (c) Morphologically processed images; (d) Canny operator edge detection image; (e) Edge contour image.
Electronics 09 01346 g002
Figure 3. 3D reconstruction of fabric surface.
Electronics 09 01346 g003
Figure 4. Solving principle of fleece fabric thickness measurement.
Electronics 09 01346 g004
Figure 5. Variation of fabric thickness.
Electronics 09 01346 g005
Figure 6. Real-world fabric samples.
Electronics 09 01346 g006
Figure 7. 3D reconstruction of the upper surface of the fabric samples. (a) 3D reconstruction of the surface of sample a. (b) 3D reconstruction of the surface of sample b. (c) 3D reconstruction of the surface of sample c. (d) 3D reconstruction of the surface of sample d. (e) 3D reconstruction of the surface of sample e.
Electronics 09 01346 g007
Figure 8. Fabric thickness estimation results.
Electronics 09 01346 g008
Figure 9. Relationship between the error and the relief degree.
Electronics 09 01346 g009
Table 1. Comparison results.
Fabric SampleGq (mm)Estimated Thickness (mm)Measured Thickness (mm)Error
a0.4314.363.1028.9%
b0.2013.492.9615.2%
c0.1903.082.7610.4%
d0.2994.523.2528.1%
e0.2524.273.6115.5%

