Article

An Emotion-Aware Learning Analytics System Based on Semantic Task Automation

Intelligent Systems Group, Universidad Politécnica de Madrid, 28040 Madrid, Spain
*
Author to whom correspondence should be addressed.
Electronics 2020, 9(8), 1194; https://doi.org/10.3390/electronics9081194
Submission received: 6 July 2020 / Revised: 21 July 2020 / Accepted: 22 July 2020 / Published: 25 July 2020
(This article belongs to the Section Computer Science & Engineering)

Abstract

:
E-learning has become a critical factor in the academic environment due to the endless number of possibilities that it opens for the learning context. However, these platforms often suppose to increase the difficulties for the communication between teachers and students. Without having real contact between teachers and students, the former finds it harder to adapt their methods and content to their students, while the students also find complications for maintaining their focus. This paper aims to address this challenge with the use of emotion and engagement recognition techniques. We propose an emotion-aware e-learning platform architecture that recognizes students’ emotions and attention in order to improve their academic performance. The system integrates a semantic task automation system that allows users to easily create and configure their own automation rules to adapt the study environment. The main contributions of this paper are: (1) the design of an emotion-aware learning analytics architecture; (2) the integration of this architecture in a semantic task automation platform; and (3) the validation of the use of emotion recognition in the e-learning platform using partial least squares structural equation modeling (PLS-SEM) methodology.

1. Introduction

Nowadays, e-learning [1] is a key factor in the learning context, due to the great number of advantages and possibilities that it entails in different academic environments (i.e., distance learning, self-directed learning, or face-to-face learning) [2]. For this reason, it has inspired the research and development efforts of numerous companies and universities that seek to improve different learning methods to obtain a better academic performance [3]. However, these platforms also entail specific challenges [4]. One of these challenges is that maintaining the focus and motivation becomes difficult for certain students  [5]. In addition, these platforms also introduce a handicap in the communication between teacher and students [6]. In this kind of learning, teachers find it hard to know the students and to check whether the methods and contents are appropriate for them.
This is particularly important in recent years, where the analysis of the role that emotions play in academic environments is gaining momentum [7]. In this context, two technologies play a key role: emotion-aware systems [8] and learning analytics [9] techniques. Emotion-aware systems, based on cognitive computing [10], are capable of detecting human emotions through techniques such as image recognition or speech analysis. By using these systems, human emotions can be detected on a larger scale, with better results, and reducing human–machine interactions. Learning analytics systems are fed with data from the learning environment to conduct a comprehensive analysis using machine learning [11] techniques and algorithms. Moreover, these systems can be improved thanks to a better understanding of the relevance and relationship between the different factors that appear in the learning process. However, interoperability between different platforms and components has become a key issue in these systems [12]. The vast amount of generated data requires highly agile data models to make better decisions or any other actionable results. These models enable monitoring, processing, optimizing, and analyzing data to gain insights [13]. Semantic technologies propose a suitable approach for interoperability by sharing common vocabularies, enabling the interoperable representation of inferred data.
In order to address the above challenges and advance in the state of the art e-learning platforms, we propose an emotion-aware system with learning analytics capabilities integrated into a semantic task automation platform. The main goal is to improve the learning process by including emotion and attention recognition techniques [14]. The proposed system recognizes students’ emotions and engagement, allowing educators to take into account this information for adapting their content and methodologies. Furthermore, taking advance of the growing emergence of intelligent devices, the platform also integrates ambient intelligence technologies for adapting the environment to the students’ mood [15]. This is accomplished by means of the integration of an emotion-aware task automation platform called EWETasker, developed in a previous work [16]. This platform offers an easy way to integrate smart devices and services in an environment and use them for automating daily tasks. In this way, the design and development of an emotion aware architecture for e-learning platforms is the main contribution of this paper. In addition, a semantic task automation platform has been integrated into our system in order to provide it with mood and engagement regulation by the use of ambient intelligence techniques. Finally, the usefulness of an e-learning platform that takes into account students’ emotions and attention has been validated using partial least squares structural equation modeling (PLS-SEM) methodology [17].
The rest of this paper is organized as follows. In the first place, an overview of the related work in emotion aware e-learning systems and learning analytics is given in Section 2. Then, Section 3 describes the reference architecture of the proposed emotional aware e-learning system, describing the main components and modules as well as their implementation. Section 4 describes the case studies defined for the proposed architecture. Validation of the use of an emotion-aware e-learning system for improving academic performance is described in Section 5. Finally, the conclusions drawn from this work, along with possible future work lines, are described in Section 6.

2. Background

This section describes the background and related work for the system proposed in this paper. First, Section 2.1 describes the motivation and objectives in the study of emotions related to the learning process. Then, an overview of the most used emotion recognition tools is given in Section 2.2. Section 2.3 presents the related works in emotion aware e-learning platforms. Finally, Section 2.4 gives an overview of the state-of-the-art regarding learning analytics.

2.1. Emotion Theories Applied to Education

Over the last years, emotions in the learning process have become an important field of study by psychologists. The influence that emotions have on the way people act [18] is known. In the academic context, the connection between emotions and encouragement has been proved [19]. Understanding and managing emotions result in a key factor in improving academic results due to the close relationship between attention and performance [20]. The individual characteristics of each student produce differences in cognition, motivation, and learning styles [21], and consequently on their learning outcomes [22].
Pekrun et al. [23] proposed a model on how emotions influence students’ learning and achievement. This model studies the effect of mood on performance and how cognitive and motivational mechanisms may mediate it. They state that the influence of emotions can be mediated by several mechanisms with cumulative or contradictory effects, in order to predict overall effects on performance supposes a challenge. The study of Ranellucci et al. [24] provided empirical support for this model, evaluating the relations between achievement goals, emotions, learning strategies, and performance; and showing both direct and indirect effects of students’ goals on academic achievement through their emotions and learning strategies. This study presented the benefits of mastery-approach goals for students’ emotions and demonstrated enjoyment was beneficial for most learning strategies, while boredom predicted poorer time management, and anxiety predicted lower self-monitoring. In addition, performance-approach goals predicted less critical thinking, and performance-avoidance goals predicted more anxiety, boredom, critical thinking, and lower achievement gains.
In addition, an affective model for education was proposed by Kort et al. [14]. This model argues that a typical learning experience involves a range of positive and negative emotions. According to the authors, this range of emotions occurs naturally and is an inevitable part of the learning cycle, so it is important to help students understand and recognize this process and to propel themselves. Social emotional intelligence and competence development literature are linked in the Social Emotional Development (SED) model, proposed by Seal et al. [25]. This model includes self awareness, consideration of others, connection to others, and impacting change. Furthermore, the work aims to provide a framework to understand and facilitate increasing student social and emotional capacity to recognize emotional cues, process emotional information, and utilize emotional knowledge to adapt to social challenges in higher education. In addition, the work by Frenzel et al. [26] argue the existence of positive reciprocal links between teachers’ and students’ enjoyment, and that these links are mediated by the observations of each other’s classroom behaviors.
Following these theories, recognizing students’ emotions seems to be essential to stimulate them in a learning process. However, despite the importance of recognizing students’ emotions in e-learning platforms, there are no many real implementations of these platforms that include emotion recognition. The inclusion of this feature can multiply the benefits of distance learning and add value to the platforms in charge of providing this service. With this purpose, it is essential to know how emotion awareness can be carried out.

2.2. Emotion Recognition Tools

Feidakis [8] defines emotion awareness as the implicit or explicit collection of emotion data and the recognition of emotional patterns. This definition is carefully explained by the author distinguishing three types of emotion captures: explicit (subjective report of feelings), implicit (voice, face, and physiological signals), and with emotion patterns recognition (identification of the people emotions based on observation).
The first steps were carried out by expert psychologists who identified the emotions of the patient based on their body posture, tone of voice, or facial expression [27]. Then, self-reporting tools became widely used because of their simplicity and low cost, apart from being a non-intrusive tool [28]. However, there are also some disadvantages to be taken into account, such as lack of honesty among participants, misinterpretation of the questions, or the use of unadjusted rating scales. The traditional approach of detecting emotions through questionnaires answered by the participants does not yield very efficient methods [29]. That is the reason for focusing on automatic emotion detection using multimodal approaches (i.e., facial recognition, speech analysis, and biometric data) as the ensemble of different information sources from the same mode [30].
In recent years, improvements in the field of Artificial Intelligence [10] have enabled the same analysis of emotions using emotion recognition devices and without human intervention. They take advantage of being non-invasive and not requiring specialized equipment since most of them use common devices such as webcams or microphones. Algorithms to predict emotions based on facial expressions are mature and considered accurate. Currently, there are two main techniques to realize facial expression recognition depending on its way of extracting feature data: appearance-based features, or geometry-based features [31]. Both techniques have in common the extraction of some features from the images which are fed into a classification system. They differ mainly in the features extracted from the video images and the classification algorithm used [32]. Geometric based techniques find specific features such as the corners of the mouth or eyebrows and extract emotional data from them. Otherwise, appearance-based extraction techniques describe the texture of the face caused by expressions and extract emotional data from skin changes [33]. Emotion recognition from speech analysis is an area that is gaining momentum in recent years [34]. Speech features are divided into four main categories: continuous features (pitch, energy, formants), qualitative features (voice quality, harsh, breathy), spectral features (linear predictive codes, Mel frequency cepstral coefficients), and Teager energy operator-based features such as TEO-decomposed FM variation (TEO-FM-Var) and TEO Autocorrelation Envelope (TEO-Auto-Env) [35].
Physiological signals are another data source for recognizing people’s emotions [36]. The idea of wearables that detect the wearer’s affective state dates back to the early days of affective computing [37]. For example, skin conductance changes if the skin is sweaty, which is related to stress situations and other effects. Skin conductance is used as an indicator of arousal, to which it is correlated [38]. A low level of skin conductivity suggests a low arousal level. Heart rate is also a physiological signal connected with emotions, as its variability increases with arousal. Generally, heart rate is higher for pleasant and low arousal stimuli compared to unpleasant and high arousal stimuli [38].

2.3. Emotion Recognition in E-Learning

The tools presented above are the basis of the emotion recognition research and have been applied in the last years to create emotion-aware learning systems. Reviewing the most relevant works, the proposal of Derick et al. [39] stands out. They implemented a set of visualizations intending to allow learners to reflect their affective states and their connection with specific learning activities through self-reporting. The results they obtained were that the simplest visualizations helped the students in a better way since most of them did not know the interpretation of complex ones. Also making use of the self-report, and complementing it with data about interactions between students and teachers, Ruiz et al. [40,41] proposed a method to measure students mood based on a model of twelve emotions (six positives and six negatives). With the data obtained, a dashboard was implemented, resulting in the improvement of the academic results of almost 75% of the students.
The work of [42] opted for using a library known as Clmtrackr through a web-cam to detect emotions based on facial expression. In this way, it was possible to relate the students’ mood with the learning activity they were doing and overcoming some of the difficulties of affective communication in e-learning environments. Ez-Zaoui et al. [43] propose a multimodal and contextual approach to recognize emotions in e-learning platforms. With this purpose, four sources of information were captured and analyzed: audio, video, self-report, and students’ interactions. This analysis resulted in a dashboard designed for teachers with the correlation between activities and emotions.
Finally, the work carried out by Robal  et al. [44] tried to evaluate the performance of gaze tracking tools to detect attention losses of students in Massive Open Online Courses (MOOC). The conclusion reached was that hardware-based tools perform better than software-based ones. Despite this, the platform proposed in this work implements a software solution, known as Webgazer [45] because of the impossibility of using dedicated hardware outside the lab and its non-negligible results (an error of 175 pixels and an average visual angle of 4.17 ). The significant majority of these works have in common the use of a dashboard to show the emotions captured in the learning process [42]. These works do not only look for collecting as much as possible data about students’ emotions, but they also pretend to show the data in an effective way to be used by teachers and students to improve their results.

2.4. Learning Analytics

The growing interest in applying machine learning techniques in different fields, coupled with the emergence of numerous data capture techniques, has resulted in a growing trend to use both to improve virtually any area of society. Within this trend appears the concept of learning analytics, which can be defined as “the use of intelligent data, learner-produced data, and analysis models to discover information and social connections, and to predict and advise on learning” [9]. This definition takes on an even higher dimension if the environment of an e-learning platform is considered, in which students’ interactions are captured simply and on a large scale.
In the approach proposed by [46], the learning analytics process is defined in three steps. The first one is to collect the most relevant data from the educational environment and pre-process it to clean, anonymize, and transform data into a format suitable for later use. The second step is based on applying different data analysis techniques must be applied in order to find a solution to improve the learning process. Once a solution appears, it is needed to take action to achieve the goals proposed. Finally, the third step, named post-processing, consists of evaluating the entire process. This evaluation can result in obtaining new data that had not been taken into account, pre-processing better oriented to the final objective, defining new attributes and metrics, modifying analysis variables, or choosing different prediction and analysis methods. As mentioned, learning analytics is a research field with growing interest today, which is reflected in the amount of research that seeks to improve the academic outcomes of students participating in experiments. Beginning with the work of [47], this research aimed to combat dropout in the first year of college. With this purpose, a system was developed with the capabilities of making predictions about students’ academic future based on academic and demographic information. The results showed that students that had been advised about their trends obtained better grades and a lower dropout rate than their peers in the same semester.
Pardos et al. [48] analyzed the relationship between affective state and student behavior. With this aim, measurements about student’s work context, actions, utterances, facial expressions, body language, and interactions with teachers or fellow students were taken. Once it was made, a machine learning model was implemented, whose results demonstrated that it is possible to predict students’ final grades based on their behavior and course performance. Lastly, the work of [49] tried to apply learning analytics in order to improve the learning process when students work in teams. They proposed a system capable of monitoring and evaluating teamwork competencies through data about e-learning platform forums, cloud storage platform interactions and files, and wiki tools. The results showed a strong relationship between active interactions, such as writing a message in the course forum, and academic performance. According to this, teachers thought that, using this system, they were in a better position to evaluate each student’s teamwork.

2.5. Semantic Task Automation

A recent shift in ambient intelligence is to move from the model of full and transparent automation to smart collaboration since autonomous often leave users feeling out of control [50]. A popular approach to interconnect and personalize both IoT and Internet services is the use of Event-Condition-Action (ECA) rules, also known as trigger-action rules. A number of now prominent web sites, mobile, and desktop applications feature this rule-based task automation model, such as If-this-then-that (IFTTT) [51]. These systems, called Task Automation Service (TAS) [52], are typically web platforms or smartphone applications that provide an intuitive visual programming environment where inexperienced users seamlessly create and manage their automations.
In this context, we developed EWE Tasker [53], a semantic task automation platform which aims to board rule capabilities and address two of the major drawbacks of these systems: (1) the only incoming data streams available are those the platform is prepared for; and, (2) the lack of a mechanism to use and reason over large scale data outside their platform such as the Linked Open Data (LOD) cloud or context data [54].
EWE Tasker is based on the Evented WEb (EWE) ontology [52], a standardized data schema designed to model the most significant aspects of Task Automation Services. EWE provides a common model to define and describe task automation services, representing its rules and enabling rule interoperability. In addition, it provides a base vocabulary in order to build domain-specific vocabularies. Four major classes make up the core of EWE: Channel, Event, Action, and Rule. The class Channel defines individuals that either generate Events, provide Actions, or both (such as an emotion recognition sensor or a smart light). The class Event defines a particular occurrence of a process and allows users to describe under which conditions should rules be triggered. The recognition of sadness generated by the emotion detector sensor is an example of an entity that belongs to this class. The class Action defines an operation provided by a Channel that is triggered under some conditions (i.e., to change the light color). Finally, the class Rule defines an ECA rule, triggered by an Event that produces the execution of an Action. An example of a rule is: “If sadness is detected, then change the light color.”.
Users in the EWE Tasker platform are able to create and configure their own automation rules in an easy way by means of a mobile phone application or a web interface. The platform integrates several external devices and services (such as Gmail or Spotify) and can be adapted to different smart environments in an easy way benefiting from the advantages of semantic technologies.

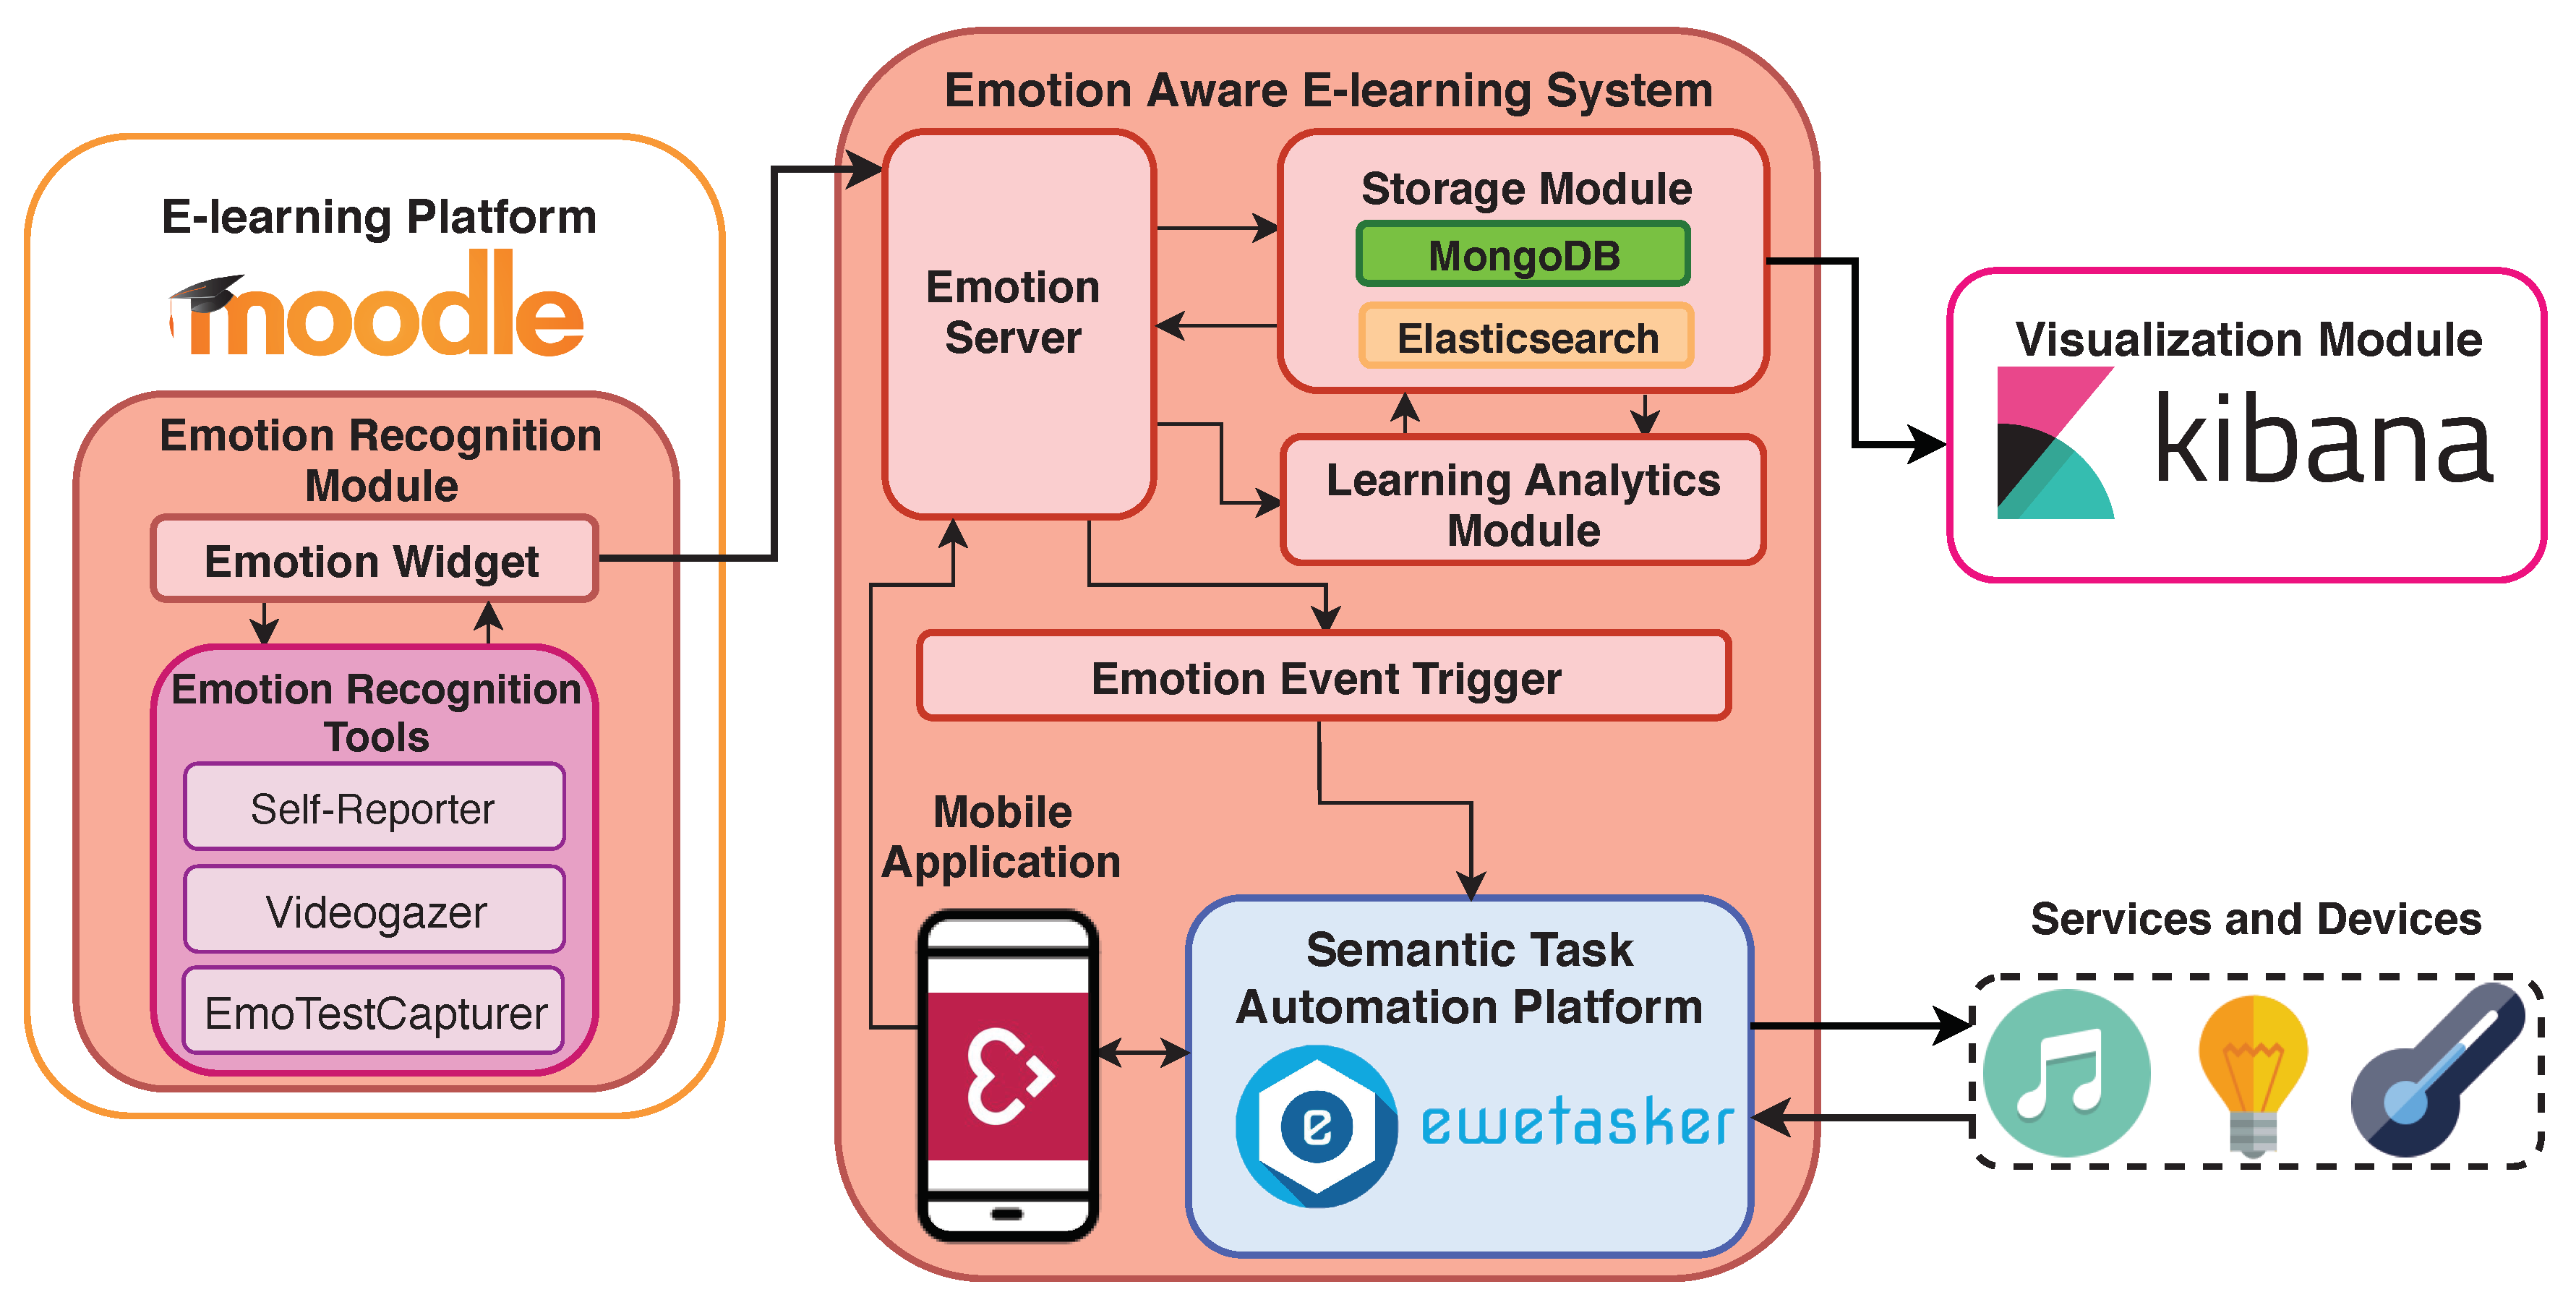
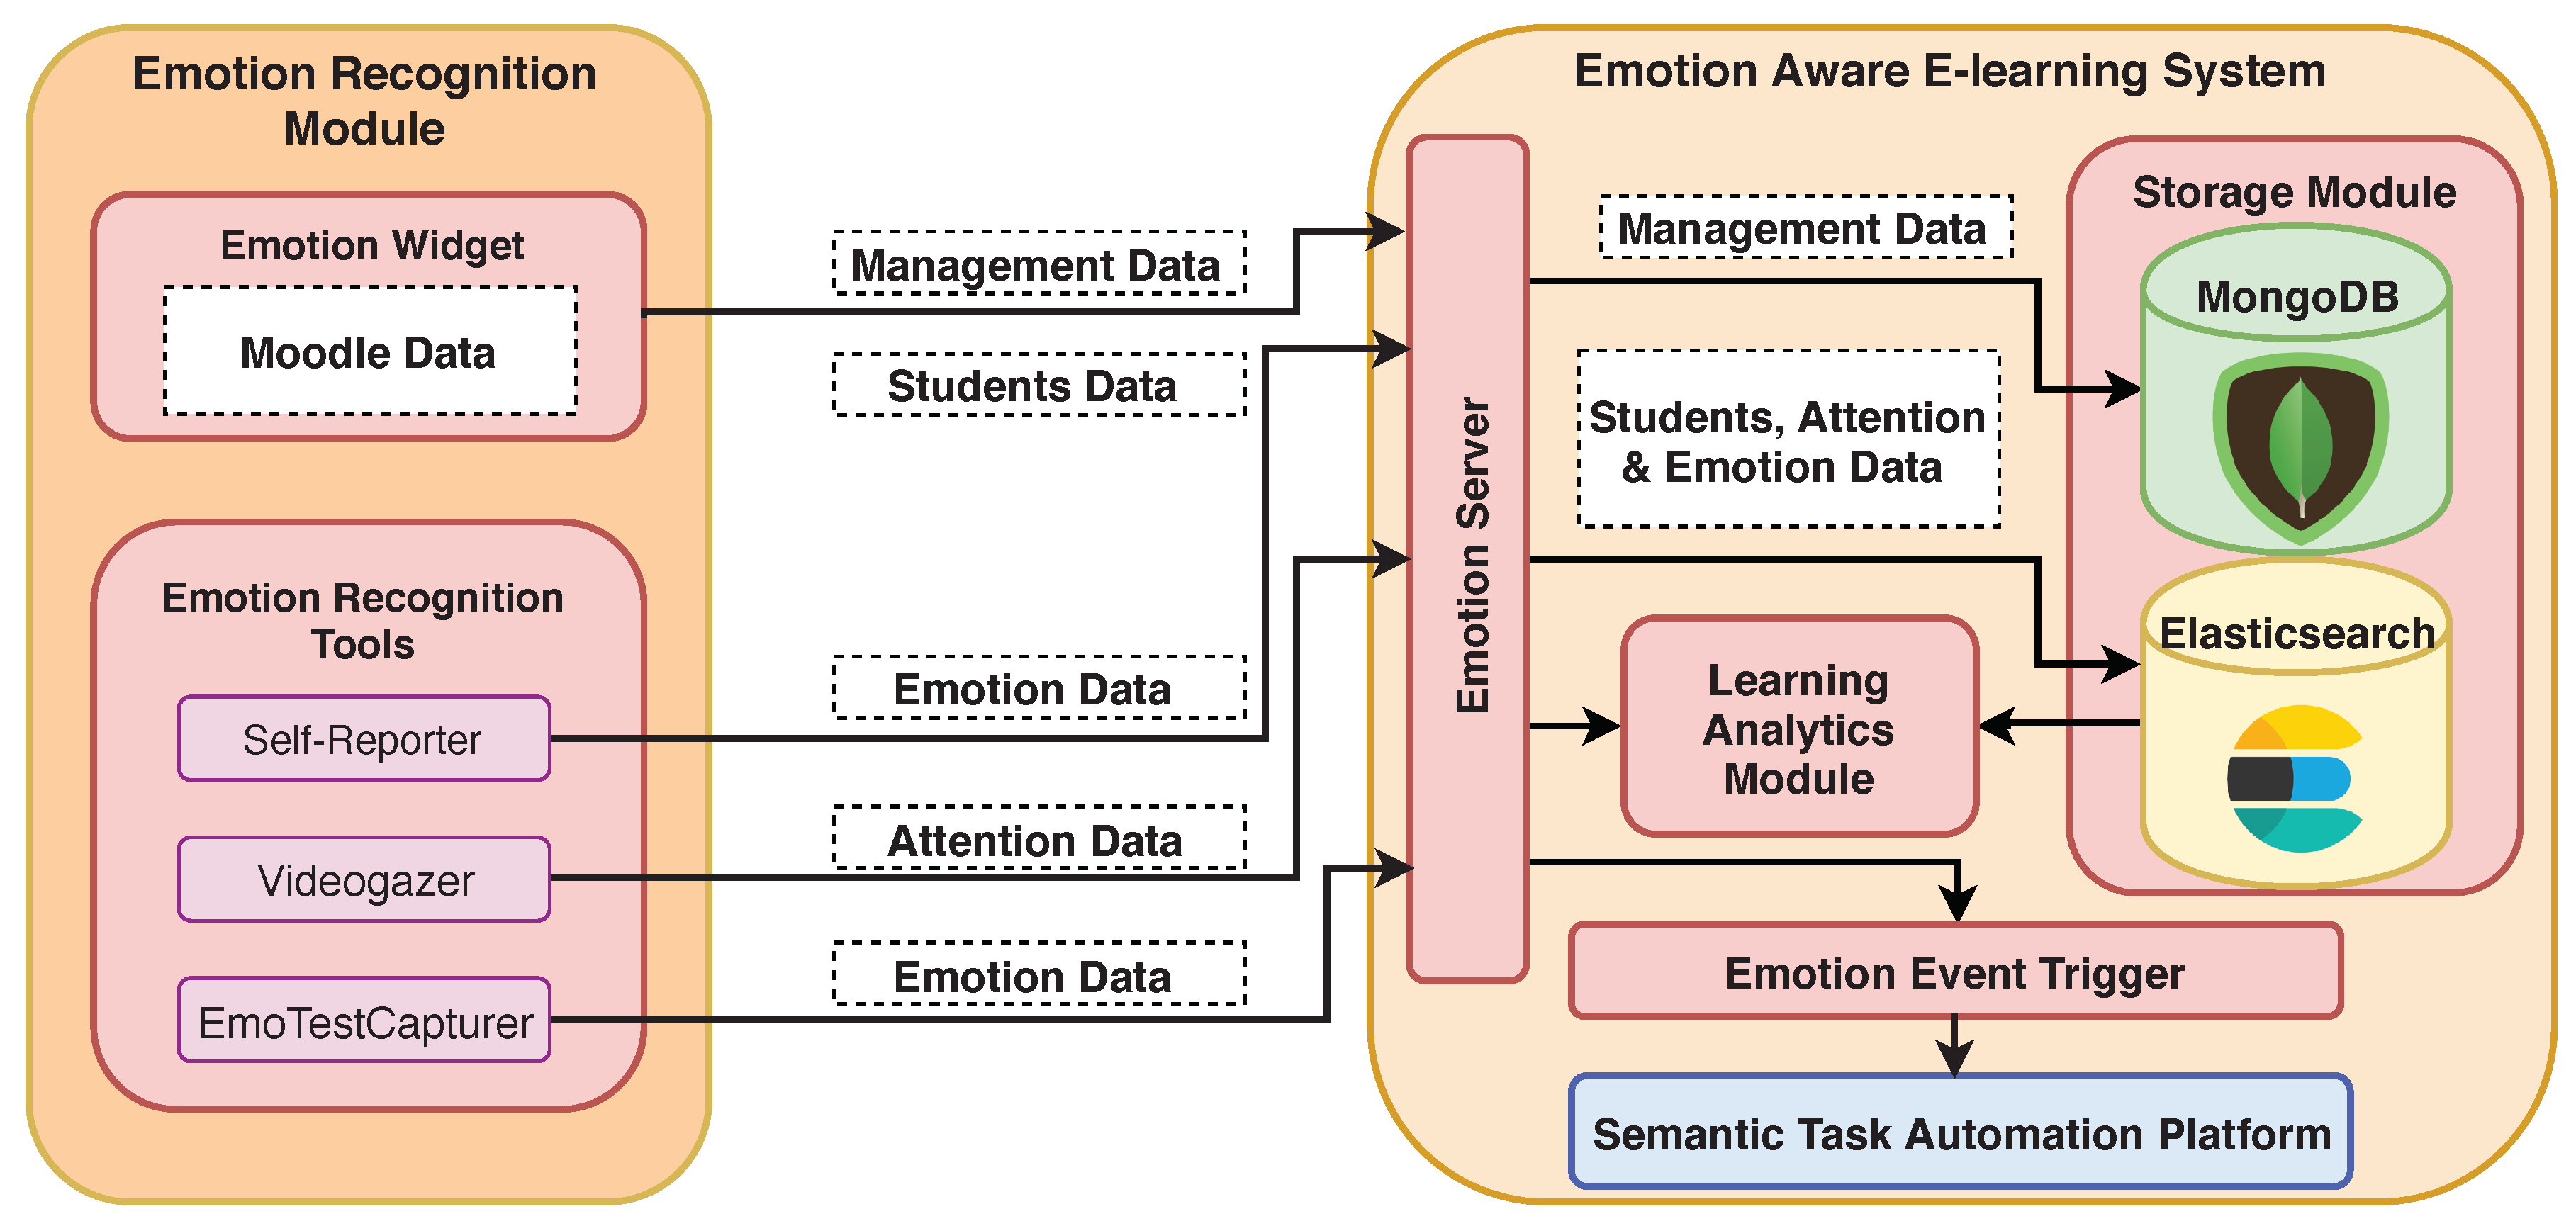
3. Emotion-Aware E-Learning Platform Architecture

Once the state of the art is analyzed, we present the proposed architecture along with the implementation details. We aim to build a system that enables the personalization of the learning experience based on students’ emotions. With this purpose, and taking into account some e-learning literature [55,56,57], we have identified the following requirements to fulfill by the architecture: (1) to be integrable into the chosen e-learning platform; (2) to recognize and store the students’ emotions; (3) to be able to convert data into valuable information for users; and (4) to enable automatic adaptation of the student environment. The proposed architecture matching these requirements is shown in Figure 1.
The platform architecture is composed of two main components: emotion-aware e-learning module and emotion recognition module. The former is the core of the platform, and it provides the system with the capability of collect, store, process, analyze, and visualize all the data regarded to the system. In addition, it integrates a semantic task automation platform. On the other hand, the emotion recognition module dotes the system with emotion and engagement detection. This module is integrated into an e-learning platform.

3.1. Emotion Recognition Component

The Emotion Recognition component is responsible for collecting data from the e-learning platform. It consists of different views developed as web components that must be integrated into the original e-learning platform. For the proposed architecture, we have used Moodle as the e-learning platform. Moodle allows us to create online courses quickly and easily, thanks to its friendly web interface. In addition, its use is widespread in the academic world, so it is not a barrier for teachers or students, giving relevance to our case study. Moodle also allows us to integrate the emotion recognition component easily.
This component is composed of two modules: emotion widget and emotion recognition tools. The former is responsible for sending all the captured data in the platform to the emotion-aware e-learning component, while the latter is responsible for collecting data regarding students’ emotion and engagement. Three emotion recognition tools have been integrated into this component: self-reporter, videogazer, and emotestcapturer.
The self-report tool implements a form in which students can record the emotions they are experiencing each day of the course, as well as the level of intensity of these emotions. Students can fill the report everyday indicating how they feel by means of selecting an emotion and its intensity. These data allow us to perform constant monitoring of students’ moods throughout the course using real metrics that have their origin in the subject itself. In addition, these data allow us to get a correlation with measurements obtained from other sub-modules, and with the academic results achieved in each phase of the course. The videogazer tool, based on WebGazer library [45], allows us to detect students’ attention in video lessons. Thanks to this tool, it is possible to determine whether the user is paying attention to the lesson or not based on his/her looking position. In this way, it is possible to relate the different phases of the video lesson with the attention and interest produced by each of them. Finally, the emotestcapturer implements a tool that allows us to capture students’ emotions when they are solving a test. This tool is empowered by the Clmtracker library [58], which is able to detect the emotion of users through the position of the coordinates that draw their faces. All the data collected by these tools are sent to the emotion-aware e-learning component, where it will be processed.

3.2. Emotion-Aware E-Learning Component
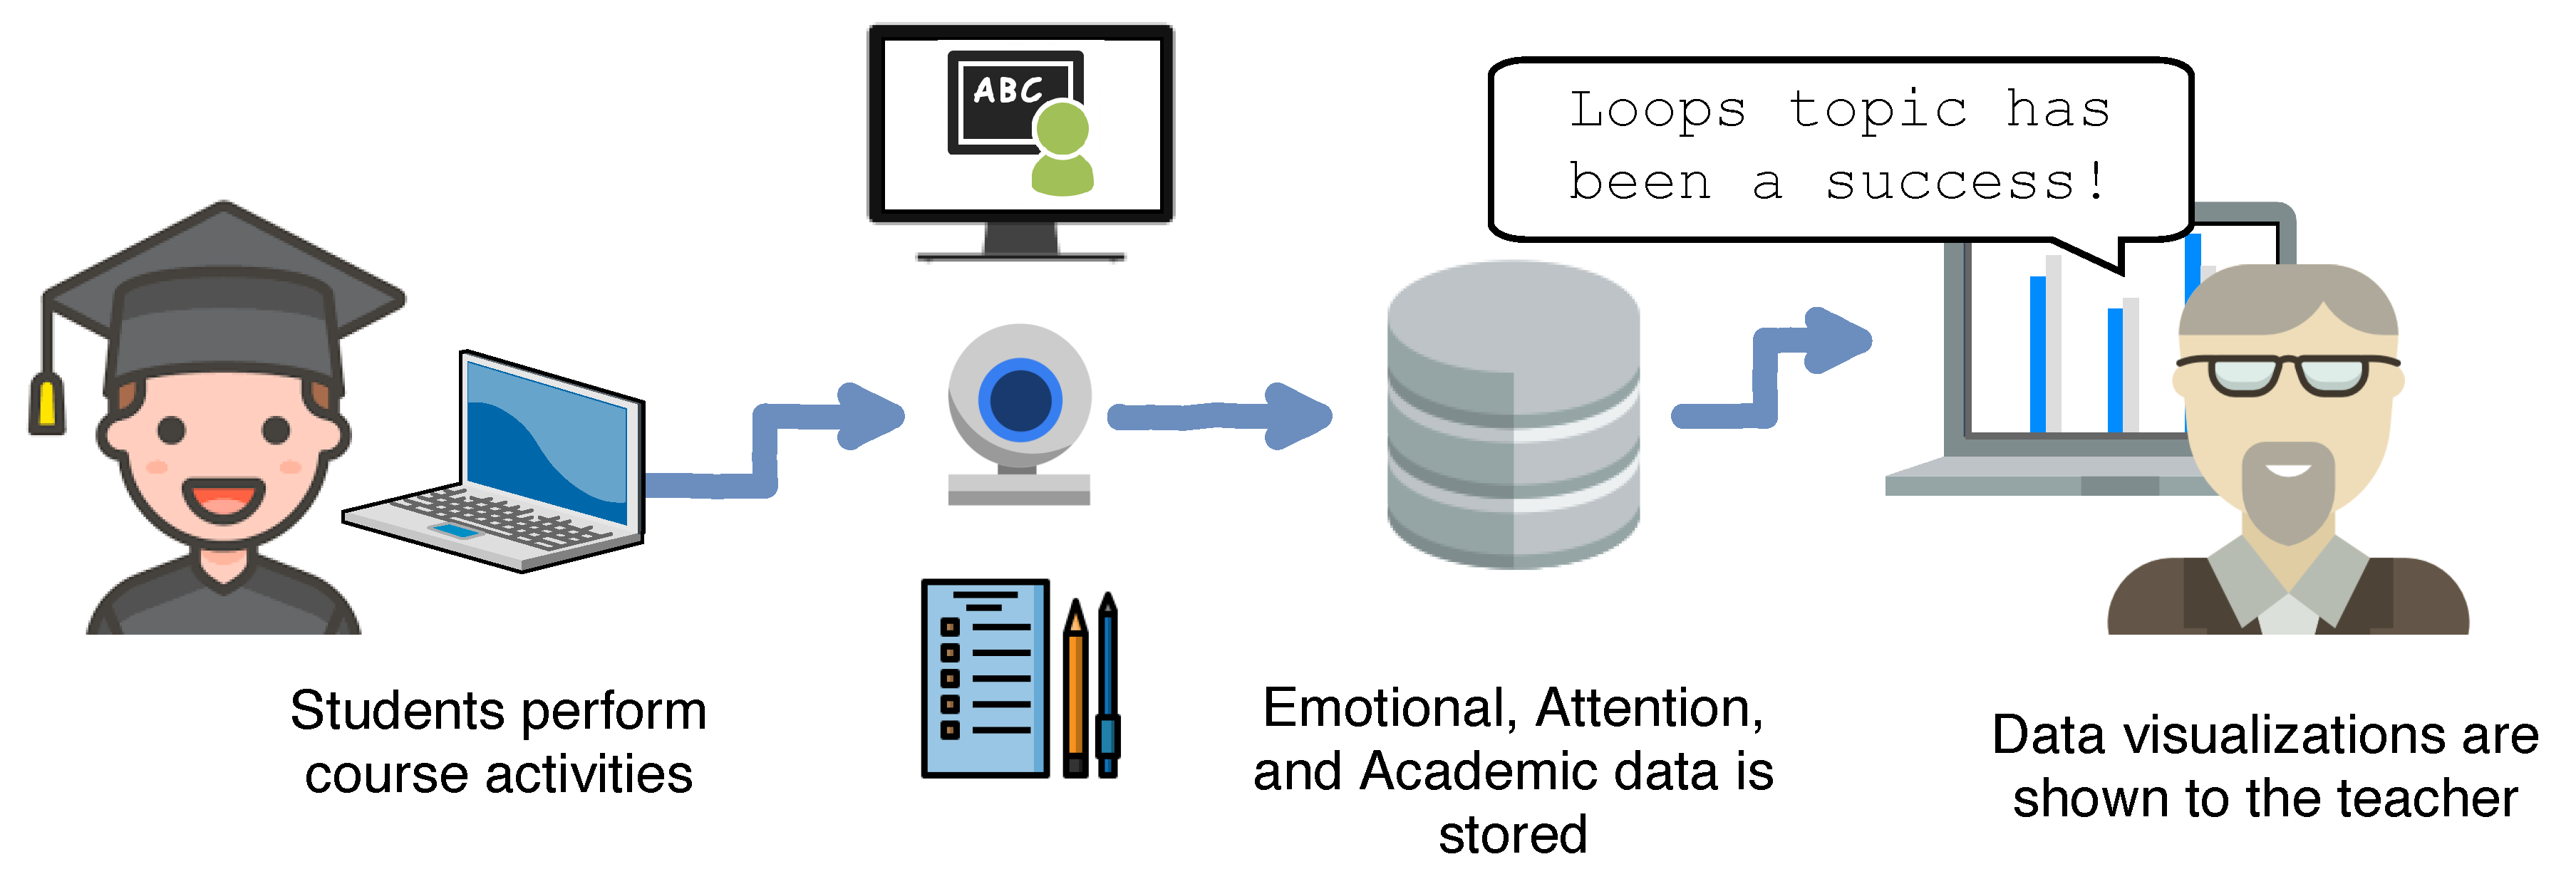
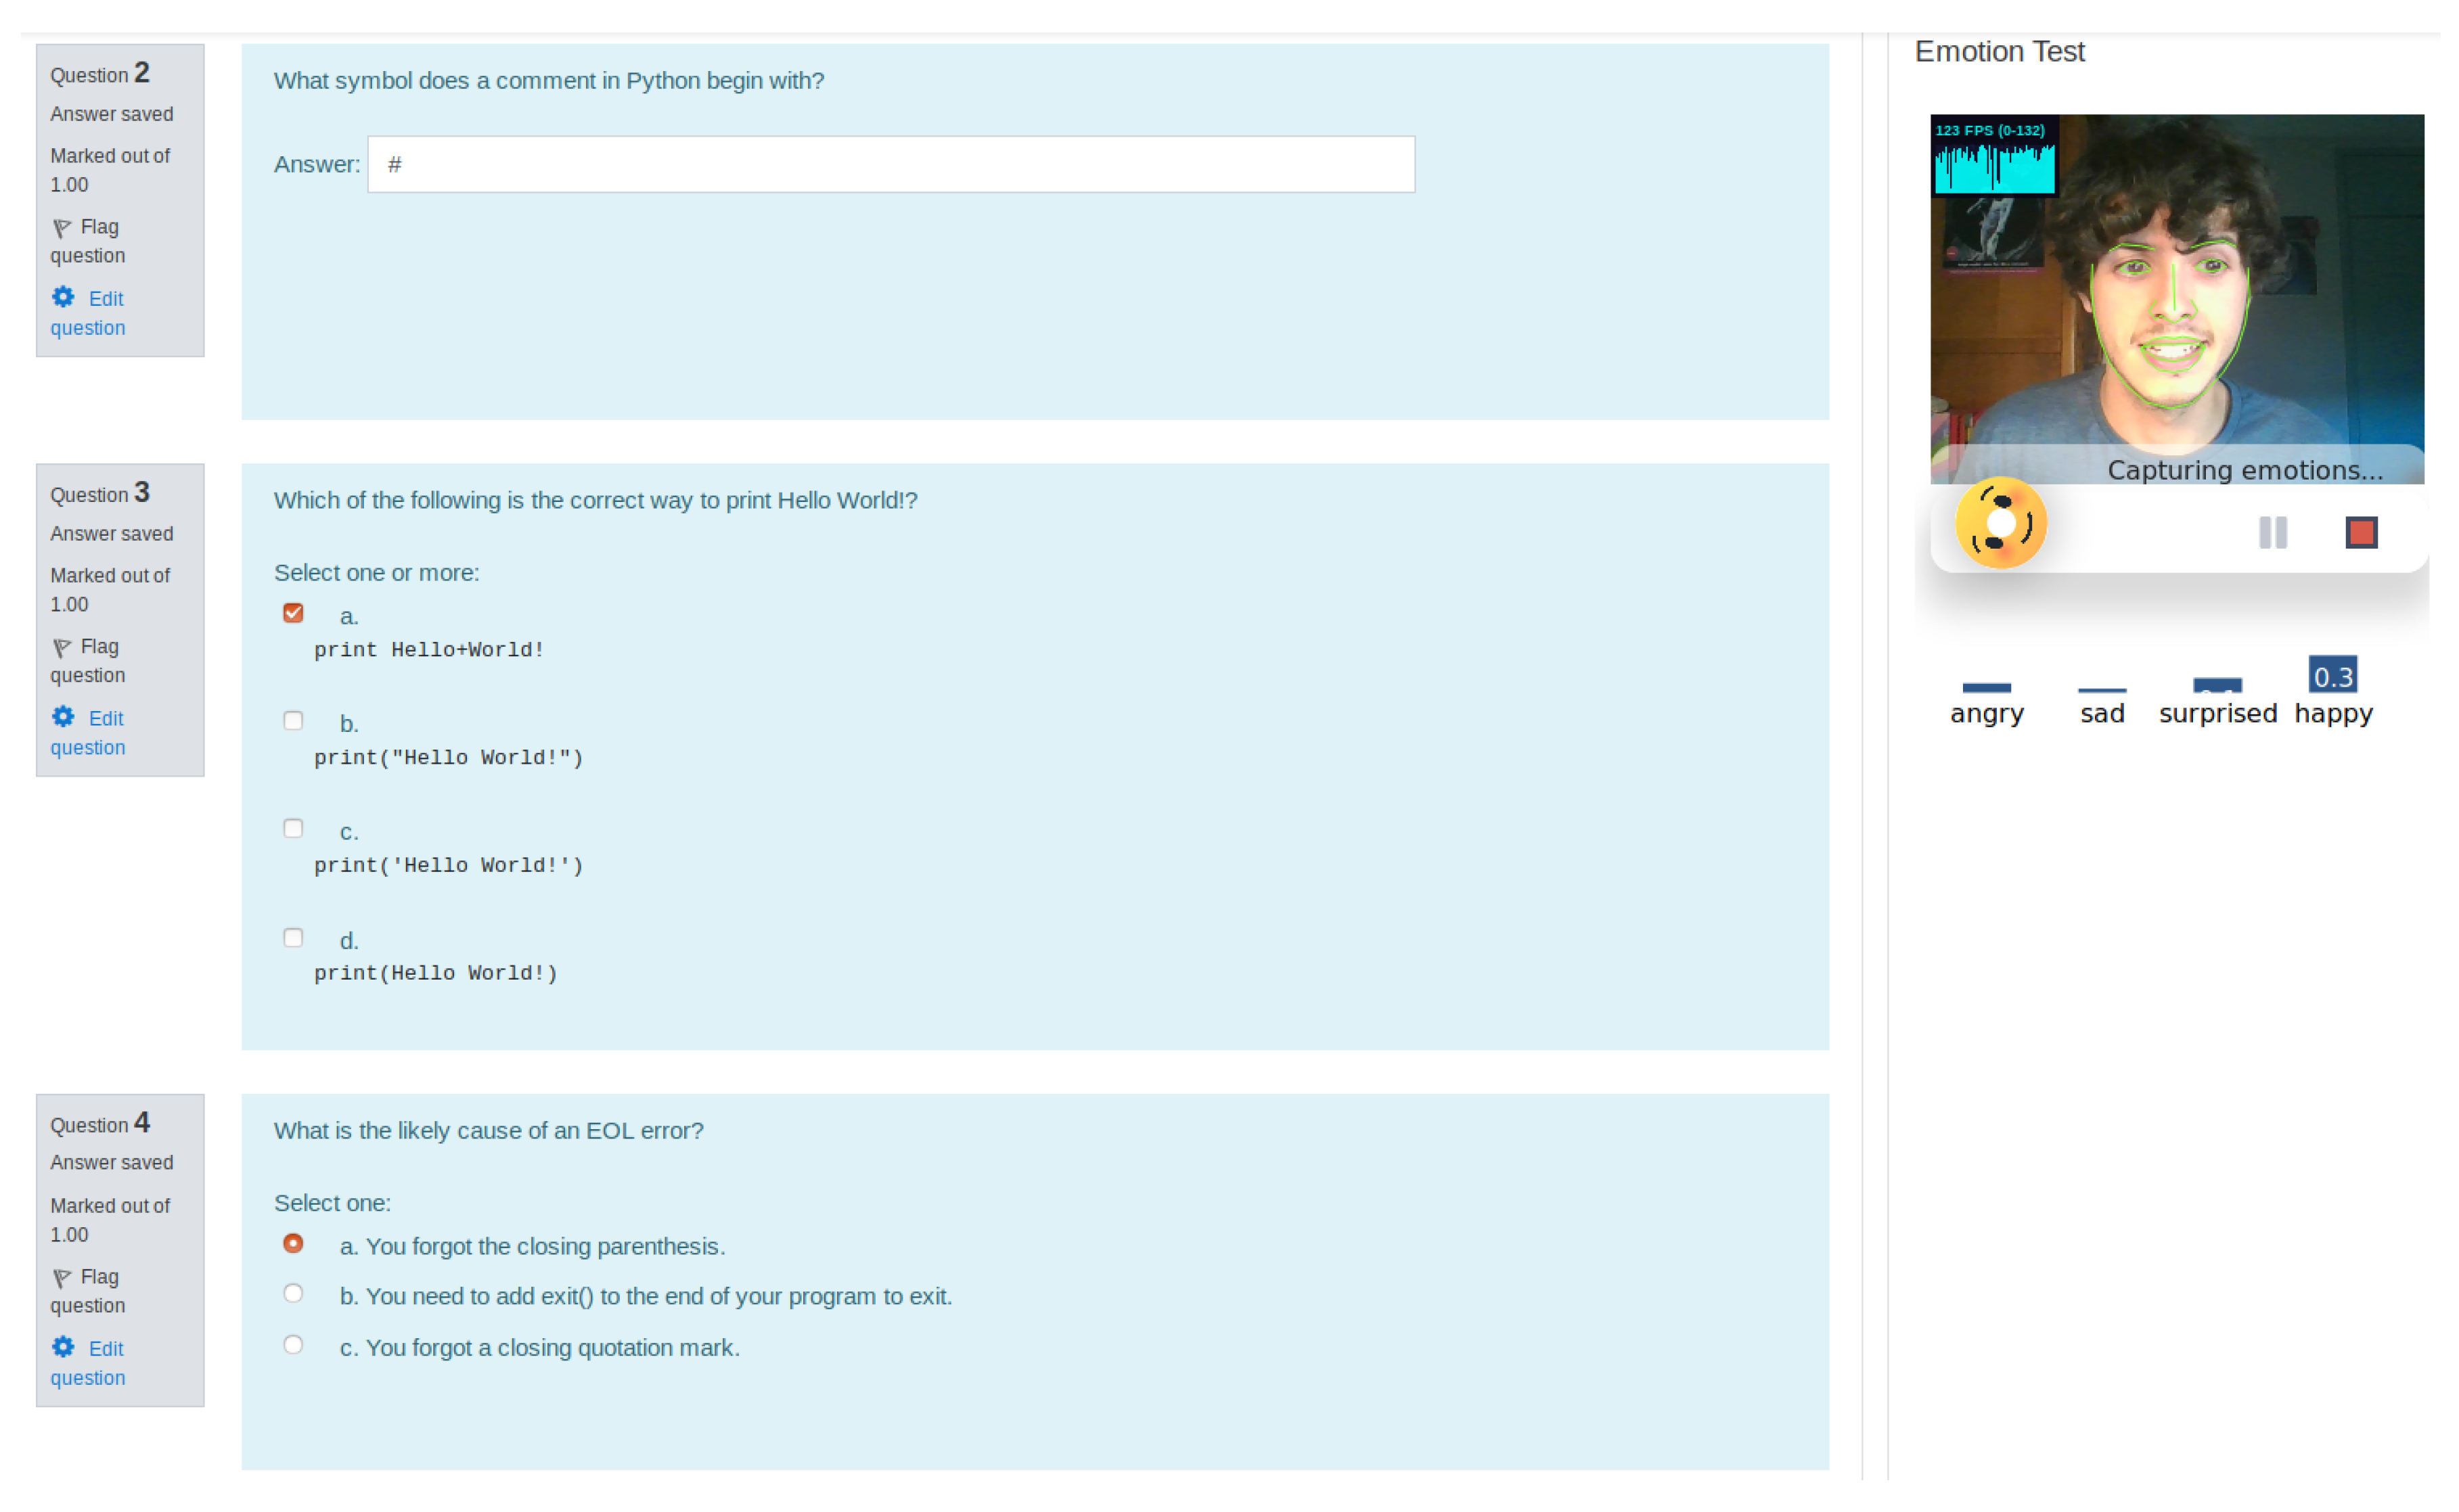
The Emotion Aware E-learning component’s main functions are collecting, storing, processing, analyzing, and visualizing the data obtained from the emotion recognition component. In addition, the module is able to adapt the smart environment according to automation rules, thanks to the integration of a task automation platform. An overview of the data interchange carried out by this module is seen in Figure 2. The data are received by the emotion server submodule.
This submodule consists of a web service that receives and handles requests from the emotion recognition module. It receives information regarding management or students, and pass this information to the corresponding submodule of the system depending on its nature. This information is stored by the storage submodule and sent to the learning analytics submodule and the emotion event trigger. The storage submodule consists of two repositories that store the system logic data and the users’ related data. One repository, consisting of a MongoDB database [59], is used for storing personal user information (age, sex, etc.) and academic information (courses, lessons, etc.). The other repository, based on the distributed analytics and search engine Elasticsearch [60], is used to store the emotion and attention-related information. This data contains all the information about the students’ mood, personal information, and grades.
In order to visualize these data, the Elasticsearch based repository connects with the visualization module, based on the dashboard-based visualization tool Kibana [61]. The data must be shown in an accessible and easy to understand way, without the need for previous knowledge by the users. To make this possible, Kibana has been selected as an implementation tool for these visualizations. Kibana provides a web-based environment, on which we can implement our visualizations. We have used different chart types for defining several visualizations. These visualizations, which can be seen in Section 4, are grouped into three different dashboards: two for teachers and one for students. The visualizations designed for these dashboards are average self-report emotions per time (area); average grades, maximum and minimum grades per topic (table); the number of students enrolled (gauge); success rate (goal); grade levels (heatmap); average attention per video, grade average per topic, average emotions per test (bar); emotion evolution per minute in a test, average attention per second, average self-report emotions per time (line); the number of students per gender, and the number of students per grade (pie) and student country (region).
Other than analyzing data by means of the visualization, the system also provides a way to perform data analysis using machine learning techniques. The learning analytics submodule has this goal and allows the users to draw on conclusions that cannot be obtained through ordinary study and visualization techniques. This submodule performs an exploratory analysis of the data using K-Means and finding correlations between features, enabling the detection of anomalous cases, trends, and correlations in the students’ data.
Finally, to perform automatic adaption of the students’ smart environment, a semantic task automation platform has been integrated. The integrated automation platform is EWE Tasker, developed in a previous work [16]. This platform offers an easy way to integrate smart devices and services in an environment and use them for automating daily tasks. These integrations stem from devices as smart lights, sensors, and smartphones to services as Gmail or Twitter. Users in the platform are able to create and configure their own automation rules, and integrate new devices and services thanks to its semantic core, based on the EWE ontology [52]. In order to import the received data into the platform, the emotion event trigger submodule applies over it a semantic layer. Listing 1 shows an example of emotion detected event, along with its corresponding parameters and the generator channel, modeled according to work in Muñoz et al. [62]. The event has been generated by the detection of “sadness” with an average intensity of 84%. The example is written using Notation3, a shorthand non-XML serialization of Resource Description Framework (RDF) models designed with human-readability in mind [63].
The task automation platform processes these events and performs the corresponding actions on the environment, according to the automation rules predefined by the users. The platform is linked to different services and devices, enabling the adaption of the environment to students’ emotion or engagement. In addition, it includes a smartphone app that can connect with different devices in order to open new possibilities. Some of the developed possibilities are stress detection from Empatica E4 wristband [64] and indoor geolocation using Estimote iBeacons [65]. The integration of the automation platform enables the automatic improvement of students’ mood and comfort by adapting their environment.
Listing 1. Semantic representation of emotion detected event written in Notation3.
Electronics 09 01194 i001

4. Case Study

In order to better understand the usefulness of the proposed system, we have defined three case studies: Academic and Emotional Dashboards for teachers, Emotional Dashboard for students, and Smart Automation for students and teachers. The context in which these case studies take place is an online programming course. This course, entitled “Basic Python for Beginners” [66] is available on the Moodle.net. The course offers a set of video lessons and topic-based questionnaires.
These case studies are described in the following, explaining how they allow us to test the main features of the system: emotion and engagement recognition; data analysis, collection, and visualization; and smart automation.

4.1. Academic and Emotional Dashboards for Teachers

This case study is meant to remove communication barriers between teachers and students in distance learning environments. An overview of this use case is given in Figure 3.
The student’s goal is to complete the lessons that compound the course. With this purpose, the student will carry out three types of activities: theory study, video lessons, and questionnaires. Meanwhile, student’s engagement, stress, and mood will be monitored. In addition, self-reported emotions’ questionnaires will be performed during the course. While the student is doing the video lessons, his/her attention is being measured. This enables us to capture the student engagement related to the topic and to the current video time. In addition, the student can perform a test, answering a series of questions related to the studied topic. While the user performs the test, emotions and stress level experienced are captured, as can be seen in Figure 4.
The collected data will be shown to the teacher in a dashboard, enabling a better understanding of the student’s learning experience. This allows the teacher to perform adaptations in methodology, content, or activities in order to improve the student mood, and, consequently, his academic results.
Figure 5 shows an example of the charts enabled to the teacher in the dashboard. These charts show the statistics obtained from students’ during the different activities of the course. This information stems from grades to emotional data and associated with each topic. In this way, teachers can analyze how each emotion and engagement affects the learning outcomes obtained. In this example, the chart shows the students’ average engagement, allowing the teacher to analyze the average of attention that the students have paid to the video lesson of a specific topic. It can be seen how the attention in the first seconds of the video is high, while as time goes by, it varies until it drops sharply at the end.
Through these visualizations, the teacher can better understand the characteristics of the group of students who are participating in the course. This allows him to adapt the contents to the type of students who have greater difficulties, taking into account a great variety of factors such as emotion, attention, age, or nationality. In this way, the communication barriers of an e-learning environment are overcome.

4.2. Emotional Dashboard for Students

This case study is based on the previous one but also includes an emotional dashboard for students. This dashboard allows students to perform an introspection exercise, in which they can learn how emotions affect their performance, and,  consequently, look for solutions to make the most of the course. An overview of this study case is presented in Figure 6.
The Student’s Emotional Dashboard is designed to show the evolution of the students’ emotional state in a clean and straightforward way. In addition, the visualizations include the grades obtained during the course. Figure 7 shows some of the developed visualizations.
Particularly, Figure 7a shows the evolution in the emotions that the student has experienced while performing tests. The color code, used in this visualization and in others in which emotions appear, is inspired by Borth et al. [67]. In this example, it can be seen how the most reported emotion is happiness. It can also be seen how surprise is a frequently reported emotion and how negative emotions have small values in comparison.
On the other side, Figure 7b shows how the feelings expressed by the student have evolved during the different lessons of the course. In this example, we can see that sadness is the emotion that the student experiences with higher intensity, followed by anger.

4.3. Smart Automation for Students and Teachers

The last case study has as a main goal to improve the comfort and mood of students while they are studying, through the use of smart devices and task automation. For this purpose, three different scenarios have been designed, as shown in Figure 8. These scenarios are mood regulation, attention improvement, and report generation.
The mood regulation scenario aims to adapt the environment to the emotions experienced by a student through the use of smart devices located in his/her workplace. Students can create and configure their own mood regulation rules using the task automation platform. In this way, the environment of the student can automatically change according to his/her emotions, with the purpose of enhancing positive feelings. The automation rules can involve several devices or services, such as smart lights or speakers. In this way, while the student is studying, the work environment will adapt to his/her mood, improving his/her comfort and, consequently, his/her performance. An example of a rule to achieve this automation is: If a student is sad, then play happy music.
Another possible automation is attention improvement. This case study aims to improve students’ attention when they are studying the course contents through the e-learning platform. As in the mood regulation scenario, automation rules will be created and configured by the students. In this scenario, the system will detect if the attention paid to the slides is under a certain threshold. When this happens, an action will be done by the system for warning the student and improving his/her attention. These actions can go from showing notifications on the phone to light or sound signals, depending on the student’s preferences. Through these automations, the student can improve his concentration, optimizing the study time, and obtaining better academic results. A rule example for attention improvement is: If the student’s attention falls, then show a notification.
Finally, the report generation scenario has the goal of facilitating the exploratory analysis of the course data presented in the previous section. This data analysis, when we are faced with a large amount of data, becomes a process that can take from the order of minutes to hours. Waiting until the end of this process can discourage teachers from using these analysis techniques, leaving them in disuse or undervalued. For this reason, and taking advantage of the capabilities of the automation platform, the teachers can configure rules for being warned about the completion of the analysis. In this way, when the system detects an analysis task has finished, the teacher can be notified using his preferred method configured in the automation rule (email, mobile notification, etc.), and can also obtain the generated report. A possible rule following this scenario is: If a new analysis has been performed, then send an email to the teacher.
These automations are carried out through the definition of semantic rules from the automation platform. Listing 2 shows the semantic definition of a sample mood regulation rule, with its corresponding event, action, and parameters. In this case, the rule is: If a student is sad, then play happy music, composed by the event of sadness detection and the action of playing a happy song. The song to play and the emotion detected are the parameters of the rule.
In this section, we have presented the case studies designed to improve the mood of students participating in an online course through the study of their emotions. The proposed platform achieves this goal by the integration of several visualization dashboards, analysis techniques, and smart automation. To this end, firstly, the use of visualization tools has been proposed to broaden the knowledge of both teachers and students about the interactions that occur during the course activities. These interactions include data pertaining to emotions, attention, and course grades.
Listing 2. Rule instances.
Electronics 09 01194 i002

5. Validation

As presented before, the main experimental contribution of this work was the design and implementation of an emotion-aware Learning Analytics system for e-learning platforms, based on Machine Learning techniques, and integrated with a semantic task automation platform. With the purpose of knowing the scope of this research, a set of hypotheses was raised:
Hypothesis 1 (H1).
To be aware of his/her emotions improves user satisfaction.
Hypothesis 2 (H2).
The system quality of an e-learning platform directly affects user satisfaction.
Hypothesis 3 (H3).
To be aware of their emotions helps students to obtain better academic results.
Hypothesis 4 (H4).
The system quality of an e-learning platform is a key factor for academic results.
To evaluate the proposed system, it was tested in an experiment that was carried out in the scope of a Python’s course in Moodle platform [68] with real users. In this experiment, the entire system was deployed, including the emotion recognition tools, the visualization, and analysis modules and the smart automation system. The following sections cover the participants, materials, design results, and conclusions drawn from the experiment, focusing on its objective.

5.1. Participants

The experiment was conducted among 30 students from a technical university, including both genders. The ages of the participants ranged from 20 to 25. Their selection was motivated by the characteristics of the course in which the experiment was set, a Python programming course for beginners. The participants’ knowledge of programming was extensive, while their knowledge of Python language depended on each case.
The ethical approval for the experiment was obtained by the Ethics Committee of the Technical University of Madrid, and the study was carried out in accordance with the ethical guidelines [69]. Participants were aware of the nature of the experiment, and gave informed consent prior to participation in the study. All subjects could abort the experiment at any time.

5.2. Materials

The material needed to carry out this experiment includes a wide variety of devices, sensors, and computer equipment, detailed below:
  • Camera (Gucee HD92) that feeds the video to the emotion recognizer submodule.
  • Room lighting (WS2812B LED strip controlled by WeMos ESP8266 board) is used as an actuator on the light level of the room, with the possibility of using several lighting patterns.
  • Google Chromecast [70] that transmits content in a local network.
  • LG TV 49UJ651V. This device is used for displaying images.
  • Google Home. The system uses this device to play music.
Participants accessed the web HTML-based interface using a desktop computer with the Firefox browser [71].

5.3. Methodology

During the experiment, each participant performed a lesson in an online programming course. This course, entitled “Basic Python for Beginners” [66], is available on the Moodle.net. This course has been chosen mainly because it adapts easily to the case studies that we defined in Section 4.
While participants were doing the course, the e-learning system is fed with the information provided by the different sensors that are continually monitoring the participant emotional and attention states. While the student is doing the course, different adaption rules are triggered depending on his/her emotion and attention, such as changing light color or playing music. In addition, the student can visualize his/her emotions utilizing the developed dashboard. The experiment finishes when the lesson is finished. In addition, a questionnaire is given to the participants just after the sessions conclude. These questions use five-point Likert scales and are oriented to offer the participant’s view of the system. The questions raised are summarized in Table 1.

5.4. Results

We tested our research hypotheses using partial least squares structural equation modeling [17], with SmartPLS 3.2.9 [72]. This software allows us to easily check the psychometric properties of the measurement and structural model. It enables the analysis of the reliability and validity, and estimate the strength of the relationships among different model variables simultaneously.
PLS-SEM is suitable for small samples, obtaining good results with a sample size at least 10 times the largest number of structural paths directed at a particular construct in the structural model [73]. Figure 9 shows an overview of our model, according to the proposed hypotheses. As in our model, the maximum number of paths is two, and our minimum sample size should be 20, so we consider PLS-SEM an appropriate method according to our sample.
The measurement model was assessed using the following criteria: First, we will check the indicator reliability, verifying that outer loading for the indicators is greater than 0.70 [74]. Secondly, we will use Cronbach’s alpha ( α ) and Composite Reliability (CR) for proving internal consistency reliability. The cut-off value is to be greater 0.70 for both tests [75]. Finally, we will check for convergent and discriminant validity. The former one with the average variance extracted (AVE), which should be greater than 0.50 [76]. The later, discriminant validity, will be checked: using Fornell–Larcker criterion [76]; Cross-loadings [75]; and the Heterotrait–Monotrait ratio (HTMT) [77].
For the test of individual item reliability, we examined the outer loadings. This gives us the loading of the measures on the constructs they intend to measure. According to the work of [74], we deleted all indicators with a threshold lower than 0.40 and retained those which were higher than 0.70. For those whose value was between the two thresholds, we retained the indicators which did not decrease the value of AVE and CR. As a result, eight indicators were eliminated, resulting in the indicators shown in Table 2. Next, we retrieved CR, Cronbach’s alpha, and AVE in order to check for internal consistency and convergent validity. In Table 2, we can see how all the values meet the minimum threshold for internal consistency. The composite reliability for all scales was between 0.76 and 0.93, greater than the minimum required value of 0.70. In addition, the average variance extracted AVE employed to assess the convergent validity was greater than 0.50 for all constructs. Third, we evaluate discriminant validity using the correlation matrix for the Fornell–Larcker method, whose results are presented in Table 4. Discriminant validity indicates the extent to which a given construct differs from other latent constructs [78]. The table shows that the diagonal values are larger than the other values inside the one column, which is the expected behavior according to the AVE.
The cross-loadings formed the second method utilized to assess discriminant validity. Table 3 shows the values of these loadings for each indicator. The results show that each indicator all the items correlated more strongly with their latent variable than with any other variables in the model [79]. Finally, we check for discriminant validity problems using the HTMT criterion, proposed by [77]. HTMT is equal to the average Heterotrait–Heteromethod correlation relative to the average Monotrait–Heteromethod correlations. The Heterotrait–Heteromethod correlations are correlations of indicators across constructs measuring different phenomena, while the Monotrait–Heteromethod correlations are correlations of indicators measuring the same construct. Table 4 shows that all the HTMT values are within the accepted threshold values (less than 0.90).
Thus, our measurement model verifies all three conditions suggested by prior research, providing strong support for its reliability. Having confirmed that the measurement model is reliable and valid, we next evaluated the structural model results. For the structural model, we have followed the following criteria, proposed by [74]:
  • Assess the structural model for collinearity issues (VIF < 5).
  • Assess the significance and relevance of the structural model relationships (t > 1.65).
  • Assess the level of R2 (The cut-off levels are: 0.190 weak; 0.333 moderate; and 0.6702 substantial).
  • Assess the level of Q (cut-off point larger than zero).
  • Assess the model’s fit.
Thus, first, we check collinearity symptoms, to ensure that the results are valid. We do this by analyzing the variance inflation factor (VIF). A VIF greater than 5.00 would indicate overly high collinearity, and, consequently, a potential collinearity problem. The retrieved VIF values are all between 1.17 and 3.98, so they always meet the accepted threshold values (VIF < 5). Thus, we can affirm that collinearity was not a problem in our data.
Then, we proceed to evaluate the significance of each path coefficient. Path coefficients ( β ) representation relationships between the constructs in the model. These relationships are shown in Figure 9. The significance of each path coefficient, the standard errors, and the t-values were calculated by the algorithm of bootstrapping in PLS, with 5000 samples. From the analysis, we obtain that the emotional information contributes to improve user satisfaction ( β = 0.771 , p = 0 ) and benefits ( β = 0.23 , p = 0.04 ), supporting H1 and H3. In addition, we also observe that the system quality also improves user satisfaction and benefits, supporting H2 ( β = 0.142 , p = 0.03 ) and H4 ( β = 0.63 , p = 0 ).
We then assessed our model performance using the explanatory power ( R 2 ) and predictive relevance ( Q 2 ). Table 5 shows the results obtained with SmartPLS for each endogenous variable. The predictive relevance was obtained using Blindfolding in SmartPLS, with an omission distance D being 7. The values of R 2 , according to the cut-off points of 0.67, 0.33, and 0.19 for substantial, moderate, and weak levels, respectively [80], gives us a moderate level for emotion information quality, and a substantial level for system quality. According to Hair et al. [73], Q 2 measures the capability of the path model to predict the endogenous measuring items indirectly from the prediction of their latent variables using the related structural relations. The cut-off point is to be larger than 0, so, as can be seen in Table 5, the model has strong predictive relevance for the endogenous constructs.
As an additional indicator, we used the global goodness-of-fit (GoF) criterion proposed by [81] to assess the model fit. GoF is defined as “how well the specified model reproduces the observed covariance matrix among the indicator items” [74], so it allows us to evaluate the overall performance of the model in both measurement and structural levels. The GoF index is ranged between 0 and 1, and is calculated using the following formula:
G o F = ( R 2 ¯ · Q 2 ¯ ) = ( 0 . 612 · 0 . 352 ) = 0.46
There is no inference based criteria to assess the statistical significance of the GoF index, due to its descriptive nature [82]. However, Wetzels et al. [83] propose several baselines in order to validate the PLS models globally. These baselines are, according to different effect sizes of R 2 : G o F s m a l l ( 0 . 10 ) , G o F m e d i u m ( 0 . 25 ) , and G o F l a r g e ( 0 . 36 ) . The obtained value of 0.46, higher than the cut-off of 0.36 proposed by Wetzels et al. [83] for large effect sizes of R 2 indicates a good overall fit, and adequately validates the complex PLS model globally.
These results also validate the structural model, confirming the proposed hypotheses and validating that the use of an emotion-aware e-learning platform improves students’ satisfaction and helps to improve their academic performance.

5.5. Teacher Validation

Finally, in order to validate the usefulness of the system for teachers, it has been tested by five professors at the Technical University of Madrid. Participants were asked to try the system, and then answer a set of questions for evaluating the usefulness of the system.
These questions use five-point Likert scales and are oriented to offer the participant’s view of the system. The questions raised, along with the mean values obtained, are summarized in Table 6. As shown in the table, the system results in being quite useful for the professors, achieving high scores for all the questions. However, the score for the Q4 is a little lower compared with the others, which suggests that an effort must be still done in improving communication between the teacher and the students.

6. Conclusions and Future Work

This paper proposes an architecture for an emotion aware e-learning platform based on semantic technologies, which enables the emotion analysis in study places and the automated adaption of these study places to the students’ needs. The proposed architecture allows teachers to study these analyses in order to adapt the methodology to this information, with the purpose of improving students’ mood and consequently help them to achieve better academic performance. In this way, our platform advances in decreasing communication barriers between teachers and students in distance learning environments; while it also provides the students with mood regulation capabilities. In addition, the application of a semantic layer enables data interoperability and portability of components. Finally, the system has been implemented and evaluated using PLS-SEM methodology.
Through the experimentation, we have verified a set of hypotheses. In summary: (1) using the proposed emotion-aware e-learning system helps students to obtain better academic results; (2) the system quality of an e-learning platform directly affects user satisfaction; (3) using the proposed emotion-aware e-learning system improves user satisfaction; and, finally, (4) the system quality of an e-learning platform is a critical factor for academic results. These results encourage the use and improvement of this kind of e-learning systems, as they seem to provide users with several advantages, such as analysis of their mood and attention or adaption of their smart environment to this mood.
As future work, many lines can be followed to continue this work. One of these lines is to deep in the context of emotion and mood regulation. The integration of more sophisticated ways for smart environment adaption to emotions could be a key improvement for these systems. Currently, we are working on this line exploring new ways of emotion regulation. In addition, another line of future work would be the enhancement of the learning analytics side of the system, studying new methods, and improving the current analysis in order to offer new relevant data. Furthermore, we also plan to integrate new ways of emotion recognition in the system by means of the analysis of text interactions in students. This adds more reliability to the system as it incorporates a mature way of recognizing emotions. In addition, it would be relevant to implement the system in a real college course, in order to study and evaluate its benefits in a real scenario. In addition, in this line, the implementation of the system in companies which provide courses for employees’ training would open new opportunities to the validation and improvement of the system. Finally, it would be also interesting to deeply evaluate the benefits of the system for the teachers, analyzing if the information about the students’ provided by the system entails a saving in terms of effort and time costs to the adaptation of the material and courses to students, and if this adaptation provides better results.

Author Contributions

Conceptualization, S.M., E.S., and C.A.I.; Data curation, S.M. and E.S.; Funding acquisition, C.A.I.; Investigation, S.M.; Methodology, S.M.; Software, S.M. and E.S.; Supervision, C.A.I.; Validation, S.M.; Visualization, E.S.; Writing—original draft, S.M. and E.S.; Writing—review and editing, C.A.I. All authors have read and agreed to the published version of the manuscript.

Funding

This work is supported by the Spanish Ministry of Economy and Competitiveness under the R&D project SEMOLA (TEC2015-68284-R).

Conflicts of Interest

The authors declare no conflict of interest. The funders had no role in the design of the study; in the collection, analyses, or interpretation of data; in the writing of the manuscript, or in the decision to publish the results.

References

  1. Moore, J.L.; Dickson-Deane, C.; Galyen, K. e-Learning, online learning, and distance learning environments: Are they the same? Internet High. Educ. 2011, 14, 129–135. [Google Scholar] [CrossRef]
  2. Arkorful, V.; Abaidoo, N. The role of e-learning, advantages and disadvantages of its adoption in higher education. Int. J. Instr. Technol. Distance Learn. 2015, 12, 29–42. [Google Scholar]
  3. Garrison, D.R. E-Learning in the 21st Century: A Community of Inquiry Framework for Research and Practice; Routledge: London, UK, 2016. [Google Scholar]
  4. Welle-Strand, A.; Thune, T. E-learning policies, practices and challenges in two Norwegian organizations. Eval. Program Plan. 2003, 26, 185–192. [Google Scholar] [CrossRef]
  5. Andersson, A.; Grönlund, Å. A conceptual framework for e-learning in developing countries: A critical review of research challenges. Electron. J. Inf. Syst. Dev. Ctries. 2009, 38, 1–16. [Google Scholar] [CrossRef]
  6. Cantoni, V.; Cellario, M.; Porta, M. Perspectives and challenges in e-learning: Towards natural interaction paradigms. J. Vis. Lang. Comput. 2004, 15, 333–345. [Google Scholar] [CrossRef]
  7. Mayer, R.E. Searching for the role of emotions in e-learning. Learn. Instr. 2019, 101213. [Google Scholar] [CrossRef]
  8. Feidakis, M. A review of emotion-aware systems for e-learning in virtual environments. In Formative Assessment, Learning Data Analytics and Gamification; Elsevier: Amsterdam, The Netherlands, 2016; pp. 217–242. [Google Scholar]
  9. Siemens, G. Learning analytics: Envisioning a research discipline and a domain of practice. In Proceedings of the 2nd International Conference on Learning Analytics and Knowledge, Vancouver, BC, Canada, 29 April–2 May 2012; ACM: New York, NY, USA, 2012; pp. 4–8. [Google Scholar]
  10. Kelly III, J.E.; Hamm, S. Smart Machines: IBM’s Watson and the Era of Cognitive Computing; Columbia University Press: New York, NY, USA, 2013. [Google Scholar]
  11. Witten, I.H.; Frank, E. Data mining: Practical machine learning tools and techniques with Java implementations. ACM Sigmod Rec. 2002, 31, 76–77. [Google Scholar] [CrossRef]
  12. Bermudez-Edo, M.; Elsaleh, T.; Barnaghi, P.; Taylor, K. IoT-Lite: A lightweight semantic model for the Internet of Things. In Proceedings of the 2016 International IEEE Conferences on Ubiquitous Intelligence & Computing, Advanced and Trusted Computing, Scalable Computing and Communications, Cloud and Big Data Computing, Internet of People, and Smart World Congress (UIC/ATC/ScalCom/CBDCom/IoP/SmartWorld), Toulouse, France, 18–21 July 2016; pp. 90–97. [Google Scholar]
  13. Palavalli, A.; Karri, D.; Pasupuleti, S. Semantic internet of things. In Proceedings of the 2016 IEEE Tenth International Conference on Semantic Computing (ICSC), Laguna Hills, CA, USA, 4–6 February 2016; pp. 91–95. [Google Scholar]
  14. Kort, B.; Reilly, R.; Picard, R.W. An affective model of interplay between emotions and learning: Reengineering educational pedagogy-building a learning companion. In Proceedings of the IEEE International Conference on Advanced Learning Technologies, Madison, WI, USA, 6–8 August 2001; pp. 43–46. [Google Scholar]
  15. Cook, D.J.; Augusto, J.C.; Jakkula, V.R. Ambient intelligence: Technologies, applications, and opportunities. Pervasive Mob. Comput. 2009, 5, 277–298. [Google Scholar] [CrossRef] [Green Version]
  16. Muñoz, S.; Llamas, A.F.; Coronado, M.; Iglesias, C.A. Smart Office Automation Based on Semantic Event-Driven Rules. In Proceedings of the Intelligent Environments (Workshops), London, UK, 12–16 September 2016; pp. 33–42. [Google Scholar]
  17. Claes, F.; Cha, J. Partial least squares. Adv. Methods Mark. Res. 1994, 6446, 52–78. [Google Scholar]
  18. Sylwester, R. How emotions affect learning. Educ. Leadersh. 1994, 52, 60–65. [Google Scholar]
  19. Pintrich, P.R. A motivational science perspective on the role of student motivation in learning and teaching contexts. J. Educ. Psychol. 2003, 95, 667–686. [Google Scholar] [CrossRef] [Green Version]
  20. Värlander, S. The role of students’ emotions in formal feedback situations. Teach. High. Educ. 2008, 13, 145–156. [Google Scholar] [CrossRef]
  21. Cano, F. Consonance and dissonance in students’ learning experience. Learn. Instr. 2005, 15, 201–223. [Google Scholar] [CrossRef]
  22. de la Fuente Arias, J.; Justicia, F.J. The DEDEPRO [TM] Model for Regulating Teaching and Learning: Recent Advances. Electron. J. Res. Educ. Psychol. 2007, 5, 535–564. [Google Scholar]
  23. Pekrun, R. The impact of emotions on learning and achievement: Towards a theory of cognitive/motivational mediators. Appl. Psychol. 1992, 41, 359–376. [Google Scholar] [CrossRef]
  24. Ranellucci, J.; Hall, N.C.; Goetz, T. Achievement goals, emotions, learning, and performance: A process model. Motiv. Sci. 2015, 1, 98. [Google Scholar] [CrossRef] [Green Version]
  25. Seal, C.R.; Naumann, S.E.; Scott, A.N.; Royce-Davis, J. Social emotional development: A new model of student learning in higher education. Res. High. Educ. J. 2011, 10, 114–115. [Google Scholar]
  26. Frenzel, A.C.; Becker-Kurz, B.; Pekrun, R.; Goetz, T.; Lüdtke, O. Emotion transmission in the classroom revisited: A reciprocal effects model of teacher and student enjoyment. J. Educ. Psychol. 2018, 110, 628–639. [Google Scholar] [CrossRef]
  27. Shan, C.; Gong, S.; McOwan, P.W. Beyond Facial Expressions: Learning Human Emotion from Body Gestures. In Proceedings of the BMVC, Warwick, UK, 10–13 September 2007; pp. 1–10. [Google Scholar]
  28. Wiedemann, G.; Rayki, O.; Feinstein, E.; Hahlweg, K. The Family Questionnaire: Development and validation of a new self-report scale for assessing expressed emotion. Psychiatry Res. 2002, 109, 265–279. [Google Scholar] [CrossRef]
  29. Matlovic, T.; Gaspar, P.; Moro, R.; Simko, J.; Bielikova, M. Emotions detection using facial expressions recognition and EEG. In Proceedings of the 2016 11th International Workshop on Semantic and Social Media Adaptation and Personalization (SMAP), Thessaloniki, Greece, 20–21 October 2016; pp. 18–23. [Google Scholar]
  30. Araque, O.; Corcuera-Platas, I.; Sánchez-Rada, J.F.; Iglesias, C.A. Enhancing deep learning sentiment analysis with ensemble techniques in social applications. Expert Syst. Appl. 2017, 77, 236–246. [Google Scholar] [CrossRef]
  31. Pantic, M.; Bartlett, M. Machine Analysis of Facial Expressions. In Face Recognition; I-Tech Education and Publishing: Seattle, WA, USA, 2007; pp. 377–416. [Google Scholar]
  32. Sebe, N.; Cohen, I.; Gevers, T.; Huang, T.S. Multimodal approaches for emotion recognition: A survey. Proc. SPIE 2005, 5670, 5670-1–5670-12. [Google Scholar]
  33. Mehta, D.; Siddiqui, M.F.H.; Javaid, A.Y. Facial Emotion Recognition: A Survey and Real-World User Experiences in Mixed Reality. Sensors 2018, 18, 416. [Google Scholar] [CrossRef] [Green Version]
  34. Anagnostopoulos, C.N.; Iliou, T.; Giannoukos, I. Features and Classifiers for Emotion Recognition from Speech: A Survey from 2000 to 2011. Artif. Intell. Rev. 2015, 43, 155–177. [Google Scholar] [CrossRef]
  35. Ayadi, M.E.; Kamel, M.S.; Karray, F. Survey on speech emotion recognition: Features, classification schemes, and databases. Pattern Recognit. 2011, 44, 572–587. [Google Scholar] [CrossRef]
  36. Vinola, C.; Vimaladevi, K. A Survey on Human Emotion Recognition Approaches, Databases and Applications. ELCVIA Electron. Lett. Comput. Vis. Image Anal. 2015, 14, 24–44. [Google Scholar] [CrossRef] [Green Version]
  37. Picard, R.W.; Healey, J. Affective wearables. Pers. Technol. 1997, 1, 231–240. [Google Scholar] [CrossRef]
  38. Brouwer, A.M.; van Wouwe, N.; Mühl, C.; van Erp, J.; Toet, A. Perceiving blocks of emotional pictures and sounds: Effects on physiological variables. Front. Hum. Neurosci. 2013, 7, 295. [Google Scholar] [CrossRef] [Green Version]
  39. Derick, L.; Sedrakyan, G.; Munoz-Merino, P.J.; Delgado Kloos, C.; Verbert, K. Evaluating emotion visualizations using AffectVis, an affect-aware dashboard for students. J. Res. Innov. Teach. Learn. 2017, 10, 107–125. [Google Scholar] [CrossRef] [Green Version]
  40. Ruiz, S.; Charleer, S.; Urretavizcaya, M.; Klerkx, J.; Fernández-Castro, I.; Duval, E. Supporting learning by considering emotions: Tracking and visualization a case study. In Proceedings of the Sixth International Conference on Learning Analytics & Knowledge, Edinburgh, UK, 25–29 April 2016; ACM: New York, NY, USA, 2016; pp. 254–263. [Google Scholar]
  41. Ruiz, S.; Urretavizcaya, M.; Fernández-Castro, I.; López-Gil, J.M. Visualizing Students’ Performance in the Classroom: Towards Effective F2F Interaction Modelling. In Design for Teaching and Learning in a Networked World; Springer: Berlin/Heidelberg, Germany, 2015; pp. 630–633. [Google Scholar]
  42. GhasemAghaei, R.; Arya, A.; Biddle, R. A dashboard for affective e-learning: Data visualization for monitoring online learner emotions. In EdMedia+ Innovate Learning; Association for the Advancement of Computing in Education (AACE): Waynesville, NC, USA, 2016; pp. 1536–1543. [Google Scholar]
  43. Ez-Zaouia, M.; Lavoué, E. EMODA: A tutor oriented multimodal and contextual emotional dashboard. In Proceedings of the Seventh International Learning Analytics & Knowledge Conference, Vancouver, BC, Canada, 13–17 March 2017; ACM: New York, NY, USA, 2017; pp. 429–438. [Google Scholar]
  44. Robal, T.; Zhao, Y.; Lofi, C.; Hauff, C. Webcam-based Attention Tracking in Online Learning: A Feasibility Study. In Proceedings of the 23rd International Conference on Intelligent User Interfaces, Tokyo, Japan, 7–11 March 2018; ACM: New York, NY, USA, 2018; pp. 189–197. [Google Scholar]
  45. Papoutsaki, A.; Sangkloy, P.; Laskey, J.; Daskalova, N.; Huang, J.; Hays, J. WebGazer: Scalable Webcam Eye Tracking Using User Interactions. In Proceedings of the 25th International Joint Conference on Artificial Intelligence (IJCAI), New York, NY, USA, 9–15 July 2016; pp. 3839–3845. [Google Scholar]
  46. Chatti, M.A.; Dyckhoff, A.L.; Schroeder, U.; Thüs, H. A reference model for learning analytics. Int. J. Technol. Enhanc. Learn. 2013, 4, 318–331. [Google Scholar] [CrossRef]
  47. Arnold, K.E.; Pistilli, M.D. Course signals at Purdue: Using learning analytics to increase student success. In Proceedings of the 2nd International Conference on Learning Analytics and Knowledge, Vancouver, BC, Canada, 29 April–2 May 2012; ACM: New York, NY, USA, 2012; pp. 267–270. [Google Scholar]
  48. Pardos, Z.A.; Baker, R.S.; San Pedro, M.O.; Gowda, S.M.; Gowda, S.M. Affective States and State Tests: Investigating How Affect and Engagement during the School Year Predict End-of-Year Learning Outcomes. J. Learn. Anal. 2014, 1, 107–128. [Google Scholar] [CrossRef] [Green Version]
  49. Fidalgo-Blanco, Á.; Sein-Echaluce, M.L.; García-Peñalvo, F.J.; Conde, M.Á. Using Learning Analytics to improve teamwork assessment. Comput. Hum. Behav. 2015, 47, 149–156. [Google Scholar] [CrossRef]
  50. Mennicken, S.; Vermeulen, J.; Huang, E.M. From today’s augmented houses to tomorrow’s smart homes: New directions for home automation research. In Proceedings of the 2014 ACM International Joint Conference on Pervasive and Ubiquitous Computing, Seattle, WA, USA, 13–17 September 2014; pp. 105–115. [Google Scholar]
  51. Ovadia, S. Automate the internet with “if this then that” (IFTTT). Behav. Soc. Sci. Libr. 2014, 33, 208–211. [Google Scholar] [CrossRef]
  52. Coronado, M.; Iglesias, C.A.; Serrano, E. Modelling rules for automating the Evented WEb by semantic technologies. Expert Syst. Appl. 2015, 42, 7979–7990. [Google Scholar] [CrossRef]
  53. Muñoz López, S.; Fernández, A.; Coronado, M.; Iglesias, C.A. Smart Office Automation based on Semantic Event-Driven Rules. In Proceedings of Workshop on Smart Offices and Other Workplaces, Colocated with 12th International Conference on Intelligent Environments (IE&039;16); Ambient Intelligence and Smart Environments; IOS Press: Amsterdam, The Netherlands, 2016; Volume 21, pp. 33–42. [Google Scholar]
  54. Coronado, M.; Iglesias, C.A. Task automation services: Automation for the masses. IEEE Internet Comput. 2016, 20, 52–58. [Google Scholar] [CrossRef]
  55. Horton, W. E-Learning by Design; John Wiley & Sons: Hoboken, NJ, USA, 2011. [Google Scholar]
  56. Bentley, T.; Johnston, L.; von Baggo, K. Putting some emotion into requirements engineering. In Proceedings of the 7th Australian Workshop on Requirements Engineering, Melbourne, Australia, 2–3 December 2002; pp. 227–244. [Google Scholar]
  57. Keller, J.; Suzuki, K. Learner motivation and e-learning design: A multinationally validated process. J. Educ. Media 2004, 29, 229–239. [Google Scholar] [CrossRef]
  58. Øygard, A.M. CmlTrcker, Javascript library for Precise Tracking of Facial Features via Constrained Local Models. Available online: https://github.com/auduno/clmtrackr (accessed on 14 April 2020).
  59. Banker, K. MongoDB in Action; Manning Publications Co.: Shelter Island, NY, USA, 2011. [Google Scholar]
  60. Dixit, B.; Kuc, R.; Rogozinski, M.; Chhajed, S. Elasticsearch: A Complete Guide; Packt Publishing Ltd.: Birmingham, UK, 2017. [Google Scholar]
  61. Srivastava, A. Kibana 7 Quick Start Guide: Visualize Your Elasticsearch Data with Ease; Packt Publishing Ltd.: Birmingham, UK, 2019. [Google Scholar]
  62. Muñoz, S.; Araque, O.; Sánchez-Rada, J.F.; Iglesias, C.A. An emotion aware task automation architecture based on semantic technologies for smart offices. Sensors 2018, 18, 1499. [Google Scholar] [CrossRef] [PubMed] [Green Version]
  63. Berners-Lee, T.; Connolly, D.; Kagal, L.; Scharf, Y.; Hendler, J. N3logic: A logical framework for the world wide web. arXiv 2007, arXiv:0711.1533. [Google Scholar] [CrossRef] [Green Version]
  64. McCarthy, C.; Pradhan, N.; Redpath, C.; Adler, A. Validation of the Empatica E4 wristband. In Proceedings of the 2016 IEEE EMBS International Student Conference (ISC), Ottawa, ON, Canada, 29–31 May 2016; pp. 1–4. [Google Scholar]
  65. Gilchrist, C. Learning iBeacon; Packt Publishing Ltd.: Birmingham, UK, 2014. [Google Scholar]
  66. Thompson, C. Python for Beginners. Available online: https://archive.moodle.net/mod/glossary/showentry.php?eid=93 (accessed on 14 April 2020).
  67. Borth, D.; Ji, R.; Chen, T.; Breuel, T.; Chang, S.F. Large-scale visual sentiment ontology and detectors using adjective noun pairs. In Proceedings of the 21st ACM International Conference on Multimedia, Barcelona, Spain, 21–25 October 2013; ACM: New York, NY, USA, 2013; pp. 223–232. [Google Scholar]
  68. Büchner, A. Moodle 3 Administration; Packt Publishing Ltd.: Birmingham, UK, 2016. [Google Scholar]
  69. UPM. Reglamento del Comité de Ética de Actividades de I+D+i de la Universidad Politécnica de Madrid. Available online: https://www.upm.es/sfs/Rectorado/Vicerrectorado%20de%20Investigacion/Servicio%20de%20Investigacion/Ayudas_y_Convocatorias/C.ETICA-REGLAMENTO.pdf (accessed on 17 September 2019).
  70. Williams, K. The Technology Ecosystem: Fueling Google’s Chromecast [WIE from Around the World]. IEEE Women Eng. Mag. 2014, 8, 30–32. [Google Scholar] [CrossRef]
  71. Oualline, S.; Oualline, G. Web Browsing with Firefox. In Practical Free Alternatives to Commercial Software; Springer: Berlin/Heidelberg, Germany, 2018; pp. 1–26. [Google Scholar]
  72. Ringle, C.M.; Wende, S.; Becker, J.M. SmartPLS 3; SmartPLS: Bönningstedt, Germany, 2015. [Google Scholar]
  73. Hair, J.F., Jr.; Sarstedt, M.; Hopkins, L.; Kuppelwieser, V.G. Partial least squares structural equation modeling (PLS-SEM). Eur. Bus. Rev. 2014, 26, 106–121. [Google Scholar] [CrossRef]
  74. Hair, J.F.; Anderson, R.E.; Babin, B.J.; Black, W.C. Multivariate Data Analysis: A Global Perspective; Pearson Education: London, UK, 2010; Volume 7. [Google Scholar]
  75. Urbach, N.; Ahlemann, F. Structural equation modeling in information systems research using partial least squares. J. Inf. Technol. Theory Appl. 2010, 11, 5–40. [Google Scholar]
  76. Fornell, C.; Larcker, D.F. Structural equation models with unobservable variables and measurement error: Algebra and statistics. J. Mark. Res. 1981, 18. [Google Scholar] [CrossRef]
  77. Henseler, J.; Ringle, C.M.; Sarstedt, M. A new criterion for assessing discriminant validity in variance-based structural equation modeling. J. Acad. Mark. Sci. 2015, 43, 115–135. [Google Scholar] [CrossRef] [Green Version]
  78. Duarte, P.A.O.; Raposo, M.L.B. A PLS model to study brand preference: An application to the mobile phone market. In Handbook of Partial Least Squares; Springer: Berlin/Heidelberg, Germany, 2010; pp. 449–485. [Google Scholar]
  79. Gefen, D.; Straub, D. A practical guide to factorial validity using PLS-Graph: Tutorial and annotated example. Commun. Assoc. Inf. Syst. 2005, 16, 91–109. [Google Scholar] [CrossRef] [Green Version]
  80. Al-Fraihat, D.; Joy, M.; Sinclair, J.; Masa’deh, R. Evaluating E-learning systems success: An empirical study. Comput. Hum. Behav. 2020, 102, 67–86. [Google Scholar] [CrossRef]
  81. Tenenhaus, M.; Vinzi, V.E.; Chatelin, Y.M.; Lauro, C. PLS path modeling. Comput. Stat. Data Anal. 2005, 48, 159–205. [Google Scholar] [CrossRef]
  82. Vinzi, V.E.; Trinchera, L.; Amato, S. PLS path modeling: From foundations to recent developments and open issues for model assessment and improvement. In Handbook of Partial Least Squares; Springer: Berlin/Heidelberg, Germany, 2010; pp. 47–82. [Google Scholar]
  83. Wetzels, M.; Odekerken-Schröder, G.; Van Oppen, C. Using PLS path modeling for assessing hierarchical construct models: Guidelines and empirical illustration. MIS Q. 2009, 33, 177–195. [Google Scholar] [CrossRef]
Figure 1. Emotion-aware e-learning platform architecture.
Electronics 09 01194 g001
Figure 2. Emotion aware e-learning module flow diagram.
Electronics 09 01194 g002
Figure 3. Academic and emotional dashboards for teachers’ case study.
Electronics 09 01194 g003
Figure 4. Emotional capture in the e-learning platform.
Electronics 09 01194 g004
Figure 5. Average attention of students for a certain lesson.
Electronics 09 01194 g005
Figure 6. Emotional dashboard for students’ case study.
Electronics 09 01194 g006
Figure 7. Self-reported emotion and average captured emotions for a test. (a) emotions self-reported by students shown per week; (b) example of the average captured emotions.
Electronics 09 01194 g007
Figure 8. Smart automation scenarios.
Electronics 09 01194 g008
Figure 9. Emotion-aware e-learning platform use validation model.
Electronics 09 01194 g009
Table 1. Questionnaire for the participants.
No.Question FormulationCode
Q1The system is easy to useSQ1
Q2System reliability is correctSQ2
Q3The system provides interactive features between user and systemSQ3
Q4The system provides custom informationSQ4
Q5The system features are attractive for the userSQ5
Q6The system provides information in a rapid waySQ6
Q7System interface is clear and intuitiveSQ7
Q8The system provides the needed information related to emotionsEIQ1
Q9The information provided by the system is accessible at the required momentEIQ2
Q10The information related to emotions provided by the system is relevant for your taskEIQ3
Q11The system provides enough information related to emotionsEIQ4
Q12The information provided by the system is easy to understandEIQ5
Q13The system provides updated data of your emotionsEIQ6
Q14The system enables me to accomplish the tasks more efficientlyUS1
Q15The system helps me learn effectivelyUS2
Q16The system improves my learning performanceUS3
Q17The system features are improvements with regards to standard e-learning platformsUS4
Q18Overall, the system is usefulUS5
Q19The system saves my time in searching for materialsBE1
Q20The system has increased my knowledge and helped me to be successful in the courseBE2
Q21The system makes communication easier with the teacher and other studentsBE3
Q22The system allows the teacher to adapt to students’ needsBE4
Q23The system has helped me to achieve the learning goals of the moduleBE5
Table 2. Internal consistency and convergent validity.
Construct and ItemsOuter LoadingOuter t-StatisticCRAVE
System quality 0.7670.529
SQ4: The system provides custom information0.6402.460
SQ5: The system features are attractive for the user0.6403.732
SQ7: System interface is clear and intuitive0.8762.603
Emotional related information quality 0.9040.703
EIQ1: The system provides the needed information related to emotions0.7783.986
EIQ2: The information provided by the system is accessible at the required moment0.8461.238
EIQ3: The related to emotions information provided by the system is relevant for your task0.8081.747
EIQ4: The system provides enough information related to emotions0.9141.243
Perceived usefulness 0.9350.783
US1: The system enables me to accomplish the tasks more efficiently0.9121.577
US2: The system helps me learn effectively0.8791.186
US4: The system features are improvements with regard to standard e-learning platforms0.9021.194
US5: Overall, the system is useful0.8451.177
Benefits 0.8170.530
BE2: The system has increased my knowledge and helped me to be successful in the course0.6493.420
BE3: The system makes communication easier with the teacher and other students0.8412.846
BE4: The system allows the teacher to adapt to students’ needs0.6833.292
BE5: The system has helped me to achieve the learning goals of the module0.7252.074
Table 3. Cross loadings for indicators.
Emotion Information QualityBenefitsSystem QualityPerceived Satisfaction
EIR10.7780.4280.4660.664
EIR20.8460.2500.0450.691
EIR30.8080.3870.2610.575
EIR40.9140.3730.3140.791
BE20.0780.6490.4790.048
BE30.3170.8410.6430.290
BE40.5270.6830.4600.269
BE50.2830.7250.4390.173
SQ40.0840.4080.6400.087
SQ50.3080.2480.6400.347
SQ70.3870.7310.8760.384
PS10.7300.2000.3020.912
PS20.6570.1380.3250.879
PS40.7430.3130.3020.902
PS50.7530.3360.4640.845
Bold numbers represent correlation of each item with its latent variable, which is stronger than with any other variable in the model.
Table 4. Fornell–Larcker method and HTMT correlations.
Fornell–LarckerHTMT Correlations
EIQBESQPSEIQBESQPS
Emotion Information Quality0.838
Benefits0.4300.728 0.549
System Quality0.3310.7030.727 0.5130.883
Perceived Satisfaction0.8170.2840.3960.8850.8170.3650.502
Bold numbers show that the diagonal values of correlation are larger than the other values in the column, which is the expected behavior and validates discriminant validity.
Table 5. Explanatory power ( R 2 ) and predictive relevance ( Q 2 ).
R 2 Q 2
Emotion Information Quality0.538 (moderate level)0.244
System Quality0.686 (substantial level)0.460
Table 6. Questionnaire for the professors.
No.Question FormulationAvg.
Q1The information provided by the system related to students’ emotion is useful4.2
Q2The system features are improvements with regard to standard e-learning platforms4.8
Q3The system allows the teacher to adapt the content to students’ needs4.6
Q4The system makes communication easier with the teacher and other students3.8
Q5Overall, the system is useful4.6

