Abstract
This paper presents a rapid response system architecture for the distributed management of warehouses in logistics by applying the concept of tiered edge computing. A tiered edge node architecture is proposed for the system to process computing tasks of different complexity, and a corresponding rapid response algorithm is introduced. The paper emphasizes the classification of abstracted outlier sensing data which could better match different sensing types and transplant to various application fields. A software-defined simulation is used to evaluate the system performance on response time and response accuracy, from which it can be concluded that common predefined emergency cases can be detected and responded to, rapidly.
1. Introduction
Wireless Sensor Networks (WSNs) [1] have been widely applied to transport [2], agriculture [3], smart cities [4] and smart homes [5] domains as the critical environmental sensing infrastructure in Internet of Things (IoT) systems. Tens of thousands of ubiquitous sensors enable Wireless Sensor Networks to continuously capture large amounts of sensed data, which will keep on growing in the coming years. Even though WSNs have a strong sense of the environment with increasingly accurate data capture ability, how to give meaning to these huge amounts of data, and how to use these data intelligently and quickly in various mainstream applications are the challenges of current research [6]. The value of WSNs as the tentacles of IoT systems cannot be realized under inaccurate data analytics and delayed system response. Therefore, the real-time screening and efficient processing of these sensor data have become a hot research direction and challenge.
From the perspective of intelligent logistics, the warehouse is one of the data centers that generate massive interlaced and correlative data. For general warehouse management, there are two application uses of sensed data: one is for cargo management, which includes goods identification (using RFID) and goods tracking (location and movement); the other is for safety management, which refers to environmental monitoring and data security. It is practical to filter and process data rapidly for applications requiring a fast response and real-time tracking, such as those involving safety hazards [7]. Some existing warehouse applications enable safety hazards to be detected only by visualized raw data and human response at the proximity of the users and rely upon the higher-level computational ability and strategy-making ability of the cloud for prediction. The resource limitations of WSN infrastructures restrict the state-of-the-art paradigms such as deep learning, which requires large capacities in terms of computing and storage, to be implemented on terminal nodes [8]. Such a WSN-plus-cloud mode causes problems that lead to either high bandwidth usage or high latency in undertaking emergency interventions. To satisfy the requirements on both WSN localization and cloud globalization which cannot be satisfied by a simple WSN-Cloud architecture, a well-designed WSN-Edge-Cloud system architecture [9] would be a suitable solution. A WSN-Edge-Cloud system integrates edge computing features with the WSN-Cloud architecture to solve the problems mentioned above so as to improve the efficiency of business logistics.
Known as a new paradigm for the IoT domain, edge computing [10] moves complex computation from the cloud to the edge of the networks and devices. Edge computing does not aim to replace cloud computing, but rather focuses on balancing latency of the communications and accurate computation for the wider IoT hierarchy [11,12,13]. In a WSN-Edge-Cloud system architecture, edge computing can be regarded as a relay between the cloud and sensor nodes in the WSN [14]. The edge computing nodes extend the cloud computing paradigm to the edge of the network in a bidirectional way [15]. On the node-to-cloud direction, edge nodes focus on local functionality to support geographically closer sensing with the additional feature of data preprocessing and rapid reaction time. This aggregated, filtered and preprocessed data is sent to the cloud selectively according to application requirements. In the cloud-to-node direction, edge nodes achieve distributed deployment of the broad class of applications under the macrocontrol of the cloud and perform the tasks allocated by the cloud. Since edge computing reduces both the response time in IoT communications and the upload bandwidth to the cloud, the resulting applications will have the features of real-time interaction at the edge and prediction analysis in the cloud [16].
In this paper we propose a hierarchical structure for the edge layer in the WSN-Edge-Cloud architecture to meet the requirements of rapid response in the intelligent warehouse scenario. Rapid response indicates that by taking advantage of the edge computing, the system gives the first time response to exceptions near the data-generating location rather than waiting for the response strategies from cloud computing, so as to improve the response speed of the system. Instead of the standard approach of an integrated single edge layer in the WSN-Edge-Cloud architecture, this paper proposes a novel approach of a hierarchical edge layer with cooperated edge nodes in each of the different tiers.
In this hierarchical structure, the edge functions are modularized and abstracted according to the coupling degree of functions and applications. General functions that loosely coupled with concrete applications such as data formatting are achieved on low-level edge nodes while the application-specific functions are allocated to high-level edge nodes. Such grading strategy keeps the advantages of edge computing with low latency and enhances the reconfiguration of hierarchical modules at the edge of the network.
2. Architecture and Methodology
2.1. Hierarchical Edge Computing Structure
Compared with classical WSN system architectures, the proposed edge computing-based graded system architecture consists of three core layers as illustrated in Figure 1. As a widely accepted environmental sensing infrastructure, sensor nodes in the WSN collect sensing data and track changes to the environment continuously. For better identification and management, sensor nodes in the WSN are logically separated into different areas. By moving the computation to the edge of the networks, the edge computing layer reduces the response time during communications as well as the required upload bandwidth between the sensor networks and the cloud. Compared to just using the cloud, the edge layer is physically close to the environment. The functionality of the edge layer in the proposed structure is refined into three grades of edge nodes. Grade one and two edge nodes are focused on general functions including data formatting, preliminary data processing for WSN data collection, as well as the execution of tasks and control commands allocated by the upper layer (higher grade edge nodes or the cloud). Grade three edge nodes contribute to more complex data analysis, which involves data that is potentially useful for prediction and control, as well as generating or relaying control commands from the upper layer down to the lower layer. Cloud computing is docked to the cloud layer, which contributes to the centralized analysis of global data and management of the entire network. In addition, the connection between users and the system via the cloud realizes the remote operation and control of all areas covered by the terminal devices. For application developers, the system can be accessed via the cloud or edge node for application deployment depending on the deployment requirements and the network condition.
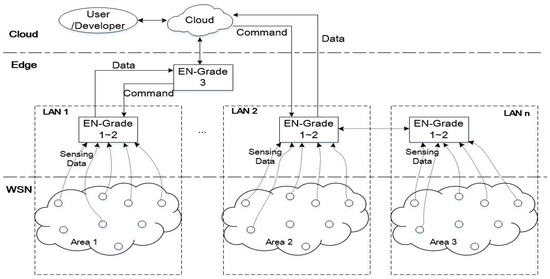
Figure 1.
Edge-computing-based tiered system architecture. ‘EN’ indicates edge node. A smaller EN-Grade number indicates the physically closer location from the edge node to the sensor nodes and sensing devices.
2.2. Distributed Micro-Database
As stated, grade one and two edge nodes in the edge layer are focused on general functions such as data formatting, preliminary data processing for WSN data collection. A lightweight database (SQLite [17]) component is inserted between the grad-1 and grad-2 edge nodes in the system. The purposes of including a light-weight database are (a) capturing the data effectively, (b) supporting selective data retrieval, (c) filtering data without additional programming, and (d) enhancing data readability and translatability. The interaction between grade one and two edge nodes is illustrated in Figure 2.
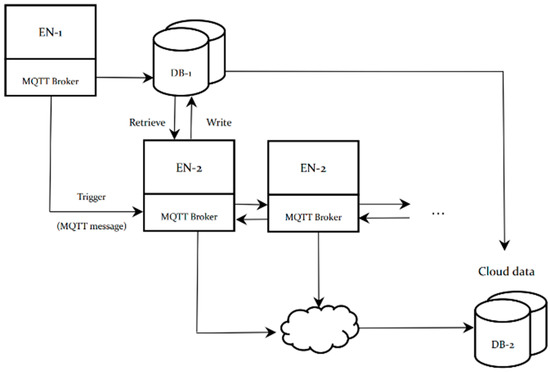
Figure 2.
The interaction between grade one and two edge computing nodes in the architecture for WSN.
Compared to some popular databases such as MySQL [18] and PostgreSQL [19], SQLite is a good choice as it has low resource usage suitable for use in embedded products for IoT applications. Due to communication dependencies on the database, the main communication protocols are called via APIs within the program directly. SQLite has outstanding performance, with low-resource consumption, low latency, and overall simplicity of configuration and management.
As a common agent component in the WSN communication environment, message brokers that implement communication protocol would deal with messages from endpoints that generate massive data. The communication between EN-1 and EN-2 shown in Figure 2 is achieved by implementing message brokers on all the edge nodes. Since most of the IoT communication brokers such as Message Queuing Telemetry Transport (MQTT) brokers do not provide any mechanism for logging historical data, a script to log sensed data to SQLite is written based on python benefitting from the multiple programming language adaptation feature of SQLite. The script will log data on a collection of topics, which includes message time, message topic, and message payload. Considering the repeatability of the sensed data, the script only logs changed data from the status sensor, which indicates that if a status sensor sends its status as “ON” once per second, then it could result in 3600 times of “ON” messages logged every hour. However, the script only logs one message. The script uses the main thread to get the data (on message callback) and a worker thread to log the data. A queue is used to move the messages between threads. Once the data is placed in the queue, the worker will take it from the queue and log it into a disk. The worker is started at the beginning of the script.
2.3. Abnormal Data Type Abstract
In previous work [20], four abnormal sensor data types were defined for the rapid response system testing in the warehouse scenario, which were (i) rapid-growth, (ii) slow-growth-diffusion, (iii) slow-growth-nondiffusion, and (iv) error data on a single node. The classification was based on the data change rate and considered the diffusivity of the sensed object. However, to loosely couple the outlier detection approach with the specific sensing data type, the abnormal data types are summarized into three abstracts which could improve the portability of the system for adapting to various application scenarios. To support this, an enhanced outlier detection mechanism is also proposed. The following section presents the outlier type abstracts and related detection mechanisms.
Sensing information that is collected by sensors is classified into two forms, (i) numerical data and (ii) status data. In the detection and rapid response system, our monitoring method for numerical data anomalies is mainly to record comparison results, while the detection method for state data anomalies is to record state changes. The detection of numerical data is commonly based on a certain preset threshold, which specifies whether it is an outlier. Two methods are considered for setting a threshold: constant value and prediction formula. The constant value is applied for data with high stability such as temperature data from an incubator. Prediction formula, which requires preset formula or complex prediction calculations, is often used for sensor data with uncertain change trends and large overall fluctuations. Road vehicle flow monitoring sensor data is a typical example. Besides exceeding the threshold, data jitter within the boundary threshold is considered as a type of outlier as well. The core performance of data jitter is the sharp increase/decrease in the dispersion of values, i.e., the degree of deviation of the sensing data from the average value increases under the premise of the constant sampling interval. In the domain of WSN, sensor data has a strong relation with time series. Hence, the processing of sensor data needs to consider both the timing factor and the data volume. Considering the premise that the sensor nodes have limited computing capacity and limited storage space, we simplified the calculation of the real-time standard deviation of data jitter into the calculation of data increments, and set a threshold for the increments, thereby transforming data jitter anomalies into threshold anomalies.
As for the status data, an expect-states pattern, which holds all effective statuses of the sensor data, is used for the outlier detection. One of the typical status sensors is the bistate switch. In an application scenario where the bistate switch is required to be normally ‘ON’, the expect-states pattern will hold the ‘ON’ state only, which indicates the ‘OFF’ state is an outlier.
Based on the three outlier data abstracts presented above, a rapid response strategy for the edge nodes in the system to justify the abnormal types is proposed in the following section.
2.4. Rapid Response Strategy
Within a target monitoring area, there are two primary cases in which sensor nodes may generate abnormal sensing data: one is sudden environmental change, the other is error data caused by a broken sensor or irruption. A rapid response is only expected to be triggered by the first case, which could save time for emergency interventions and reduce the potential for business losses. In contrast, a rapid response caused by the second case will lead to a waste of resources. The aims of this strategy are to initially process the data near the edge, at the data generation end, quickly identify the types of abnormal data, and make response strategies. It avoids the system being overly sensitive caused by responses to the raw data; in the meanwhile, it could reduce the waiting time on uploading redundant data to the cloud as well as the waiting time on the instructions from the center server.
Table 1 lists the proposed outlier type abstracts and specifications. With the hierarchical edge computing architecture illustrated in this paper, we distribute three abstracts of outlier type detection to different tiers of EN. Based on the principle that the lower the EN’s grade, the lower the computing complexity, EN-1 simply detects the status changes and numerical data that exceed the threshold with a constant value. EN-2 processes the data exceeding the threshold with prediction formula in coherence with historic data retrieved from the local micro database. The computing that involves real-time standard deviation based on massive data and related prediction will be allocated to the higher tiers of EN even to the Cloud. The detailed process is proposed as pseudo-codes in Algorithm 1. * r indicates compare result in both cases. Since thresholds may either be upper boundary or lower boundary, we use Boolean variable r to denote whether data value exceeds the boundary. ** Data gradient set: Grad(n) = {grad(n,i), n∈N, i:timestamp}. Data gradient: grad(n,i) = [d(n,i + Tc) − d(n,i)]/Tc, n∈N, i:timestamp.
| Algorithm 1 Rapid response strategy |
| Inputs: Status pattern set: SP Threshold: TH Prediction formula: f Data set: D(n) = {d(n,i,tp,payload), n∈N, i:timestamp,tp:datatype} Node set: N = {n1,n2,…, nk,k:number of nodes in the area} Process on EN-1: detect d (n,i,tp,payload) write (d,Database) if tp == status: compare (payload, SP) => r * if r == true: report (“status change”) else: compare (payload, TH) => r if r == true: report (“exceeding threshold”) generate M=(n,i) activate EN-2 Process on EN-2: observe M retrieve (Dnb,Database) compare (f(m),TH) ==> r if r == true: report (“exceeding threshold”) compute Grad (m) **, where m∈Dnb #{grad (m,i)>0}/#{Nnb} ==> r If r == true: Report (“Jitter”) else: activate EN-3 |

Table 1.
Outlier type abstracts and specifications.
3. Implementation
In this section, the proposed method is evaluated using software-defined networks. The platform, hardware settings, response accuracy are reported.
3.1. Implementation Platform and Hardware
Considering that massive sensor nodes in IoT applications cannot be completely simulated in a laboratory scenario for research experiments, we selected an open-source flow-based tool and platform called Node-RED [21] for implementing the architecture proposed in this paper. Node-RED is used as a platform to integrate components at multiple layers in the network. It provides a convenient connection with the web interface to visualize the data flow and configure the network. In our simulation, ENs communicate by subscribing to a selected topic on a broker, and the messages/data coming into the topic could be observed on the web interface. The Node-RED is run on both the Raspberry Pi (Rpi) machines and laptops as the initial setup of the network. With Node-Red running on the equipment, we could manage and configure the network and component connection using a browser. Thus, all the platform and hardware were set up as listed in Table 2. Besides the physical sensors, python scripts were used to simulate sensing data for various scenarios that currently cannot be implemented in the laboratory.
Table 2.
Simulation platform and hardware.
As is shown in Table 2, Raspberry Pi and PC were used as edge nodes and the MQTT broker, as well as CoAP MA, were deployed on edge. Users could access the web-based client to retrieve raw data and preprocessed data. The network for the whole system was simulated based on Node-RED simulator. The cloud is planned to apply IBM open-source cloud as some of the IoT application components are integrated and free to use. The block diagram in Figure 3 shows the architecture of the simulation environment, which contained the components listed in Table 2. Figure 4 illustrates an example Node-red flow that implements the functions of EN-1.
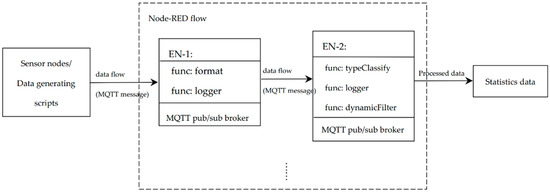
Figure 3.
Architecture of the simulation environment.
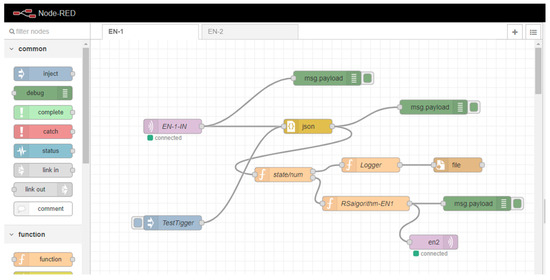
Figure 4.
Example Node-RED flow that implements the functions of EN-1.
3.2. Case Study Model
The experiment scenario is a cognitive warehouse which could recognize and respond to unexpected cases as illustrated in Table 1 rapidly. Temperature was selected as the sensing data type during the case study. The sampling rate of sensor data was configured as once per ten seconds, once per thirty seconds, and once per minute for three groups of repeating tests. The network scale was configured as 1000 nodes, 5000 nodes and 10,000 nodes, respectively.
When setting the network scale as 1000 nodes, the nodes were grouped into 50 LANs which kept generating sensed data. Every 20 sensor nodes in the same group were considered as neighbors and connected with EN in Star topology. Besides the normal data (set as 26 ± 1 centigrade for initialization), three types of outlier data were inserted into the data set randomly, which included over the boundary (constant and predicted), jitter, and error. Figure 5 illustrates four example cases during our experiments with fixed sampling rate as 10 per second and fixed network scale as 1000 nodes. Figure 5a–c judge outliers based on the constant threshold. The difference between (a) and (b) was the duration that outliers been detected. Both of these cases would be reported as “exceeding threshold” while the case in (b) needed to be further processed by EN-2. The case shown in Figure 5c indicated jitter happened to the sensor node. The single node’s value did not exceed preset boundaries, but it broke the stability of the sensed data, which could be considered as one of the general outlier types. The case shown in Figure 5d denoted the threshold based on the prediction formula. Data which deviated from the expected scope would be considered as outliers.
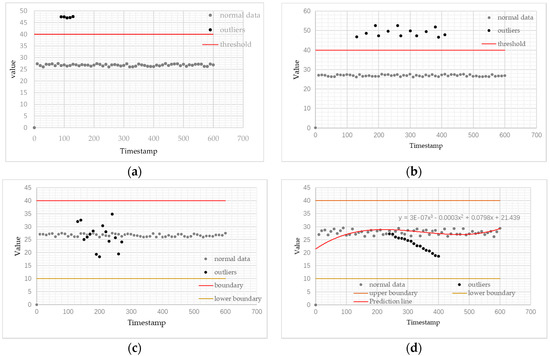
Figure 5.
Example cases for system testing. (a) Outliers exceed a constant threshold in a short period (b) Outliers exceed a constant threshold in a long period (c) Outliers act as jitter within boundary threshold (d) Outliers deviate prediction line.
Such data flows were tested under three different network scales with two different sampling rates by the system. The outcomes and related analysis are presented in the next section.
3.3. Outcomes and Analysis
To normalize the analysis, we only tested and compared the numerical sensor data during the experiment. Instead of practical environmental data, our dataset was designed for testing the proposed architecture and algorithm performances in the simulation. During the test under the setting of 1000-node network scale and 1/10sec sampling rate, 50 groups of data were generated and tested corresponding to the WSN in 50 LANs. Packs of sensor nodes for each corresponding edge node were configured as 20, which was a fixed parameter during the whole experiment. In other words, every 20 sensor nodes in the same group were considered as neighbors that shared data at their corresponding edge node. Four types of numerical outliers were inserted into a different dataset for each group, which were ‘error’, ‘exceed threshold’, ‘jitter’, as well as ‘dynamic threshold’. The system average response time and accuracy were used to reflect the system performance. The system response time was calculated by (Tresponse − Tdetect)/fsampling, where Tresponse denoted the timestamp that the system responded to the outlier, Tdetect denoted the timestamp that the outlier was detected, and fsampling denoted the sampling rate of the sensed data. The accuracy was calculated by dividing the number of outliers that were detected correctly by the number of original datasets on each end node.
The comparison of the statistical testing results with different parameters are shown in Figure 6 and Figure 7. The original data are shown in the tables in Appendix A.
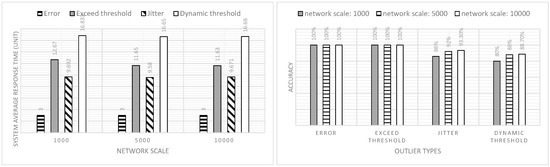
Figure 6.
The comparison of the system average response time and accuracy under different network scales and fixed sampling rate (sampling rate = 1/10sec).
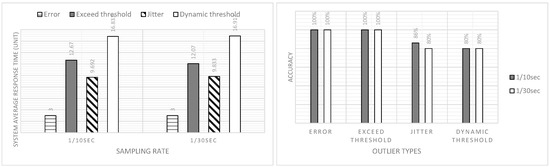
Figure 7.
The comparison of the system average response time and accuracy under different sampling rates and fixed network scale (network scale = 1000).
By analyzing the statistical outcomes shown in Figure 6 and Figure 7, it can be observed that cases related to the errors and exceeding the threshold could be 100% detected by the system. However, the system average response time had an obvious difference. The results would not be affected by the network scale and the sampling rate. As introduced in Section 2.3 and Section 2.4, any data process that required the retrieval of historical data from the local database needed to be handled on EN-2. Therefore, extra data retrieval time and increment calculation led to a relatively long system average response time for the exceed threshold cases. The cases relating to the jitter had above eighty percent accuracy with a 9.69 sampling unit average response time which indicated that the edge system could detect the jitter-type data exception successfully within 10 sampling units. Eighty percent of the tested outliers defined by the dynamic threshold could be detected by the edge system within 17 sampling units. The sampling interval did not impact the system average response time and the response accuracy due to the unity of the sampling rate that was preset in the algorithm and the sampling interval configured in the simulation environment.
4. Discussion
This paper has proposed a rapid response system architecture designed for data outlier detection, which involves the concept of hierarchical edge computing and brings the advantages of edge computing—its low latency to the edge of the network. For the case study of distributed warehouse management in logistics, an algorithm for distinguishing and rapidly responding to emergency cases was proposed. Three types of outlier abstracts were emphasized in this paper in order to promote the portability of the system. The performance of the system was evaluated by a software-defined simulation, with a focus on accuracy and rapidness of the Grade-1 and Grade-2 edge nodes in the system. Applying the rapid response algorithm showed that above eighty percent of the abnormal cases could be detected and responded to, in less than twenty sampling units.
A handful of the jitter cases that were not detected by the system were mainly caused by the ‘break’ during the jitter period. The system judged that the case did not satisfy the predefined jitter condition. One of the potential approaches for improving this is to use a machine learning model for EN-3 so that decisions are made for the lower layers. Importing artificial intelligence models onto Grade-3 edge nodes is one of the avenues to improve the response accuracy, which could enable decisions to be made on the edge of the cloud. The same situation happens to the cases related to the dynamic threshold. Once the deviation of outlier data is not significant, the system may skip the abnormal cases. Thus, to implement the entire system architecture as proposed in this paper, a clear direction for future research is the implementation of Grade-3 edge nodes, which potentially focuses on the short-time prediction. Besides the edge computing layer, the interaction and interoperation between the edge and the Cloud are also a valuable direction to extend our research.
Furthermore, some practical issues in the WSN communication environment such as message collisions, dead nodes, hotspots, etc., are valuable but have not been considered at the current research stage. We consider them as a potential research direction and will do more investigation and experiments to enhance our research outcomes in the future.
Author Contributions
Conceptualization, Y.W. and K.L.M.; methodology, Y.W.; software, Y.W.; validation, Y.W.; formal analysis, Y.W.; investigation, Y.W.; resources, Y.W.; supervision, K.L.M., S.-U.G., P.W.; writing—original draft preparation, Y.W.; writing—review and editing, K.L.M., K.L., D.H. All authors have read and agreed to the published version of the manuscript.
Funding
The research was funded by Xi’an Jiaotong-Liverpool University, Suzhou, China, the Research Development Fund (RDF-14-03-12), and XJTLU Key Program Special Fund (KSF-P-02).
Acknowledgments
Ka Lok Man wishes to thank the AI University Research Centre (AI-URC) and Research Institute of Big Data Analytics (RIBDA), Xi’an Jiaotong-Liverpool University, Suzhou, China, for supporting his related research contributions to this article through the XJTLU Key Program Special Fund (KSF-P-02) and RIBDA research subsidy fund.
Conflicts of Interest
The authors declare no conflict of interest.
Appendix A. Tables of the Statistical Outcomes with Various Sampling Rates and Network Scales
Table A1.
Statistical outcomes of the experiment (sampling rate = 1/10sec, network scale = 1000 nodes).
Table A1.
Statistical outcomes of the experiment (sampling rate = 1/10sec, network scale = 1000 nodes).
| Outlier Types | Number of Original Data Sets | Number of Outliers Being Detected Correctly | System Average Response Time (Unit) | Accuracy |
|---|---|---|---|---|
| Error | 5 | 5 | 3 | 100% |
| Exceed threshold | 15 | 15 | 12.67 | 100% |
| Jitter | 15 | 13 | 9.692 | 86% |
| Dynamic threshold | 15 | 12 | 16.833 | 80% |
Table A2.
Statistical outcomes of the experiment (sampling rate = 1/10sec, network scale = 5000 nodes).
Table A2.
Statistical outcomes of the experiment (sampling rate = 1/10sec, network scale = 5000 nodes).
| Outlier Types | Number of Original Data Sets | Number of Outliers Being Detected Correctly | System Average Response Time (Unit) | Accuracy |
|---|---|---|---|---|
| Error | 25 | 25 | 3 | 100% |
| Exceed threshold | 75 | 75 | 11.65 | 100% |
| Jitter | 75 | 69 | 9.58 | 92% |
| Dynamic threshold | 75 | 66 | 16.65 | 88% |
Table A3.
Statistical outcomes of the experiment (sampling rate = 1/10sec, network scale = 10,000 nodes).
Table A3.
Statistical outcomes of the experiment (sampling rate = 1/10sec, network scale = 10,000 nodes).
| Outlier Types | Number of Original Data Sets | Number of Outliers Being Detected Correctly | System Average Response Time (Unit) | Accuracy |
|---|---|---|---|---|
| Error | 50 | 50 | 3 | 100% |
| Exceed threshold | 150 | 150 | 11.63 | 100% |
| Jitter | 150 | 140 | 9.671 | 93.3% |
| Dynamic threshold | 150 | 133 | 16.68 | 88.7% |
Table A4.
Statistical outcomes of the experiment (sampling rate = 1/30sec, network scale = 1000 nodes).
Table A4.
Statistical outcomes of the experiment (sampling rate = 1/30sec, network scale = 1000 nodes).
| Outlier Types | Number of Original Data Sets | Number of Outliers Being Detected Correctly | System Average Response Time (Unit) | Accuracy |
|---|---|---|---|---|
| Error | 5 | 5 | 3 | 100% |
| Exceed threshold | 15 | 15 | 12.07 | 100% |
| Jitter | 15 | 12 | 9.833 | 80% |
| Dynamic threshold | 15 | 12 | 16.917 | 80% |
References
- Internet of Things: Wireless Sensor Networks, International Electrotechnical Commission (IEC). Available online: https://www.iec.ch/whitepaper/pdf/iecWP-internetofthings-LR-en.pdf (accessed on 16 July 2020).
- Hodge, V.J.; O’Keefe, S.; Weeks, M.; Moulds, A. Wireless sensor networks for condition monitoring in the railway industry: A survey. IEEE Trans. Intell. Transp. Syst. 2015, 16, 1088–1106. [Google Scholar] [CrossRef]
- Ojha, T.; Misra, S.; Raghuwanshi, N.S. Wireless sensor networks for agriculture: The state-of-the-art in practice and future challenges. Comput. Electron. Agric. 2015, 118, 66–84. [Google Scholar] [CrossRef]
- Lu, W.; Gong, Y.; Liu, X.; Wu, J.; Peng, H. Collaborative energy and information transfer in green wireless sensor networks for smart cities. IEEE Trans. Ind. Inform. 2018, 14, 1585–1593. [Google Scholar] [CrossRef]
- Ghayvat, H.; Mukhopadhyay, S.; Gui, X.; Suryadevara, N. WSN- and IOT-Based Smart homes and their extension to smart buildings. Sensors 2015, 15, 10350–10379. [Google Scholar] [CrossRef] [PubMed]
- Zhang, G.; Li, R. Fog computing architecture-based data acquisition for WSN applications. China Commun. 2017, 14, 69–81. [Google Scholar] [CrossRef]
- Kantarci, B.; Mouftah, H.T. Trustworthy sensing for public safety in cloud-centric internet of things. IEEE Internet Things J. 2014, 1, 360–368. [Google Scholar] [CrossRef]
- Martin Fernandez, C.; Diaz Rodriguez, M.; Rubio Munoz, B. An edge computing architecture in the internet of things. In Proceedings of the 2018 IEEE 21st International Symposium on Real-Time Distributed Computing (ISORC), Singapore, Singapore, 29–31 May 2018; pp. 99–102. [Google Scholar] [CrossRef]
- Mihai, V.; Dragana, C.; Stamatescu, G.; Popescu, D.; Ichim, L. Wireless Sensor network architecture based on fog computing. In Proceedings of the 2018 5th International Conference on Control, Decision and Information Technologies (CoDIT), Thessaloniki, Greece, 10–13 April 2018; pp. 743–747. [Google Scholar] [CrossRef]
- Elazhary, H. Internet of Things (IoT), mobile cloud, cloudlet, mobile IoT, IoT cloud, fog, mobile edge, and edge emerging computing paradigms: Disambiguation and research directions. J. Netw. Comput. Appl. 2019, 128, 105–140. [Google Scholar] [CrossRef]
- Bonomi, F.; Milito, R.; Zhu, J.; Addepalli, S. Fog computing and its role in the internet of things. In Proceedings of the MCC ’12: Proceedings of the First Edition of the Mcc Workshop on Mobile Cloud Computing, Helsinki, Finland, 17 August 2012. [Google Scholar]
- Caprolu, M.; di Pietro, R.; Lombardi, F.; Raponi, S. Edge computing perspectives: Architectures, technologies, and open security issues. In Proceedings of the 2019 IEEE International Conference on Edge Computing (EDGE), San Diego, CA, USA, 25–30 June 2019; pp. 116–123. [Google Scholar] [CrossRef]
- Khan, L.U.; Yaqoob, I.; Tran, N.H.; Kazmi, S.M.A.; Dang, T.N.; Hong, C.S. Edge computing enabled smart cities: A comprehensive survey. IEEE Internet Things J. 2020. [Google Scholar] [CrossRef]
- Rausch, T.; Nastic, S.; Dustdar, S. EMMA: Distributed QoS-Aware MQTT middleware for edge computing applications. In Proceedings of the 2018 IEEE International Conference on Cloud Engineering (IC2E), Orlando, FL, USA, 17–28 April 2018; pp. 191–197. [Google Scholar] [CrossRef]
- Hong, C.-H.; Varghese, B. Resource management in Fog/Edge computing: A survey on architectures, infrastructure, and algorithms. ACM Comput. Surv. 2019, 52, 1–37. [Google Scholar] [CrossRef]
- Preden, J.; Kaugerand, J.; Suurjaak, E.; Astapov, S.; Motus, L.; Pahtma, R. Data to decision: Pushing situational information needs to the edge of the network. In Proceedings of the 2015 IEEE International Multi-Disciplinary Conference on Cognitive Methods in Situation Awareness and Decision, Orlando, FL, USA, 9–12 March 2015; pp. 158–164. [Google Scholar] [CrossRef]
- SQLite Home Page. Available online: https://www.sqlite.org/index.html (accessed on 23 June 2020).
- MySQL. Available online: https://www.mysql.com/ (accessed on 24 June 2020).
- PostgreSQL: The World’s Most Advanced Open Source Database. Available online: https://www.postgresql.org/ (accessed on 24 June 2020).
- Wang, Y.; Man, K.L.; Hughes, D.; Guan, S.; Wong, P. A rapid response approach applying edge computing for distributed warehouses in WSN. In Advanced Multimedia and Ubiquitous Engineering; Springer: Singapore, 2020; pp. 183–189. [Google Scholar]
- Node-RED. Available online: https://nodered.org/ (accessed on 23 June 2020).
© 2020 by the authors. Licensee MDPI, Basel, Switzerland. This article is an open access article distributed under the terms and conditions of the Creative Commons Attribution (CC BY) license (http://creativecommons.org/licenses/by/4.0/).