Abstract
Recently, supervised learning methods have shown promising performance, especially deep neural network-based (DNN) methods, in the application of single-channel speech enhancement. Generally, those approaches extract the acoustic features directly from the noisy speech to train a magnitude-aware target. In this paper, we propose to extract the acoustic features not only from the noisy speech but also from the pre-estimated speech, noise and phase separately, then fuse them into a new complementary feature for the purpose of obtaining more discriminative acoustic representation. In addition, on the basis of learning a magnitude-aware target, we also utilize the fusion feature to learn a phase-aware target, thereby further improving the accuracy of the recovered speech. We conduct extensive experiments, including performance comparison with some typical existing methods, generalization ability evaluation on unseen noise, ablation study, and subjective test by human listener, to demonstrate the feasibility and effectiveness of the proposed method. Experimental results prove that the proposed method has the ability to improve the quality and intelligibility of the reconstructed speech.
1. Introduction
Speech enhancement has been studied extensively as a fundamental signal processing method to reconstruct the actual received signals which are easy to be degraded by noisy adverse conditions. Nowadays, speech enhancement has been widely used in the fields of speech analysis, speech recognition, speech communication, and so forth. The aim of speech enhancement is to recover and improve the speech quality and its intelligibility via different techniques and algorithms, like unsupervised methods including spectral subtraction [1,2], Wiener filtering [3], statistical model-based estimation [4,5], subband forward algorithm [6], subspace method [5,7], and so on. Generally these unsupervised methods are based on statistical signal processing and typically work in the frequency domain. These methods essentially implement speech enhancement by estimating the gain function and noise. Voice activity detection (VAD) [8,9] algorithm is a simple approach to estimate and update the noise spectrum, but its performance under non-stationary noise is unsatisfactory. Proposals of minima controlled recursive averaging (MCRA) and improved MCRA (IMCRA) enhanced the estimation of non-stationary noise [10].
Recent approaches formulate speech enhancement as a supervised learning problem, where the discriminative patterns of speech and background noise are learned from training data [11]. The performance of supervised speech enhancement algorithms is affected by three key components, that is, learning machine, training target and acoustic feature. (1) Learning machine. Compared with a traditional learning machine, like support vector machine (SVM) [12], data-driven deep neural network (DNN) has shown its strong power in adverse environments and has received much attention [13,14,15,16,17,18]. A DNN is an ANN (Artificial Neural Network) with multiple hidden layers between the input and output layers. Each layer contains multiple neurons, and the neurons between layers are connected by different functions. Similar to shallow ANNs, DNNs can model complex non-linear relationships. Due to the hierarchical structure and distributed representation at each layer, the data representation ability of DNN is exponentially more powerful than that of a shallow model when given the same number of nonlinear computational units [19]. Most recent researches focus on improving the algorithm performance by superimposing and changing the structure of the DNN [14,20,21]; (2) training targets. Training target is the key point for the quality of recovered speech, many well-designed binary masks [22,23] or ratio masks [13,23,24,25,26] are proposed. In Reference [25], Wang et al. proved that the ideal amplitude mask (IAM) can obtain a better performance on noise reducing than the ideal binary mask (IBM) [23]. Liang et al. proposed and proved that the optimal ratio mask (ORM) can further improve the signal-to-noise ratio (SNR) over the IRM by the theoretical analysis [24]. Bao et al. proposed the corrected ratio mask (CRM) to separately preserve and mask more speech and noise information and proved it performs better than the conventional ratio masks and other series of enhancement algorithms [26]. Recently, phase has shown its strong relationship with speech quality. Zheng et al. proposed a phase-aware DNN-based speech enhancement method [27], which used instantaneous frequency deviation (IFD) [28] as one of the training target and overcame the difficulty of processing a highly unstructured phase spectrogram; (3) acoustic features. The acoustic features play an important role in learning the desired training target as the input of learning machines. Early studies in supervised speech separation use only a few features such as pitch-based features [29] and amplitude modulation spectrogram (AMS) [30] in monaural separation. Based on the research of Wang et al. [25], recent studies often utilize a complementary feature set as the acoustic representation features, which are composed of the amplitude modulation spectrogram (AMS) [30], the relative spectral transformed perceptual linear prediction coefficients (RASTA-PLP) [29,31], the Mel-frequency cepstral coefficients (MFCC) [32], and the Gammatone frequency cepstral coefficients (GFCC) [33].
A general scheme of existing DNN-based speech enhancement method is shown in Figure 1. In the training stage, the complementary acoustic features are extracted directly from the noisy speech that is a mixture of clean speech and noise, and are applied to train the DNN. A magnitude-aware training target is learned via the STFT (short-time Fourier transform) [5] spectrum of clean speech and mix speech . In the speech enhancement stage, the complementary acoustic features extracted from , which is the noisy signal to be enhanced, are fed into a trained model to obtain the estimated magnitude mask . The speech magnitude can be calculated by the product of the estimated magnitude mask and which corresponding to the STFT magnitude of the signal to be enhanced. The final recovered speech is recovered accurately by inverse STFT of the recombination signal consisting of and .
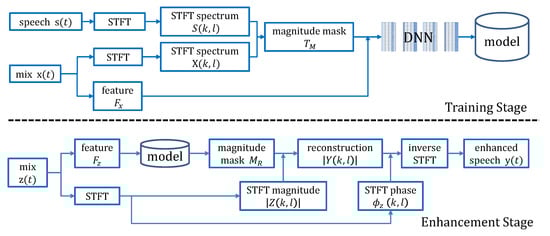
Figure 1.
General scheme of existing deep neural network (DNN)-based speech enhancement method.
We notice that recent research on DNN-based speech enhancement mainly focuses on training targets design and DNN structure optimization [18]. In our opinion, there are at least two issues that, although have not received widespread attention so far, may play an important role in further improving performance of the speech enhancement. One is related to acoustic feature extraction, the other is related to the full use of phase information. In our study, we notice that the acoustic features extracted directly from the noisy (mixed) signals cannot effectively characterize the unique properties of the signal and noise, which is not conducive to network training and target learning. Intuitively, if the acoustic features can be extracted separately from the speech and noise, it will be more helpful to construct discriminative acoustic features. On the other hand, phase has shown its strong relationship with speech quality [34,35], and phase processing has received much attention than ever before. In Reference [27], Zheng et al. proved that on the basis of existing scheme as shown in Figure 1, by incorporating the instantaneous frequency deviation (IFD) [28] as a phase-aware training target to jointly estimate the phase spectrogram, the speech enhancement performance can be further improved.
This paper proposes two main improvements to existing DNN-based speech enhancement methods. Firstly, we propose a novel discriminative complementary feature, which is a fusion of multiple sources. As shown in Figure 2, we pre-estimate the speech , noise and calculate the phase from the mix signal , then fuse the features extracted from them separately with the features extracted from the mixed signal to construct a refined acoustic representation. To our knowledge, this study is the first time to extract features from pre-estimated speech and noise, especially from the phase. Secondly, in order to make full use of the phase information, we also incorporate IFD as a phase-aware training target to estimate the phase spectrogram. However, different to Reference [27], we employ an independent DNN (see Figure 2) to train the phase-aware target instead of utilizing a single DNN to jointly train both magnitude and phase targets for the purpose of reducing computational complexity. Extensive experiments conducted on the TIMIT corpus [36] show that the proposed method outperforms the existing methods in terms of speech quality, speech intelligibility and speech distortion.
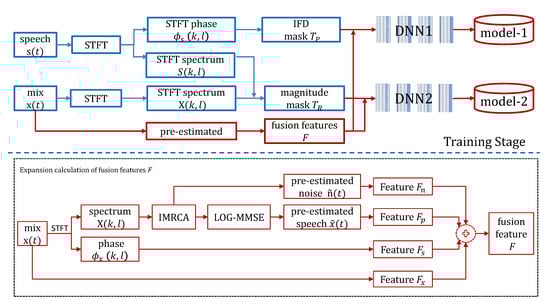
Figure 2.
Training scheme of the proposed method.
The rest of this paper is organized as follows—the details of the proposed method are described in Section 2. Especially, the pre-estimation of noise and speech is introduced in Section 2.1, the proposed feature fusion method is introduced in Section 2.2, the calculation of magnitude-aware and phase-aware training target is introduced in Section 2.3, the network structure and training strategy is introduced in Section 2.4, the speech enhancement method is introduced in Section 2.5. In Section 3, we present the experimental data, comparison methods and evaluation metrics. We conduct a series of experiments and analyze the results in Section 4. Especially, we conduct extensive comparison experiments in Section 4.1, analyze the generalization ability of comparison methods on unseen noise in Section 4.2, and obtain a deep insight of the proposed method by ablation study in Section 4.3. Finally, we conclude this study and outlook the future work in Section 5.
2. Proposed Method
In this paper, and represent the interference noise and clean speech, respectively. represents the noisy speech used in training stage, which is a mixture of and . and represent the signal to be enhanced and the final recovered signal, respectively. , , , and denote the STFT spectrum corresponding to , , , and , respectively.
2.1. Pre-Estimation of Noise and Speech
Equations (1) and (2) represent the generation of noisy speech in the time and frequency domains. k and l denote the frequency bin index and frame index, respectively. To estimate the independent noise and speech from the noisy speech, we first utilize STFT technique with L time shift and N DFT length to convert a noisy speech in time domain to a spectro-temporal spectrogram where the harmonic structure of the speech can be observed clearly, then utilize specific method to obtain estimated noise and speech, respectively.
2.1.1. Noise Estimation
We apply the IMCRA [10] method to estimate the noise. It is extremely important to effectively track the prior signal-to-noise ratio (SNR) , posterior SNR , and noisy power spectral density ( is corresponding minimum value) in noise estimation [37,38]. The conditional probability that the final speech exists can be expressed as follows:
where denotes the prior probability of the absence of speech, and denote the variances of desired speech and noise at the T-F bin , respectively. Two empirical constants , . Furthermore, the noise spectrum can be estimated as
where which is the smoothing factor and represents the noise power spectral density estimate at time frame l and frequency bin k. The pre-estimated noise amplitude is the square root of , and the corresponding pre-estimated noise can be obtained via the inverse Fourier transform to . Figure 3 illustrates an example of noise estimation: the left subplot is the spectrogram of an actual noise and the right one is the the spectrogram of estimated noise from a noisy speech.
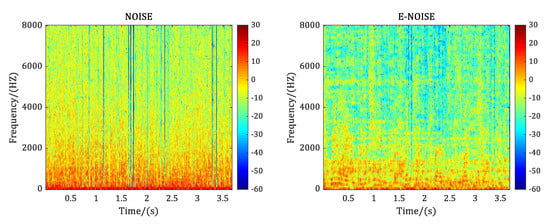
Figure 3.
Noise estimation.
2.1.2. Speech Estimation
There are many suitable methods, such as the minimum mean-square error (MMSE) estimator, Log-MMSE estimator [37,39], and Bayesian statistics [5], which can be utilized to estimate the independent speech from the noisy speech. In contrast, Log-MMSE estimator performs better in terms of noise suppression and speech distortion reduction. Log-MMSE estimator obtains the optimized speech by minimizing the error between the logarithmic amplitude of the pre-estimated speech and the actual speech:
We use for , then the matrix generating function of based on is
where p is the conditional probability, is an index and is phase. After the related calculations
where and are the gamma function and the confluent hypergeometric function, respectively. Find the derivative of when is equal to 0, you can get the conditional mean of .
And bring the result into the following formula
After calculation and simplification, the pre-estimated speech can be obtained by using the statistical model of the Fourier coefficient for statistical imprisonment features:
2.2. Feature Fusion
In this paper, we propose fusing the features extracted from the noisy speech , the pre-estimated independent speech , the pre-estimated independent noise , and the phase feature .
For and , we utilize the complementary acoustic feature set which has been widely accepted by recent studies as the representation vector.
The complementary feature set is composed of 15-dimensional AMS () [30], 13-dimensional RASTA-PLP () [31], 31-dimensional MFCC () [32], and 64-dimensional GFCC () [33]. To further augment the feature vector, we apply the delta (derivatives) operation to further double the feature dimension. Thus, for each time frame, the final dimension of a complementary acoustic features set is 246, that is, , both for and .
For , we only extract AMS [30] as its representation and get a 15-dimensional feature vector.
For the purpose of further improving the discrimination of acoustic feature and enhancing the ability of the DNN to fit the phase-aware training target, in this paper, we propose to employ the IFD of noisy speech as the phase feature which is a 257-dimensional vector. Following the idea proposed in Reference [27], the IFD can be calculated as:
denotes the complex conjugate of the complex number . The can also be understood as the negative derivative of the phase spectrum along the time axis in Reference [40] and Formula (18) is the expression of the complex number field. Function denotes the selection of principal values which projects the phase difference onto and the function calculates the phase angle of a complex number [27]. The is the center frequency, where L is the time shift between two adjacent frames and N is the length the discrete Fourier transform. measures how far an IF value strays from its center frequency, so the role of is to eliminate the striation caused by different center frequencies, which makes the structure of the speech more apparent [28].
The final fusion feature is a concatenation of above features and the total dimension is 764.
2.3. Training Target
In addition to widely used magnitude-aware training target, we also utilize an independent phase-aware training target to train the corresponding phase mask. As for phase-aware target, we follow the idea proposed in Reference [27] and utilize the IFD calculated on the clean speech as the phase target, to improve the estimation of the final speech.
To balance phase-aware target (IFD) and the magnitude-aware target on the training errors, we normalize IFD into the range of . As shown in Figure 2, DNN1 is used to train the phase model. Here, the fusion feature (F) is used as the network input, and the clean speech (that is,) is used as the network output. They are jointly trained to obtain model-1.
As for magnitude-aware target, in our implementation, we utilize ideal amplitude mask (IAM), which is named as FFT-MASK in Reference [25]. The IAM is defined as the ratio of STFT magnitude of clean speech and noisy speech .
where and represent spectral magnitudes of clean speech signal and mixed signal within a T-F unit, respectively. As shown in Figure 2, IAM corresponds to the amplitude target (). In the second network training process, IAM and the fusion feature (F) are used as the output and input of the DNN2, respectively, to train the model-2.
2.4. Network Structure and Training Strategy
In order to obtain optimal fitting effect, we propose to use two DNNs with the same structure to train IAM (magnitude mask) and IFD (phase mask) respectively, instead of jointly training two masks with a single DNN as in Reference [27]. Each DNN employs a five-layer structure, including one input layer, three hidden layers, and one output layer. Each hidden layer consists of 2048 rectified linear neurons (ReLU). The sigmoid activation function is adopted for the input and output layers. In the training process, the DNN is optimized by minimizing the mean square error (MSE). The learning rate decreases linearly from 0.008 to 0.0001. The scaling factor for adaptive stochastic gradient descent is set to 0.0015. During network training, the number of epochs for back propagation training is set to 30, and the batch size is set to 32.
2.5. Speech Enhancement
As shown in Figure 4, for the purpose of reconstructing the enhanced speech from the mix signal , the fusion feature F is firstly calculated according to the description in Section 2.2. Then, the fusion feature F is input to the model1 and model2 to obtain the estimated phase target and the estimated amplitude target , respectively. The model1 and model2 are obtained in the training stage (see Figure 2). Implementing STFT on can get and , then get . The estimated amplitude spectrum can be obtained by .
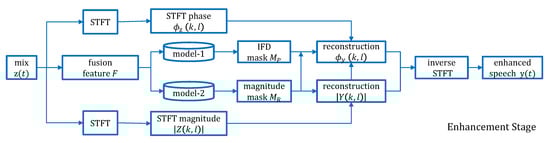
Figure 4.
Speech enhancement scheme of the proposed method.
The phase reconstruction process is more complicated [27]. First, we use as the initial phase, then calculate according to the Equation (18) and reconstruct the phase along the time axis
where denotes the proximity weight, is an unwrapping function which can make the phase spectrogram smooth along the time axis, and is the reliability index. . Finally the phase can be reconstructed along the frequency axis
where , and are two adjacent harmonic bands of the k-th frequency band. is the discrete Fourier transform of the k-th window function. So the final enhanced speech can be reconstructed by the inverse STFT of and .
3. Experimental Data, Comparison Methods and Evaluation Metric
3.1. Experimental Data
In the experiment, the TIMIT voice database [36] was used for performance evaluation. We chose 380 speakers to form a training set, and 40 speakers to constitute a test set. All of the speakers have 10 clean utterances. And the test set and the training set are completely non-coincident in our experiment. The total experimental data consists of 3800 clean training utterances and 400 clean test utterances. We also selected 4 types of noises, including babble, factory1, factory2 and buccaneer1 as added noise from the NOISEX-92 database [41]. Each noise signal was separated into two parts, one for constructing training mixture and the other for testing. We mixed each clean utterance with 16 short noise segments at the SNR levels of −5 db, −3 db and 0 dB respectively, where the 16 noise segments came from the 4 types of noises, each with 4 random noise segments for training and with 1 random noise segments for testing. Thus there are 60,800 training discourse and 6400 test discourse at each SNR level. All corpora was re-sampled to 16 kHz, and converted to a T-F unit with the frame length set to 20 ms and the frame shift set to 10 ms.
3.2. Comparison Methods
In our experiment, we compared the proposed method to (1) a classical DNN-based speech method [25] which follows the scheme shown in Figure 1; (2) the method proposed in Reference [26] which exploited the CRM as the training target, and (3) a state-of-the-art method proposed in Reference [27] which improved the speech enhancement by incorporating the phase-aware training target. For the convenience of description, in this paper, we termed methods in References [25,26,27], and the proposed as DNN, DNN-CRM, DNN-IFD, DNN-MP, respectively. In addition, we also provided the result of noisy speech, which is termed as NOISY, as the baseline to evaluate the improvement of different methods.
For fair comparison, all comparison methods utilized deep neural network as the learning machine with the same structure and learning strategy as the original literature proposed. For training target, DNN, DNN-IFD, and DNN-MP utilized IAM as the magnitude-aware training target, while DNN-CRM utilized CRM as the magnitude-aware training target following its original setting. DNN-IFD, and DNN-MP utilized IFD as the phase-aware training target. For acoustic features, DNN, DNN-CRM and DNN-IFD utilized the complementary features [25], and DNN-MP utilized the proposed fusion feature.
3.3. Evaluation Metrics
For the purpose of evaluating the performance of the different methods, we utilized several metrics, including perceptual evaluation of speech quality (PESQ) [42], shot-time objective intelligibility (STOI) [43], extended STOI (ESTOI) [44] and signal to distortion ratio (SDR) [45].
PESQ can effectively estimate speech quality and its score ranges from −0.5 to 4.5. The higher the PESQ score is, the better the predicted speech quality is. STOI evaluates the objective intelligibility of a degraded speech signal by computing the correlation of the temporal envelopes of the degraded speech signal and its clean reference. It has been shown empirically that STOI score is strongly correlated with human speech intelligibility scores. ESTOI evaluates the objective intelligibility of a degraded speech signal by computing the spectral correlation coefficients of the degraded speech signal and its clean reference in short time segments. Unlike STOI, ESTOI does not assume that frequency bands are mutually independent. Both scores of STOI and ESTOI range from 0 to 1. The higher the scores are, the better the predicted intelligibility is. The SDR score is computed by blind source separation evaluation measurements. It has been widely used for evaluating speech quality [27].
4. Experiments and Analysis
4.1. Experiment 1: Speech Enhancement Performance Comparison
Comprehensive experimental results are listed in Table 1. Comparing the speech enhancement performance of different methods, it shows that: (1) all DNN-based speech enhancement methods can effectively improve the speech quality and intelligibility of the original noisy speech for various types of added noise at any SNR level. From the perspective of SNR, the higher the SNR of the original noisy signal, the higher the speech intelligibility and quality of the final recovered signal, which is consistent with common sense. In terms of noise, among the four types of noise, Factory2 and Buccaneer1 seem to be easier to handle, while Babble and Factory1 are relatively difficult; (2) In general, DNN, DNN-CRM, and DNN-IFD have similar speech enhancement capabilities, and the proposed DNN-MP achieves further improvement beyond those three methods. Taking the processing of Babble noise at the −5 db SNR level as an example, it shows that DNN, DNN-CRM and DNN-IFD can improve the PESQ of NOISY from 1.42 to about 1.63 with an average gain of 0.2. In contrast, the proposed DNN-MP can obtain a gain of more than 0.3 (from 1.42 to 1.75). For ESTOI and STOI, the gains obtained by DNN, DNN-CRM and DNN-IFD are about 0.13 and 0.10, while by DNN-MP is up to 0.18 and 0.12. For SDR, DNN, DNN-CRM and DNN-IFD improve that of NOISY from −4.81 to 0.35, 0.40 and 0.54, respectively, and DNN-MP further improves it to 1.41.

Table 1.
Experiment 1: Speech enhancement performance comparison.
Figure 5 presents an intuitive comparison, herein we plot the averaging performance of the comparison methods on (a) all SNR levels for factory1 noise and (b) all noise at −5 dB SNR level. For the purpose of eliminating the magnitude difference between four evaluation metrics (ref. Table 1), we reduced the value of PESQ and SDR by 10 times. It is not difficult to see from Figure 5 that the performance of DNN, DNN-CRM, DNN-IFD, and DNN-MP increases stepwise for all four evaluation metrics. This statistical result once again demonstrates the assertions of previous studies [26,27], namely the performance of DNN can be improved by replacing the IAM target with the CRM target (DNN-CRM), and the performance can be further improved by adding phase-aware target on the basis of magnitude-aware target, which proves the importance of phase information in speech enhancement (DNN-IFD). Obviously, our method achieves the leading performance due to the fusion of both magnitude/phase-aware features and targets.
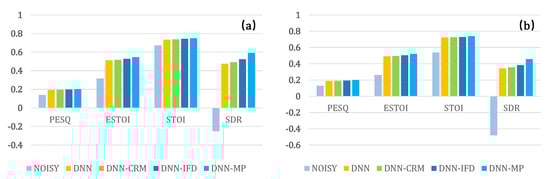
Figure 5.
Performance averaged on (a) all SNR levels for factory1 noise, and (b) all noise at −5 dB SNR level.
We also compared the spectrograms of the same noisy sentence, which is the No. 395 sentence randomly selected from the test data set at −5 dB SNR level before and after speech enhancement with different comparison methods. Figure 6, Figure 7, Figure 8 and Figure 9 correspond to the case of adding the noise of babble, factory1, factory2 and buccaneer1 respectively. In each figure, the annotation CLEAN represents the clean speech without noise adding, and NOISY represents the noisy speech after adding a specific noise to the CLEAN speech. DNN, DNN-CRM, DNN-IFD, and DNN-MP represent the recovered speech after corresponding processing method. Comparing the spectrograms of CLEAN and NOISY in each figure, it illustrates that at −5 dB SNR level, the clean signal is heavily polluted with the added noise. For the No. 395 sentence, in terms of a particular method, it shows that DNN and DNN-IFD perform better in processing factory2 and buccaneer1, but poorly in babble and factory1. While DNN-CRM is the opposite of DNN and DNN-IFD, it performs better in processing babble and factory1 but poorly in factory2 and buccaneer1. In contrast, the proposed DNN-MP achieves considerably good noise-reduction results for each type of noise.
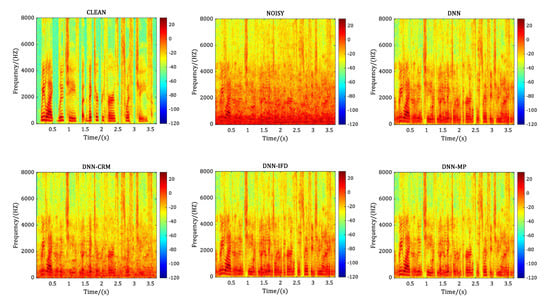
Figure 6.
Performance comparison in terms of spectrogram for babble noise at −5 dB SNR level.
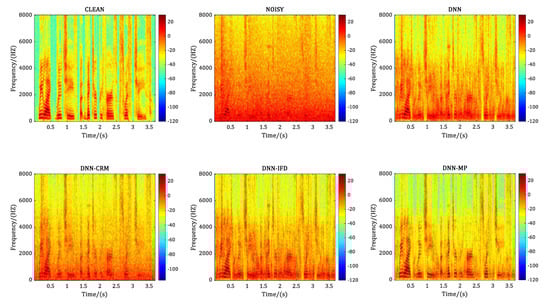
Figure 7.
Performance comparison in terms of spectrogram for factory1 noise at −5 dB SNR level.
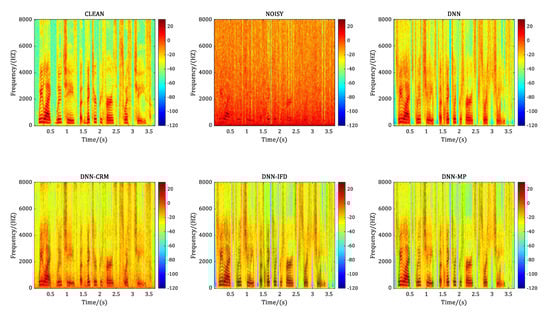
Figure 8.
Performance comparison in terms of spectrogram for factory2 noise at −5 dB SNR level.
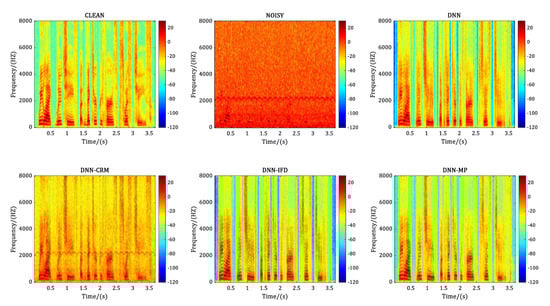
Figure 9.
Performance comparison in terms of spectrogram for buccaneer1 noise at −5 dB SNR level.
4.2. Experiment 2: Generalization Ability Evaluation on Unseen Noise
To investigate the generalization ability of the comparison methods, we tested their performance on an unseen noise. In this experiment, we trained the model with 15,200 discourse adding buccaneer1 noise from the TIMIT database at −5 dB SNR level, and tested the performance on discourse adding buccaneer2 noise from the NOISEX-92 database at same SNR level. Although both noises of buccaneer1 and buccaneer2 are cockpit noise, their difference comes from the speed and altitude when getting noise. From Table 2, it can be seen that the generalization ability of the proposed DNN-MP is superior to all other comparison methods.
Table 2.
Generalization ability on unseen noise.
4.3. Experiment 3: Ablation Study
The foregoing experiments prove that the proposed method (DNN-MP) is superior to existing methods in terms of both speech enhancement performance and generalization ability. The good performance of DNN-MP comes from two aspects—one is the fusion of multiple features extracted from pre-estimated speech, pre-estimated noise, and phase, beyond only from clean speech; the other is the comprehensive utilization of magnitude-aware and phase-aware training targets.
In order to further explore the effects of the aforementioned components on the speech enhancement performance, we did two groups of ablation study. In the first set of experiments, we kept the network structure and training targets (IAM and IFD) of the DNN-MP method unchanged, and successively removed pre-estimated noise feature (), pre-estimated speech feature (), phase feature (), and their combination, that is, and , and , and , from the fusion feature F (ref. Equation (21)), for the purpose of investigating their role in fusion feature. The experimental results tested with buccaneer1 noise at −5 dB SNR level are listed in Table 3. As can be seen from the table, among the three independent features, and (especially ) have a significant impact on the performance of DNN-MP. Taking the metric PESQ as an example, removal of and result in a drop from 2.22 to 2.17 and 2.15, respectively. When both and are removed, the result drops to 2.12. In contrast, has relatively little impact on DNN-MP, which can be derived from the fact that DNN-MP and , and , and almost have the same PESQ value. The author hopes that this discovery can guide researchers to further optimize fusion features.
Table 3.
Experiment 3-1: Effect of specific feature on DNN-MP.
In the second set of experiments, we kept the network structure, fusion feature (F) and the magnitude-aware training target (IAM) of the DNN-MP method unchanged, but removed phase-aware training target (IFD). The experimental result tested with buccaneer1 noise at −5 dB SNR level is termed as DNN-M and listed in Table 4. Compared to DNN-MP, DNN-M’s performance (PESQ) drops to 2.13, which demonstrates the important role of phase-aware training target in speech enhancement.
Table 4.
Experiment 3-2: Effect of phase-aware training target on DNN-MP.
4.4. Experiment 4: Subjective Test by Human Listeners
In order to give a more comprehensive understanding of the performance of various comparison methods, we also conducted a subjective test by human listeners. We recruited 36 volunteers aged between 16 and 60 years old. All volunteers had no background knowledge in related speech enhancement research fields, so the fairness of the test results will not be affected by personal preferences for comparison methods. We randomly selected 20 noisy speech sentences from the test set and processed them with four aforementioned comparison methods, that is, DNN, DNN-CRM, DNN-IFD and DNN-MP. Thus, for each piece of speech sentence, we got four enhanced speeches that had been de-noised. A tester was asked to select one from four that he/she thought had the best de-noising effect, and to fill out the questionnaire as shown in Table 5. In the table, the top row presents the number of speech sentence randomly selected from the test set. S1, …, S36 in the leftmost column denotes the number of tester. ♡, ∆, ☐, and ◊ represents the method of DNN, DNN-CRM, DNN-IFD, and DNN-MP, respectively.
Table 5.
Original questionnaire of subjective test.
Based on the original questionnaire, we counted the results of the subjective test. As shown in Table 6, the cumulative number of votes for all sentences is 36 × 20 = 720 votes, of which 264 votes are for the DNN-MP method (◊), 225 votes are for the DNN-CRM method (∆), 193 votes are for the DNN-IFD method (☐), and 38 votes are for the DNN method (♡). Among the 20 noisy speech sentences, thirteen noisy speech sentences processed by the proposed DNN-MP method are considered to have the best quality, these speech sentences are composed of No. 24, 28, 74, 172, 179, 207, 239, 267, 306, 321, 391, 398 and 400. Two noisy speech sentences No. 155 and No. 163 processed by the DNN-IFD are considered to have the best processing effect. Another two noisy speech sentences No. 234 and No. 377 processed by the DNN-CRM method are considered to have the best quality. In addition, both DNN-CRM and DNN-IFD are considered to have the best quality for speech sentences No. 136 and No. 235, while for No. 36, both DNN-CRM and DNN-MP are considered to have the best quality. The subjective test once again proved that the proposed method can remove noise more effectively than other comparison methods.
Table 6.
Experiment 4: Subjective test scores.
5. Conclusions
In this study, we propose a novel DNN-based single-channel speech enhancement method by fusing the magnitude-aware and phase-aware information in both feature and training target aspects. Extensive experiments demonstrate that the proposed method (DNN-MP) is superior to comparison methods in terms of both speech enhancement performance (speech quality and intelligibility) and generalization ability. Experiments and analysis show that the good performance of the proposed method comes from two aspects—one is the fusion of multiple features extracted from pre-estimated speech, pre-estimated noise, and phase, beyond only from clean speech, the other is the comprehensive utilization of magnitude-aware and phase-aware training targets.
Author Contributions
Conceptualization, H.L.; methodology, H.L. and J.Y.; software, J.Y.; validation, J.Y.; data curation, J.Y.; writing—original draft preparation, J.Y.; writing—review and editing, H.L. and J.Y.; visualization, H.L. and J.Y.; supervision, H.L.; project administration, H.L. All authors have read and agreed to the published version of the manuscript.
Funding
This research received no external funding.
Acknowledgments
The authors would like to thank all anonymous reviewers and assistant editor Chaya Chen for their constructive comments and suggestions that significantly improved this paper.
Conflicts of Interest
The authors declare no conflict of interest.
References
- Boll, S. Suppression of acoustic noise in speech using spectral subtraction. IEEE Trans. Acoust. Speech Signal Process. 1979, 27, 113–120. [Google Scholar] [CrossRef]
- Wang, J.; Liu, H.; Zheng, C.; Li, X. Spectral subtraction based on two-stage spectral estimation and modified cepstrum thresholding. Appl. Acoust. 2013, 74, 450–458. [Google Scholar] [CrossRef]
- Scalart, P. Speech enhancement based on a priori signal to noise estimation. In Proceedings of the 1996 IEEE International Conference on Acoustics, Speech, and Signal Processing Conference Proceedings, Atlanta, GA, USA, 9 May 1996; Volume 2, pp. 629–632. [Google Scholar]
- Ephraim, Y.; Malah, D. Speech enhancement using a minimum-mean square error short-time spectral amplitude estimator. IEEE Trans. Acoust. Speech Signal Process. 1984, 32, 1109–1121. [Google Scholar] [CrossRef]
- Loizou, P.C. Speech Enhancement: Theory and Practice; CRC Press: Boca Raton, FL, USA, 2013. [Google Scholar]
- Djendi, M.; Bendoumia, R. Improved subband-forward algorithm for acoustic noise reduction and speech quality enhancement. Appl. Soft Comput. 2016, 42, 132–143. [Google Scholar] [CrossRef]
- Ephraim, Y.; Van Trees, H.L. A signal subspace approach for speech enhancement. IEEE Trans. Speech Audio Process. 1995, 3, 251–266. [Google Scholar] [CrossRef]
- Elmaleh, K.H.; Kabal, P. Comparison of voice activity detection algorithms for wireless personal communications systems. In Proceedings of the CCECE’97. Canadian Conference on Electrical and Computer Engineering. Engineering Innovation: Voyage of Discovery. Conference Proceedings, Saint Johns, NL, Canada, 25–28 May 1997; Volume 2, pp. 470–473. [Google Scholar]
- Tucker, R. Voice activity detection using a periodicity measure. Commun. Speech Vision IEE Proc. I 1992, 139, 377–380. [Google Scholar] [CrossRef]
- Cohen, I. Noise spectrum estimation in adverse environments: Improved minima controlled recursive averaging. IEEE Trans. Speech Audio Process. 2003, 11, 466–475. [Google Scholar] [CrossRef]
- Wang, Y.; Wang, D. Towards scaling up classification-based speech separation. IEEE Trans. Audio Speech Lang. Process. 2013, 21, 1381–1390. [Google Scholar] [CrossRef]
- Chang, J.H.; Jo, Q.H.; Kim, D.K.; Kim, N.S. Global soft decision employing support vector machine for speech enhancement. IEEE Signal Process. Lett. 2008, 16, 57–60. [Google Scholar] [CrossRef]
- Narayanan, A.; Wang, D. Ideal ratio mask estimation using deep neural networks for robust speech recognition. In Proceedings of the 2013 IEEE International Conference on Acoustics, Speech and Signal Processing, Vancouver, BC, Canada, 26–31 May 2013; pp. 7092–7096. [Google Scholar]
- Xu, Y.; Du, J.; Dai, L.R.; Lee, C.H. An experimental study on speech enhancement based on deep neural networks. IEEE Signal Process. Lett. 2013, 21, 65–68. [Google Scholar] [CrossRef]
- Weninger, F.; Eyben, F.; Schuller, B. Single-channel speech separation with memory-enhanced recurrent neural networks. In Proceedings of the 2014 IEEE International Conference on Acoustics, Speech and Signal Processing (ICASSP), Florence, Italy, 4–9 May 2014; pp. 3709–3713. [Google Scholar]
- Weninger, F.; Hershey, J.R.; Le Roux, J.; Schuller, B. Discriminatively trained recurrent neural networks for single-channel speech separation. In Proceedings of the 2014 IEEE Global Conference on Signal and Information Processing (GlobalSIP), Atlanta, GA, USA, 3–5 December 2014; pp. 577–581. [Google Scholar]
- Du, J.; Tu, Y.; Dai, L.R.; Lee, C.H. A regression approach to single-channel speech separation via high-resolution deep neural networks. IEEE/ACM Trans. Audio Speech Lang. Process. 2016, 24, 1424–1437. [Google Scholar] [CrossRef]
- Wang, D.; Chen, J. Supervised speech separation based on deep learning: An overview. IEEE/ACM Trans. Audio Speech Lang. Process. 2018, 26, 1702–1726. [Google Scholar] [CrossRef] [PubMed]
- Hinton, G.E.; Osindero, S.; Teh, Y.W. A fast learning algorithm for deep belief nets. Neural Comput. 2006, 18, 1527–1554. [Google Scholar] [CrossRef]
- Wang, Q.; Du, J.; Dai, L.R.; Lee, C.H. A multiobjective learning and ensembling approach to high- performance speech enhancement with compact neural network architectures. IEEE/ACM Trans. Audio Speech Lang. Process. (TASLP) 2018, 26, 1181–1193. [Google Scholar] [CrossRef]
- Zhang, X.L.; Wang, D. A deep ensemble learning method for monaural speech separation. IEEE/ACM Trans. Audio Speech Lang. Process. (TASLP) 2016, 24, 967–977. [Google Scholar] [CrossRef]
- Brown, G.J.; Wang, D. Separation of speech by computational auditory scene analysis. In Speech Enhancement; Springer: New York, NY, USA, 2005; pp. 371–402. [Google Scholar]
- Srinivasan, S.; Roman, N.; Wang, D. Binary and ratio time-frequency masks for robust speech recognition. Speech Commun. 2006, 48, 1486–1501. [Google Scholar] [CrossRef]
- Liang, S.; Liu, W.; Jiang, W.; Xue, W. The optimal ratio time-frequency mask for speech separation in terms of the signal-to-noise ratio. J. Acoust. Soc. Am. 2013, 134, EL452–EL458. [Google Scholar] [CrossRef]
- Wang, Y.; Narayanan, A.; Wang, D. On training targets for supervised speech separation. IEEE/ACM Trans. Audio Speech Lang. Process. 2014, 22, 1849–1858. [Google Scholar] [CrossRef]
- Bao, F.; Abdulla, W.H.; Bao, F.; Abdulla, W.H. A New Ratio Mask Representation for CASA-Based Speech Enhancement. IEEE/ACM Trans. Audio Speech Lang. Process. (TASLP) 2019, 27, 7–19. [Google Scholar] [CrossRef]
- Zheng, N.; Zhang, X.L. Phase-aware speech enhancement based on deep neural networks. IEEE/ACM Trans. Audio Speech Lang. Process. 2018, 27, 63–76. [Google Scholar] [CrossRef]
- Stark, A.P.; Paliwal, K.K. Speech analysis using instantaneous frequency deviation. In Proceedings of the Ninth Annual Conference of the International Speech Communication Association, Brisbane, Australia, 22–26 September 2008. [Google Scholar]
- Wang, Y.; Han, K.; Wang, D. Exploring monaural features for classification-based speech segregation. IEEE Trans. Audio Speech Lang. Process. 2012, 21, 270–279. [Google Scholar] [CrossRef]
- Kim, G.; Lu, Y.; Hu, Y.; Loizou, P.C. An algorithm that improves speech intelligibility in noise for normal-hearing listeners. J. Acoust. Soc. Am. 2009, 126, 1486–1494. [Google Scholar] [CrossRef]
- Hermansky, H.; Morgan, N. RASTA processing of speech. IEEE Trans. Speech Audio Process. 1994, 2, 578–589. [Google Scholar] [CrossRef]
- Shao, Y.; Wang, D. Robust speaker identification using auditory features and computational auditory scene analysis. In Proceedings of the 2008 IEEE International Conference on Acoustics, Speech and Signal Processing, Las Vegas, NV, USA, 31 March–4 April 2008; pp. 1589–1592. [Google Scholar]
- Shao, Y.; Jin, Z.; Wang, D.; Srinivasan, S. An auditory-based feature for robust speech recognition. In Proceedings of the 2009 IEEE International Conference on Acoustics, Speech and Signal Processing, Taipei, Taiwan, 19–24 April 2009; pp. 4625–4628. [Google Scholar]
- Paliwal, K.; Wójcicki, K.; Shannon, B. The importance of phase in speech enhancement. Speech Commun. 2011, 53, 465–494. [Google Scholar] [CrossRef]
- Mowlaee, P.; Saeidi, R.; Stylianou, Y. Advances in phase-aware signal processing in speech communication. Speech Commun. 2016, 81, 1–29. [Google Scholar] [CrossRef]
- Garofolo, J.S.; Lamel, L.F.; Fisher, W.M.; Fiscus, J.G.; Pallett, D.S. DARPA TIMIT acoustic-phonetic continous speech corpus CD-ROM. NIST speech disc 1-1.1. NASA STI/Recon Tech. Rep. N. 1993, 93, 27403. [Google Scholar]
- Ephraim, Y.; Malah, D. Speech enhancement using a minimum mean-square error log-spectral amplitude estimator. IEEE Trans. Acoust. Speech Signal Process. 1985, 33, 443–445. [Google Scholar] [CrossRef]
- Cohen, I. On the decision-directed estimation approach of Ephraim and Malah. In Proceedings of the 2004 IEEE International Conference on Acoustics, Speech, and Signal Processing, Montreal, QC, Canada, 17–21 May 2004; Volume 1, pp. 1–293. [Google Scholar]
- Loizou, P.C. Speech enhancement based on perceptually motivated Bayesian estimators of the magnitude spectrum. IEEE Trans. Speech Audio Process. 2005, 13, 857–869. [Google Scholar] [CrossRef]
- Friedman, D. Instantaneous-frequency distribution vs. time: An interpretation of the phase structure of speech. In Proceedings of the ICASSP’85. IEEE International Conference on Acoustics, Speech, and Signal Processing, Tampa, FL, USA, 26–29 April 1985; Volume 10, pp. 1121–1124. [Google Scholar]
- Varga, A.; Steeneken, H.J. Assessment for automatic speech recognition: II. NOISEX-92: A database and an experiment to study the effect of additive noise on speech recognition systems. Speech Commun. 1993, 12, 247–251. [Google Scholar] [CrossRef]
- Rix, A.W.; Beerends, J.G.; Hollier, M.P.; Hekstra, A.P. Perceptual evaluation of speech quality (PESQ)-a new method for speech quality assessment of telephone networks and codecs. In Proceedings of the 2001 IEEE International Conference on Acoustics, Speech, and Signal Processing. Proceedings (Cat. No. 01CH37221), Salt Lake City, UT, USA, 7–11 May 2001; Volume 2, pp. 749–752. [Google Scholar]
- Taal, C.H.; Hendriks, R.C.; Heusdens, R.; Jensen, J. An algorithm for intelligibility prediction of time– frequency weighted noisy speech. IEEE Trans. Audio Speech Lang. Process. 2011, 19, 2125–2136. [Google Scholar] [CrossRef]
- Jensen, J.; Taal, C.H. An algorithm for predicting the intelligibility of speech masked by modulated noise maskers. IEEE/ACM Trans. Audio Speech Lang. Process. 2016, 24, 2009–2022. [Google Scholar] [CrossRef]
- Vincent, E.; Gribonval, R.; Févotte, C. Performance measurement in blind audio source separation. IEEE Trans. Audio Speech Lang. Process. 2006, 14, 1462–1469. [Google Scholar] [CrossRef]
© 2020 by the authors. Licensee MDPI, Basel, Switzerland. This article is an open access article distributed under the terms and conditions of the Creative Commons Attribution (CC BY) license (http://creativecommons.org/licenses/by/4.0/).