Side-Information-Aided Preprocessing Scheme for Deep-Learning Classifier in Fingerprint-Based Indoor Positioning


Abstract
1. Introduction
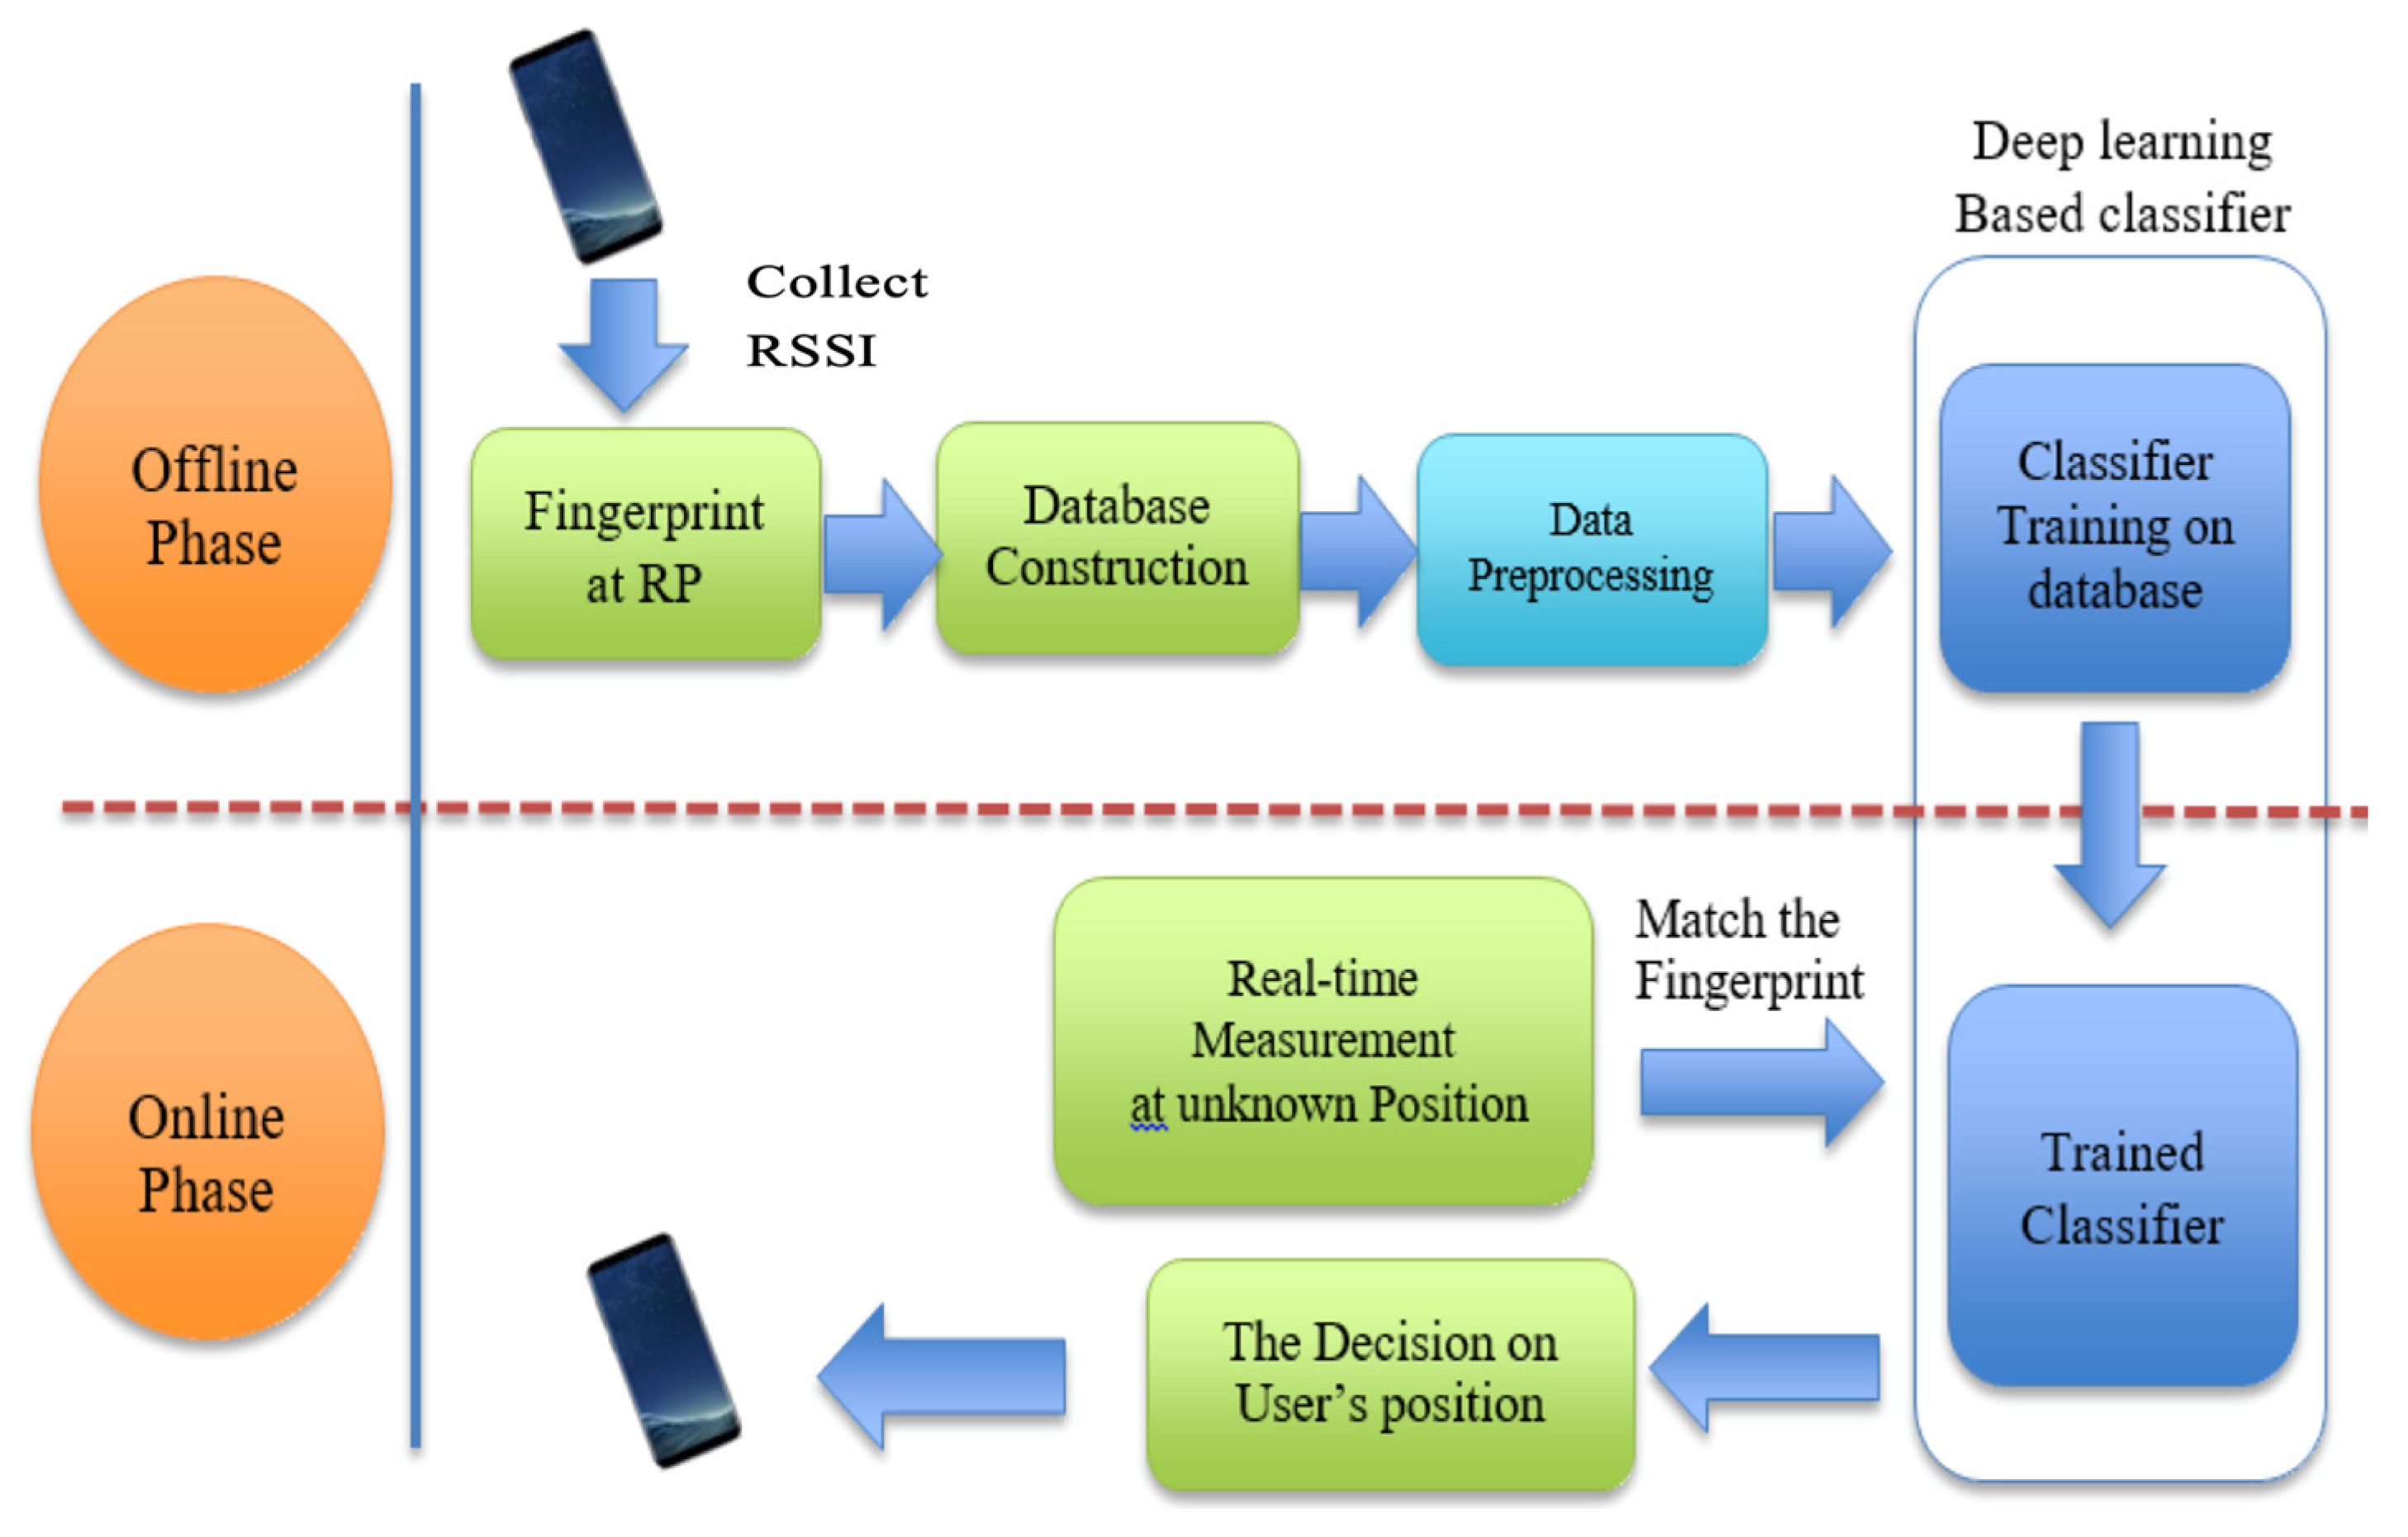
2. System Model
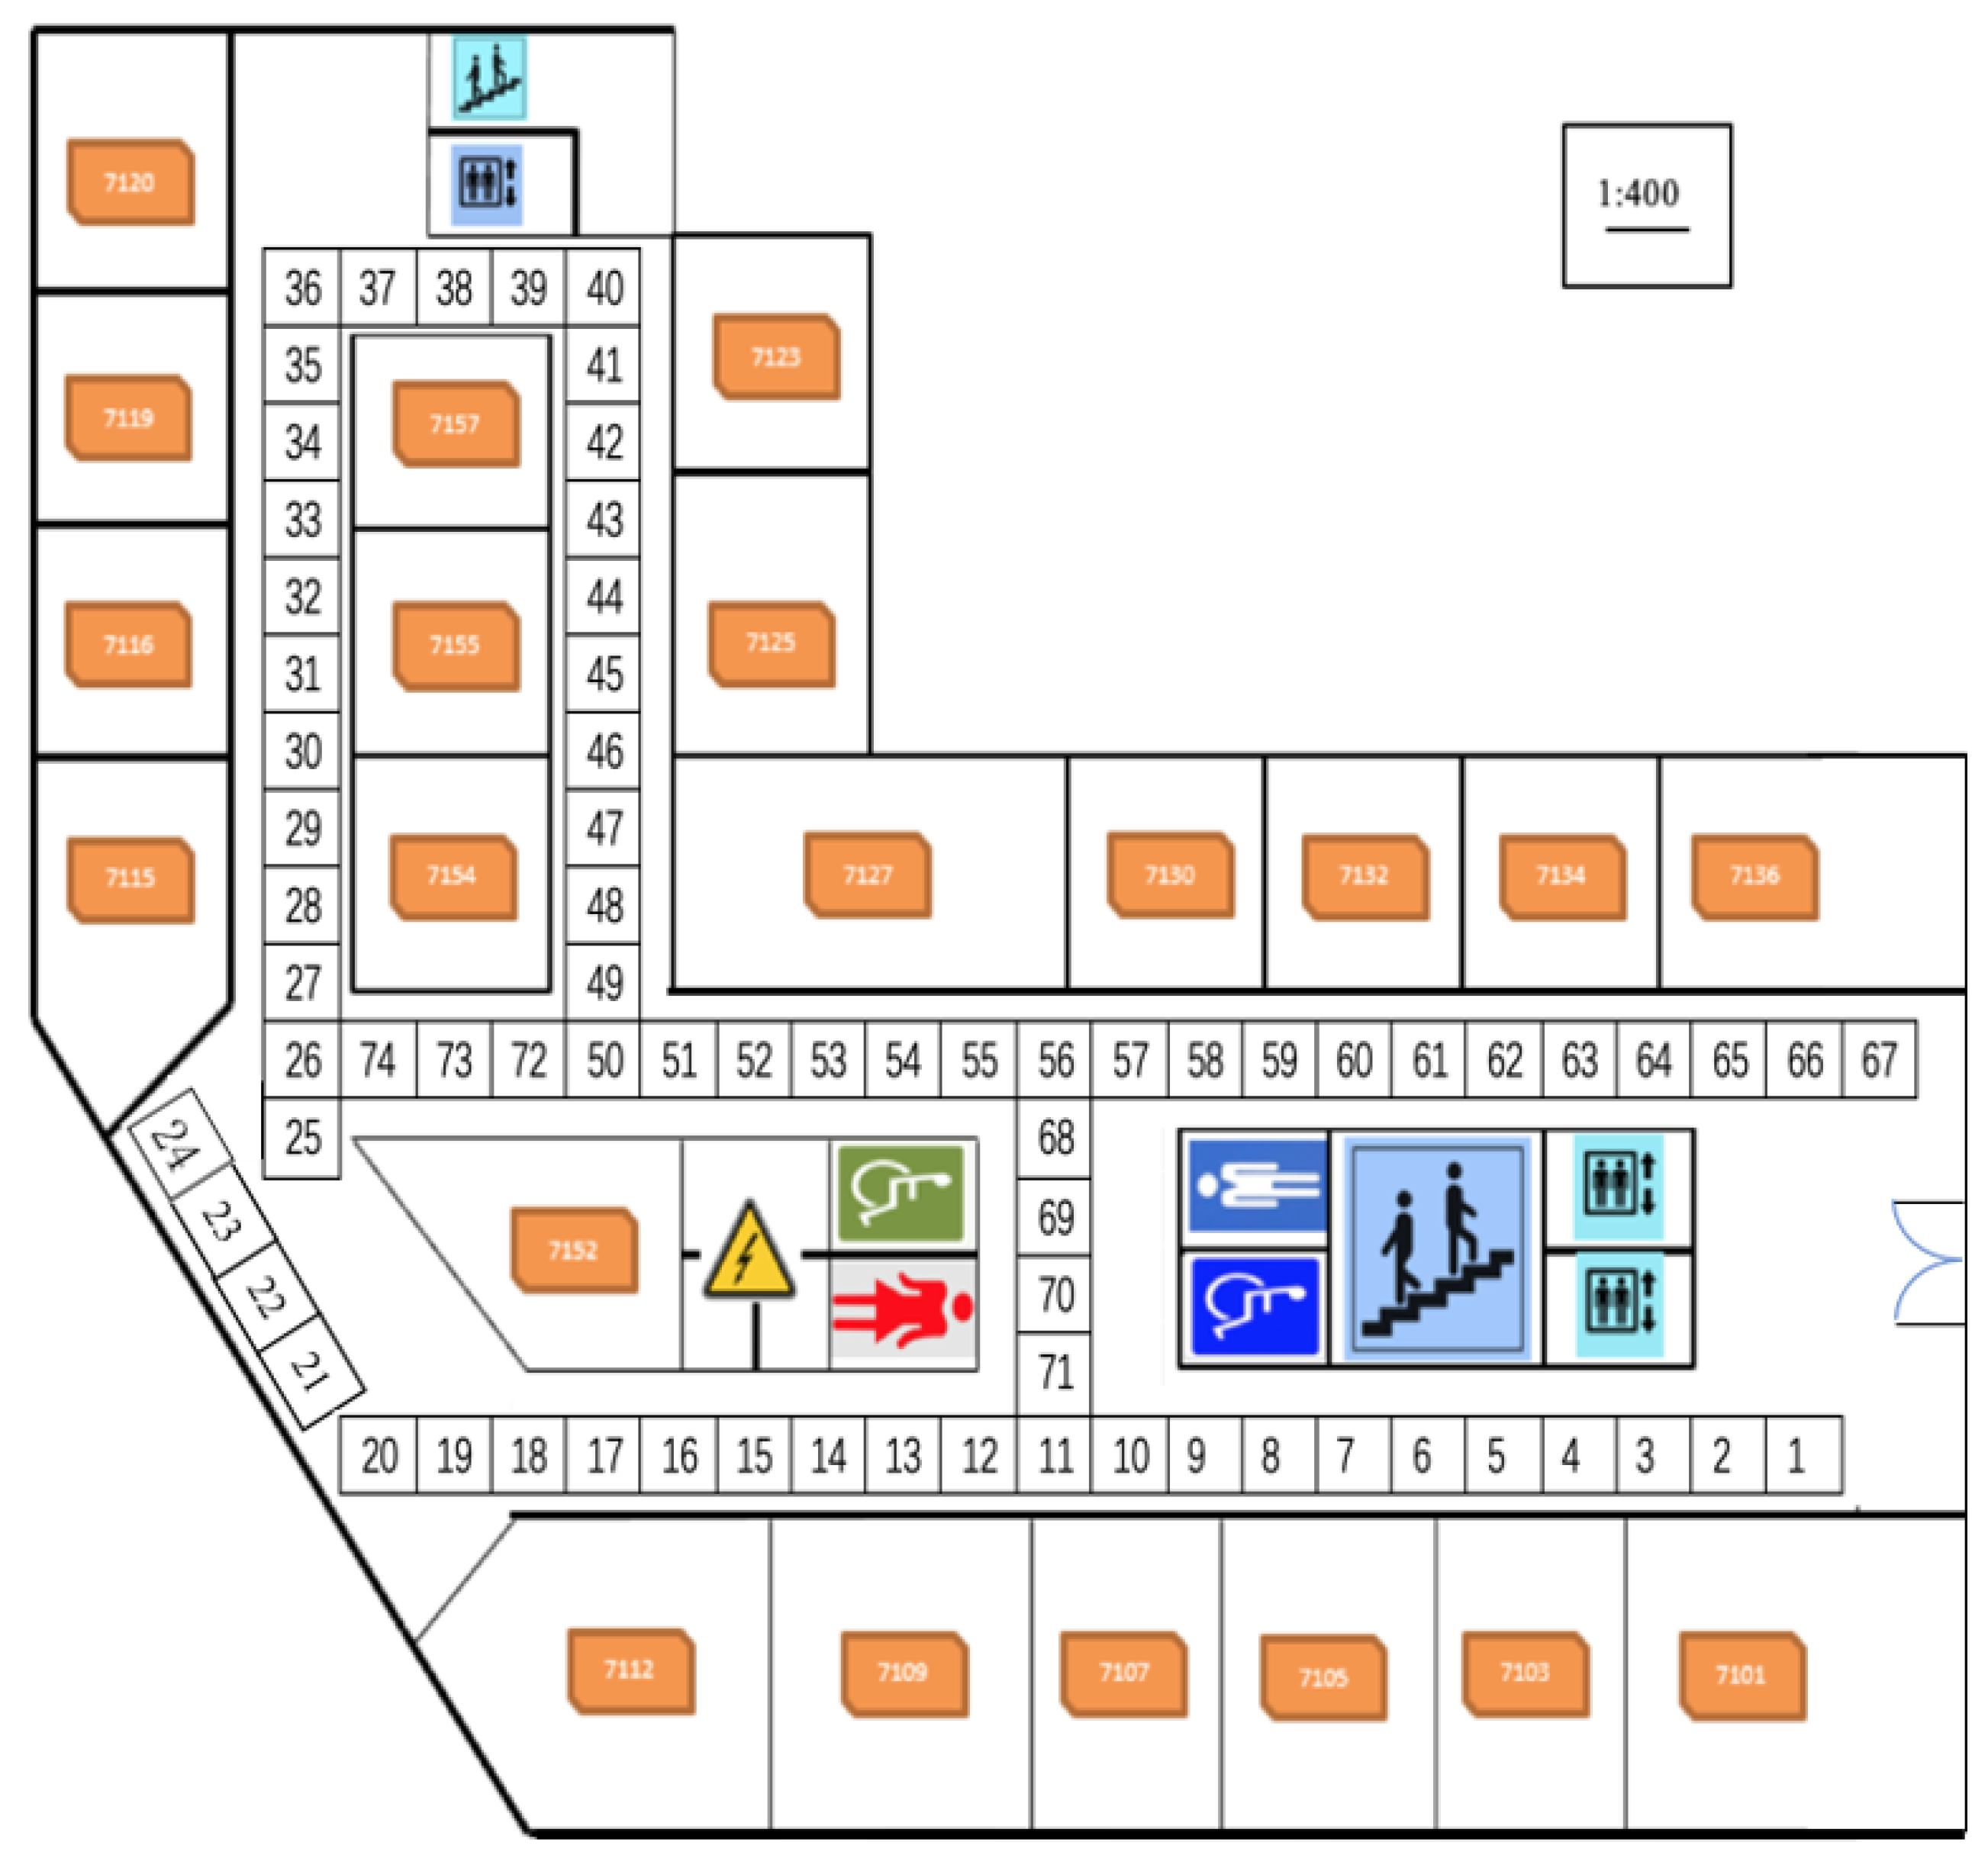
2.1. Environment Setup
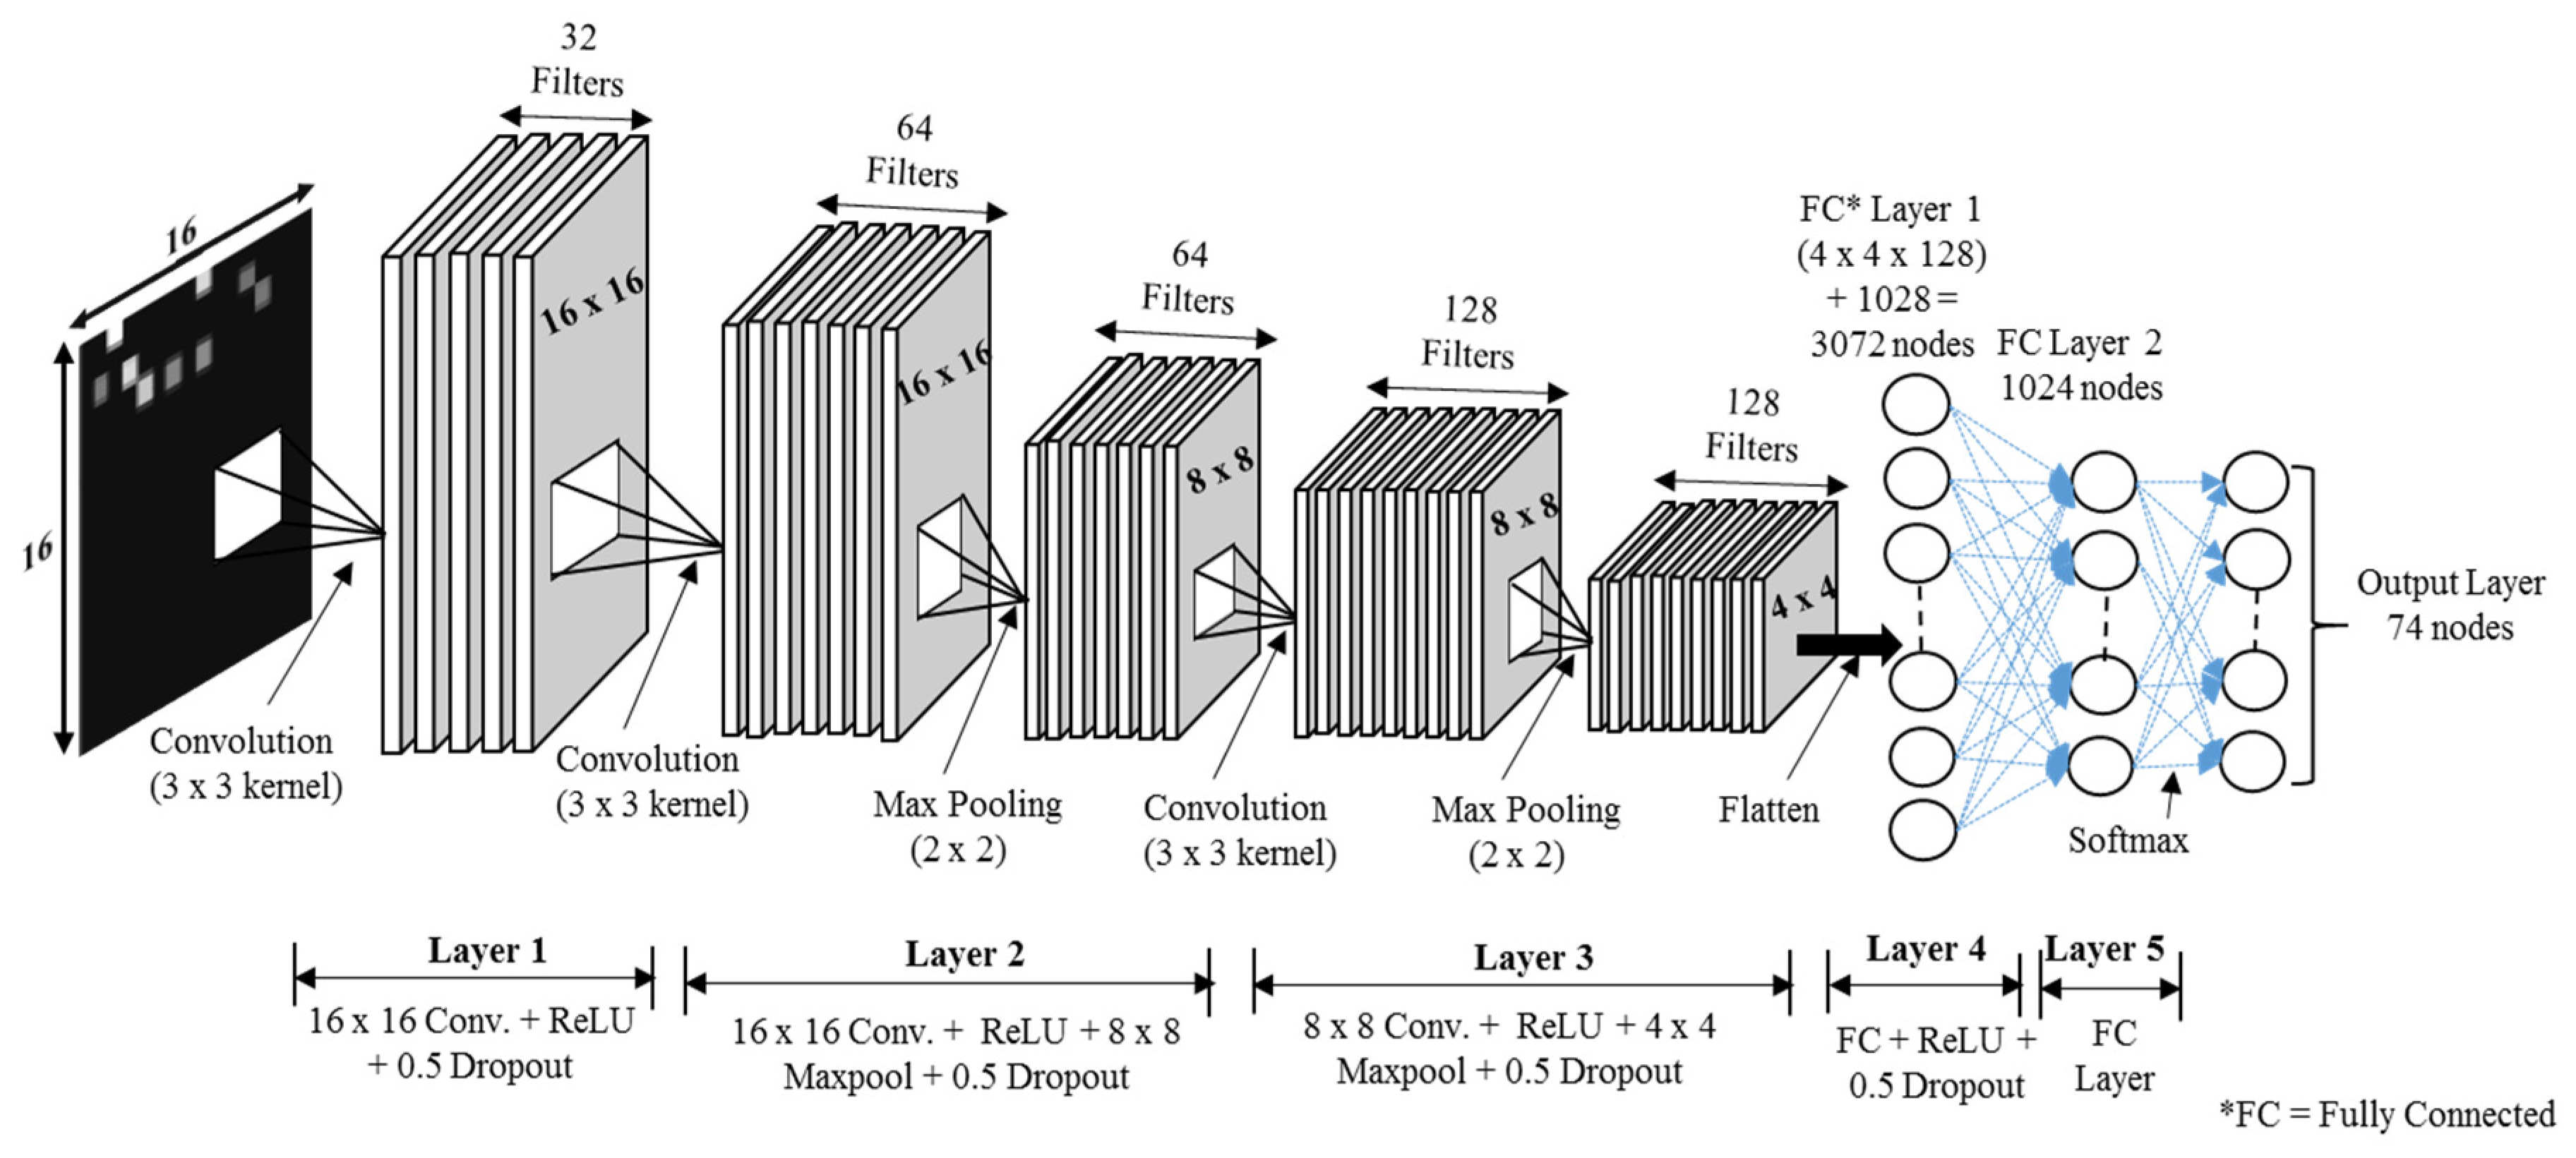
2.2. CNN Model and Data Augmentation
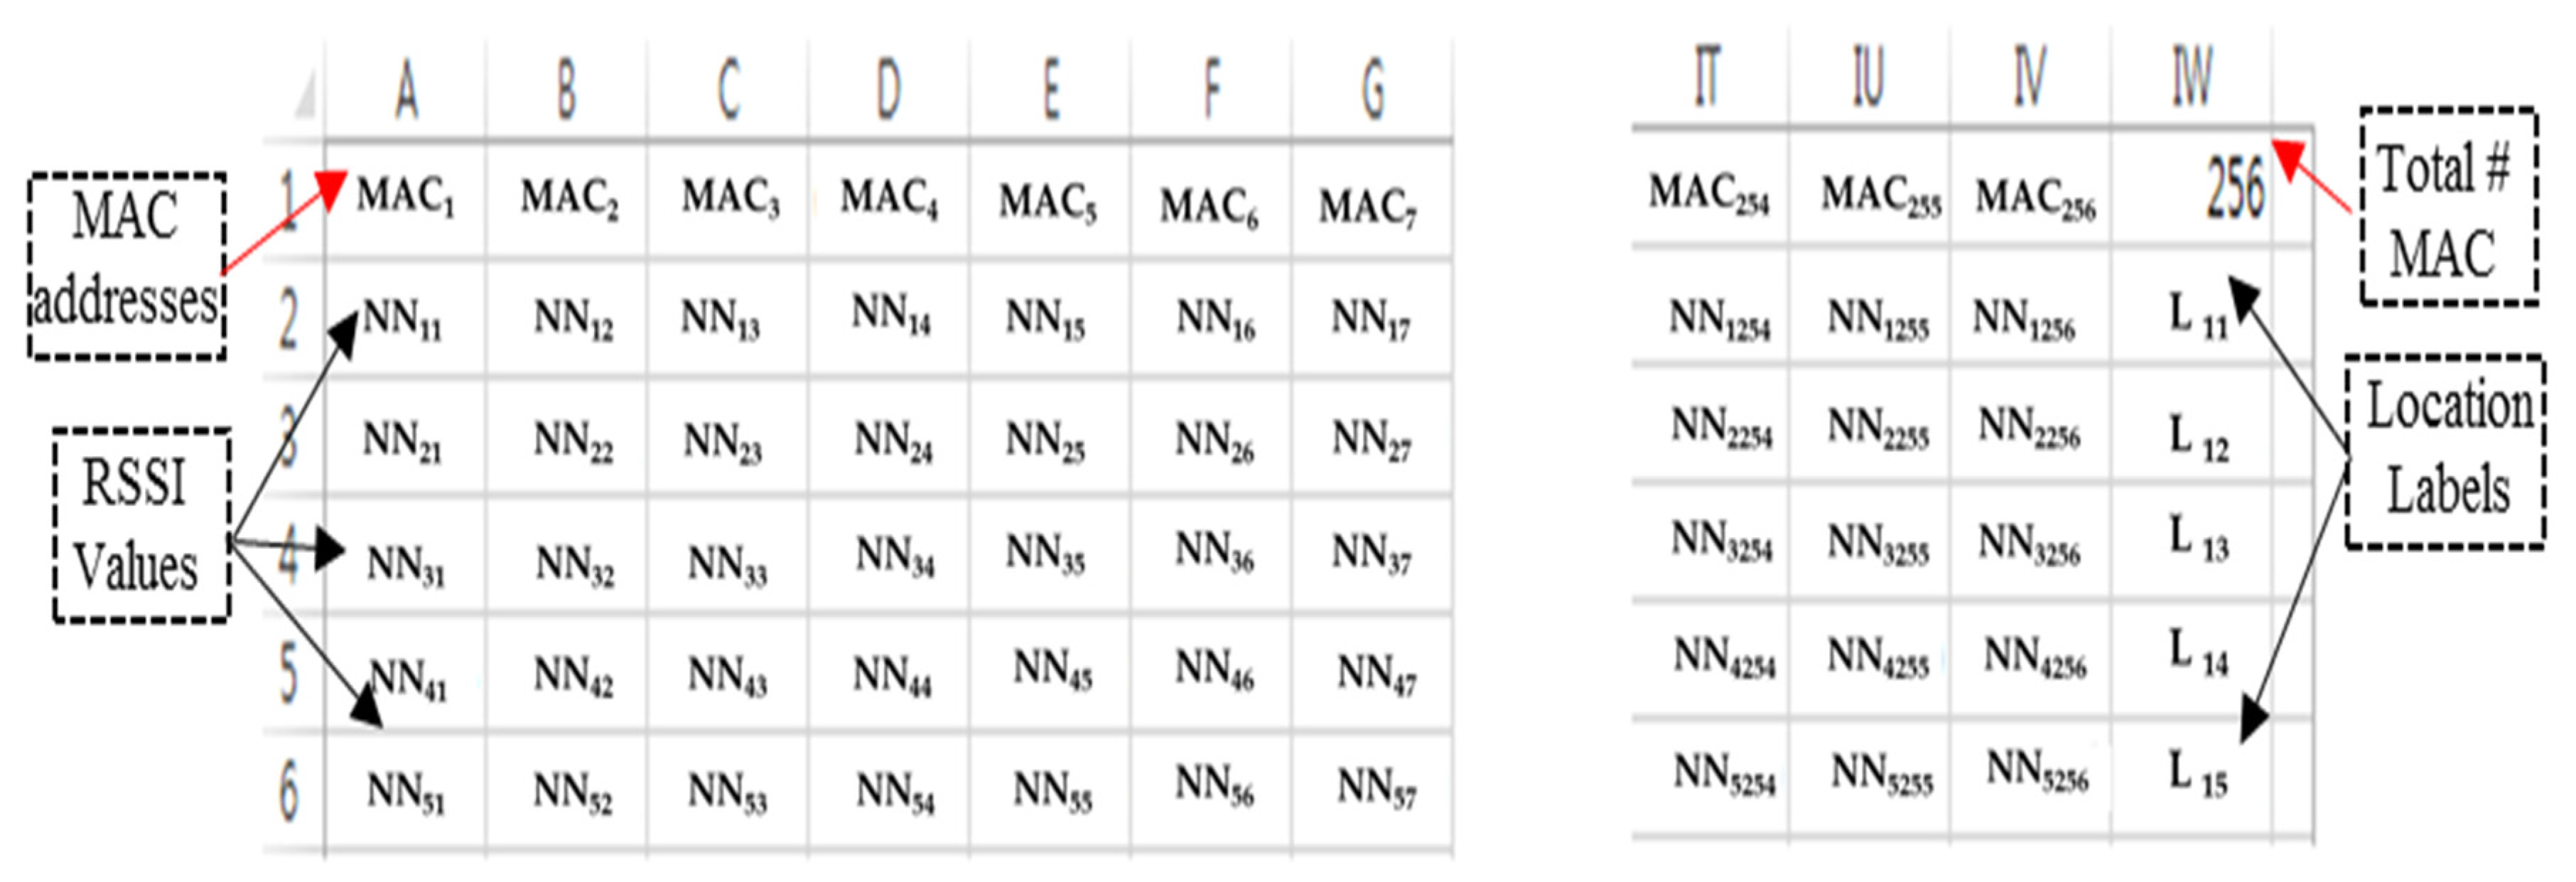
2.3. RSSI Database Setup
2.4. Side-Information-Aided Preprocessing Scheme
3. Numerical Results
3.1. Simulation Results
3.2. Experimental Results
4. Conclusions
Author Contributions
Funding
Acknowledgments
Conflicts of Interest
References
- Basri, C.; El Khadimi, A. Survey on Indoor Localization System and Recent Advances of WIFI Fingerprinting Technique. In Proceedings of the IEEE 5th International Conference on Multimedia Computing and Systems (ICMCS), Marrakech, Morocco, 29 September–1 October 2016; pp. 253–259. [Google Scholar]
- Sithole, G.; Zlatanova, S. Position, location, place and area: An indoor perspective. ISPRS Ann. Photogramm. Remote Sens. Spat. Inf. Sci 2016, 3, 89. [Google Scholar] [CrossRef]
- Zafari, F.; Gkelias, A.; Leung, K.K. A survey of indoor localization systems and technologies. IEEE Commun. Surv. Tutor. 2019, 21, 2568–2599. [Google Scholar] [CrossRef]
- Kitasuka, T.; Nakanishi, T.; Fukuda, A. Wireless LAN Based Indoor Positioning System WiPS and Its Simulation. In Proceedings of the 2003 IEEE Pacific Rim Conference on Communications Computers and Signal Processing (PACRIM 2003), Victoria, BC, Canada, 28–30 August 2003; pp. 272–275. [Google Scholar]
- Wang, H.P.; Jia, F. A Hybrid Modeling for WLAN Positioning System. In Proceedings of the 2007 International Conference on Wireless Communications, Networking and Mobile Computing, Shanghai, China, 21 September 2007; pp. 2152–2155. [Google Scholar]
- Sinha, R.S.; Lee, S.M.; Rim, M.; Hwang, S.H. Data augmentation schemes for deep learning in an indoor positioning application. Electronics 2019, 8, 554. [Google Scholar] [CrossRef]
- Haider, A.; Wei, Y.; Liu, S.; Hwang, S.H. Pre-and post-processing algorithms with deep learning classifier for Wi-Fi fingerprint-based indoor positioning. Electronics 2019, 8, 195. [Google Scholar] [CrossRef]
- Chishti, S.O.; Riaz, S.; Zaib, M.B.; Nauman, M. Self-Driving Cars Using CNN and Q-Learning. In Proceedings of the 2018 IEEE 21st International Multi-Topic Conference (INMIC), Karachi, Pakistan, 1–2 December 2018; pp. 1–7. [Google Scholar]
- Song, X.; Fan, X.; Xiang, C.; Ye, Q.; Liu, L.; Wang, Z.; He, X.; Yang, N.; Fang, G. A novel convolutional neural network based indoor localization framework with WiFi fingerprinting. IEEE Access 2019, 7, 110698–110709. [Google Scholar] [CrossRef]
- Sinha, R.S.; Hwang, S.H. Comparison of CNN applications for RSSI-based fingerprint indoor localization. Electronics 2019, 8, 989. [Google Scholar] [CrossRef]
- Liu, K.; Wang, Y.; Lin, L.; Chen, G. An analysis of impact factors for positioning performance in WLAN fingerprinting systems using Ishikawa diagrams and a simulation platform. Mob. Inf. Syst 2017, 2017, 8294248. [Google Scholar] [CrossRef]
- Xia, S.; Liu, Y.; Yuan, G.; Wang, Z. Indoor fingerprint positioning based on Wi-Fi: An overview. ISPRS Int. J. Geo-Inf. 2017, 6, 135. [Google Scholar] [CrossRef]
- Çaliş, G.; Becerik-Gerber, B.; Göktepe, A.B. Analysis of the variability of RSSI values for active RFID-based indoor applications. Turk J. Eng. Environ. Sci. 2013, 37, 186–210. [Google Scholar] [CrossRef]
- Lin, Q.; Xu, Y.; Zhou, M.; Deng, Z.-A.; Liang, Y. Characteristics of Fingerprint Location Technology in WLAN Environment. In Proceedings of the 2009 International Forum on Information Technology and Applications, Chengdu, China, 15–17 May 2009; pp. 40–43. [Google Scholar]
- Liu, Y.; Wei, Y.; Sinha, R.S.; Hwang, S.H. Influence of Test Methods on Wi-Fi Fingerprint-Based Indoor Positioning System. In Proceedings of the KICS Winter Conference, Yongpyeong, Korea, 23–25 January 2019; pp. 378–379. [Google Scholar]
- Liu, S.Z.; Haider, A.; Hwang, S.H. Impact of Test Environment on the Accuracy of Wi-Fi Fingerprint-Based Indoor Positioning System. In Proceedings of the KICS Winter Conference, Yongpyeong, Korea, 23–25 January 2019; pp. 380–381. [Google Scholar]
- Xu, J.; Zhang, H.; Zhang, J. Self-Adapting Multi-Fingerprints Joint Indoor Positioning Algorithm in WLAN Based on Database of AP ID. In Proceedings of the IEEE 33rd Chinese Control Conference, Nanjing, China, 28–30 July 2014; pp. 534–538. [Google Scholar]
- Zheng, Z.; Chen, Y.; He, T.; Sun, L.; Chen, D. Feature learning for fingerprint-based positioning in indoor environment. Int. J. Distr. Sens. Netw. 2015, 11, 452590. [Google Scholar] [CrossRef]
- Song, J.; Hur, S.; Park, Y.; Choi, J. An Improved RSSI of Geomagnetic Field-Based Indoor Positioning Method Involving Efficient Database Generation by Building Materials. In Proceedings of the 2016 IEEE International Conference on Indoor Positioning and Indoor Navigation (IPIN), Alcala de Henares, Spain, 4–7 October 2016; pp. 1–8. [Google Scholar]
- Wen, X.; Tao, W.; Own, C.M.; Pan, Z. On the dynamic RSSI feedbacks of indoor fingerprinting databases for localization reliability improvement. Sensors 2016, 16, 1278. [Google Scholar] [CrossRef] [PubMed]
- DeVries, T.; Taylor, G.W. Dataset augmentation in feature space. arXiv 2017, arXiv:1702.05538. [Google Scholar]
- Zhao, F.; Luo, H.Y.; Lin, Q.; Ma, Y. Node localization algorithm based on kernel function and Markov chains. J. China Inst. Commun. 2010, 31, 195–204. [Google Scholar]
- Liu, H.; Darabi, H.; Banerjee, P.; Liu, J. Survey of wireless indoor positioning techniques and systems. IEEE Trans. Syst. Man Cybern. Part C 2007, 37, 1067–1080. [Google Scholar] [CrossRef]


| Data Set | Forward | Backward | Number of Data Files |
|---|---|---|---|
| Morning | MF1, MF2, …, MF7 | MB1, MB2, …, MB7 | 14 |
| Afternoon | AF1, AF2, …, AF7 | AB1, AB2, …, AB7 | 14 |
| Number of Data Files | 14 | 14 | - |
| Data Set | Database | |
|---|---|---|
| Training | Test | |
| Morning | 13 data files | 1 data file |
| Afternoon | 13 data files | 1 data file |
| Forward | 13 data files | 1 data file |
| Backward | 13 data files | 1 data file |
| Convention | 24 data files | 4 data file |
| Simulation | Experiment | |||
|---|---|---|---|---|
| Training Database | Test Database | Trained Classifier | Test Timing, Direction | |
| case 1 | Morning | Morning | Morning | Morning (Forward/Backward) |
| case 2 | Afternoon | Afternoon | Afternoon | Afternoon (Forward/Backward) |
| case 3 | Forward | Forward | Forward | Forward (Morning/Afternoon) |
| case 4 | Backward | Backward | Backward | Backward (Morning/Afternoon) |
| Proposed Scheme | Conventional Scheme | ||||
|---|---|---|---|---|---|
| Margin | Case 1 | Case2 | Case3 | Case4 | |
| 0 | 46.38% | 45.58% | 49.86% | 50.03% | 41.62% |
| 1 | 79.89% | 78.65% | 80.76% | 80.49% | 73.85% |
| 2 | 92.64% | 91.06% | 89.16% | 90.51% | 86.09% |
| NO. | Decision # | # of Success Decisions | ||||||
|---|---|---|---|---|---|---|---|---|
| RF# | #1 | #2 | #3 | #4 | #5 | 0 Margin | 1 Margin | 2 Margin |
| 1 | 1 | 1 | 1 | 1 | 1 | 5 | 5 | 5 |
| 2 | 2 | 3 | 3 | 2 | 2 | 3 | 5 | 5 |
| 3 | 2 | 4 | 2 | 2 | 2 | 0 | 5 | 5 |
| 73 | 73 | 26 | 73 | 73 | 72 | 3 | 4 | 5 |
| 74 | 73 | 74 | 73 | 73 | 73 | 1 | 5 | 5 |
| Experiment Success Rate (%) | 27.57 | 71.08 | 88.11 | |||||
| Proposed Scheme | Conventional Scheme | |||||||
|---|---|---|---|---|---|---|---|---|
| Margin | 0 | 1 | 2 | 0 | 1 | 2 | ||
| Case 1 | Day 1 | Forward | 27.57 | 71.08 | 88.11 | 33.51 | 69.46 | 85.41 |
| Backward | 35.95 | 77.03 | 93.24 | 25.41 | 67.84 | 85.14 | ||
| Day 2 | Forward | 28.65 | 71.62 | 89.73 | 34.32 | 70.54 | 86.49 | |
| Backward | 34.59 | 75.95 | 92.16 | 26.22 | 68.65 | 86.22 | ||
| Case 2 | Day 1 | Forward | 34.32 | 73.78 | 88.65 | 33.24 | 70.27 | 82.43 |
| Backward | 30.00 | 71.62 | 90.27 | 33.78 | 73.78 | 87.03 | ||
| Day 2 | Forward | 34.86 | 75.95 | 89.73 | 31.08 | 64.86 | 83.24 | |
| Backward | 28.38 | 69.73 | 89.46 | 28.65 | 70.54 | 85.68 | ||
| Case 3 | Day 1 | Morning | 46.76 | 81.08 | 89.46 | 33.51 | 69.46 | 85.41 |
| Afternoon | 48.65 | 81.35 | 89.19 | 33.24 | 70.27 | 82.43 | ||
| Day 2 | Morning | 42.16 | 76.22 | 91.62 | 34.32 | 70.54 | 86.49 | |
| Afternoon | 49.46 | 82.16 | 90.00 | 31.08 | 64.86 | 83.24 | ||
| Case 4 | Day 1 | Morning | 43.78 | 83.24 | 94.59 | 25.41 | 67.84 | 85.14 |
| Afternoon | 42.70 | 82.16 | 93.78 | 33.78 | 73.78 | 87.03 | ||
| Day 2 | Morning | 47.57 | 78.38 | 88.11 | 26.22 | 68.65 | 86.22 | |
| Afternoon | 40.27 | 78.11 | 90.81 | 28.65 | 70.54 | 85.68 | ||
| Proposed Scheme | Conventional Scheme | Difference | ||
|---|---|---|---|---|
| Case 1 | 0 Margin | 31.69% | 29.87% | 1.82% |
| 1 Margin | 73.92% | 69.12% | 4.80% | |
| 2 Margin | 90.81% | 85.82% | 4.99% | |
| Case 2 | 0 Margin | 31.89% | 31.69% | 0.20% |
| 1 Margin | 72.77% | 69.86% | 2.91% | |
| 2 Margin | 89.53% | 84.60% | 4.93% | |
| Case 3 | 0 Margin | 46.76% | 33.04% | 13.72% |
| 1 Margin | 80.20% | 68.78% | 11.42% | |
| 2 Margin | 90.07% | 84.39% | 5.68% | |
| Case 4 | 0 Margin | 43.58% | 28.52% | 15.06% |
| 1 Margin | 80.47% | 70.20% | 10.27% | |
| 2 Margin | 91.82% | 86.02% | 5.8% |
© 2020 by the authors. Licensee MDPI, Basel, Switzerland. This article is an open access article distributed under the terms and conditions of the Creative Commons Attribution (CC BY) license (http://creativecommons.org/licenses/by/4.0/).
Share and Cite
Liu, Y.; Sinha, R.S.; Liu, S.-Z.; Hwang, S.-H. Side-Information-Aided Preprocessing Scheme for Deep-Learning Classifier in Fingerprint-Based Indoor Positioning. Electronics 2020, 9, 982. https://doi.org/10.3390/electronics9060982
Liu Y, Sinha RS, Liu S-Z, Hwang S-H. Side-Information-Aided Preprocessing Scheme for Deep-Learning Classifier in Fingerprint-Based Indoor Positioning. Electronics. 2020; 9(6):982. https://doi.org/10.3390/electronics9060982
Chicago/Turabian StyleLiu, Yue, Rashmi Sharan Sinha, Shu-Zhi Liu, and Seung-Hoon Hwang. 2020. "Side-Information-Aided Preprocessing Scheme for Deep-Learning Classifier in Fingerprint-Based Indoor Positioning" Electronics 9, no. 6: 982. https://doi.org/10.3390/electronics9060982
APA StyleLiu, Y., Sinha, R. S., Liu, S.-Z., & Hwang, S.-H. (2020). Side-Information-Aided Preprocessing Scheme for Deep-Learning Classifier in Fingerprint-Based Indoor Positioning. Electronics, 9(6), 982. https://doi.org/10.3390/electronics9060982