Article

Utilisation of Embodied Agents in the Design of Smart Human–Computer Interfaces—A Case Study in Cyberspace Event Visualisation Control

by
Wojciech Szynkiewicz
,
Włodzimierz Kasprzak
*,†,
Cezary Zieliński
,
Wojciech Dudek
,
Maciej Stefańczyk
,
Artur Wilkowski
and
Maksym Figat
Warsaw University of Technology, Nowowiejska 15/19, 00-665 Warszawa, Poland
*
Author to whom correspondence should be addressed.
These authors contributed equally to this work.
Electronics 2020, 9(6), 976; https://doi.org/10.3390/electronics9060976
Submission received: 1 April 2020 / Revised: 20 May 2020 / Accepted: 8 June 2020 / Published: 11 June 2020
(This article belongs to the Special Issue Computer Vision and Machine Learning in Human-Computer Interaction)

Abstract

:
The goal of the research reported here was to investigate whether the design methodology utilising embodied agents can be applied to produce a multi-modal human–computer interface for cyberspace events visualisation control. This methodology requires that the designed system structure be defined in terms of cooperating agents having well-defined internal components exhibiting specified behaviours. System activities are defined in terms of finite state machines and behaviours parameterised by transition functions. In the investigated case the multi-modal interface is a component of the Operational Centre which is a part of the National Cybersecurity Platform. Embodied agents have been successfully used in the design of robotic systems. However robots operate in physical environments, while cyberspace events visualisation involves cyberspace, thus the applied design methodology required a different definition of the environment. It had to encompass the physical environment in which the operator acts and the computer screen where the results of those actions are presented. Smart human–computer interaction (HCI) is a time-aware, dynamic process in which two parties communicate via different modalities, e.g., voice, gesture, eye movement. The use of computer vision and machine intelligence techniques are essential when the human is carrying an exhausting and concentration demanding activity. The main role of this interface is to support security analysts and operators controlling visualisation of cyberspace events like incidents or cyber attacks especially when manipulating graphical information. Visualisation control modalities include visual gesture- and voice-based commands.

1. Introduction

From the point of view of a human–computer interface (HCI), an operator is perceived as an element of the environment. The operator interacts with the HCI through such computer input/output devices as keyboards, mice, microphones, monitors, loudspeakers or touchpads. All those devices can be treated either as receptors or effectors of the HCI. This closely resembles robotic systems where receptors are sensors gathering information about the state of the environment and effectors are devices influencing that state. Structurally both types of systems are very similar. Receptors acquire information from the environment and provide it to the control system, which is aware of the task that it should carry out. Based on this combined information the control system produces commands for the effectors influencing the environment. The control loop is being closed through the environment. As both the structure and the behaviour of robotic systems and HCIs resemble each other it is reasonable to use the same design approach in both cases.
The foundation of both HCI and robot control systems is software, thus a glimpse at what design options are being offered by software engineering is beneficial. Software engineering based on Edsger Dijkstra’s postulate of separation of concerns [1]. First and foremost, system specification should be separated from its implementation, i.e., separate what should be done from how it should be done, thus system design should start from building its model, and only once it is created implementation commences. In addition, this postulate implies system decomposition into modules. As Tom Harbron stated the granularity of decomposition should be such that the designed program modules are at all times within the intellectual grasp of the programmer [2]. Implementation is much simpler if it results in a straightforward fashion from the specification, thus creation of a modular system model facilitates its subsequent implementation. One of the ways of building system models is to construct them out of agents. The popularity of agent architectures is due to inherent system modularisation and loose coupling of the agents, thus strict conformance with the Dijkstra’s postulate.

1.1. Cybersecurity Data Visualisation

This paper shows how embodied agents facilitate the design and implementation of a HCI to a cybersecurity data visualisation system. Cybersecurity refers to a set of techniques, tools, practices and controls designed to protect the integrity of computer networks, programs, data and complex cyber-physical systems [3] against cyber-attacks, damage or unauthorised access. The goal is to secure the network infrastructure used by state agencies, private corporations and individual users against cyber terrorism, cyber crime and cyber war. The priority is to prevent cyber attacks, and if they do occur to mitigate their consequences. The primary goal is to prevent data leaks and denial of services provided by the network. Therefore, appropriate tools are needed to detect, prevent and minimise the effects of activities that violate the security of ICT infrastructure that is important for the effective functioning of the country and its citizens.
Comprehensive network activity analysis requires the detection of correlation of events occurring in the cyberspace, situational awareness as well as dynamic and static risk analysis. To develop a useful and effective tool for such an analysis appropriate methods and techniques for multidimensional data visualisation are needed [4,5,6]. Visualisation is one of the most useful tools for network administrators and cyber security analysts to cope with the scale and complexity of huge amount of data (Figure 1). By gathering appropriate data from multiple sources and visualising it logically, situational awareness is increased and incidents can be easily communicated to the users who need this information, and thus the incident can be addressed adequately. This is emphasised in [7] where the authors point out that clear understanding of the users’ needs and addressing their requirements are critical factors to successfully develop insightful visualisations. Majority of the visualisation systems tries to manifest the identification of incidents, because the main goal of any network security visualisation is to augment cyber security administrators’ abilities to identify network attacks. Moreover, network security visualisation systems are commonly designed by using the use case approach to address distinct problems.
Visual representation and interaction methods are critical to the utility of visualisation systems. Dimensionality of the visualisation space and use of the physical time are two main features of visual representations. The representation space of the visualisation system can be either two- (2D) or three-dimensional (3D), and time dimension can be used to create static or dynamic visualisations. The majority of visualisation systems uses 2D displays to illustrate network traffic and cyber attacks [6].
An online visual analysis system called OCEANS [8] was developed for close collaboration among security analysts to provide situational awareness. It uses heterogeneous data sources and provides a multi-level visualisation presenting temporal overview, IP connections. OCEANS has a timeline, a ring graph and a connection river, integrated into one collaboration platform with a submission page, a commenting panel and an event graph.
McKenna et al. developed an interactive realtime dashboard called BubbleNet [9], for visualising patterns in cybersecurity data, to assist analysts in detecting patterns in network activity data and detecting anomalies. This dashboard presents security data in diverse views: a view of the location in the form of a cartographic map with spatial information encoded as bubble charts, time view in the form of bar graphs and the view of attributes that graphically represent different data attributes.
In [10], a visual analysis system, Voila, for interactively detecting anomalies in spatiotemporal data from a streaming source was presented. The interactive graphical user interface of this system consists of eight main views, including macro and micro-maps, pattern time view and a feature inspection view. The user can select the area on the macro-map with the mouse and display the list of anomalies detected for this area on the micro-map. It can also perform zooming and shifting operations and changing the display mode on both maps.
The VisIDAC [11] system enables real-time visualisation of 3D data of security event log collection detected by intrusion detection systems installed in many networks. Event data are displayed in a graphical form on three panels: for global source networks, target networks and global destination networks. In order to easily distinguish types of events, different shapes and colours are used. It helps security analysts to immediately understand the key properties of security events.

1.2. Human–Computer Interface to Cybersecurity Data Visualisation

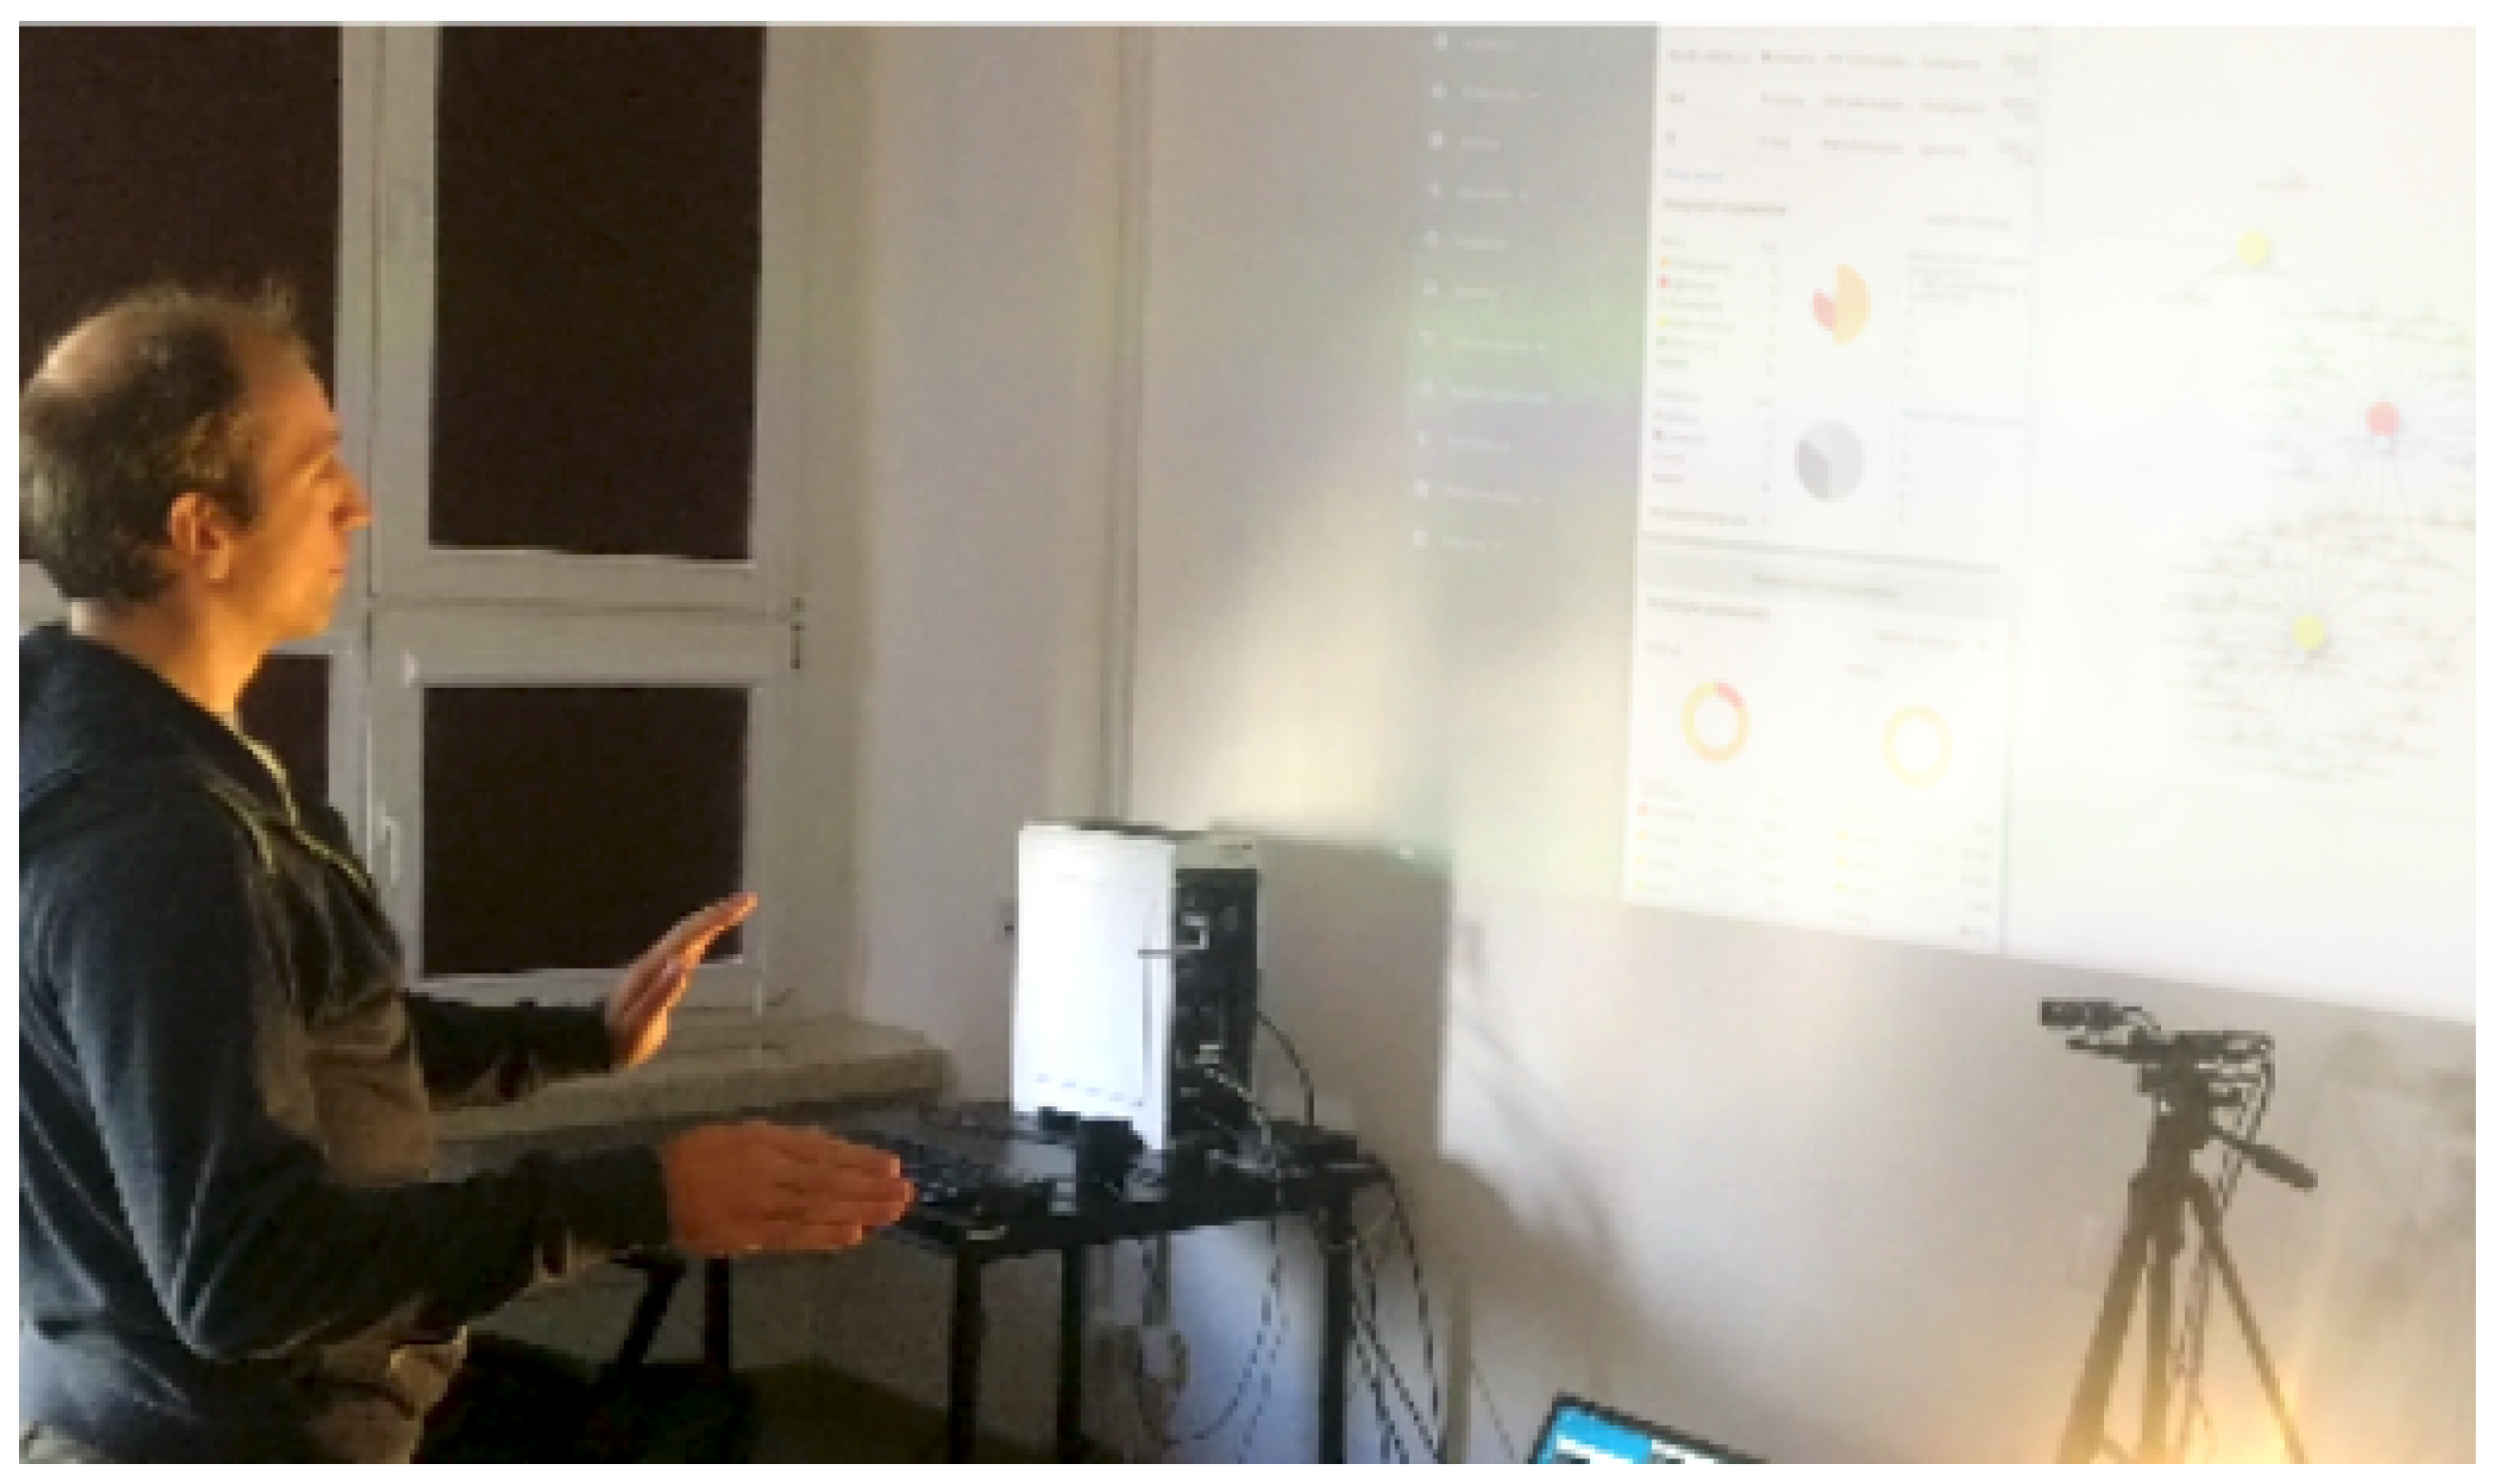
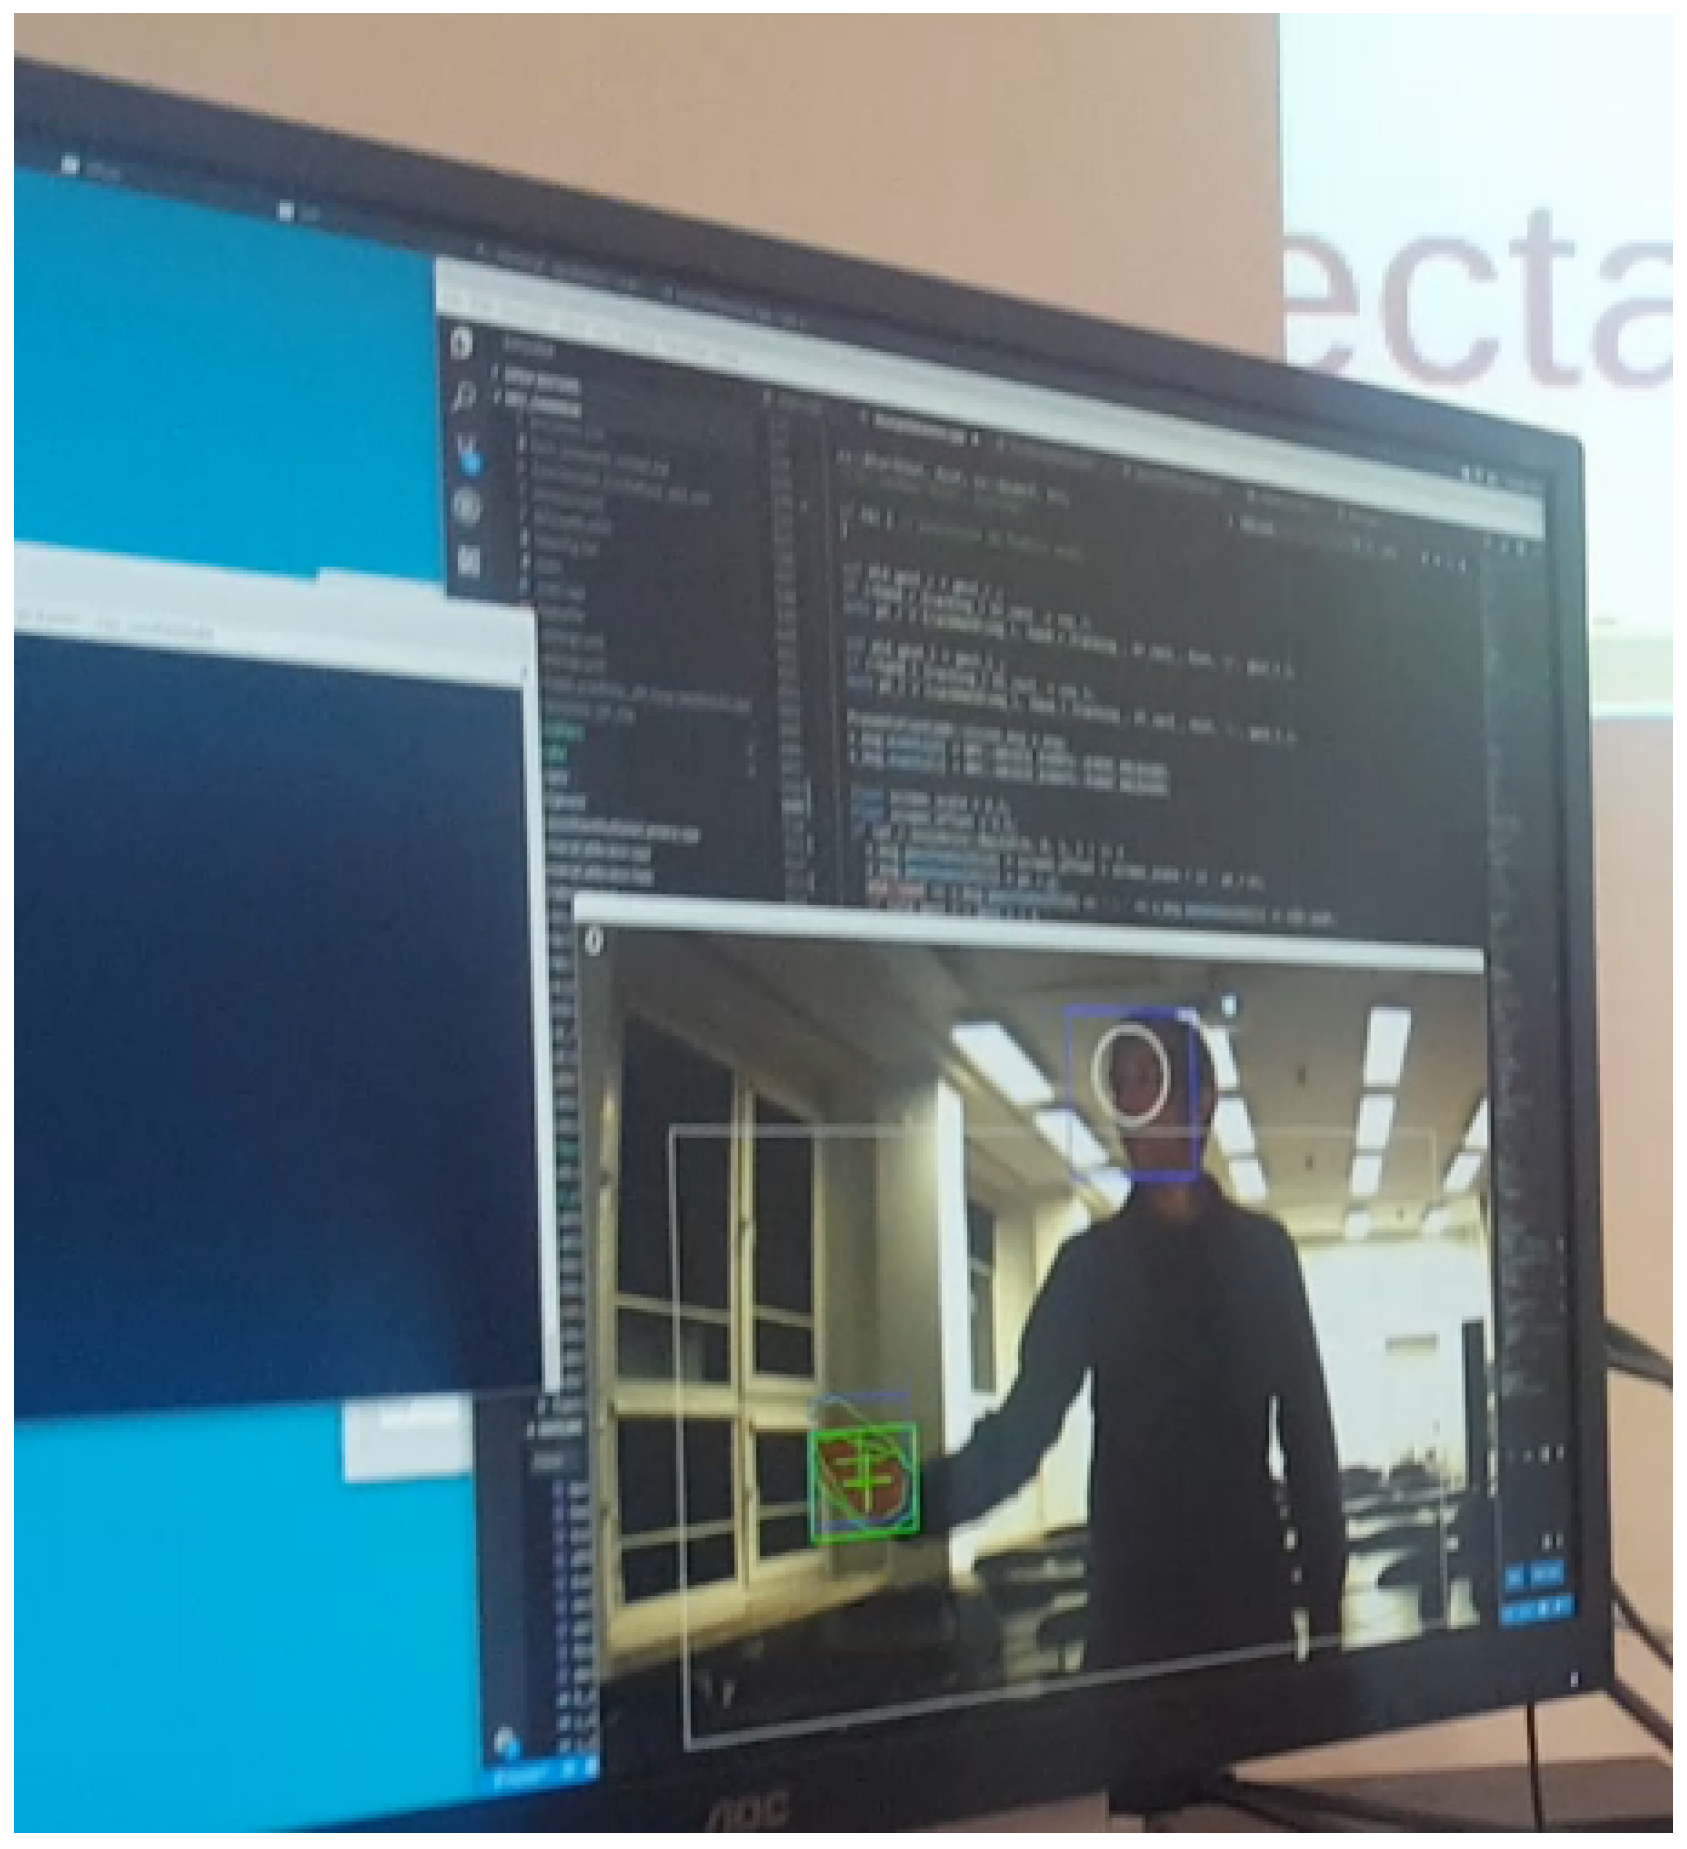
The development of a system to monitor cybersecurity of computer networks entails the necessity to create an interface enabling intelligent control of multidimensional visualisation of events occurring in cyberspace. Standard interfaces utilise keyboards and mice as input devices and computer monitors as output devices. Touchpads are also used, having the characteristics of both input and output devices. However all of those devices require that the operator be sited. Maintaining this pose during an eight-hour work-shift stresses the muscles and joints of the operator. As a result musculoskeletal disorders appear [12,13,14,15]. As a remedy frequent physical exercises are advised. However, that disrupts the normal functioning of the operator. To combine physical activity, requiring a change of body posture, with constant monitoring of cybersecurity events, an alternative way of commanding the system has to be used. As auxiliary input device’s cameras and microphones can be employed (Figure 2). The former enable gesture commands, while the latter enable voice commands. A multi-modal interface containing all of the mentioned input devices solves the health hazard problem and provides other opportunities, such as operator identification or an elegant way of presenting the network state to the onlookers. The main challenge of multimodal human–machine interface creation is to build reliable processing systems able to analyse and understand multiple communication means in real-time [16]. Majority of HCIs used in cybersecurity applications are the so-called Windows, Icons, Menus and a Pointer (WIMP) interfaces that utilise traditional keyboard, mouse and desktop setup [17].
Nunnally et al. [18] developed a tool called InterSec, an interaction system prototype for interacting with a complex 3D network security visualisations using gestures. InterSec uses Kinect, Leap Motion and multi-touch sensors as input devices, and provides a system for handling gestures, tailored specifically to cybersecurity that would allow both the reduction of interactions to detect and identify network attacks. It enables the user to perform several gestures simultaneously in order to convey multiple tasks at one time with fewer interactions.

1.3. Agents

The concept of an agent stemmed from the idea of an actor, i.e., a model of concurrent computational element in distributed systems [19], and gained popularity in the 90-ties of the 20th century. Wooldridge and Jennings defined it very generally as a computer system that is situated in some environment, and is capable of autonomous action in that environment in order to meet its own design objectives [20]. Since then many definitions of an agent have been coined. The majority of them specify properties that an agent should possess. Nwana et al. [21] proposed a classification of agents based on different criteria. Thus agents can be: mobile or static, depending on whether they can relocate themselves in the network; deliberative or reactive, depending on whether they employ a symbolic reasoning model or simply react to the input without reasoning based on the world model, hybrid agents utilise both approaches; autonomous, if they can act on their own, i.e., without human guidance; capable of learning, thus improving their performance; cooperating, i.e., interacting with other agents; Internet agents, i.e., operating in the Internet; interface agents, i.e., personal assistants collaborating with the user etc. Padgham and Winikoff [22] proposed that an intelligent agent is a piece of software that is: situated (exists in a certain environment), autonomous (is not controlled externally), reactive (responds timely to events in the environment), proactive (pursues goals of its own accord), flexible (can achieve goals in many ways), robust (able to recover from failure), social (interacts with other agents).
Agents have gained significant popularity in the area of modelling and simulation. The work on modelling and simulation in diverse domains concentrated on distributed problem solving. Its generalisation resulted in the concept of an agent, and subsequently led to the interest in multi-agent systems (MAS) [23]. MAS application areas are multiple, e.g., cloud computing (agent based management of resources), social networking (analysis of network user activity), security (agents collecting and analysing data to detect network security threats), routing (finding a path for packets), robotics (multi-robot exploration, robot swarms), modelling complex systems (rule based description rather than dynamics equations), city and building infrastructure. A plethora of tools assisting the implementation of such systems has emerged [24,25]. Those tools, among others, enable the evaluation of performance of the created MAS. Although the utility of those tools is unquestionable, they do not provide guidelines on how to produce the required behaviour of an agent based systems, except the general observation that the overall behaviour is emergent and is not a simple sum of behaviours of individuals. Such guidelines do not suffice in the case of designing agent based HCIs, thus this paper focuses on the agent based HCI design methodology, not neglecting the implementation.
In parallel to the work done by software engineers on computational agents the robotics community investigated the concept of an embodied agent. This concept was popularised by Rodney Brooks (e.g., [26]) during the vibrant debate aiming at establishing whether intelligent agents need a representation of the environment to act rationally. In the late 80-ties of the XX c. artificial intelligence community preferred the sense-plan-act pattern of operation, which required a symbolic model of the environment to plan future actions of the system. Brooks pointed out that planning induces a significant delay into reactions of the system, thus it cannot react timely to occurring events. He concluded that the environment is its own best model, thus agents acting in physical environments and having material bodies, i.e., embodied agents, should perceive and react, and intelligence will emerge from the interaction of multiple such agents, if subsumption architecture is employed [27,28,29]. The contention was resolved by combining planning and reactive behaviour, e.g., [30]. The effect of this discussion was a wide adoption of the concept of rationally acting intelligent agents by the artificial intelligence community, e.g., Russell and Norvig [31].
Computational agents evolved into bots [32], while embodied agents have been mainly exploited in robotics [27,30,33]. Bots are usually employed as human–machine interfaces for providing specific software services. They are frequently used to gather information, analyse data, monitor events, support decision making, execute transactions. They can be characterised by the degree to which they are autonomous (able to act on their own), capable of reasoning (employ logic or other AI methods to guide their behaviour) and adaptable (are context aware). There is a number of tools and frameworks for developing bots operating in the Internet, e.g., Bot Framework, Botkit, Pandorabots, Chatfuel, Slack. However the primary goal of bot activity is the facilitation of interaction between people and Internet services. Interaction with the physical environment is of secondary importance. On the other hand embodied agents directly interact with physical environments [34,35,36]. The integration of the two approaches is the subject of this research. It focuses on the application of embodied agents in the creation of a HCI for a cyberspace event visualisation control system of the National Cybersecurity Platform (NCP).
Although many agent platforms exist, the vast majority are tailored to specific domains and purposes [37]. The majority of those platforms assumes that the agents either operate within the Internet or within some simulation environment. Although NCP analyses network activity, its visualisation control system and specifically the HCI to that system have to be disjoint from the Internet. In addition, its purpose is not to simulate specific systems. Thus in this work although agent system architecture is assumed, especially for the purpose of system specification, none of the available platforms have been used for its implementation. In this paper embodied agents have been utilised as convenient means of expressing the NCP HCI structure and activities. One of the questions that has been investigated is whether there are benefits associated with using an agent approach to the design of HCIs. The formulation of this question resulted from the observation that the design of simulation models in terms of agents, instead of employing standard approach using discrete event systems, provided extra insight into the operation of the simulated systems [25]. As extra insight always enables deeper analysis of the produced system, the investigation of this problem is worthwhile.
In addition to providing insight into what agents are as well as where and how to apply them the literature also provides hints as to how to create agent based systems. Padgham and Winikoff [22] proposed that architectural design be performed in three steps. First agent types are selected. Each agent type groups similar functionalities. The grouping takes into account that systems with low coupling factor (dependence of components on each other) and high cohesion are preferred (all of the agent’s functionalities are related). There can be many agents of the same type in the system. Then interactions between agents and the environment as well as data interchange protocols are defined. A protocol is a list of possible message interchanges between agents, i.e., an inter-agent communication pattern. Finally the whole system structure is described. This general prescription for the creation of agent based systems is usually followed, but to be more practical it has to be more specific. Guidance must be offered to the designer regarding how to produce both the general system architecture and the internal structure of the agent, as well as how to defined the activities of the agents. The papers [33,34,35] formulate the required methodology, providing the necessary level of detail, enabling the creation of satisfactory system specification. Hence that methodology has been followed here.
The concept of an embodied agent is used in this paper in a way that Brooks defined it. The definition of an agent used here relies on the concept of a rational agent as specified by Russel and Norvig [31]. This is an agent interacting with the environment by gathering information from it using receptors and influencing it by utilising effectors, to produce results conforming to the internal imperative that it had been endowed with by its user or designer. The agent is embodied as it requires a physical body to act in the physical environment. However this does not imply that embodied agents cannot interact with purely software agents acting in cyberspace. The agents that are employed by the NCP interface can be classified using the categorisation described by Nwana et al. In those categories our agents are: static, cooperating, not-learning, hybrid (more reactive than deliberative). In conjunction, they fulfil the requirements of an interface agent. They act in the physical world and thus are significantly different from the Internet agents.

1.4. Goals and Structure of the Paper

This work targets several goals. The research goal is to find out whether the embodied agent-based system design methodology can be used to design smart human–computer interfaces. The technology-oriented goal is to design smart HCI modules providing gesture and speech recognition capabilities, that can be utilised in other domains. The practical goal is to enhance the safety of cybersecurity centres by using other input devices than the standard ones. The ergonomic goal is to let the analyst choose his or her working position, i.e., standing or sitting, thus preventing back-pains.
The composition of the paper is as follows. Section 2 formulates the general requirements imposed on the designed interface. It also shows how the general system structure emerges from those requirements. Moreover, it describes the building blocks, i.e., embodied agents, out of which the interface is built, and finally formulates the design procedure. Section 3 specifies the interface modules in terms of embodied agents. Section 4.1 describes particular algorithms that were employed by the audio module. Section 5 does the same for the vision module. The implementation of the presentation module is described in Section 6. The results of the performed tests of the interface are presented in Section 7. Finally, Section 8 formulates the conclusions and comments upon the conducted work.

2. Specification Method

Software engineering points out that a software system should be designed by first formulating general requirements, which should result in the specification of the system structure and the activities of its subsystems, and then, on the basis of this specification, the implementation should commence. This general suggestion is followed here. A more specific methodology is presented in Section 2.4.

2.1. Requirements

Complex systems, and especially HCIs, usually must exhibit several general modes of operation: standard activity, administration and configuration. Standard activity of the interface, in the presented case, comes down to the recognition of voice and gesture commands, thus is the prerogative of the user of the NCP visualisation component, i.e., network activity analyst.
Administration deals with the management of resources, i.e., information about gestures, users and voice commands. As a result models of gestures, voice commands and user profiles are produced. The administrator also provides training data and supervises the learning process (command and user model creation). Appending new users or commands to the system or removing the unnecessary ones, as well as editing data is required. The assignments of gestures and voice utterances to commands is done by learning. Learning is also utilised to recognise the speaker to determine his/her eligibility. Different categories of users are permitted to interact with the system only in the way reserved for them. Administration is exerted through standard input and output devices, such as keyboard, mouse, touchpad and computer monitor.
Configuration pertains to tuning the equipment and parameters of the software executing image and speech analysis. Tuning the system hardware does not require any special input devices. However delivering parameters to the software requires the same standard input and output devices that are needed for the purpose of administration.
The interface to the data visualisation component of the NCP, for the reasons given in Section 1.2, must provide several command modalities, which require different input devices. Thus the interface must support traditional input and output devices, such as keyboards, mice, touchpads, computer monitors, especially for the purpose of administration and configuration, but also microphones and cameras, which are needed for issuing commands by voice or gesture. Moreover, the commands incoming from separate sources must be merged into a coherent and unambiguous command stream.
The initial version of NCP visualisation component used keyboards, mice and touchpads as the only input devices. Thus it was deemed convenient to transform voice and gesture commands into the format generated by those devices. Recognition of hand gestures requires at least one camera, and voice commands need at least one microphone. Both of those inputs must be processed at a rate not introducing delays unacceptable to the operator. In the case of voice analysis a delay must be present between the end of uttering a command and the termination of its analysis, because customarily a longer pause (of about 200 ms) is treated as the utterance termination marker. Image analysis is employed in the process of cursor control, thus a much faster reaction and smoothness of motion are expected. Finally, the interface must control the windows appearing on the monitor screen and the presentation of data displayed in those windows. Hence an image must be analysed within 50 ms, and the reaction time must be below 100 ms. The structure of the operator interface must conform to those requirements.

2.2. General Structure of the Interface

The NCP contains the visualisation component that has to be controlled by the interface being the subject of this paper. The operator through that interface exerts his/her influence over the way that data is displayed by the visualisation component. Thus the environment in which the interface acts is of heterogeneous nature. On the one hand the operator is the part of the physical environment and on the other hand the NCP, including the visualisation component, forms a cyberspace. This heterogeneity makes this example an interesting case from the point of view of the assumed design method.
The general interface structure results from the requirements stated in Section 2.1 and the postulate of separation of concerns stemming from the list of good practices provided by software engineering. Both voice and gesture recognition require complex data processing, thus it is prudent to produce distinct modules dealing with each separately. In addition to that, there are no interdependencies between the two. As the commands coming from both sources have to be merged into one stream, and moreover, in the future new command sources might be needed, an interface structure with separate command channels and a presentation module aggregating commands resulted (Figure 3). In the current version of the interface, the presentation module integrates and subsequently transforms gesture and voice instructions into visualisation control codes accepted by the NCP. As a result the effects of those commands become visible on the screen. Thus the interface is formed out of three modules: audio, vision and presentation. Each one of them is built of embodied agents.

2.3. Building Blocks: Embodied Agents

An embodied agent possesses a physical body containing its effectors and receptors. By using its effectors it can influence that environment and by using the receptors it can gather information about the state of the environment. In addition to that, the agent has an inner imperative to accomplish a task assigned to it. In the presented case the environment has a heterogeneous nature: a physical ambience and cyberspace. Usually embodied agents are utilised to form systems acting in physical environments and computational agents for acting in cyberspace. As robots act in physical environments they are composed of embodied agents [34,38], if an agent-based design approach is followed. However, as computational agents are a specific case of embodied agents, the same approach can be used to deal with heterogeneous environments.
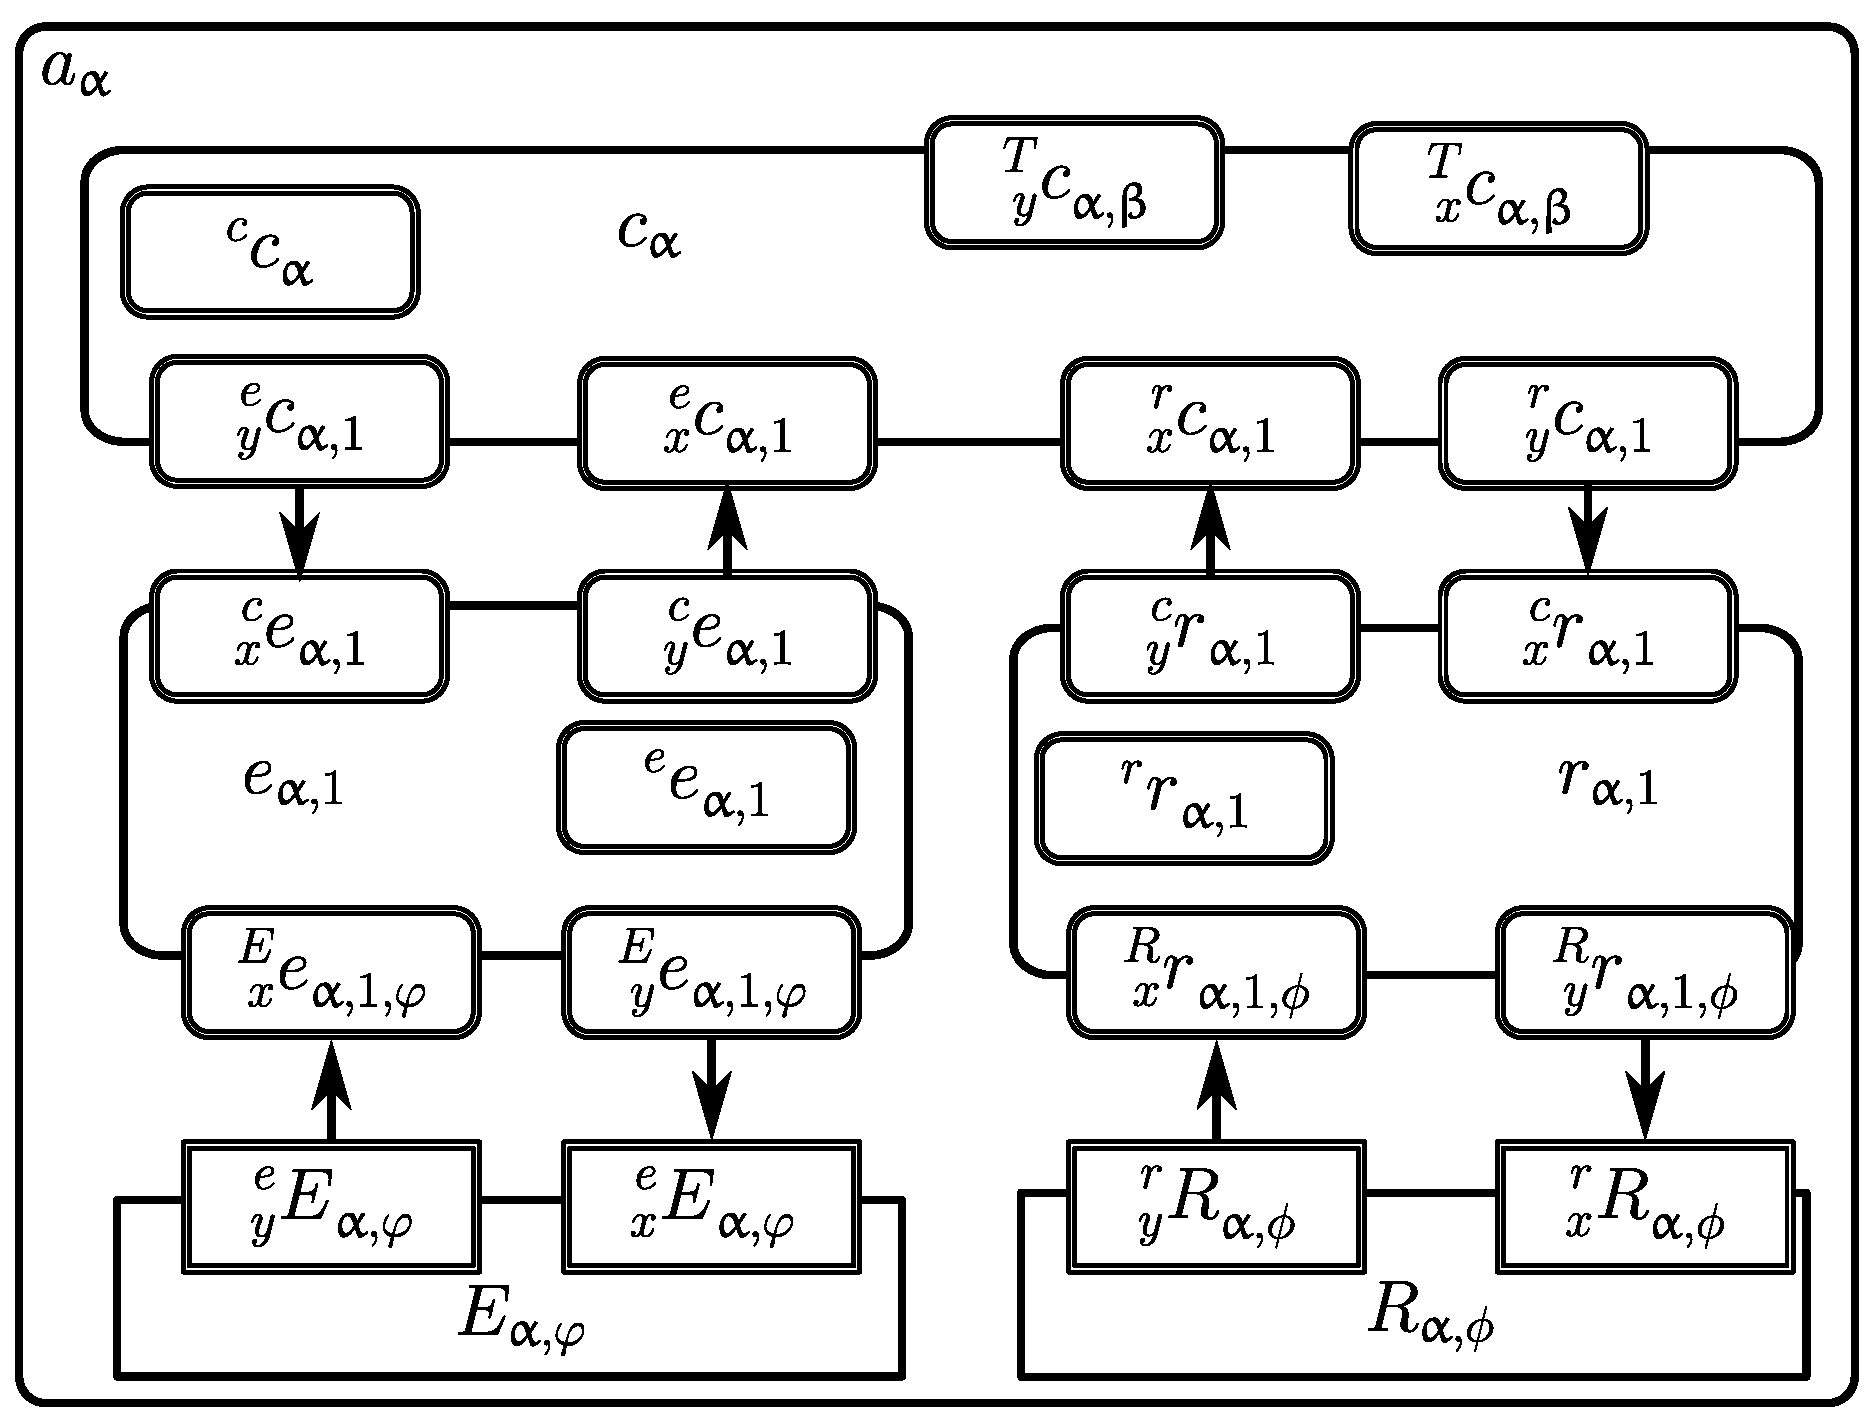
The embodied agent meta-model defines both the internal structure of the agent and its activities [33,39]. Figure 4 presents the general structure of an embodied agent a j , where j is substituted by the name of a particular agent. The agent a j is composed of five types of subsystems:
  • a single control subsystem c j
  • zero or more real effectors E j , m
  • zero or more virtual effectors e j , n
  • zero or more real receptors R j , l
  • zero or more virtual receptors r j , k
where m , n , l , k are substituted by particular names of those subsystems, if those subsystems exist.
It should be noted that throughout the paper a consistent method of assigning symbols to the elements of the system structure is used. The central symbol, i.e., a , c , E , e , R , r , describes the type of subsystem, while the right subscripts assign a particular names in the order: name of the agent, name of the subsystem, thus it is easy to identify what is the type of the subsystem and what is the agent that it belongs as well as what is the particular name of the subsystem.
Virtual receptors r are responsible for aggregating data obtained from real receptors R , while virtual effectors e transform high level commands issued by the control subsystem c into the low level ones intelligible to the real effectors E . Each of the mentioned subsystems uses buffers to communicate with the other ones, and moreover it may have its own internal memory. To distinguish the role of particular buffers of a subsystem left subscripts are used:
  • x stands for input buffer,
  • y for output buffer,
  • no left subscript denotes internal memory.
The particular name of the component of the buffer is appended to the list of names forming the right subscript. The left superscript defines the type of subsystem that is being contacted, i.e., c , E , e , R , r , T . The last one, i.e., T , is used to designate the transmission buffer that the control subsystem uses to contact another agent (exactly speaking the control subsystem of another agent), thus transmission buffers are employed in inter-agent communication. Purely computational agents do not have any of the four subsystems: E , e , R , r , thus are a very special case of an embodied agent, however they use communication buffers, marked by the left superscript T , to communicate with other agents.
Examples:
  • e x c audio , ls is the input buffer (thus x) from the control subsystem c of the virtual effector e named ls of the agent a audio ;
  • c y T audio , pres is the output buffer (thus y) from the control subsystem c of the agent a audio to the agent a pres (more concretely, its control subsystem c pres );
  • r r audio , ls is the internal memory of the virtual receptor r named ls of the agent a audio .
The activities of each subsystem are defined hierarchically. At the top of the hierarchy there exists a finite state machine (FSM) that switches between its states to which subsystem behaviours are assigned. Each state is symbolised by S s j , i q , where s is the type of subsystem, q is the name of particular state, while j , i are the particular names of the agent and its subsystem, respectively. Each behaviour consists in an iterative execution of its elementary action, which consists of: insertion into output buffers and internal memory of the results of computation of subsystem transition function, output of those results from the output buffers and input of new data into the input buffers. Each iteration of an elementary action requires a certain time, which defines the subsystem sampling period. Each subsystem may have a different sampling period. The arguments of the transition function are the input buffers and the internal memory. The results of its computations are deposited in the output buffers and the internal memory. The iteration of elementary actions are terminated if either the terminal condition or the error condition is satisfied. In that case, the FSM decides which behaviour should be executed next. It decides this based on the initial conditions assigned to its transitions. All of those conditions are predicates, which take as arguments the contents of the subsystem input buffers and its memory. In fact, behaviours are templates parameterised by: transition functions as well as terminal and error conditions, thus to define them only those functions have to be specified. For brevity in this paper behaviours will be discussed without defining particular transition functions as well as their terminal and error conditions.

2.4. Design Methodology

The design methodology based on embodied agents was followed in the creation of the interface. Its main items are as follows:
  • determine the real effectors and receptors necessary to perform the task being the imperative of the system to act,
  • decompose the system into agents,
  • assign to the agents the real effectors and receptors (taking into account the transmission delays and the necessary computational power),
  • assign specific tasks to each of the agents,
  • define virtual receptors and effectors for each agent, hence determine the concepts that the control subsystem will use to express the task of the agent,
  • specify the FSMs switching the behaviours for each subsystem within each agent,
  • assign an adequate behaviour to each FSM state,
  • define the parameters of the behaviours, i.e., transition functions, terminal and error conditions.
Those items are not termed steps, as the order of their execution may be according to individual preferences of the designer.

3. Specification of Modules and Structure of the Interface

As the modules of the interface interact both with the physical environment and visualisation component of NCP, i.e., cyberspace, the definition of the environment and subsequently the statement of what are the effectors and receptors of the agents composing the modules requires careful consideration. Obviously the camera providing the images of the operator and the microphone delivering the voice signal are both real receptors. Standard input devices are also treated as real receptors.
For the reasons pointed out in Section 2.2, it is convenient to distinguish three modules: audio, vision and presentation. The design procedure requires that those modules should be decomposed into agents. Those agents interact with each other and with the physical environment and the monitor screen, which is treated as an extension of that environment into the cyberspace. Each of those modules creates and changes the state of windows on the screen of the monitor. As the operations that each module performs on its windows are very similar, it is reasonable to produce a general window agent pattern a α (Figure 5), where α is substituted by the name of the particular window agent.

3.1. Window Agents

Each of the modules needs a graphical user interface of its own. However all of those interfaces are very similar: they use windows. Thus a general window managing agent pattern a α is of utility. In the environment window agents a α produce graphical representations of windows. Those windows posses both receptors and effectors. Window boxes present the information that affects the operator who exists in the environment. Thus those boxes are treated as effectors of the window agents. On the other hand, windows contain buttons and sliders that enable input of information, thus are treated as receptors. Those receptors are stimulated by cursors which are the effectors of another agent. The communication between window agents and cursor operating agent takes place through the environment, thus should be treated as stigmergy [40]. The graph of the FSM of the control subsystem of an agent a α is presented in Figure 6. In the state S c α init memory is initialised, and subsequently the FSM transits to S c α control , where it reacts to the stimulus from the environment until a α has been disposed of. This stimulus is detected by the real receptors. Window agents also communicate directly with other agents via inter agent communication buffers, thus have the capability of informing those agents about changes occurring in the environment and responding to the commands obtained from them to display certain information in the window.

3.2. Agent Governing the Standard Operator Interface Devices

To manage the interface the operator uses all the standard input devices in conjunction, but only one at a time. For that reason it is reasonable to distinguish a single agent integrating this input and as a result producing a single result on the screen, e.g., motion of a cursor. The standard input devices are used to exercise control over the windows appearing on the monitor screen, i.e., to input alpha-numerical data and press buttons or manipulate sliders. Thus this agent is responsible for control of cursors and replication of keyboard keystrokes that the windows can utilise. Hence it possesses both real receptors, i.e., keyboard, mouse, touchpad, as well as real effectors, i.e., two cursors and keystroke replicator. In a way it is an integrator of all the operations executed by the operator on standard input devices, thus its name Operator Interface Device, and the name of the agent a OID . As mentioned earlier the effectors of this agent influence the windows through the environment, thus employing stigmergy. The a OID agent in reaction to input from any of the standard input devices either shifts the cursors, causes a click or a double click, or produces an adequate keystroke, thus transmitting through the operating system a control code to a particular window agent a α , stimulating its receptors. The window agent a α upon detecting this input with its receptors reacts adequately to the received control code.
The structure of a OID is presented in Figure 7. It controls real effectors: E OID , δ where δ stands for mainPointer (primary cursor), secPointer (secondary cursor), or keyExecutor (keystroke generator). Those effectors respond to the commands generated by the control subsystem c OID in response to the stimulus activating the real receptors R OID , γ , where γ stands for: mouse, keyboard or touch screen.
The control subsystem c OID is governed by a two-state FSM (Figure 8). The behaviour associated with the state S c OID init , initiates the memory of c OID , and the one associated with the state S c OID control processes commands obtained from either the virtual receptor r OID , 1 , aggregating data from the real receptors R OID , γ , or the presentation module. The commands from the presentation module are obtained through inter-agent communication buffers.
The agent a OID could be a stand alone module by itself. However, vision and audio modules deliver their commands to the presentation module, which in turn transforms them into codes equivalent to those produced by standard input devices. Those codes have to affect the windows appearing on the monitor screen in exactly the same way as a OID does it. Hence the effect of the activity of the presentation module and the agent a OID are the same. Instead of replicating the code it is convenient to produce those effects by a single agent, in this case a OID , and to incorporate that agent into the presentation module.

3.3. Vision Module

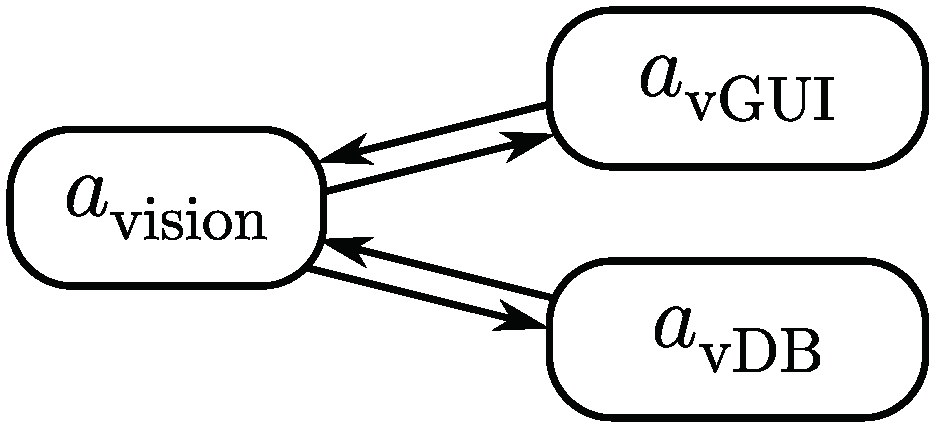
The primary function of the vision module is the recognition of gestures produced by the operator. However gesture recognition requires gesture models, which have to be stored in a database. Moreover this module needs a window to enable it to be configured. It is used to provide visual feedback for the users, allowing them to take the correct pose and make sure they are in the field of view of the camera. Thus three agents become necessary. The structure of the vision module is presented in Figure 9.

3.3.1. Vision Agent

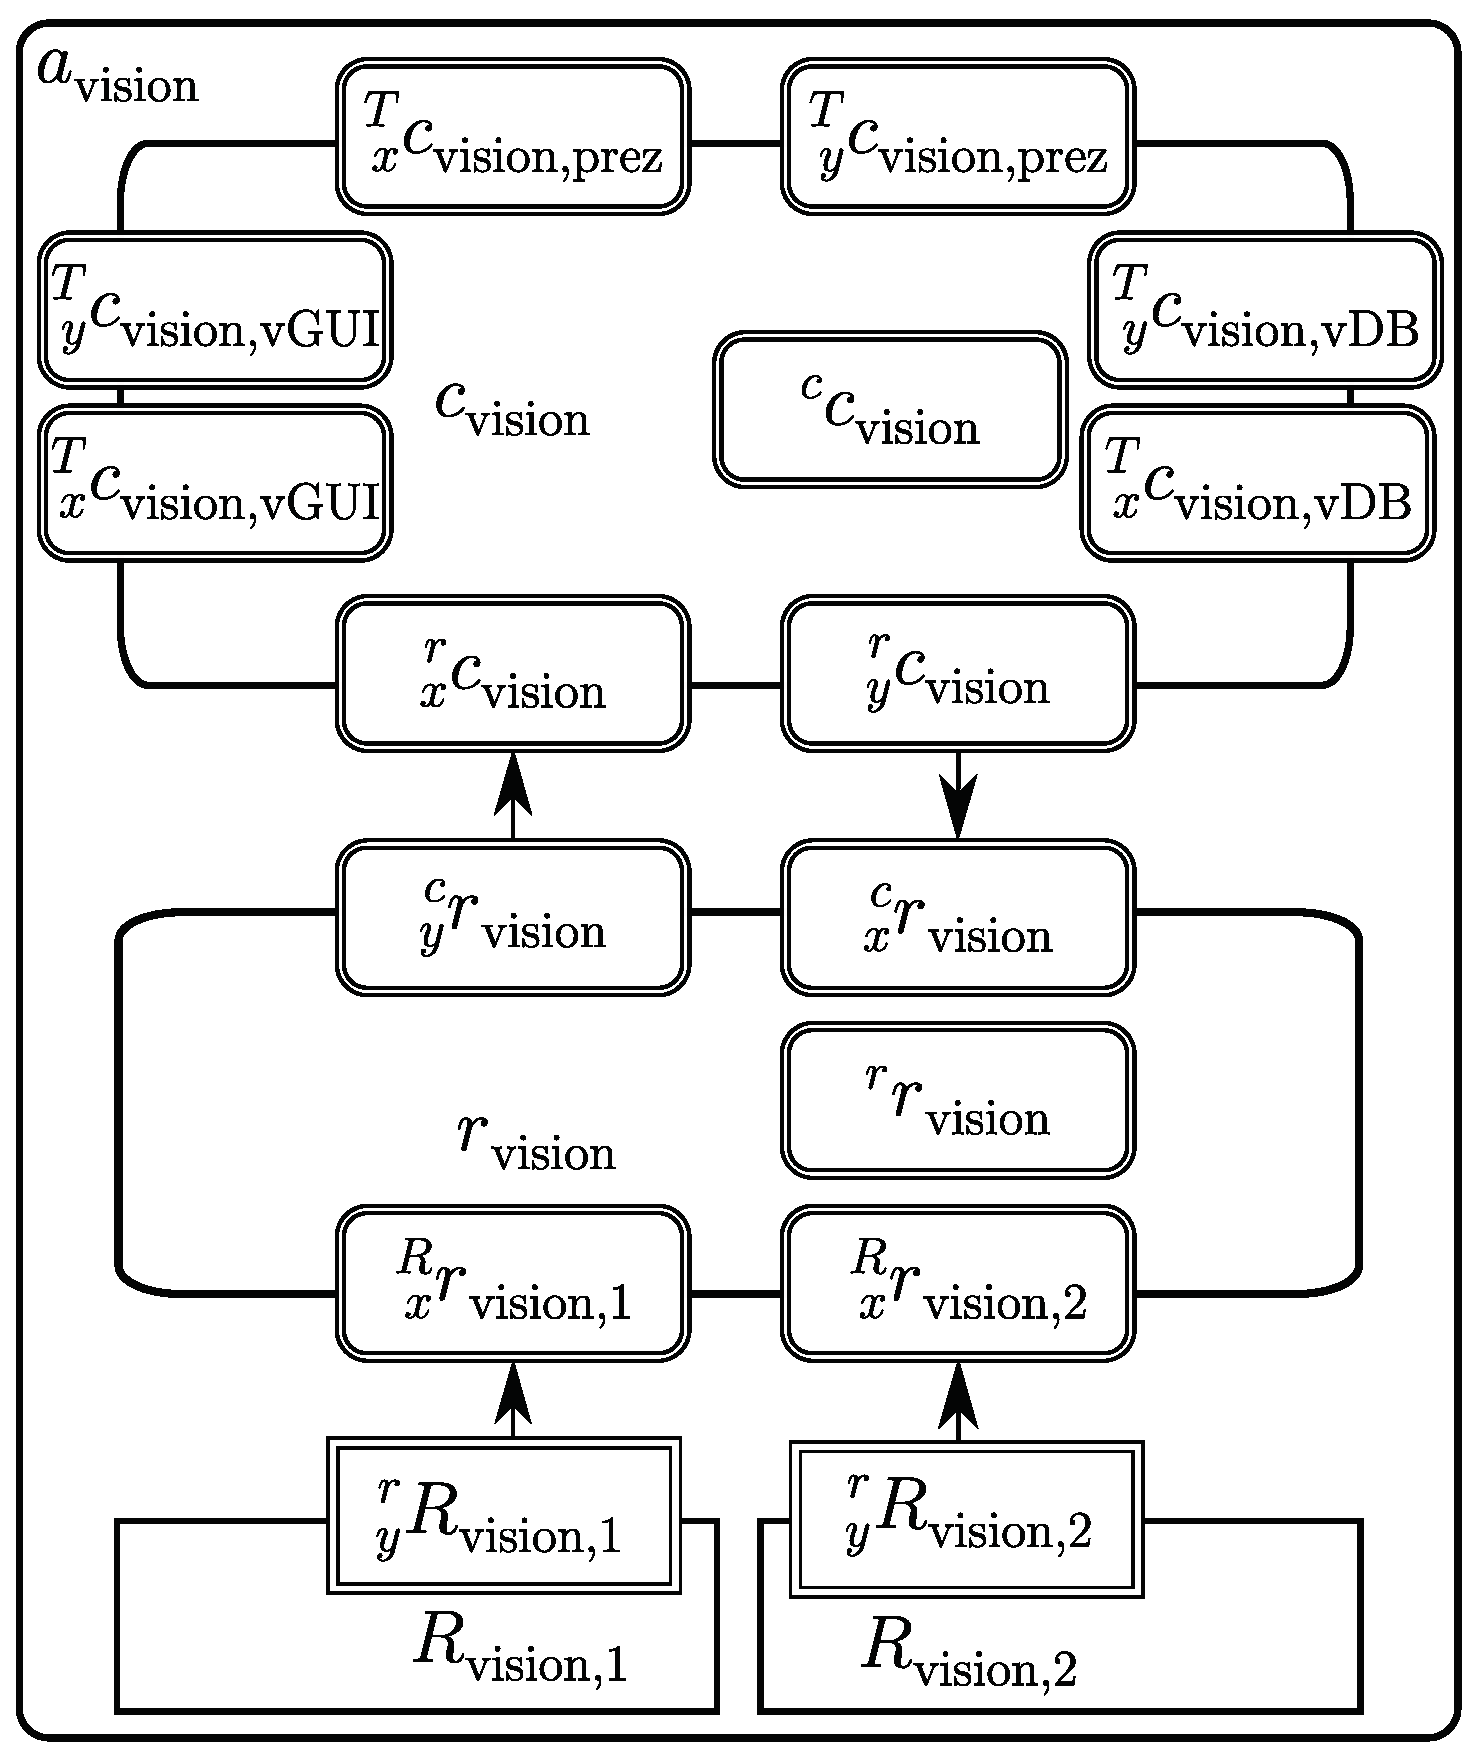
The agent a vision (Figure 10) is responsible for gesture recognition, thus it is endowed with two RGB cameras (stereo configuration), R vision , 1 and R vision , 2 being its real receptors. The images obtained from the cameras R vision , 1 and R vision , 2 are preprocessed by the virtual receptor r vision . The effects of this preprocessing are delivered to the control subsystem c vision . Moreover, the control subsystem c vision provides the vision system calibration data to the virtual receptor r vision . The control subsystem c vision FSM (Figure 11) governs the high level activities of the agent a vision . This FSM is initiated in state S c vision init which invokes a behaviour that establishes the communication with the agent a vDB , and hence obtains gesture models and other necessary information (e.g., camera calibration parameters). In the subsequent states the following behaviours are executed: in S c vision face localization operator face is localised, in S c vision palm localization his/her palms are localised and in S c vision gesture recognition the operator’s face and palms are being tracked. This tracking enables gesture recognition and interpretation. If the operator’s palms are lost from view the FSM transits to one of the previous states to re-initiate face and palm localisation.

3.3.2. Database Agent

Agent a vDB is responsible for the management of trained classifiers and calibration parameters that are stored in the database. This information is required during vision module initiation. The database agent a vDB is a purely computational agent, thus contains only the control subsystem c vDB (Figure 12). The control subsystem c vDB FSM has only one state, in which it responds to all incoming data queries.

3.3.3. Window Agent

Agent a vGUI , which conforms to the window agent pattern a α , i.e., α = vGUI, is responsible for the graphical user interface. The control subsystem c vGUI FSM is single-state. The associated behaviour displays images produced by a vision . Moreover, it transmits to a vision the requests resulting from the interaction through stigmergy with the cursor control agent a OID of the presentation module.

3.4. Audio Module

The main activity of the audio module is to process verbally issued commands. However, several supplementary activities are needed to support this process. Each one of them requires interaction with the operator, and that needs specific windows.

3.4.1. Structure

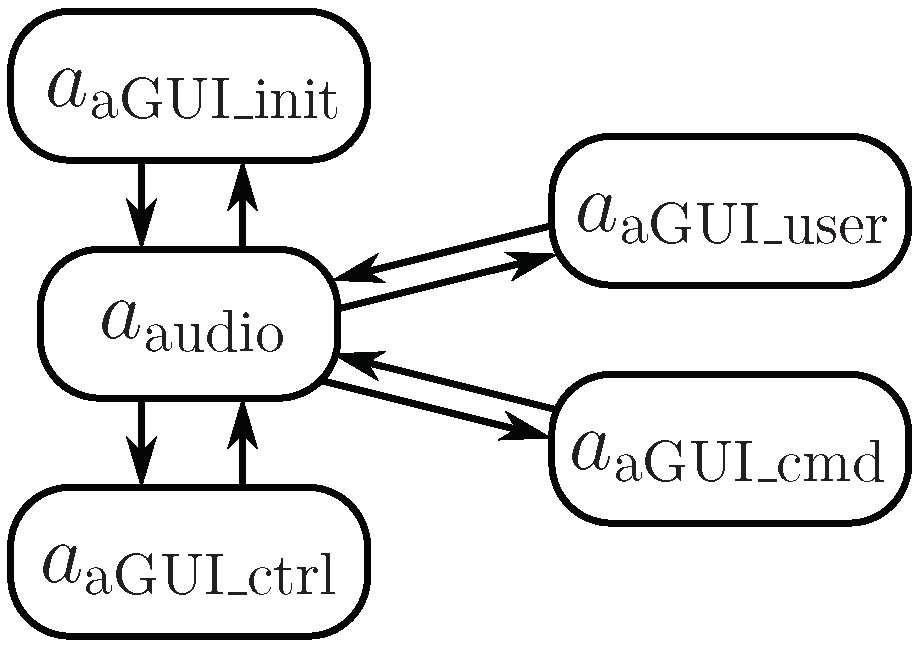
Thus, a five agent structure of the module resulted, with a single agent a audio responsible for audio processing and four window agents: a aGUI _ init , a aGUI _ user , a aGUI _ cmd and a aGUI _ ctrl (Figure 13). The last four agents replicate the a α pattern (Section 3.1).

3.4.2. Window Agents

The primary window is formed by the agent a aGUI _ init . It produces a menu enabling the selection of the possible actions, and thus windows associated with them. One is governed by the agent a aGUI _ user , which enables the management of NCP user data. Another one is created by the agent a aGUI _ cmd , which makes possible the management of audio commands. Still another one is produced by the agent a aGUI _ ctrl , and facilitates the control of model creation based on acquired sound recordings as well as management of those recordings. Only one of those four agents, and thus windows, is active at a time.

3.4.3. Audio Agent

The administrator using the effectors of the a OID agent stimulates the receptors of the mentioned window agents, that in turn modify the contents of the associated windows presented on the screen. The standard user interacts with the a audio agent through its receptor, i.e., the microphone.
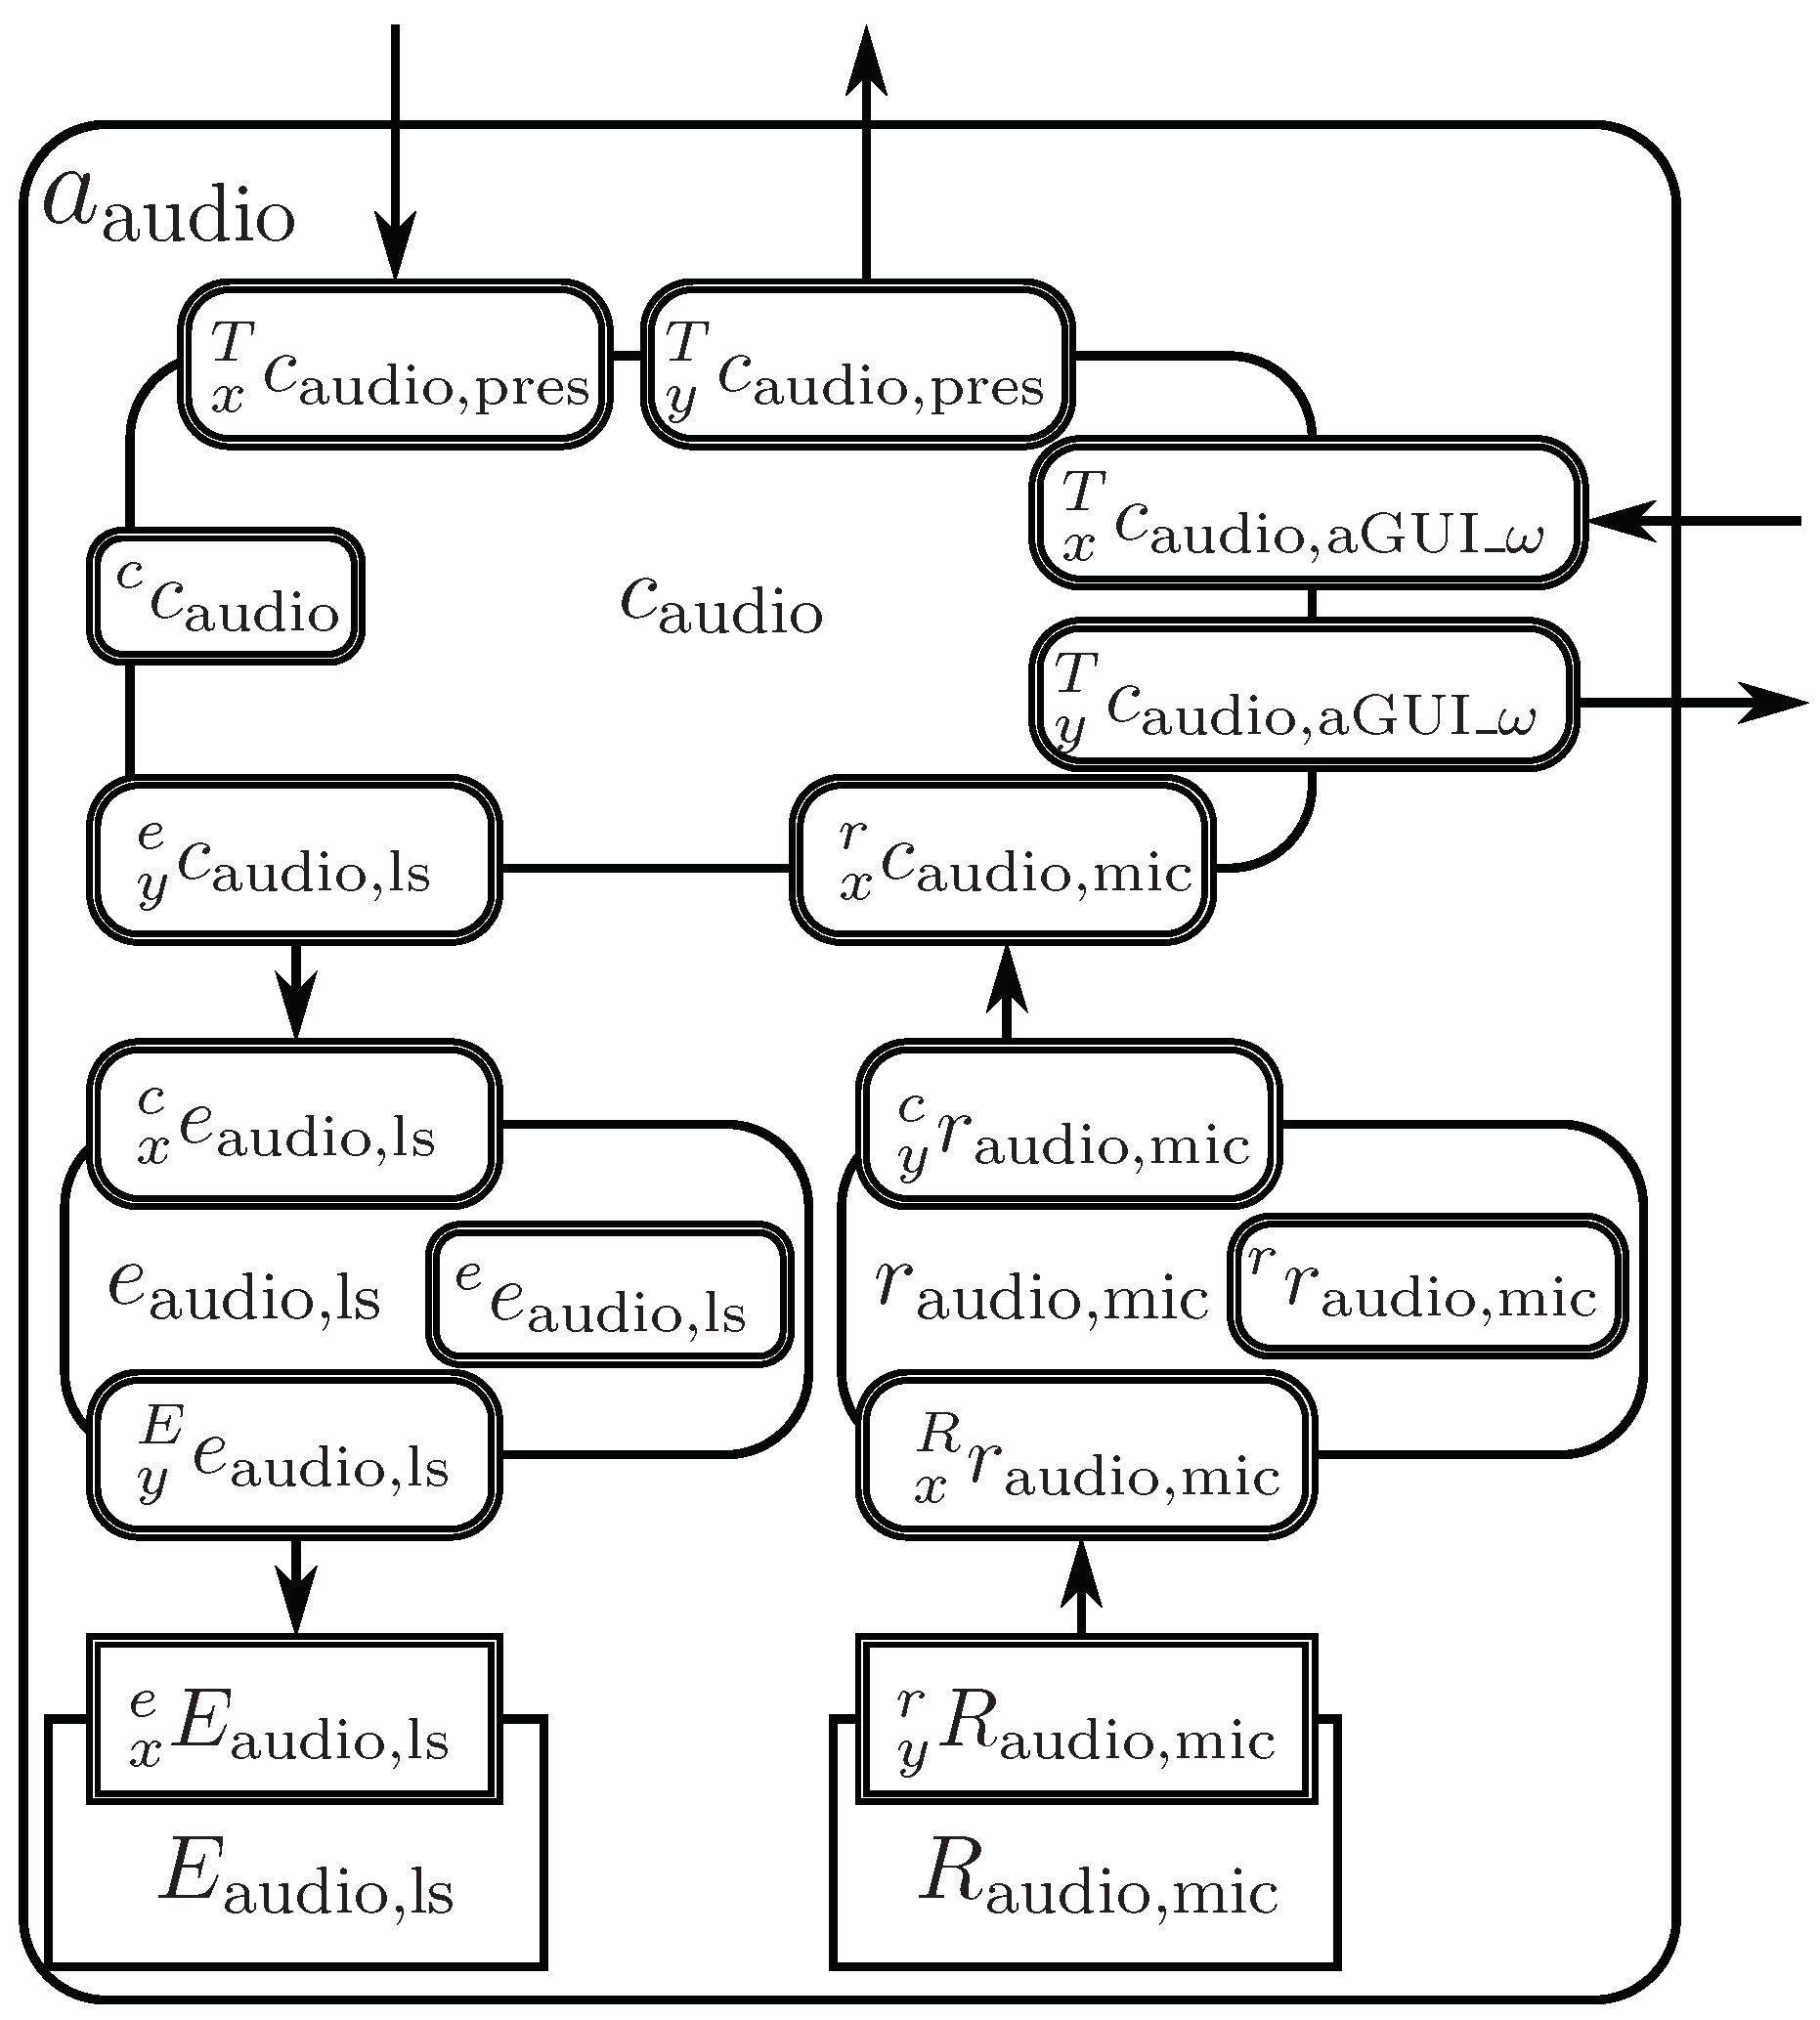
The audio agent a audio (Figure 14) has one real receptor R audio , mic (microphone, AD converter and its software driver) and one real effector E audio , ls (loudspeaker, DA converter and its software driver), each having its virtual counterpart: r audio , mic and e audio , ls , respectively. The loudspeaker enables the reproduction of the audio recordings, at the request of the administrator.
The activities of the audio agent a audio are governed by the FSM of its control subsystem c audio (Figure 15). The behaviour associated with the FSM state S c audio init responds to the messages generated by the agent a aGUI _ init . It either causes the FSM to transit to the behaviour associated with S c audio control or with S c audio manage . In the former case the behaviour consists in the creation of the agent a aGUI _ cmd , which produces a window on the screen and proceeds to continuous recognition of voice commands and the speaker. While in the latter case, based on the received message, the behaviour selects one of the behaviours creating the following agents: a aGUI _ ctrl in states S c audio recordings and S c audio learning , a aGUI _ user in state S c audio users , and a aGUI _ cmd in state S c audio commands . Each of those agents displays a respective window on the monitor screen, enabling the management of specific resources. The agent a aGUI _ cmd manages the configuration files containing commands, the agent a aGUI _ user manages the configuration files containing user data, the agent a aGUI _ ctrl either conducts a recording session for a selected user or manages the learning process, consisting in the creation of the user and command models based on voice samples acquired during the recording sessions with the participation of the user. Upon termination of the activities of a window agent it is destroyed and thus the associated window disappears from the screen. Then the FSM transits back to S c audio manage .
Audio command processing requires prior creation of command and speaker models. For that purpose the same command must be repeated and recorded many times. During the recording session, c audio uses the virtual receptor r audio , mic to get the audio signal. It also transmits to the control subsystem c aGUI _ ctrl of the window agent a aGUI _ ctrl the recorded sample oscillogram, so that it can display it. It also sends the recorded sample to the virtual effector e audio , ls for the purpose of reproducing it using the loudspeaker. Finally it creates a wave file with a recorded sample and stores it in the internal memory of the control subsystem c audio . All this is done by the behaviour associated with the state S c audio recordings of the FSM of the control subsystem c audio .
The behaviours related to audio signal processing need to be initialised by reading configuration parameters from dedicated external data files. This process is performed almost exclusively by the control subsystem c audio , when its FSM is in the S c audio init state.
The learning process is performed almost exclusively by the control subsystem c audio , when its FSM is in the S c audio learning state. The control subsystem c audio uses functions necessary for: decoding data from the wave format, pre-analysis and parametrisation of the speech signal, creation of user and command models and inserting the created models into appropriate files that are a part of its internal memory. When needed c audio extracts that data from its internal memory and transfers it to the virtual receptor r audio , mic , which decodes it from the wave format, forming a vector of signal samples (numbers), and in this form it stores the data for processing.
Given appropriate command- and speaker-models, the spoken command recognition and speaker identification process is performed almost exclusively by the control subsystem c audio , when its FSM is in the S c audio recognition state. The control subsystem c audio uses functions necessary for: on-line signal acquisition (from the virtual receptor) or decoding signals from the wave format, pre-analysis and parametrisation of the speech signal, matching the signal features with the available models and making decisions according with predefined decision thresholds.

3.5. Presentation Module

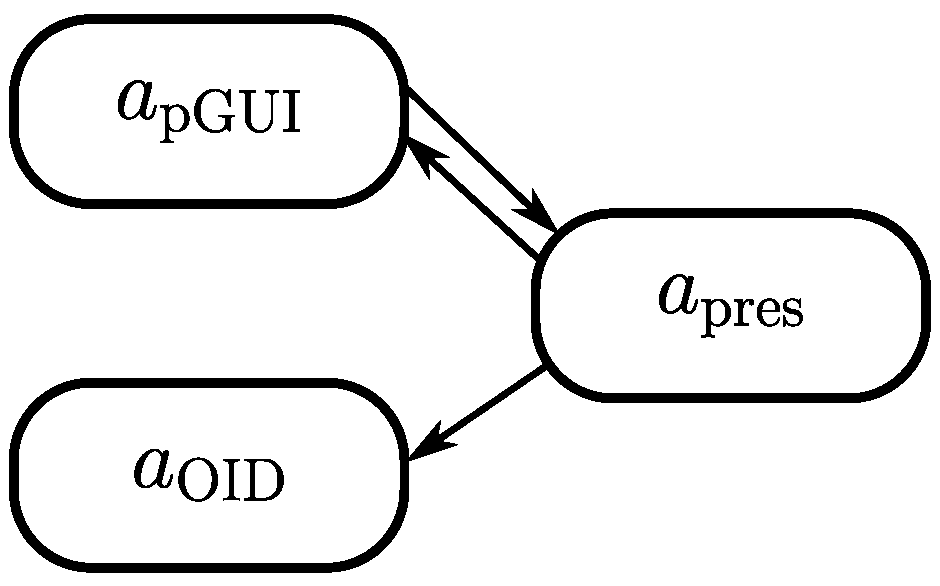
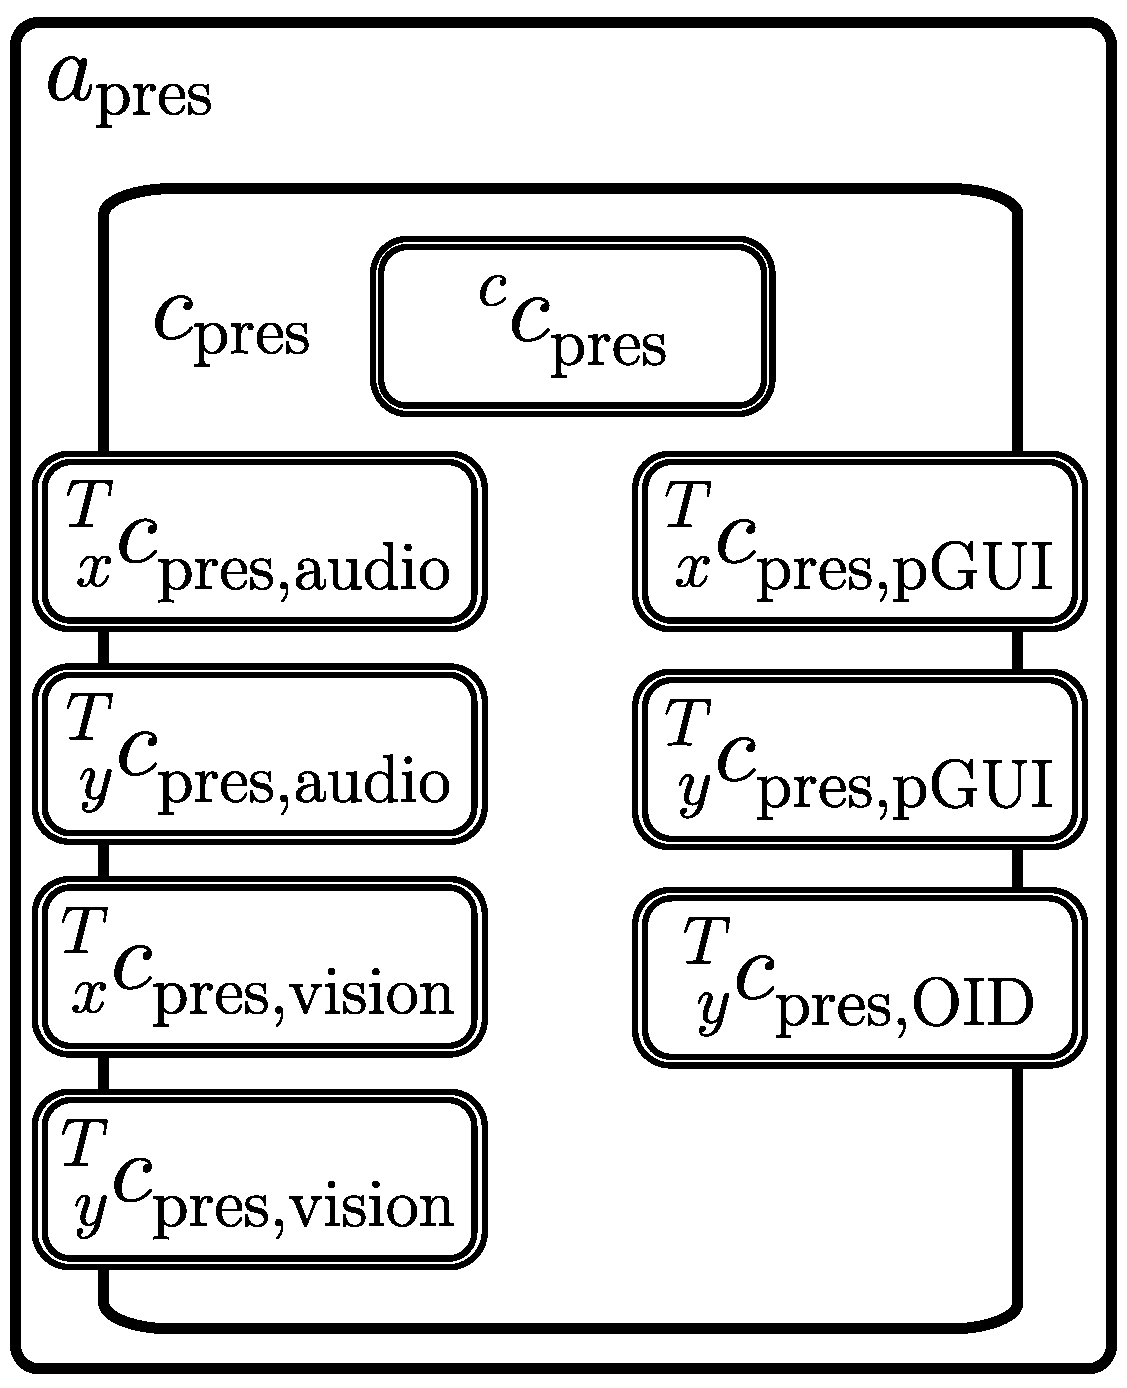
The presentation module (Figure 16) consists of three agents: a pres (Figure 17), a OID (Figure 7) and a pGUI (Figure 5).

3.5.1. Presentation Agent

The FSM (Figure 18) of the control subsystem c pres of the agent a pres , in its S c pres init state initialises the memory, and in the state S c pres control acquires the information from the other modules via inter-agent communication buffers and fuses it, so that it can send distinct commands to the agent a OID . This is split into several tasks. First, transformation of commands (gesture identifiers) produced by a vision , into codes usually generated by standard input devices and subsequently delivering them to a OID . Second, transformation of the voice command identifiers, delivered by a audio , into codes usually produced by a keyboard and delivering them to a OID . Third, delivery of operation mode switch commands to the agents a vision and a audio through the window agent a pGUI . Finally, delivery of logging information to a pGUI for visualisation on the screen. The logging data is produced by c pres as well as a vision and a audio .

3.5.2. Window Agent

The window agent a pGUI is responsible for displaying the logging data delivered by a pres and perceiving stimulus generated by the environment, i.e., monitor screen. This stimulus is generated by a OID in response to the activities undertaken by the operator using the standard input devices. It is detected by the buttons, check lists and sliders of the window produced by a pGUI on the monitor screen.

4. Implementation of Audio Processing

4.1. Real Audio Receptor

The real audio receptor R audio , mic consists of a multi-channel acquisition device (audio data from up to 4 channels with an XLR interface can be simultaneously recorded) that is compatible with a GNU/Linux operating system (an Ubuntu distribution). The following device has been selected: Focusrite Scarlett 18i8 2nd Gen, with USB connection to a computer. Nevertheless, an implementation of own low-level control software for the acquisition device was needed. Up to three stationary microphones have been connected to it via a cable and one head-microphone has been connected over WiFi.
Stationary (i.e., cable-connected) microphones have been selected: Sennheiser MKE 600 (bandwith: 40–20,000 Hz, polar pattern: super-cardioid); t.bone EM 9600 (150–15,000 Hz, cardioid) and Shure SM58 LE (55–14,000 Hz, cardioid). A mobile microphone equipment consisted of an AKG WMS 40 Mini Sport ISM3 WiFi modem with the microphone Samson DE10 (20–20,000 Hz, omnidirectional).

4.2. Virtual Audio Receptor

The virtual receptor r audio , mic takes care of both the handling of off-line audio signals (recording, reading and writing of wave files) and on-line acquired audio signals (obtained from the microphones). It has been implemented in terms of dedicated functions communicating with the operating system resources.

4.3. Selected Audio Agent Behaviours

In the following, audio processing functions are described, executed by the control subsystem c audio , when its FSM is either in the S c audio learning or S c audio recognition state. Both the command- and speaker-modelling (i.e., learning) processes as well as the command- and speaker-recognition processes utilise a common audio signal parametrisation process.

4.3.1. Audio Signal Parametrisation

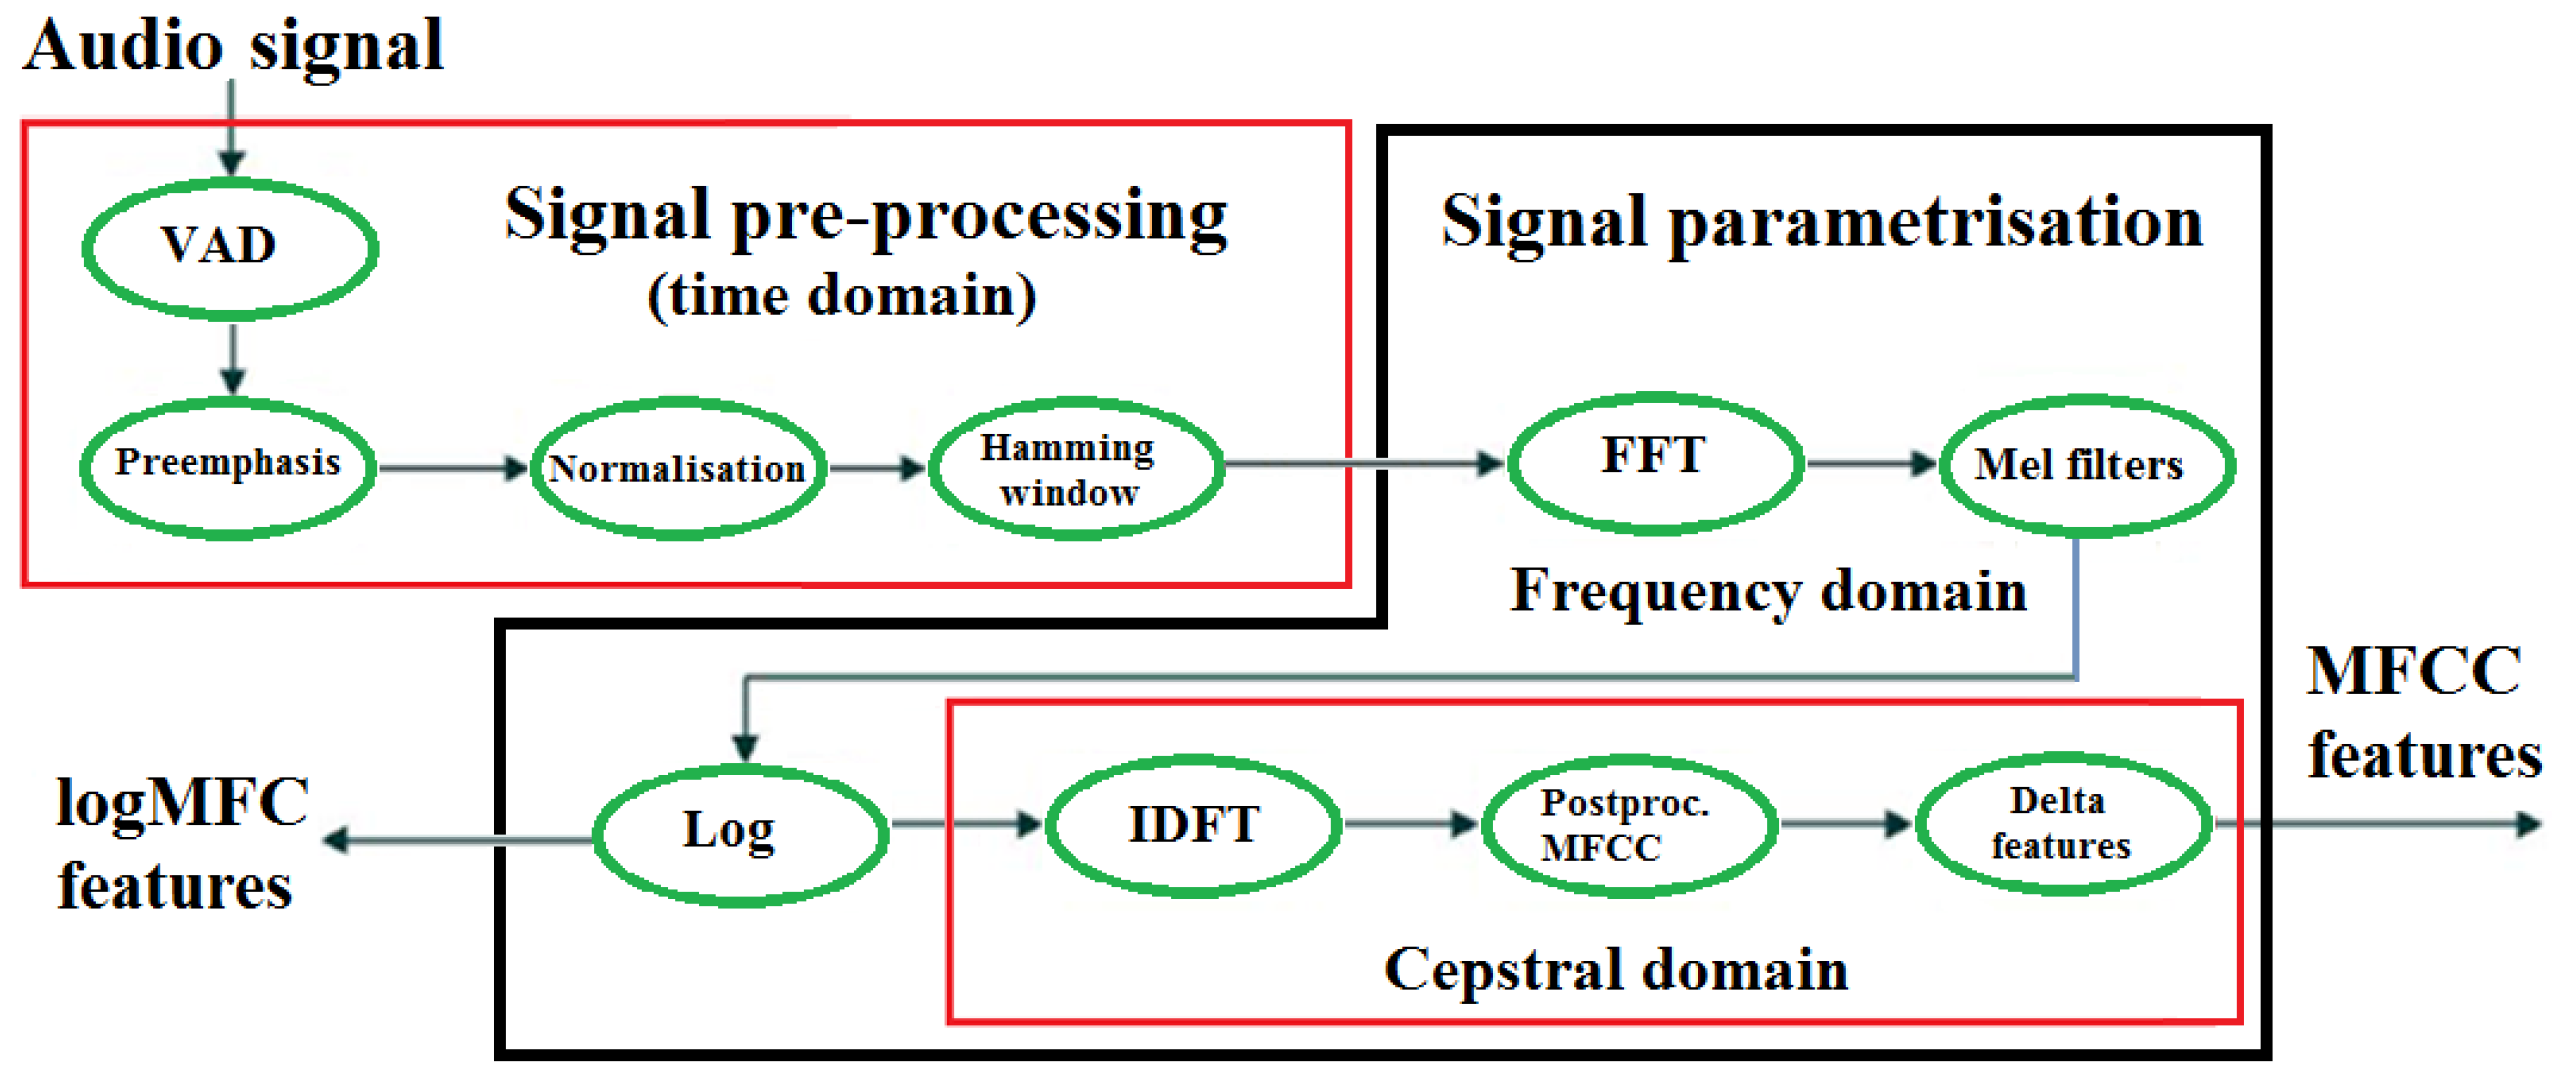
The goal of the audio signal parametrisation process (Figure 19) is to make audio signal preprocessing, speech detection and -segmentation and feature vector extraction. The final features are alternatively based on standard MFC- and MFCC parameter vectors [41,42].
In the on-line mode, a signal chunk containing an isolated spoken command is processed immediately. In the off-line mode, the chunk consists of the entire wave-file content.
The first four parametrisation steps are performed in the time domain: voice activity detection (VAD), preemphasis filtering, amplitude normalisation of the entire signal chunk, signal segmentation into uniformly distributed frames and the multiplication of frames by a Hamming window.
By a Fast Fourier Transform every frame is transformed into the frequency domain. There, the amplitude vector of Fourier coefficients is band-filtered by a set of triangle band-passing filters distributed according to the Mel frequency scale. After mapping the obtained feature vector values to a logarithmic scale the logMFC features are obtained.
Alternatively, the Inverse Discrete Fourier Transform (IDFT) (in fact the inverse Discrete Cosine Transform, as the data are real-valued only) is applied to every logMFC feature vector, leading to cepstral features (MFCC). After a postprocessing (a long-time mean subtraction) centred-MFCC features are obtained. A final feature vector consists of 38 elements: the frame’s total energy and delta (difference in consecutive frames) of such energy, and 18 logMFCs or centred-MFCCs and 18 delta-logMFCs or delta-centred-MFCCs.

4.3.2. Command Modelling and -Recognition

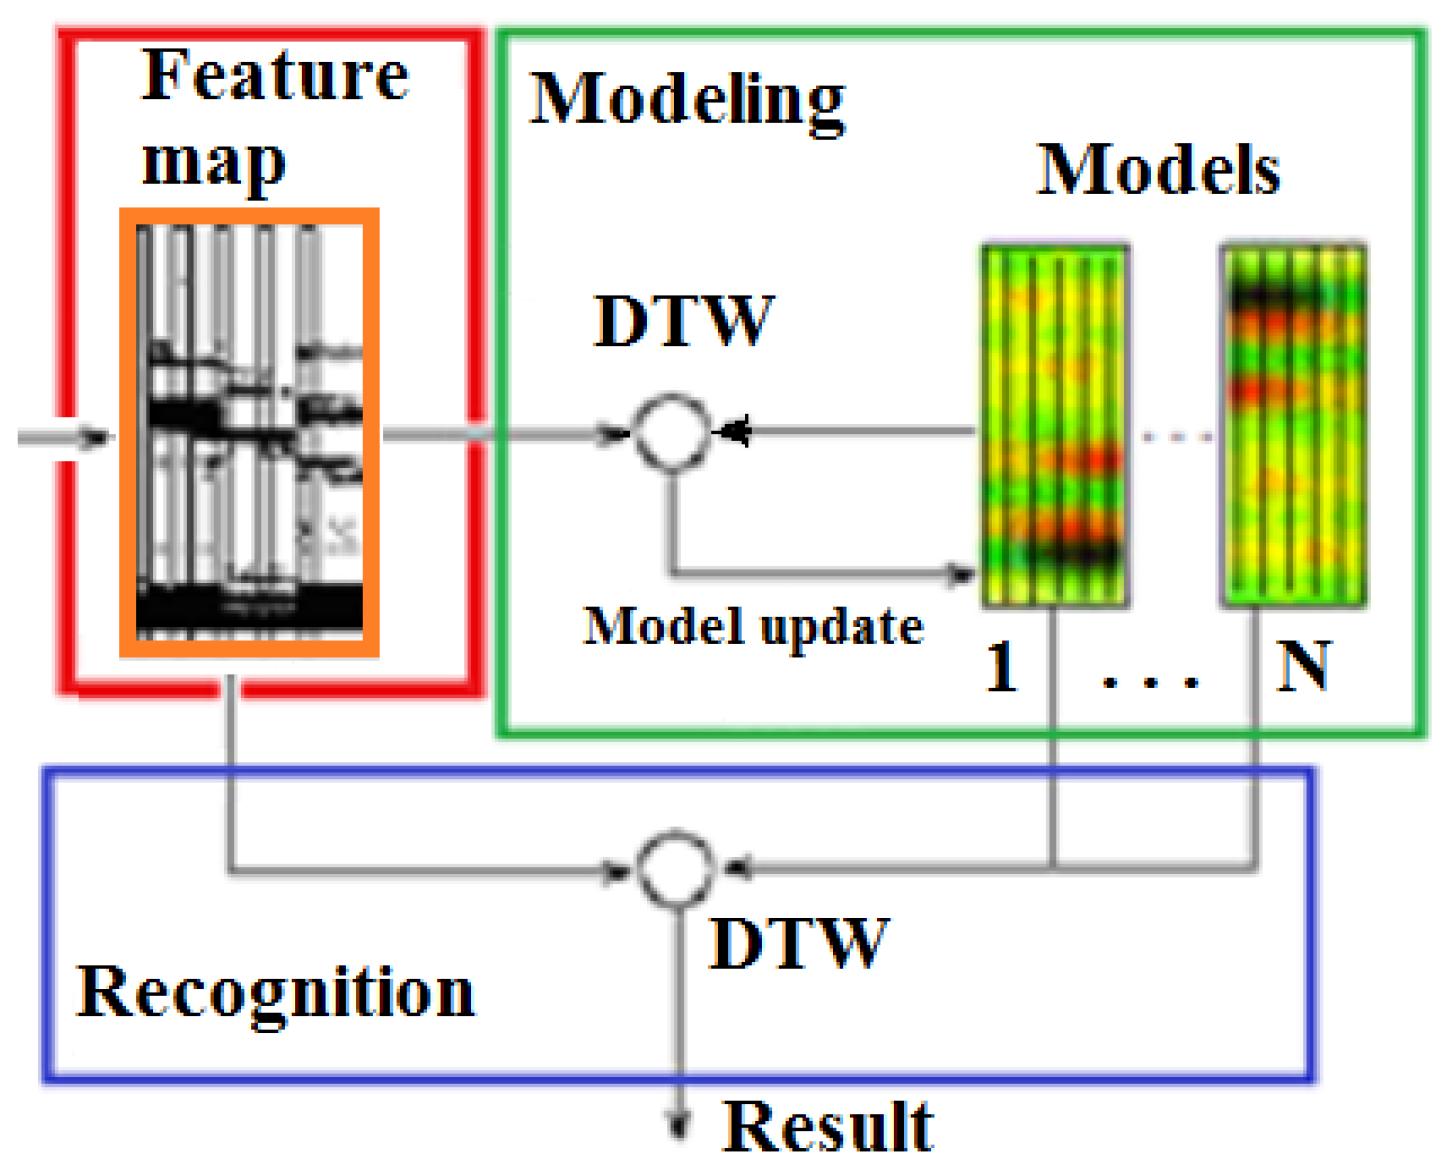
Command modelling is performed in the learning state S c audio learning , and command recognition is done in the recognition state S c audio recognition (Figure 15). Two alternative designs of the speech recognition task have been implemented. They are distinguished as closed dictionary and open dictionary cases.
In the first case the spoken command dictionary is known in advance and acoustic training samples of every command are required. One can expect that training samples of the commands will be recorded by trusted speakers for speaker modelling. This approach is language independent and no language phoneme coder nor phonetic transcription function need to be implemented. This assumption leads to a simplified structure of the spoken command recognition system (Figure 20), compared to a more universal solution for an open dictionary case. The command models take the form of feature maps, while the recognition process utilises a modified DTW (dynamic time warping) algorithm.
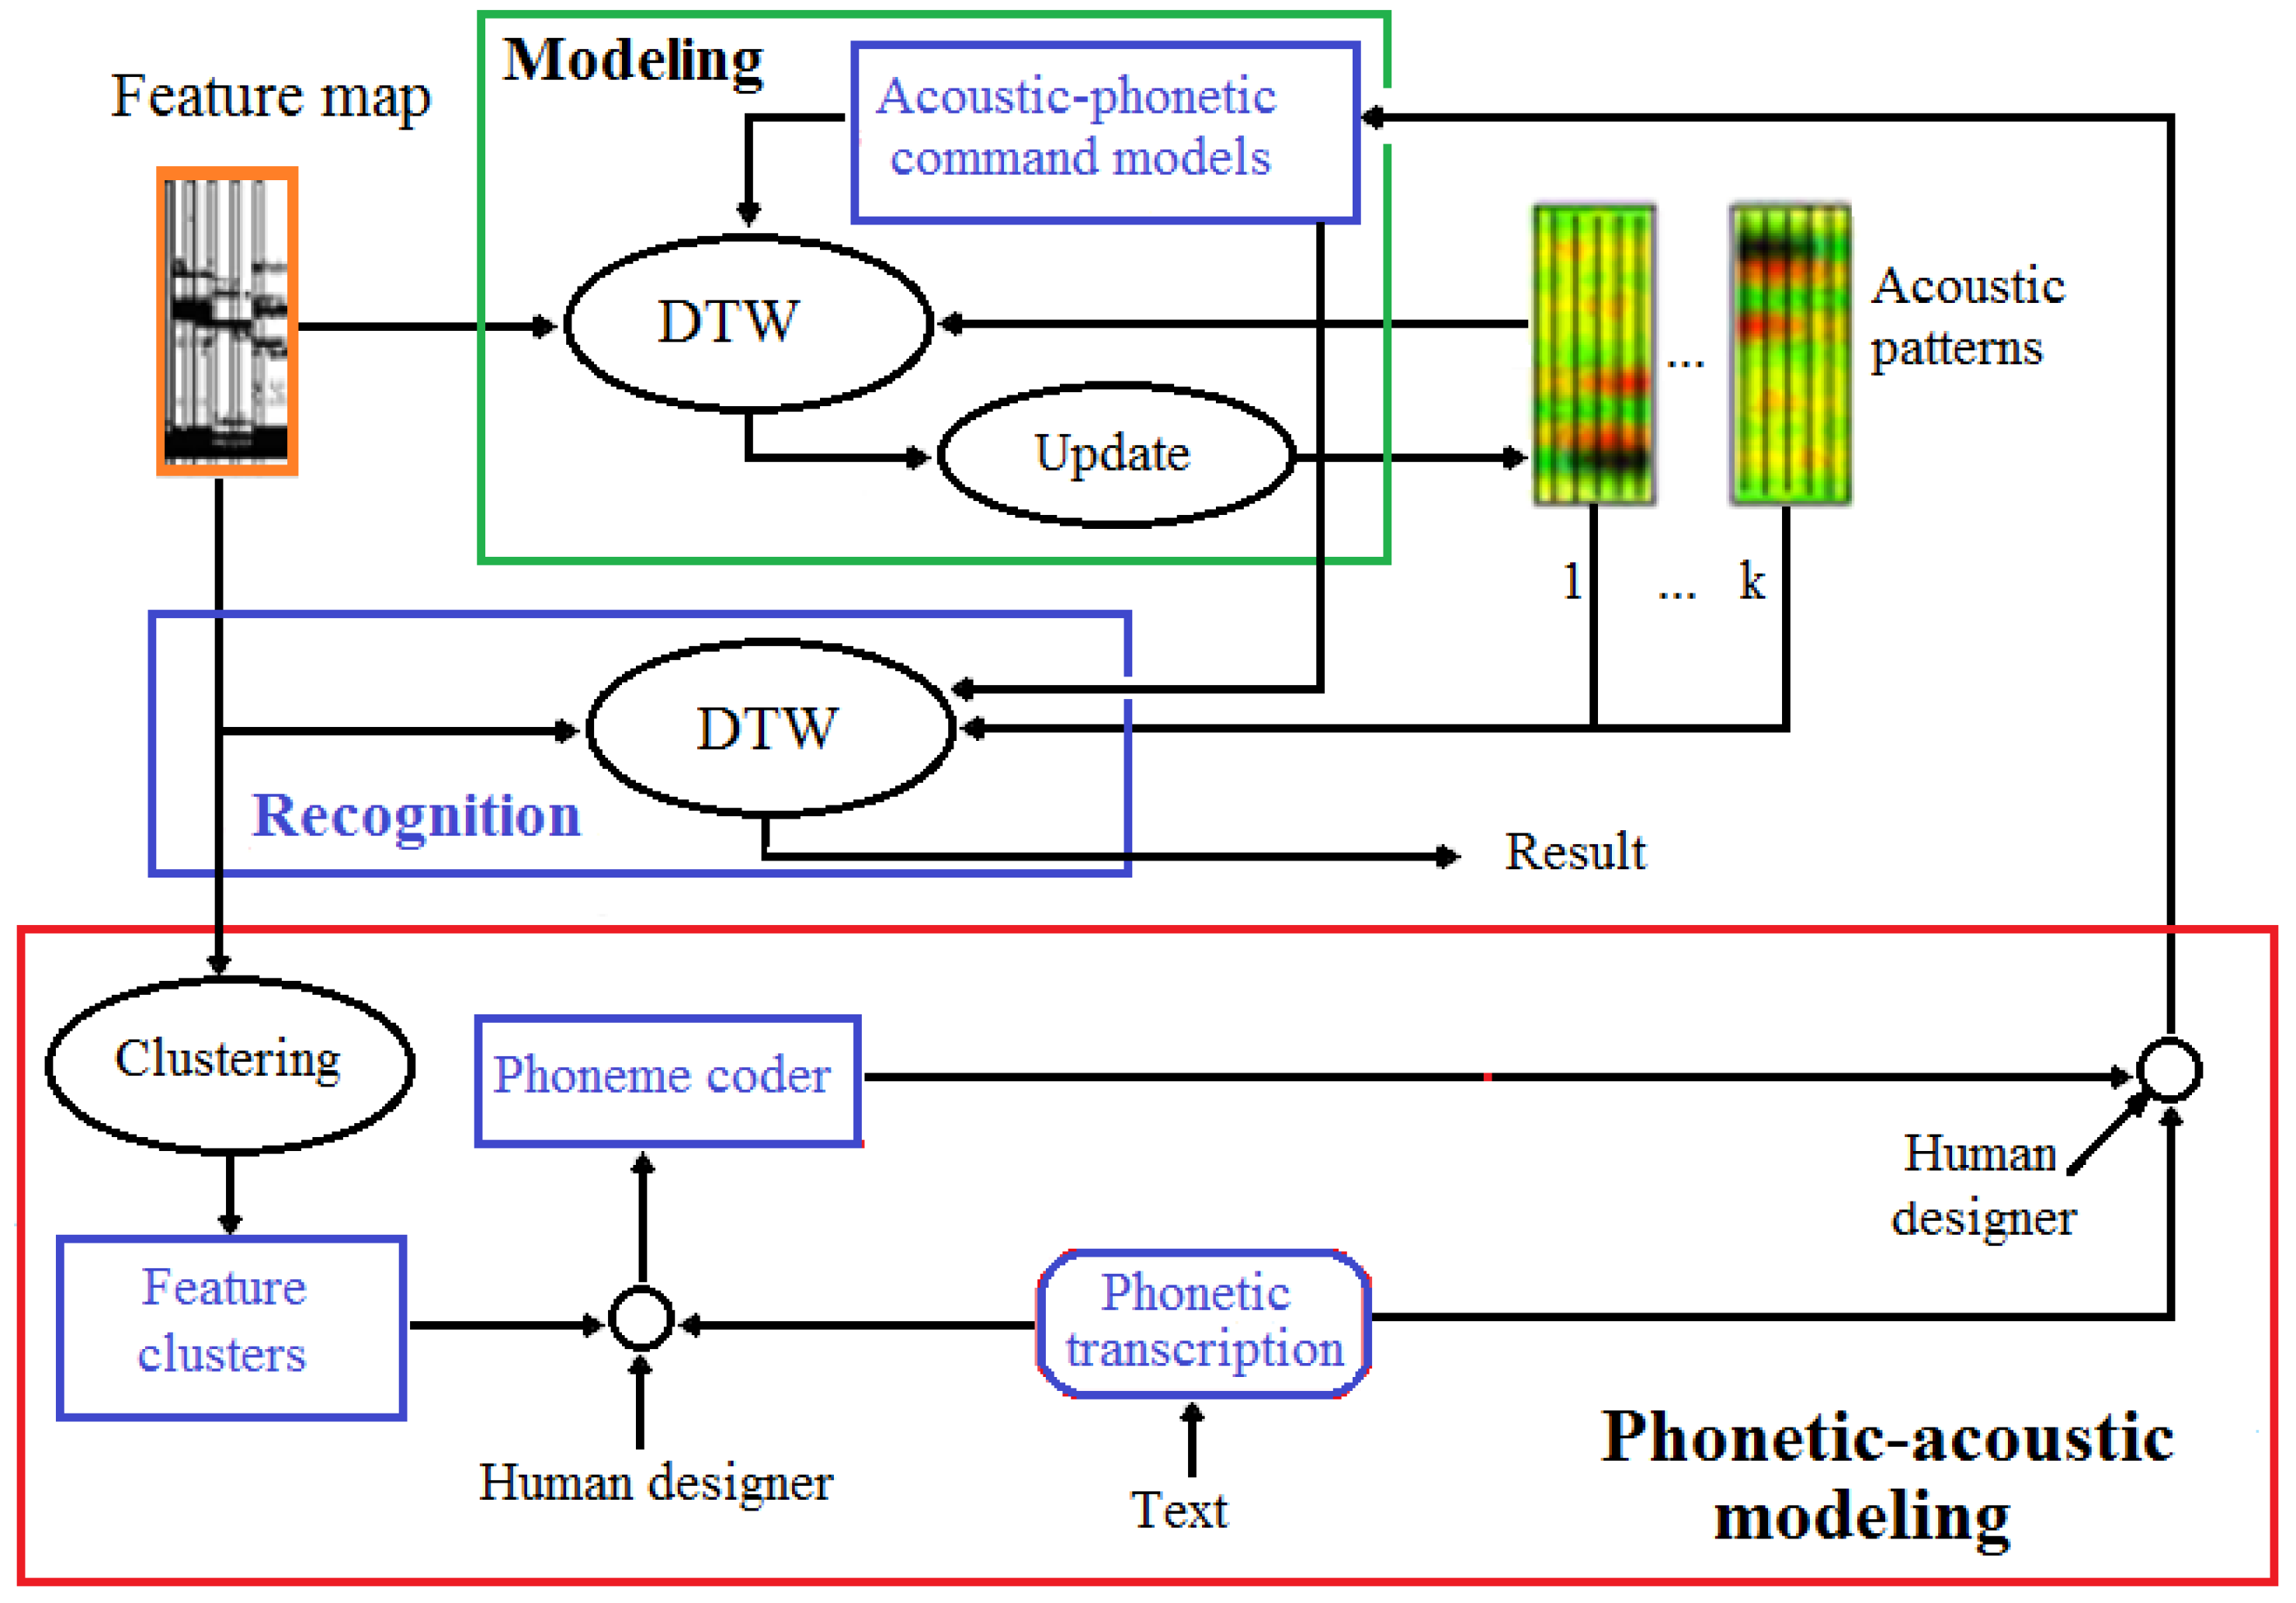
In the open dictionary case, the spoken command models are created from their phonetic descriptions and few acoustic samples only. A language-dependent acoustic phoneme-coder is needed to connect the symbolic representation with a sequence of acoustic features (Figure 21).

Phonetic-Acoustic Transcription

A text-like representation of a command is translated into a phonetic-acoustic form, under the assumption of default accentuation. This is done in two steps. The first step makes a word and phoneme detection and leads to an internal phonetic transcription, while the second step generates a time-relevant sequence of acoustic category symbols.
A typical set of phonemes in the Polish language consists of 40 elements (including breaks and silence). These phonemes constitute a subset of phonetic entities defined in the IPA alphabet (International Phonetic Alphabet) by the International Phonetic Association. Among them, there are 31 mono-phonemes and 9 bi-phonemes. Elements of the first type will be represented by single ASCII-letters, while the latter by two-letter sequences. Six vowels may appear in two forms—stressed (accented, of long duration) or non-stressed (abbreviated). Hence, the letter dictionary consists of 37 ASCII-letters for the encoding of 46 phonetic entities.
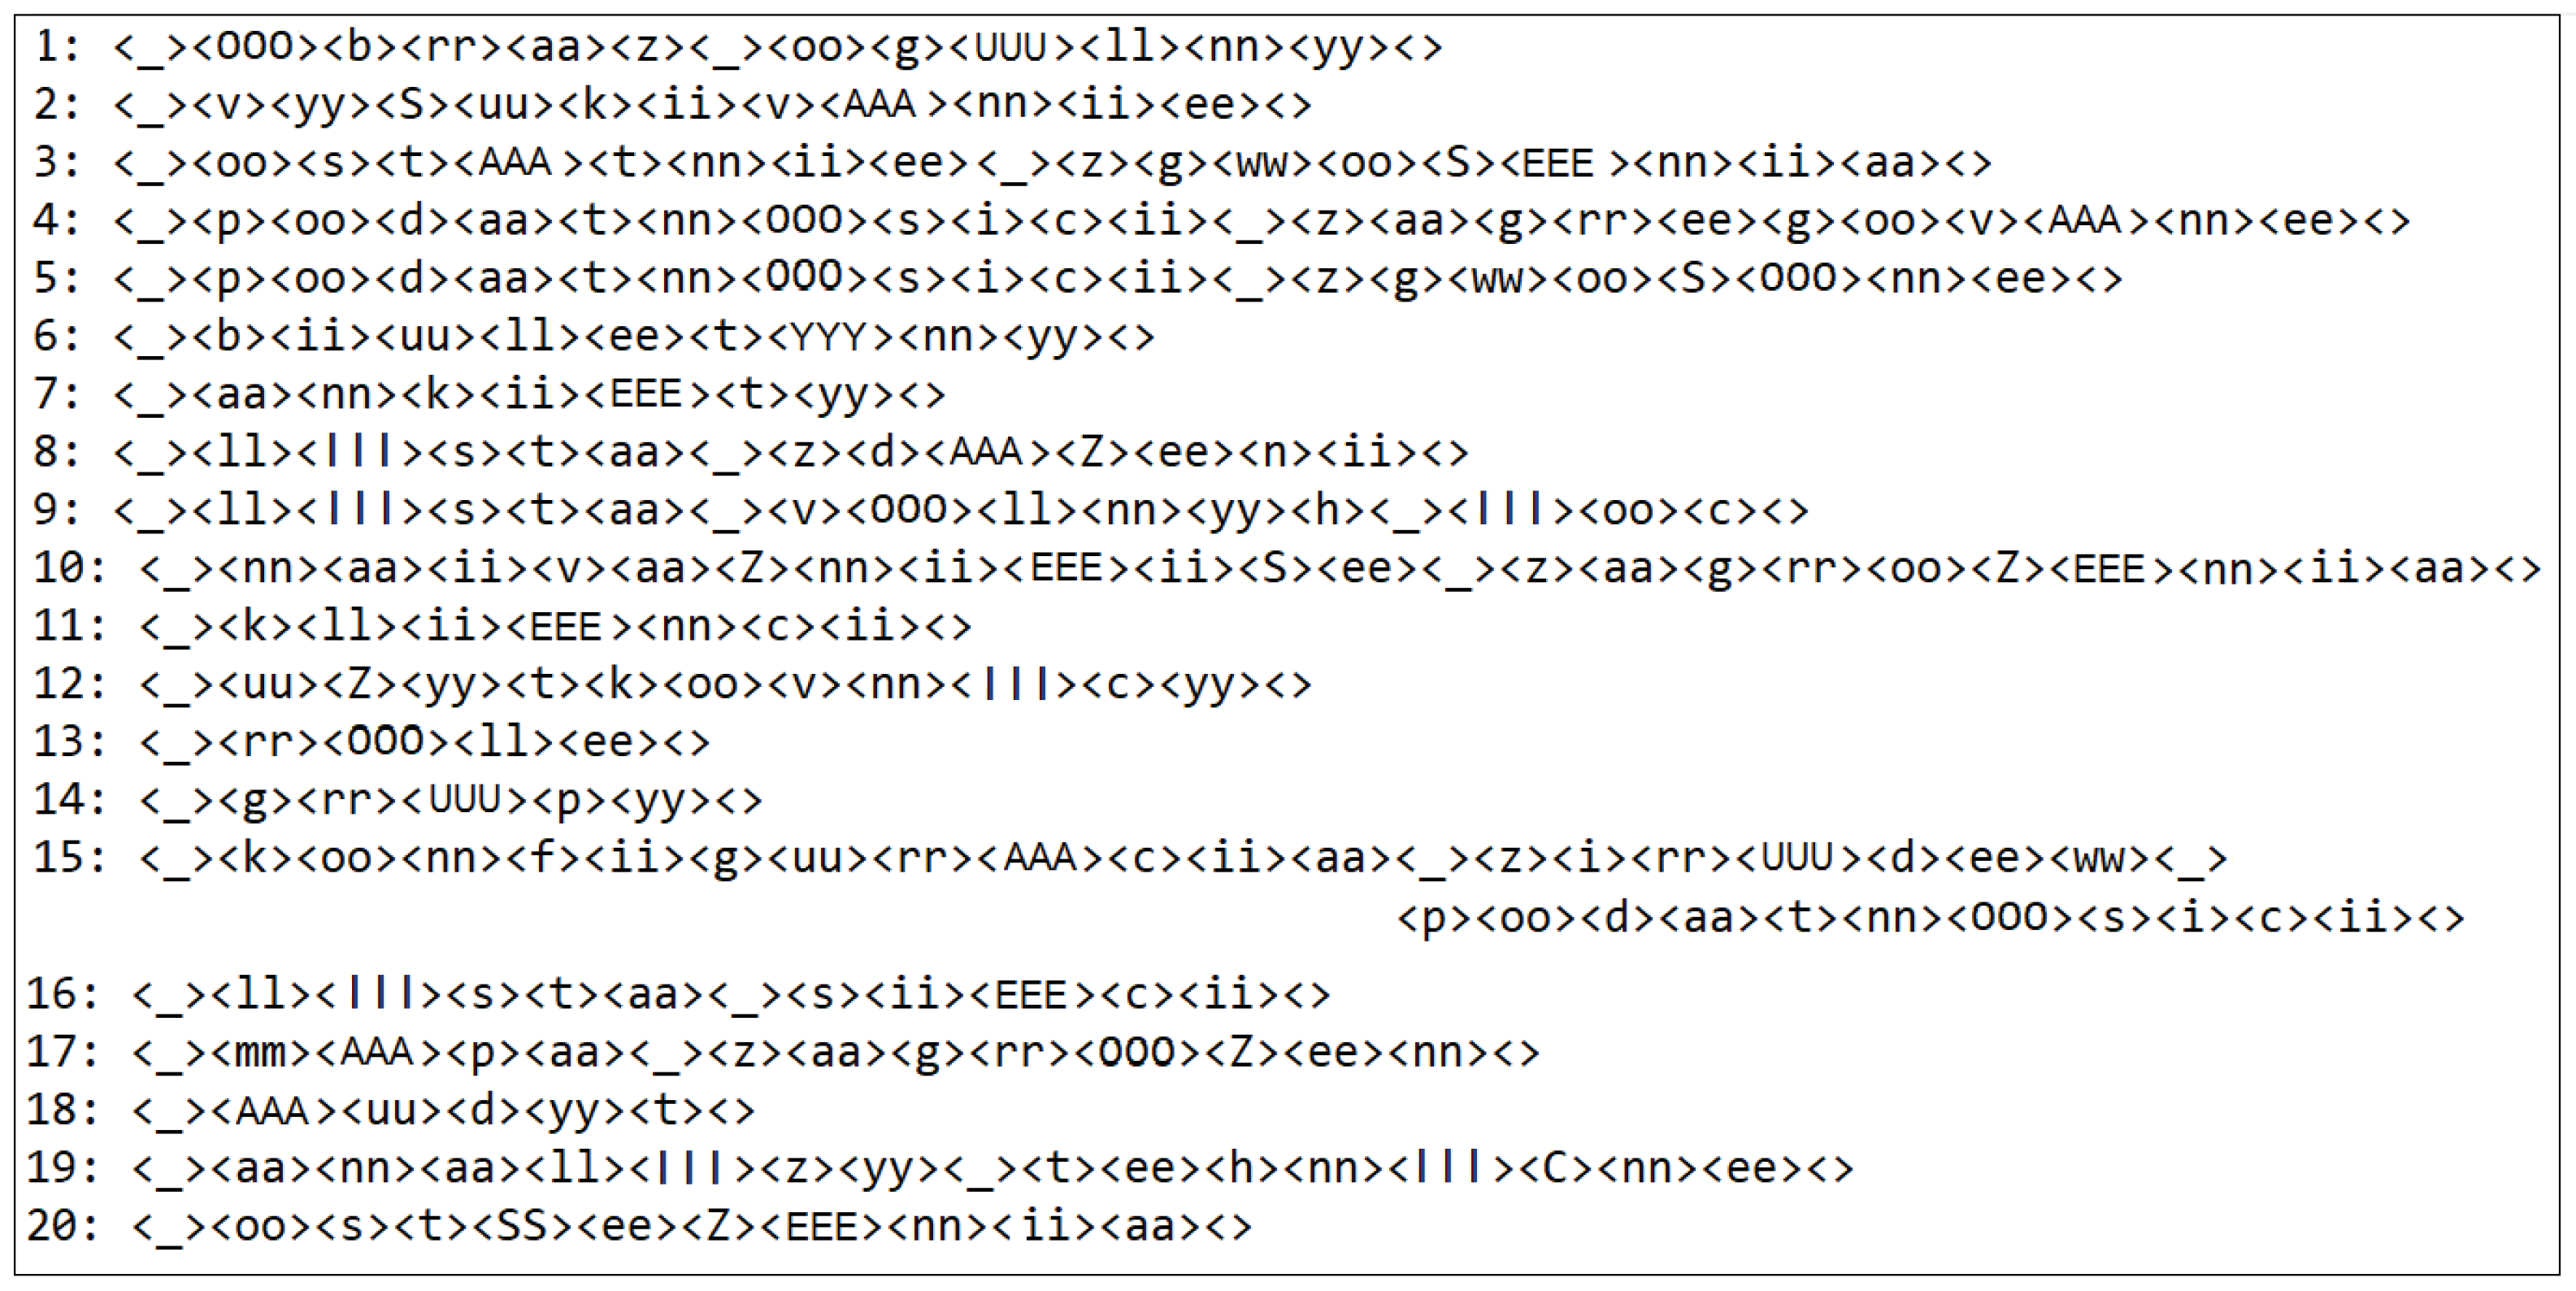
The time duration is set by default depending on the type of phoneme and whether it appears stressed (accented) or abbreviated. Stressed vowels get a relative length index 3, while unstressed—2. Typically in Polish, before-the-last syllable in a word is accented. Consonants get time duration of 2 or 1, depending on their type. Bi-consonants are composed of mono-phonemes of length 1. The transitions between phonemes are represented by anonymous symbols ”<” (left context) and ”>” (right context) (see an example on Figure 22).

The Phonetic-Acoustic Coder

Feature vectors obtained from training data are clustered and phonetic symbols need to be assigned to cluster representatives. The human designer has to review the training data samples and to label particular signal frames in terms of phonetic symbols (Figure 23).
On the other hand, signal frames of the training data are automatically labelled by the nearest cluster index. This enables the human designer to select a subset of frames that represents a particular phonetic entity and to provide labeled learning samples for a feature vector encoder.

4.3.3. Speaker Modeling and -Recognition

Speaker modelling is performed in the learning state S c audio learning , and speaker recognition is done in the recognition state S c audio recognition (Figure 15). Typical speaker recognition approaches emerge from pattern recognition and machine learning domains. They employ computational techniques like GMM (Gaussian Mixture Model) for feature clustering, and SVM (Support Vector Machine), Stochastic Factor Analysis, Probabilistic Linear Discriminate Analysis (PLDA) or Deep neural Networks (DNN) [43,44] for pattern classification. The basic approach, called UBM-GMM (Universal Background Model) [45,46], finds GMM mixtures in the feature vector space to represent an universal background model for all speakers and models of individual, selected speakers to be identified. The GMM-SVM approach operates on supervectors of features, resulting from a composition of cluster representatives, to learn a SVM classifier. Joint Factor Analysis, i-vectors [47,48] and PLDA methods are based on factor analysis, performed in the space of feature supervectors (the first two methods) or i-vectors (the PLDA method). Recently, Deep Neural Networks are demonstrating their applicability to speaker recognition [49,50,51].
Our speaker-modelling and -recognition approach is an own implementation of the standard UBM-GMM approach (Figure 24), but the general design scheme allows to attach any other type of speaker modelling and -recognition methods.

5. Implementation of Vision Processing

The vision agent a vision is composed of three subsystems (Section 3.3.1). The real receptors R vision , 1 and R vision , 2 , are responsible for data acquisition and subsequent conversion to the format required by the virtual receptor r vision . Virtual receptor r vision gets images from R vision , 1 and R vision , 2 and does data preprocessing and segmentation. The behaviours of the control subsystem c vision are responsible for user tracking and gesture recognition. Figure 25 presents the flow of data processing performed by the vision agent a vision .

5.1. Real Receptor: Data Acquisition

The two real receptors R vision , 1 and R vision , 2 are two RGB cameras. Two double-camera setups were prepared, both enabling the generation of depth maps using stereo algorithms. First is the 22 cm baseline stereo system built using two industrial grade digital cameras, with interchangeable optics, which makes this solution a viable option for testing and tuning. In order to get good quality depth information, both cameras are synchronised using the 20 Hz trigger signal from the external generator. This setup, although very flexible in terms of configuration, is not cheap and requires a special installation procedure (mounting, calibration, etc.). The other setup was produced by selecting consumer grade devices. Those are Intel RealSense D415, with a field of view and resolution similar to the first setup, but much cheaper, factory calibrated and available in small form factor. It is also able to produce depth information on-board, without the heavy computational requirements imposed on the host system. It is also required, that the field of view of the setup covers a sufficient area, such that all the gestures made by the operator standing about 3 meters in front of the cameras can be recorded.

5.2. Virtual Receptor: Image Preprocessing and Segmentation

As image processing algorithms require colour images with an aligned depth map, i.e., an RGB-D image, the virtual receptor r vision either acquires images from the real receptors R vision , 1 and R vision , 2 and rectifies them or those receptors provide themselves aligned images, depending on the setup used. The data produced at this stage is similar, and as such in the majority of the following sections it is not important, which setup was used.
As it was mentioned above the first task of the preprocessing module is to align the images obtained from the cameras (if they are not hardware rectified) using the calibration parameters acquired during the system installation. Rectified RGB images are then used to generate a disparity map with the Semi-Global Matching (SGM) algorithm [52]), and from it the depth map (distances in meters from the camera to the objects in the scene).
The next task is to detect regions of interest in the scene, i.e., face and hands of the operator. Face is detected first (using the Haar based cascade classifier [53]) and tracked in subsequent frames using the KLT tracker (i.e. the Kanade-Lucas-Tomasi feature tracker). More specific features of the face are then extracted, namely eyes, nose, lips and chin line [54]. Based on the face oval skin tone of the operator’s face is evaluated and saved for further use in hand segmentation. Position of the face in 3D space with respect to the cameras is then calculated (using the information in the depth map), which is also stored as the reference point for further processing.
Based on the distance from the cameras to the face and the skin tone the operator hands are segmented. Only the image parts with the proper colour distribution are processed, and from those only those positioned inside the active area (around the operator) are selected. Here two important assumptions were made: operator is wearing long-sleeved clothes in non-skin colours, and operator is standing in free, unoccluded space (no other objects or people apart from the operator are visible). Hands are also tracked in subsequent frames (similar to the face region) to make the processing faster. Extracted face and hand regions, along with their locations in space, are then passed to the control subsystem c vision .

5.3. Control Subsystem: Gesture Recognition

The basic control subsystem c vision mode of operation is continuous tracking of hand positions and translating them into the position of the cursors on the screen. To move the cursor, operator’s arm has to be extended, such that his or her hand is at least 20 cm closer to the camera than the face. This enables the operator to lower the hands without moving the cursor on the screen, which makes working with the system for longer periods of time less fatiguing.

5.3.1. Hand Poses

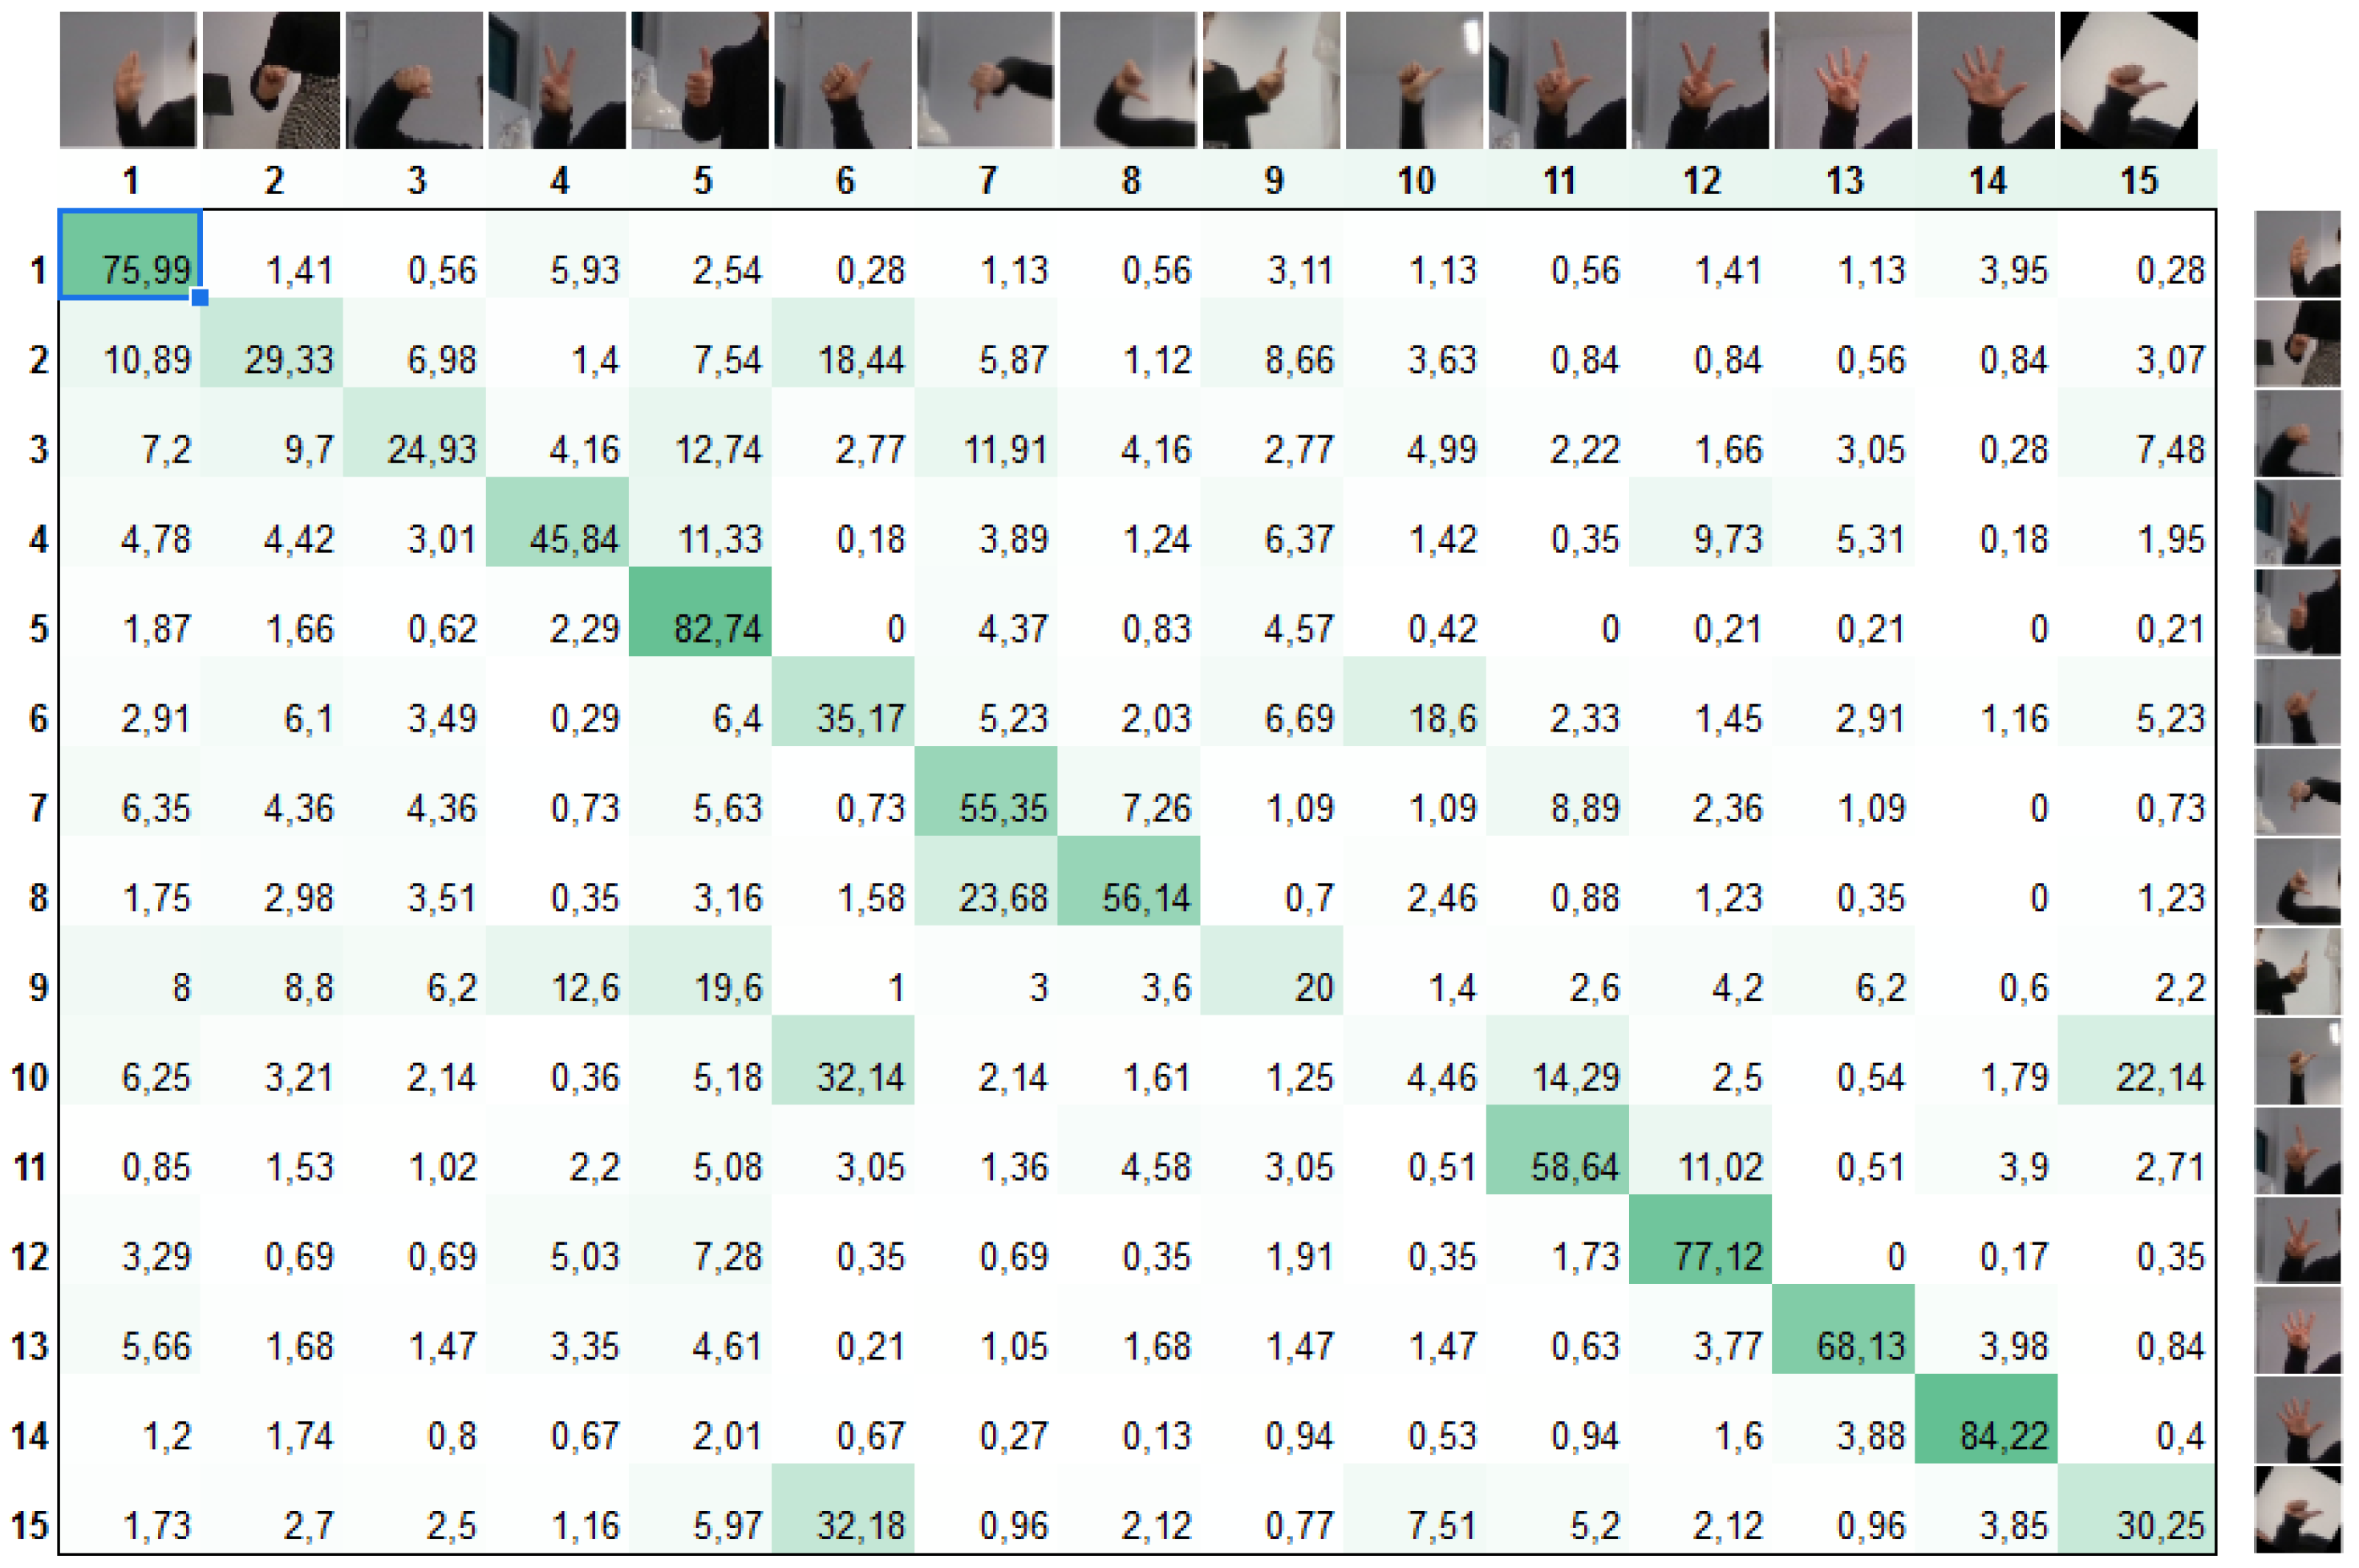
Moving the cursor on the screen without any interaction (e.g., clicks) would be almost useless. Our solution uses hand gestures to interact with the system, what is quite natural for the users. For example, to simulate pressing a mouse button one has to close the hand (make the fist), opening the hand releases the button. Thumb up and thumb down gestures were selected to trigger scrolling up and down. Two more gestures were also prepared to trigger keyboard shortcuts in the system—one and two fingers extended (Figure 26). Mapping between gestures and actions is configurable, so one can choose to trigger different actions for known gestures.
Hand gestures are recognised based on the pair of RGB and depth images containing hand cropped from the original image. Results from the classifier are then postprocessed to filter out eventual false detections — a gesture is accepted if it is detected in at least three consecutive frames.
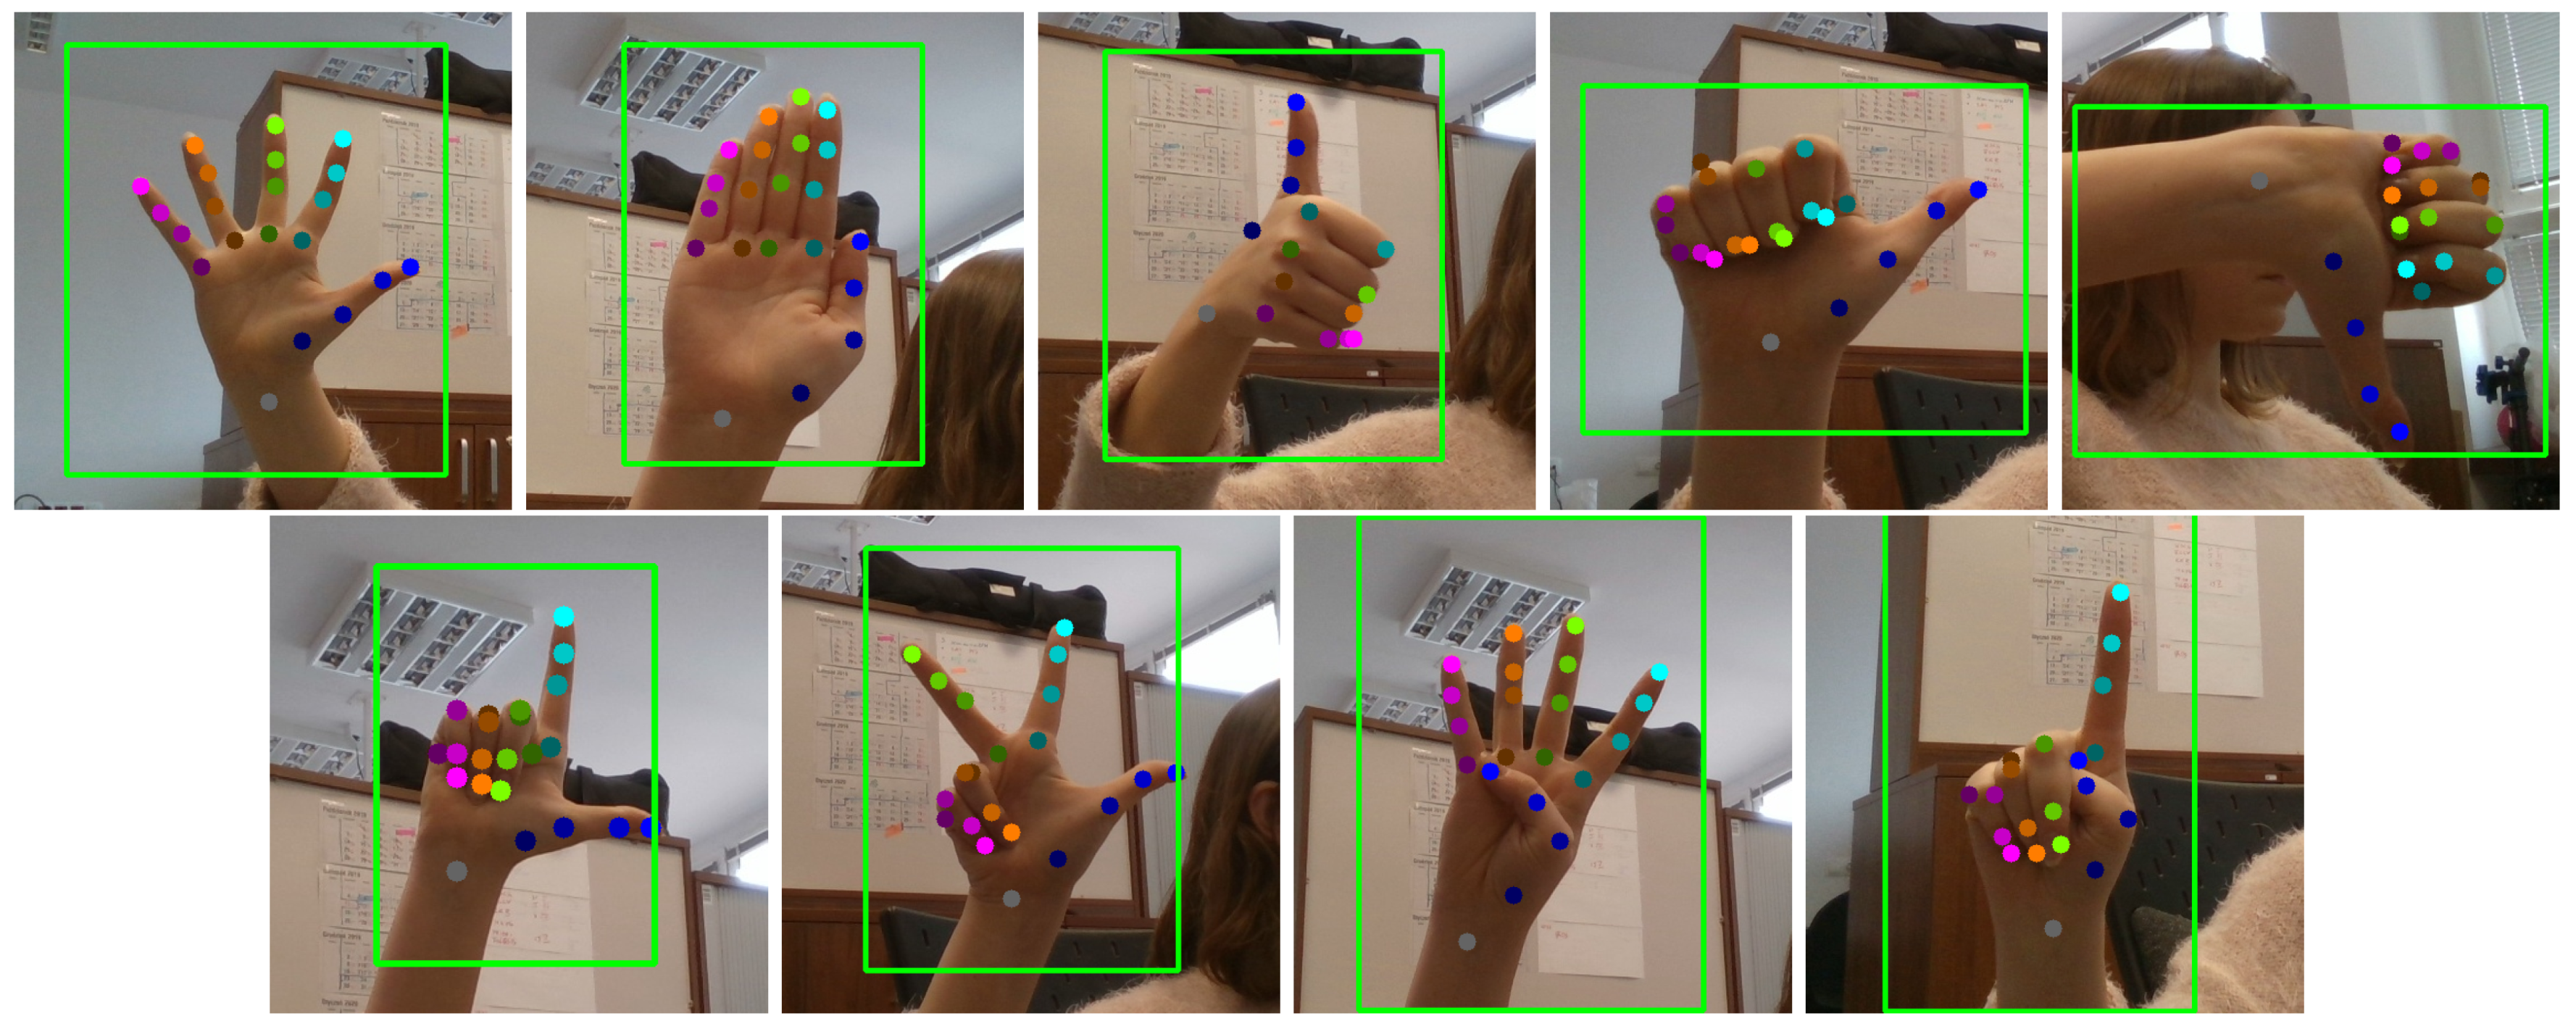
Gestures are classified using a pre-trained SVM (Support Vector Machine) with HOG features (Histogram of Oriented Gradients). This solution, although accurate and fast, has a drawback. It is cumbersome to add the new gestures. User has to collect hundreds of hand images in different conditions to retrain the classifier. To enable the users to extend the gesture catalogue an alternative solution is also available, based on the hand skeletonisation. Recent advances in this field enabled real-time hand-pose estimation using 21 joints model (e.g. MediaPipe [55], 3DHand [56]). After the joints fitting procedure is applied to the image, the actual gesture is classified using 5-NN classifier. The gesture catalogue in this case is composed of around 15 samples for each pose. Sample training gestures with joints overlay, calculated by us using the 3DHand tool, are presented in Figure 27.

5.3.2. Dynamic Gestures

Dynamic gestures extend interaction possibilities by allowing the users to wave their arms to trigger actions. Dynamic gestures must be activated by one of the static hand gestures, so that the system does not interpret hand trajectory as the movement of the cursor for a while (what can potentially lead to unwanted actions on the screen). Sample dynamic gesture can be waving of the hand from right to left to trigger the “go back” action and from left to right to trigger the “forward” action (which can be associated with the shortcuts invoking previous and next tab in the browser). Dynamic gestures are recognised by dynamic time warping (DTW) algorithm [57], that takes the last 50 position of the hand as the input and tries to find the reference trajectory that is the closest to the gesture made. If it finds one with a sufficient score it triggers the keyboard shortcut associated with this action. Sample trajectory is presented in Figure 28.

6. Implementation of the Presentation Interface

The role of the presentation module is to convert data delivered by the vision and audio modules into commands intelligible to the NCP visualisation component.

6.1. Interaction with the NCP Visualisation Component

The presentation module transforms messages received from the other modules into events usually caused by standard input devices, i.e., keyboard, computer mouse and touch screen. Mapping of voice commands to simple events produced by those devices would require a separate voice command for each key/button stoke, what would be inconvenient. Therefore, the presentation module can produce multiple events in response to a single voice command or gesture. Each word composing a voice command does not need to be associated with a keyboard shortcut, but the whole command should be associated with an adequate action of the visualisation component. On the other hand, there is a strict association between:
  • events caused by the movement of the cursors and the motion of the user’s hands,
  • events of the computer mouse buttons and static gestures shown by the user.
Using either the complex commands, or the above events, the presentation module interacts with the visualisation component. The control subsystem of a pres sends the commands to the a OID , which transforms them into events understandable to the visualisation component. An example of the association between keyboard shortcuts produced by the module and reactions of the visualisation component are presented in Table 1.

6.2. Multi-Modal Fusion

There are two main approaches to fusion: feature-level (early) fusion and decision-level (late) fusion [58]. In feature-level fusion, the features are simply concatenated and provided to the classifier as a single vector. In decision-level fusion, each feature set is given as a separate vector and the classifier decides how to combine the data.
In our work, it was straightforward to use a late fusion approach. For decision-level fusion of gestures and voice commands, a separate classifier was trained for each command modality. Every basic classifier needs to output a vector of class probabilities rather than selecting the most probable class. Probabilities of all commands estimated by both modality classifiers are next send to the input of a multilayer perceptron (MLP). It is known to be effective for problems with a relatively small number of input data. One has to specify the number of hidden layers, number of neurons in each layer, learning rate and momentum. These parameter values are determined in a grid search process.

7. Tests

7.1. Audio Tests

The purpose of audio tests is to verify that our implementation can achieve a sufficiently high success rate, both in command- and speaker-recognition tasks. We do not make comparison with other methods, as the contribution of this paper is in the system design methodology and not in the implementation of a particular recognition functions. Our aim is also to provide on-line signal processing and not prerecorded test bases.
The audio module has been tested in two scenarios: off-line tests in a dominantly “closed set” scenario, and on-line tests in an “open set” scenario.

7.1.1. Command Dictionaries

For the verification of speech recognition efficiency, spoken command samples have been recorded, obtained from 11 speakers and containing 20 spoken commands. As mentioned earlier, the audio samples have been recorded by 3 stationary microphones and one mobile microphone. For every speaker and every command there are at least 6 utterances recorded with stationary microphones (two times for every of the 3 different microphones used) and other 6 utterances recorded with the single on-head mobile microphone.
The list of tested 20 Polish language commands (one-, two- or three-word phrases) is as follows: obraz ogólny, wyszukiwanie, ostatnie zgłoszenia, podatności zagregowane, podatności zgłoszone, biuletyny, ankiety, lista zdarzeń, lista wolnych IOC, najważniejsze zagrożenia, klienci, użytkownicy, role, grupy, konfiguracja źródeł podatności, lista sieci, mapa zagrożeń, audyt, analizy techniczne, ostrzeżenia. Their translation into English is: general picture, search, recent reports, aggregated vulnerabilities, reported vulnerabilities, bulletins, surveys, list of events, list of free IOCs, major threats, clients, users, roles, groups, vulnerability sources configuration, network list, threat map, audit, technical analysis, warnings.

7.1.2. Command Recognition Results

The sample set was split into two parts: the learning subset and the test subset. Every 6 samples of some command and speaker were split as following: 3 samples were learning samples and remaining 3 samples were test samples. After creating models of spoken commands, based on the learning samples and being common for all the speakers, every test sample was recognised independently from the others.
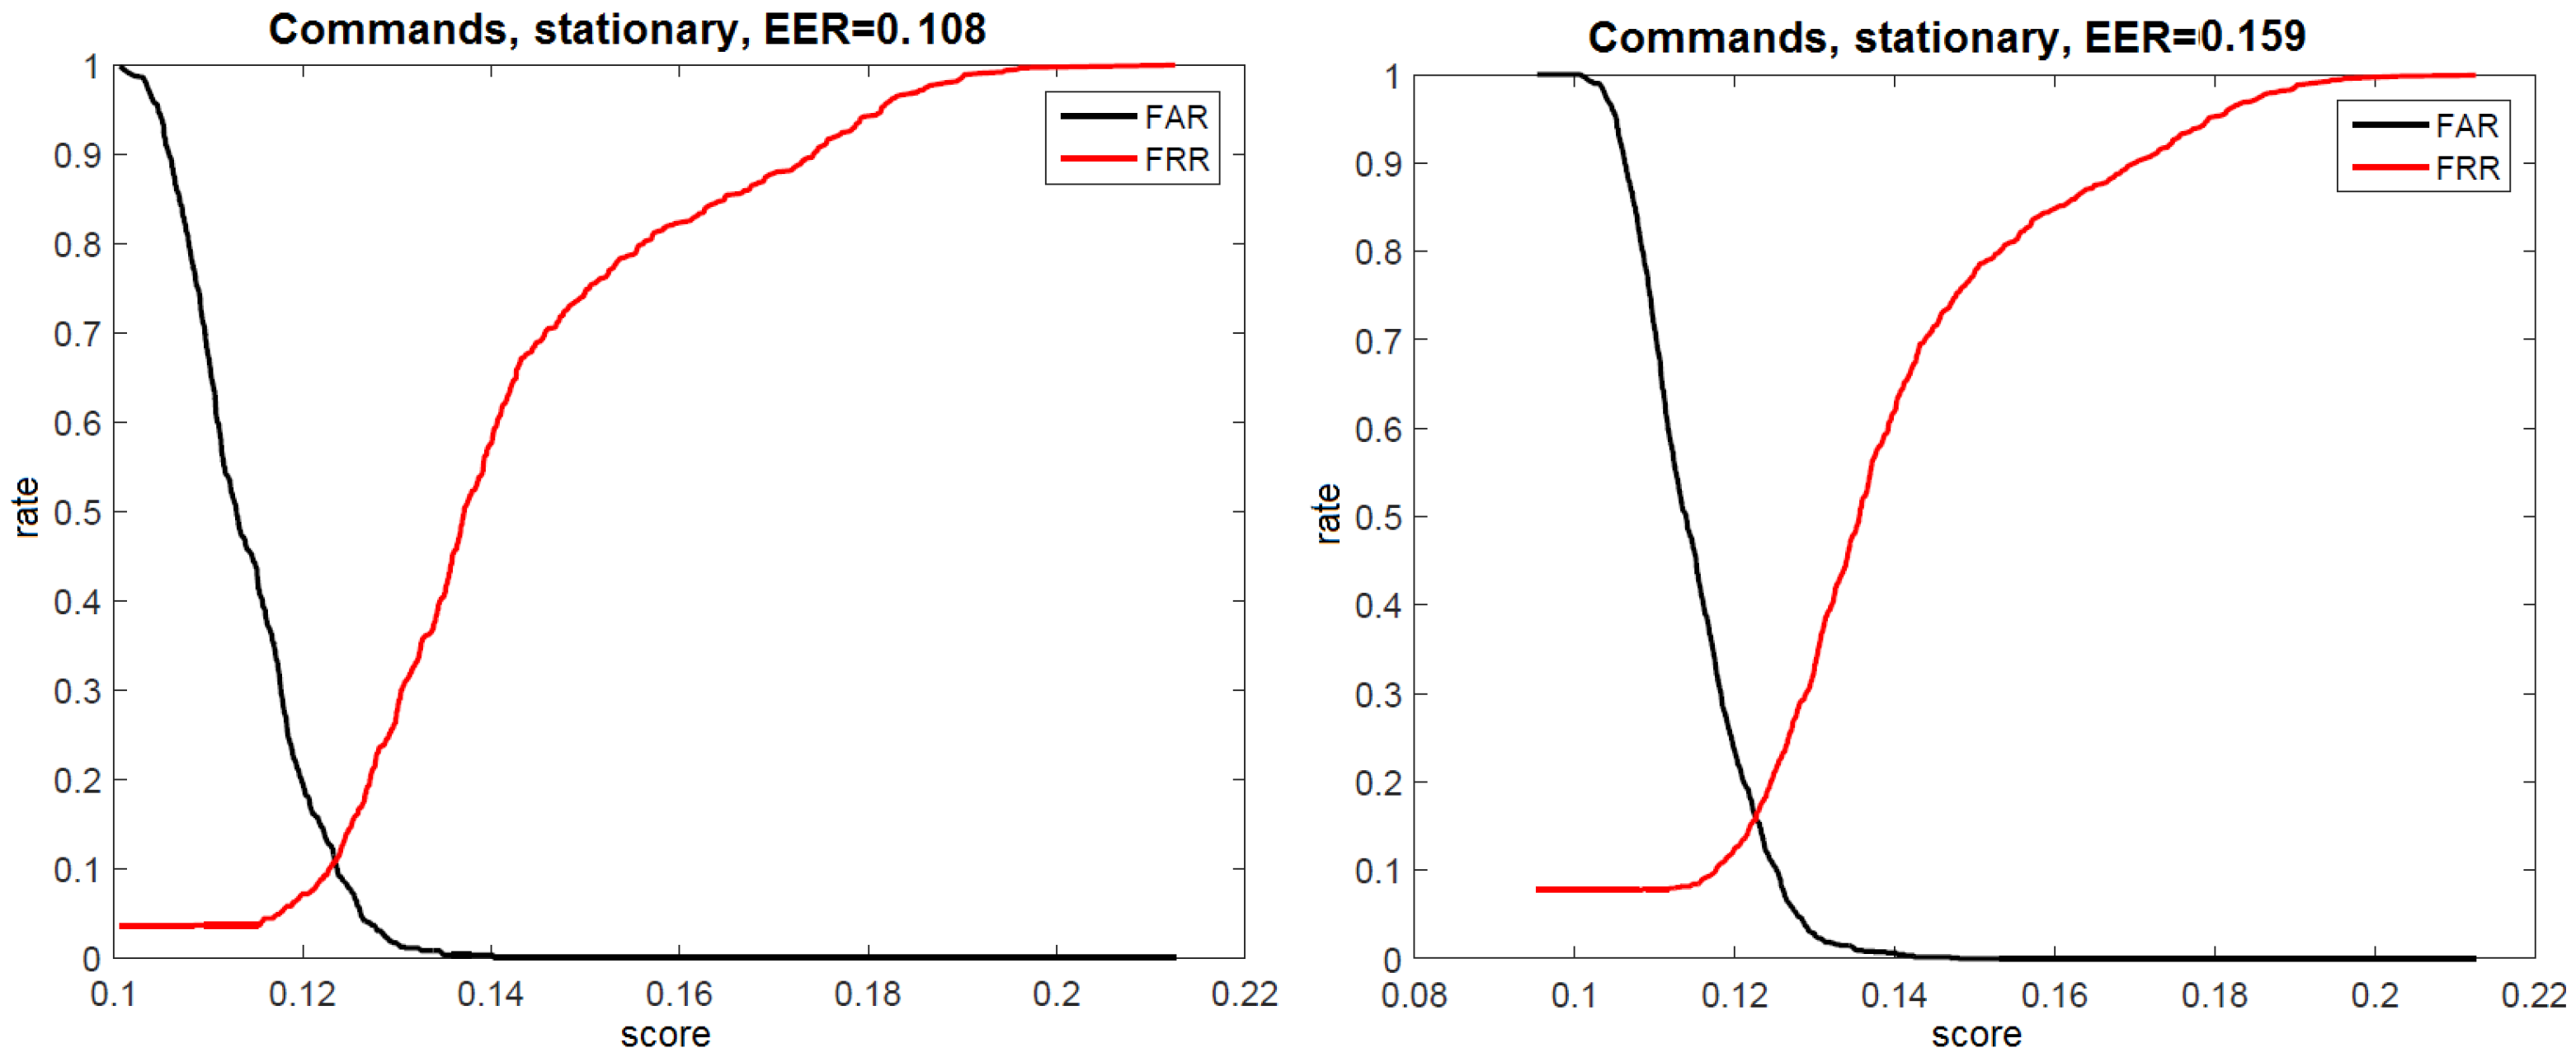
The recognition procedure followed a classification on a closed set. The winner was always selected from the set of 20 existing commands. For every test sample the command model with the lowest distance was declared as the winner (e.g., Figure 29). The equal error rate (EER) was found at the level of 0.108 (for stationary microphones) and 0.159 (for the mobile microphone).

7.1.3. Speaker Recognition Results

Tests have shown, that making speaker recognition decision on the base of single commands leads to a relatively high error rate. Thus, we implemented a procedure that accumulates speaker identification scores stretching over the time of several commands. In particular the first decision starts after 3 commands have been evaluated. Up to 10 past command scores are accumulated for the decision procedure. Hence, when 30 genuine test samples are available for every single speaker, up to 28 identification decisions are generated for this.
The recognition process is based on the following assumption. If for a given test sample the nearest model is the one of the true genuine speaker, then no error is generated, but still a ”no decision” result is possible. In order to respond with the proper speaker identifier, the belief score for the selected genuine speaker must exceed the belief score obtained for the UBM model by a given threshold.
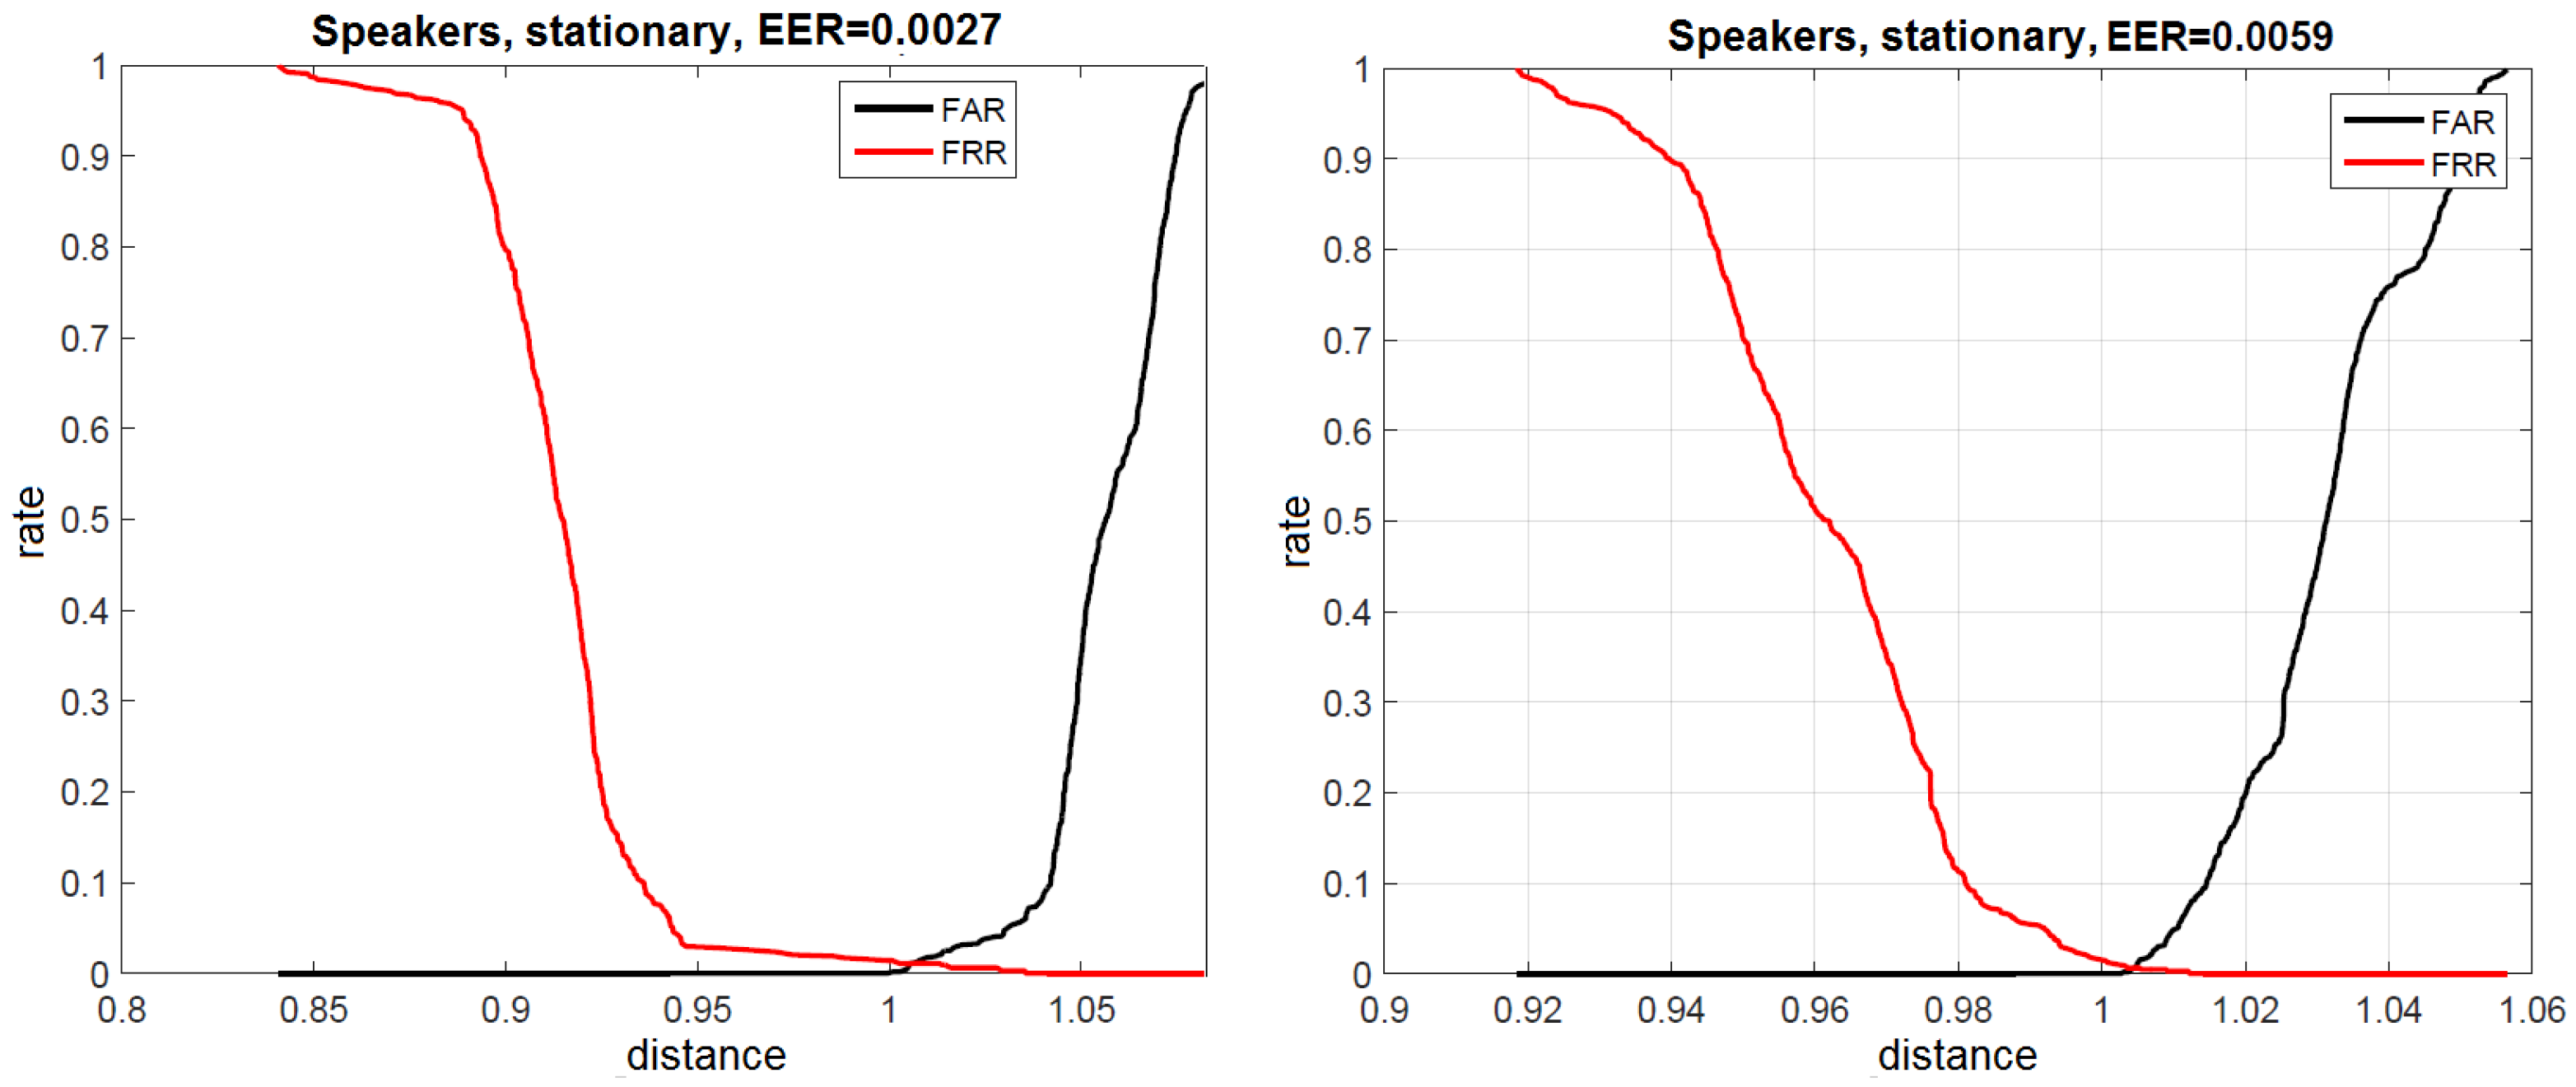
The recognition procedure has to consider both a closed set (test samples come from the limited set of commands) and an open set case (test commands other than modelled can appear). This lead us to a decision rule that combines two conditions, each one controlled by a different threshold value. First, the possible winner among modelled commands is selected, on the basis of a “softmax” rule (controlled by a belief threshold). Next, the winner is conditionally accepted, if the matching quality between the test sample and the selected model is higher than the score threshold. Speaker recognition tests for 11 registered speakers are illustrated by Figure 30.
Under conditions of a closed speaker set, the system demonstrates a high success rate. For samples recorded by stationary microphones, the equal error rate was 0.27% (for off-line tests) and 0.59% (for on-line tests). Unfortunately, the optimal threshold strongly depends on the noise level in the recordings and thus, it is difficult to predict. Typical distances of the test samples to genuine speaker models were only few percent lower (5.9–6.4%) than the distances to the UBM, while the distances to imposter models were several percent higher than the distance to the UBM.
The success rate when using the mobile microphone was slightly lower, as equal error rates of 1.9% (for off-line) and 2.6% (for on-line tests) were observed.

7.2. Related Audio Tests

7.2.1. Speech Recognition

Successful research in non-commercial speech recognition is among others related to two large international projects: Kaldi [42] and CLARIN [59].
CLARIN database was selected for tests, taking advantage of its free license and compatibility with Kaldi project recipes [60]. CLARIN corpus contained speech samples of 295 male and female speakers of different age. The voices of the speakers were recorded in a studio environment, where each of them was asked to read 20 or 30 word sequences. In total, there were 553 recording sessions, around 10% of which (55) were randomly selected to constitute the test subset, while the rest were part of the training subset. The voice samples of none of the speakers were present in both the training and the test set. There were 265 different voice samples in the training set and 30 in the test set. A lexicon of 59211 unique words resulting in 87059 entries (as multiple pronunciation variants of one word are possible) and a triphone language model, were also available.
Using Kaldi several HMM-GMM model variants as well as hybrid HMM-DNN models can be trained. This is followed by decoding and evaluation on the test set. Most of the HMM-GMM models are based on statistical acoustic models (monophone and triphone), while nnet3 and chain are HMM-DNN models, with deep learning applied in the acoustic modelling stage. Various language models, e.g., N-grams and grammars, support symbolic recognition. The CLARIN website lists word error rate (WER) scores obtained utilising CLARIN-test set for all considered models trained by using CLARIN-train data. Some of the results are presented here:
  • mono0—the initial monophone model (WER = 29.9%)
  • tri1—initial triphone model (WER = 15.88%)
  • tri3b—triphones + context (+/– 3 frames) + LDA + SAT (fMLLR) with lexicon rescoring and silence probabilities (WER = 11.82%)
  • nnet3—regular time-delay DNN (WER = 7.37%)
  • chain—a DNN-HMM model implemented with nnet3 (WER = 5.73%)
Our recognition rate should rather be compared with the rate of the basic mono0 model of CLARIN-Kaldi. Although we recognise an extremely limited set of 2–3 word phrases (10–22 phrases) instead of a large vocabulary of words, but no language model is implemented. One should also take into account that both CLARIN and Kaldi are large multi-year research projects conducted by many multinational research teams and solely specialised on developing speech recognition technology. The role of our own speech technology in our project is to demonstrate and verify the real-time system design approach based on embodied agents.
Recent research deals with a front-to-end use of deep neural networks to cover both acoustic, phonetic and symbolic recognition levels. We tested CNN networks applied to spectrogram and mel-spectrogram images, on two speech bases: (1) our testsets 1, 2 and 3 (with 10 and 22 commands from 16 speakers), and (2) a public testset “Tensorflow Speech Commands Data Set v0.02” from which 10–20 commands have been selected.
The test was implemented in Python 2.7 or 3.5 using among others the package “python-speech-features v0.6”. To speedup the tests we applied the tool “Google Colab” that allowed for a remote test of our Python program on a Google machine. Especially we tested a strong front-end approach, where the Voice Activity Detection (VAD) was limited to a simple energy check. The results were unsatisfactory. Due the small available training set, transfer learning was applied, pretrained models of VGG-16 were taken from Keras. The classification layer was replaced by a multi-class SVN, implemented in scikit-learn and trained on the available datasets. Unfortunately, the system was not able to learn more than 5 classes properly. The recognition results on the validation subset were by 10–15% worse than in our basic system.

7.2.2. Speaker Recognition

Other work examined the capabilities of a deep-learning front-end method for text-independent speaker recognition systems. A convolutional network was tested in combination with speech features resulting from spectrograms, cepstral- and wavelet transforms [61]. Conducted experiments were based on Python programming language and Keras neural networks package. A feature map classification system was designed, based on a feedforward CNN, a specialised VGG-19 deep network, available in Keras, using a selected subset of the ICB2013 speaker recognition competition database for 50 speakers. The obtained speaker recognition rates were compared with an i-vector- and probabilistic linear discriminant analysis (PLDA)-based system, implemented with bob-kaldi and scikit-learn [62]. The recognition rate obtained on the validation set (the training set contained ca 60800 MFCC- or MFC-images (mel-spectrograms) was: 0.8523 for MFC maps of size 150 × 40, or 0.90132 for maps of size 200 × 40 (where the EER = 0.30) 0.8249 for MFCC maps of size 150 × 12.
Using a VGG19 net applied to MFC maps, even a 0.94 recognition rate was reached (with EER = 0.23). Still this is worse than a recent machine learning approach, based on i-vectors and PLDA classficiation (where for the same database, a recognition rate of 0.96 and an EER of 0.07 were reported [62]).
Recent research has demonstrated that deep neural networks can reach highest performance in speaker recognition, when trained on very large database, like Voxceleb [51] that contains recordings from ca. 6000 speakers.
Again, like in the speech recognition task, the main difficulty for applying the DNN approach in our work was the need to have a large training database and an own licence-free implementation of deep neural network technology. This was not the case. The majority of new techniques is being developed in Python whereas our on-line working system, developed in the C++ programming language, satisfies response time limits and avoids the use of licensed software.

7.3. Vision Tests

7.3.1. Classifier Accuracy

The goal of the first test is to verify the accuracy of the static gesture classifier. Our training set contained more than 3 thousand images for 6 gestures, gathered for 3 different operators. The classifier achieved 98% accuracy, and its confusion matrix is presented in Figure 31.
Different tests were conducted for the skeleton-based gesture recognition. First, a new data set was prepared, containing six previous gestures and nine new ones. Other conditions were similar to those from previous tests: 3 different users and around 3 thousands images for each gesture. Initial tests focused on the accuracy of the skeleton fitting. Although the solution had been already tested [55], we decided to do the visual inspection of the conformity of the results. Joint positions were calculated with respect to hand-centred coordinate system, with axes aligned with the palm rotation. All calculated joint positions were drawn on a single image (one for every gesture) with colour-coded dots. The results (Figure 32) are very consistent, and contain only a small number of outliers. Looking at the colour distribution (each joint is represented with a different colour) one can see, that at least some gestures are easy to distinguish from the others.
As there are a few different solutions to the hand pose (joint) estimation, we have decided to compare three recent ones: Mediapipe [55], 3DHand [56] and SRHandNet [63]. To check, whether the assumed number of training gestures is sufficient, we took the subset of nine new gestures (presented in Figure 27) and for each of them extracted 30 photos. For those we calculated joint positions, that were further combined into a single 42-dimensional feature vector. At first we calculated the Euclidean distance between all of the pairs of the input images, as the initial check of validity of our assumptions. The results are presented in the image form in Figure 33.
At this stage of the experiment, the SRHandNet achieved the worst results, as in more than half of the pictures it was unable to correctly fit the joint positions (mostly for the gestures 3, 4, 5 and 9, but sometimes also for the others, Figure 33a). The results for the MediaPipe are not very promising either. Although for every pair of the input images the correct distance was calculated, it is not enough to differentiate between the gestures from the same and from the different classes. Only the first three gestures seems to be more coherent (darker blocks visible in Figure 33b). The best results were achieved for the 3DHand (Figure 33c). There are clearly visible darker blocks on the main diagonal for almost all of the gestures. Though, gestures 1 and 2 are close to each other here.
A deeper analysis, of whether the calculated features enable the distinction between gestures, required the use of the t-SNE (T-distributed Stochastic Neighbor Embedding) method. t-SNE is an algorithm for dimensionality reduction suitable for visualization of high-dimensional data. It produced the 2D embedding of the higher-dimensional features for the MediaPipe and 3DHand. The results (presented in Figure 34b) show that for 3DHand most of the gestures form compact clusters in this embedding, and inter-class borders can be also seen there. In the MediaPipe results (Figure 34a) it is much harder to distinguish between the different classes.
To further examine the possibility of using this technique giving the users the possibility to train their system on just a few samples we calculated the confusion matrix for all 15 gestures using a 5-NN classifier (Figure 35). Some of the gestures are easy to distinguish even with many different classes (such as gestures with identifiers 5 or 14), others are very hard cases, mainly the ones with no straight fingers visible (2, 3, 10). However, it is possible to pick the subset of few (around 6) gestures, that can be used to control the system.

7.3.2. Usability Test

Another test was the usability test. The whole system was configured in a new (non-laboratory) environment and we conducted operational tests. Figure 36 shows the visual feedback window that was used during tests, Figure 37—the camera arrangement and Figure 2—the operator performing smart visualisation control.
The operator was asked to move the cursor (or cursors in the case of two handed operations) and trigger different events. We have tested the following one-handed operations: moving the cursor, clicking and dragging items, go back and move forward dynamic gestures. We have also tested two-handed gestures for zooming, panning and rotating objects on the screen. We have used web browser as the test software with different pages opened in multiple tabs.

7.4. Tests of the Presentation Interface

Two aspects of the presentation module performance have been verified. The first one pertained to the quality of the fusion of data received from both the vision and audio modules, and the other was focused on the usability and functionality of the interface as a whole.
The functionality and usability verification was conducted with a Web browser that the Cybersecurity platform is operating for data visualisation. We have verified whether the declared functionality has been achieved:
  • the events addressed to the operating system itself were interpreted as intended (screen lock/unlock),
  • the visualisation application received events generated by the multi-modal interface,
  • reaction of the application corresponded to the intention of the user,
  • failures of the multi-modal interface and mistakes of the user were reported to the user.
Figure 38 shows the tests pertaining to the response to the events caused by a touch screen: rotation and zoom. Verification of the keyboard events execution was conducted by execution of browser shortcuts and custom system shortcut to lock the screen. In addition, the interface allows to log in after the screen lock. For safety reasons, the operating system requires typing a passphrase to unlock the screen. Therefore, the multi-modal interface was configured to imitate typing the password on a voice command spoken by an authorised speaker.

8. Conclusions

A formal description of HCI systems in terms of embodied agent methodology has been proposed. It proved to be very helpful in the specification phase of a multi-modal control of cybersecurity data visualisation. The resulting clear system structure significantly facilitated implementation. Particular core processes and functions (e.g., performing gesture and speech modelling and recognition) can be easily attached and replaced by other variants thanks to a clear and abstract interface of an agent’s control subsystem. High-level control is abstractly specified by finite state machines. The specification of behaviours with the associated initial end termination conditions, enables the appropriate design of time-critical processes.
However, compared to robotic systems, for the design of HCIs the system environment had to be redefined. The physical environment in which the operator acts had to be extended to contain the monitor screen on which windows appear. In this case the interaction between cursors and buttons or sliders of the windows took place through the environment, resulting in stigmergy. This is a common case when dealing with multi-robot systems, however then only physical environment is involved.
Moreover, the partitioning of the designed system (the interface) into modules constructed of embodied agents facilitated the extraction of the window agent pattern and the concentration of all functions performed by the operator using standard input devices into one agent handling the Operator Interface Devices.
Regarding the application case, a smart control interface of cybersecurity data visualisation (the national NCP platform) was designed and implemented. Addition of the possibility of commanding the NCP visualisation component by using voice and gesture provided the operator with new working options. Now the operator does not have to be constantly seated by the computer, thus reducing the strain imposed on his/her spine. A registered chairperson can immediately react by voice commands to events detected in the cyberspace.

Author Contributions

Conceptualization, W.S., W.K., C.Z. and A.W.; formal analysis, C.Z.; investigation, W.S., W.K., C.Z., W.D., M.S. and A.W.; software, W.K., W.D., M.S. and M.F.; writing—original draft, W.S., W.K., C.Z., W.D., M.S. and M.F. All authors have read and agreed to the published version of the manuscript.

Funding

Work done as part of the CYBERSECIDENT/369195/I/NCBR/2017 project supported by the National Centre of Research and Development in the frame of CyberSecIdent Programme.

Acknowledgments

The authors want to thank Maciej Węgierek, Dawid Seredyński, Marta Pacuszka, Łukasz Bala, Radosław Białobrzeski, Bartłomiej Boczek and Artur Zygadło for supporting the system’s tests and evaluating related works.

Conflicts of Interest

The authors declare no conflict of interest. The funders had no role in the design of the study; in the collection, analyses, or interpretation o f data; in the writing of the manuscript, or in the decision to publish the results.

References

  1. Dijkstra, E. On the Role of Scientific Thought. In Selected Writings on Computing: A Personal Perspective; Springer: New York, NY, USA, 1982; pp. 60–66. [Google Scholar] [CrossRef]
  2. Bernstein, L.; Yuhas, C. Trustworthy Systems Through Quantitative Software Engineering; Quantitative Software Engineering Series; John Wiley & Sons: Hoboken, NJ, USA, 2005. [Google Scholar]
  3. Dudek, W.; Szynkiewicz, W. Cyber-security for Mobile Service Robots–Challenges for Cyber-physical System Safety. J. Telecommun. Inf. Technol. 2019, 2, 29–36. [Google Scholar] [CrossRef]
  4. Shiravi, H.; Shiravi, A.; Ghorbani, A. A Survey of Visualization Systems for Network Security. IEEE Trans. Vis. Comput. Graph. 2012, 18, 1313–1329. [Google Scholar] [CrossRef]
  5. Sethi, A.; Wills, G. Expert-interviews led analysis of EEVi—A model for effective visualization in cyber-security. In Proceedings of the 2017 IEEE Symposium on Visualization for Cyber Security (VizSec), Phoenix, AZ, USA, 2 October 2017; pp. 1–8. [Google Scholar] [CrossRef]
  6. Sharafaldin, I.; Lashkari, A.H.; Ghorbani, A.A. An evaluation framework for network security visualizations. Comput. Secur. 2019, 84, 70–92. [Google Scholar] [CrossRef]
  7. Best, D.M.; Endert, A.; Kidwell, D. 7 Key Challenges for Visualization in Cyber Network Defense. In Proceedings of the Eleventh Workshop on Visualization for Cyber Security; Association for Computing Machinery: New York, NY, USA, 2014; pp. 33–40. [Google Scholar] [CrossRef]
  8. Chen, S.; Guo, C.; Yuan, X.; Merkle, F.; Schäfer, H.; Ertl, T. OCEANS: Online collaborative explorative analysis on network security. In Proceedings of the Eleventh Workshop on Visualization for Cyber Security; Association for Computing Machinery: New York, NY, USA, 2014. [Google Scholar]
  9. McKenna, S.; Staheli, D.; Fulcher, C.; Meyer, M. BubbleNet: A Cyber Security Dashboard for Visualizing Patterns. Comput. Graph. Forum 2016, 35, 281–290. [Google Scholar] [CrossRef]
  10. Cao, N.; Lin, C.; Zhu, Q.; Lin, Y.; Teng, X.; Wen, X. Voila: Visual Anomaly Detection and Monitoring with Streaming Spatiotemporal Data. IEEE Trans. Vis. Comput. Graph. 2018, 24, 23–33. [Google Scholar] [CrossRef]
  11. Song, B.; Choi, J.; Choi, S.S.; Song, J. Visualization of security event logs across multiple networks and its application to a CSOC. Clust. Comput. 2017, 22, 1861–1872. [Google Scholar] [CrossRef]
  12. Heneghan, N.; Baker, G.; Thomas, K.; Falla, D.; Rushton, A. What is the effect of prolonged sitting and physical activity on thoracic spine mobility? An observational study of young adults in a UK university setting. BMJ Open 2018, 8, e019371. [Google Scholar] [CrossRef] [PubMed] [Green Version]
  13. Wahlström, J. Ergonomics, musculoskeletal disorders and computer work. Occup. Med. 2005, 55, 168–176. [Google Scholar] [CrossRef] [PubMed] [Green Version]
  14. Loh, P.Y.; Yeoh, W.L.; Muraki, S. Impacts of Typing on Different Keyboard Slopes on the Deformation Ratio of the Median Nerve. In Congress of the International Ergonomics Association (IEA 2018); Bagnara, S., Tartaglia, R., Albolino, S., Alexander, T., Fujita, Y., Eds.; Springer: Cham, Switzerland, 2019; pp. 250–254. [Google Scholar] [CrossRef]
  15. Tiric-Campara, M.; Krupic, F.; Biscevic, M.; Spahic, E.; Maglajlija, K.; Masic, Z.; Zunic, L.; Masic, I. Occupational overuse syndrome (technological diseases): Carpal tunnel syndrome, a mouse shoulder, cervical pain syndrome. Acta Inform. Med. 2014, 22, 333–340. [Google Scholar] [CrossRef] [PubMed] [Green Version]
  16. Dumas, B.; Lalanne, D.; Oviatt, S. Human Machine Interaction. In Human Machine Interaction; Springer: Cham, Switzerland, 2009; Volume 5440, pp. 3–26. [Google Scholar]
  17. Lee, B.; Isenberg, P.; Riche, N.; Carpendale, S. Beyond Mouse and Keyboard: Expanding Design Considerations for Information Visualization Interactions. IEEE Trans. Vis. Comput. Graph. 2012, 18, 2689–2698. [Google Scholar] [CrossRef] [PubMed] [Green Version]
  18. Nunnally, T.; Uluagac, A.S.; Beyah, R. InterSec: An interaction system for network security applications. In Proceedings of the 2015 IEEE International Conference on Communications (ICC), London, UK, 8–12 June 2015; pp. 7132–7138. [Google Scholar] [CrossRef]
  19. Agha, G. Actors: A Model of Concurrent Computation in Distributed Systems; MIT Press: Cambridge, MA, USA, 1986. [Google Scholar]
  20. Wooldridge, M.; Jennings, N.R. Intelligent agents: Theory and practice. Knowl. Eng. Rev. 1995, 10, 115–152. [Google Scholar] [CrossRef] [Green Version]
  21. Nwana, H.S.; Ndumu, D.T. A Brief Introduction to Software Agent Technology. In Agent Technology: Foundations, Applications, and Markets; Springer: Berlin/Heidelberg, Germany, 1998; pp. 29–47. [Google Scholar] [CrossRef]
  22. Padgham, L.; Winikoff, M. Developing Intelligent Agent Systems: A Practical Guide; John Wiley & Sons: Hoboken, NJ, USA, 2005. [Google Scholar]
  23. Dorri, A.; Kanhere, S.; Jurdak, R. Multi-Agent Systems: A survey. IEEE Access 2018, 6, 28573–28593. [Google Scholar] [CrossRef]
  24. Abar, S.; Theodoropoulos, G.K.; Lemarinier, P.; O’Hare, G.M. Agent Based Modelling and Simulation tools: A review of the state-of-art software. Comput. Sci. Rev. 2017, 24, 13–33. [Google Scholar] [CrossRef]
  25. Macal, C. Everything you need to know about agent-based modelling and simulation. J. Simul. 2016, 10, 144–156. [Google Scholar] [CrossRef]
  26. Brooks, R.A. Intelligence without reason. Artif. Intell. Crit. Concepts 1991, 3, 107–163. [Google Scholar]
  27. Brooks, R.A. Intelligence Without Representation. Artif. Intell. 1991, 47, 139–159. [Google Scholar] [CrossRef]
  28. Brooks, R.A. Elephants don’t play chess. Robot. Auton. Syst. 1990, 6, 3–15. [Google Scholar] [CrossRef] [Green Version]
  29. Brooks, R.A. New approaches to robotics. Science 1991, 253, 1227–1232. [Google Scholar] [CrossRef] [Green Version]
  30. Arkin, R.C. Behavior-Based Robotics; MIT Press: Cambridge, MA, USA, 1998. [Google Scholar]
  31. Russell, S.; Norvig, P. Artificial Intelligence: A Modern Approach; Prentice Hall: Upper Saddle River, NJ, USA, 1995. [Google Scholar]
  32. Lebeuf, C.; Storey, M.; Zagalsky, A. Software Bots. IEEE Softw. 2018, 35, 18–23. [Google Scholar] [CrossRef]
  33. Kornuta, T.; Zieliński, C. Robot control system design exemplified by multi-camera visual servoing. J. Intell. Robot. Syst. 2013, 77, 499–524. [Google Scholar] [CrossRef]
  34. Zieliński, C.; Stefańczyk, M.; Kornuta, T.; Figat, M.; Dudek, W.; Szynkiewicz, W.; Kasprzak, W.; Figat, J.; Szlenk, M.; Winiarski, T.; et al. Variable structure robot control systems: The RAPP approach. Robot. Auton. Syst. 2017, 94, 226–244. [Google Scholar] [CrossRef] [Green Version]
  35. Figat, M.; Zieliński, C. Methodology of Designing Multi-agent Robot Control Systems Utilising Hierarchical Petri Nets. In Proceedings of the 2019 International Conference on Robotics and Automation (ICRA), Montreal, QC, Canada, 20–24 May 2019; pp. 3363–3369. [Google Scholar] [CrossRef] [Green Version]
  36. Dudek, W.; Węgierek, M.; Karwowski, J.; Szynkiewicz, W.; Winiarski, T. Task harmonisation for a single-task robot controller. In Proceedings of the 2019 12th International Workshop on Robot Motion and Control (RoMoCo), Poznań, Poland, 8–10 July 2019; pp. 86–91. [Google Scholar] [CrossRef]
  37. Kravari, K.; Bassiliades, N. A Survey of Agent Platforms. J. Artif. Soc. Soc. Simul. 2015, 18, 11. [Google Scholar] [CrossRef]
  38. Dudek, W.; Szynkiewicz, W.; Winiarski, T. Cloud computing support for the multi-agent robot navigation system. J. Autom. Mob. Robot. Intell. Syst. 2017, 11, 67–74. [Google Scholar] [CrossRef]
  39. Zieliński, C.; Figat, M.; Hexel, R. Communication Within Multi-FSM Based Robotic Systems. J. Intell. Robot. Syst. 2019, 93, 787–805. [Google Scholar] [CrossRef] [Green Version]
  40. Bonabeau, E.; Dorigo, M.; Theraulaz, G. Swarm Intelligence: From Natural to Artificial Systems; Oxford University Press: Oxford, NY, USA, 1999. [Google Scholar]
  41. Walker, W.; Lamere, P.; Kwok, P.; Raj, B.; Singh, R.; Gouvea, E.; Wolf, P.; Woelfel, J. Sphinx-4: A Flexible Open Source Framework for Speech Recognition; SMLI TR2004-0811; SUN Microsystems Inc.: Santa Clara, CA, USA, 2004; Available online: http://cmusphinx.sourceforge.net/ (accessed on 9 October 2018).
  42. Kaldi. The KALDI Project. Available online: http://kaldi.sourceforge.net/index.html (accessed on 5 October 2018).
  43. Mak, M.W.; Chien, J.T. Machine Learning for Speaker Recognition. INTERSPEECH 2016 Tutorial. Available online: http://www.eie.polyu.edu.hk/~mwmak/papers/IS2016-tutorial.pdf (accessed on 8 September 2016).
  44. Alize. The ALIZE Project. Available online: http://alize.univ-avignon.fr (accessed on 11 October 2018).
  45. Reynolds, D.A.; Rose, R.C. Robust text-independent speaker identification using gaussian mixture speaker models. IEEE Trans. Speech Audio Process. 1995, 3, 72–83. [Google Scholar] [CrossRef] [Green Version]
  46. Reynolds, D.A.; Quatieri, T.; Dunn, R. Speaker verification using adapted gaussian mixture models. Digit. Signal Process. 2000, 10, 19–41. [Google Scholar] [CrossRef] [Green Version]
  47. Khoury, E.; El Shafey, L.; Marcel, S. Spear: An open source toolbox for speaker recognition based on Bob. In Proceedings of the 2014 IEEE International Conference on Acoustics, Speech and Signal Processing (ICASSP), Florence, Italy, 4–9 May 2014. [Google Scholar]
  48. Nayana, P.; Mathew, D.; Thomas, A. Comparison of text independent speaker identification systems using gmm and i-vector methods. Procedia Comput. Sci. 2017, 115, 47–54. [Google Scholar] [CrossRef]
  49. Hinton, G.; Deng, L.; Yu, D.; Dahl, G.E.; Mohamed, A.R.; Jaitly, N.; Senior, A.; Vanhoucke, V.; Nguyen, P.; Sainath, T.N.; et al. Deep neural networks for acoustic modeling in speech recognition: The shared views of four research groups. IEEE Signal Process. Mag. 2012, 29, 82–97. [Google Scholar] [CrossRef]
  50. Lukic, Y.; Vogt, C.; Dürr, O.; Stadelmann, T. Speaker identification and clustering using convolutional neural networks. In Proceedings of the 2016 IEEE 26th International Workshop on Machine Learning for Signal Processing (MLSP), Vietri sul Mare, Italy, 13–16 September 2016; pp. 1–6. [Google Scholar]
  51. Chung, J.; Nagrani, A.; Zisserman, A. Voxceleb2: Deep speaker recognition. arXiv 2018, arXiv:1806.05622. [Google Scholar]
  52. Hirschmuller, H. Stereo Processing by Semiglobal Matching and Mutual Information. IEEE Trans. Pattern Anal. Mach. Intell. 2008, 30, 328–341. [Google Scholar] [CrossRef]
  53. Viola, P.; Jones, M. Rapid object detection using boosted cascade of simple features. In Proceedings of the IEEE Conference on Computer Vision and Pattern Recognition, Kauai, HI, USA, 8–14 December 2001. [Google Scholar]
  54. Kazemi, V.; Sullivan, J. One millisecond face alignment with an ensemble of regression trees. In Proceedings of the IEEE Conference on Computer Vision and Pattern Recognition, Columbus, OH, USA, 24–27 June 2014; pp. 1867–1874. [Google Scholar]
  55. Lugaresi, C.; Tang, J.; Nash, H.; McClanahan, C.; Uboweja, E.; Hays, M.; Zhang, F.; Chang, C.L.; Yong, M.G.; Lee, J.; et al. MediaPipe: A Framework for Building Perception Pipelines. arXiv 2019, arXiv:1906.08172. [Google Scholar]
  56. Zimmermann, C.; Brox, T. Learning to Estimate 3D Hand Pose from Single RGB Images. In Proceedings of the 2017 IEEE International Conference on Computer Vision (ICCV), Venice, Italy, 22–29 October 2017; pp. 4913–4921. [Google Scholar]
  57. Gillian, N.E.; Knapp, R.B.; O’Modhrain, M.S. Recognition Of Multivariate Temporal Musical Gestures Using N-Dimensional Dynamic Time Warping. In Proceedings of the International Conference on New Interfaces for Musical Expression, Oslo, Norway, 30 May – 1 June 2011. [Google Scholar]
  58. Mangai, U.; Samanta, S.; Das, S.; Chowdhury, P. A survey of decision fusion and feature fusion strategies for pattern classification. IETE Tech. Rev. 2010, 27, 293–307. [Google Scholar] [CrossRef]
  59. CLARIN Studio Corpus. Available online: http://mowa.clarin-pl.eu/ (accessed on 20 March 2020).
  60. Zygadło, A. A System for Automatic Generation of Speech Corpora. Ph.D. Thesis, Warsaw University of Technology, Warszawa, Poland, 2019. [Google Scholar]
  61. Boczek, B. Ropoznawanie Mówcy z Wykorzystaniem Głębokich Sieci Neuronowych (Speaker Recognition Using Deep Neural Networks). Bachelor’s Thesis, Warsaw University of Technology, Warszawa, Poland, 2019. [Google Scholar]
  62. Białobrzeski, R. Rozpoznawanie Mówców na Urządzeniach Mobilnych (Speaker Recognition on Mobile Devices). Master’s Thesis, Warsaw University of Technology, Warszawa, Poland, 2018. [Google Scholar]
  63. Wang, Y.; Zhang, B.; Peng, C. SRHandNet: Real-Time 2D Hand Pose Estimation With Simultaneous Region Localization. IEEE Trans. Image Process. 2020, 29, 2977–2986. [Google Scholar] [CrossRef] [PubMed]
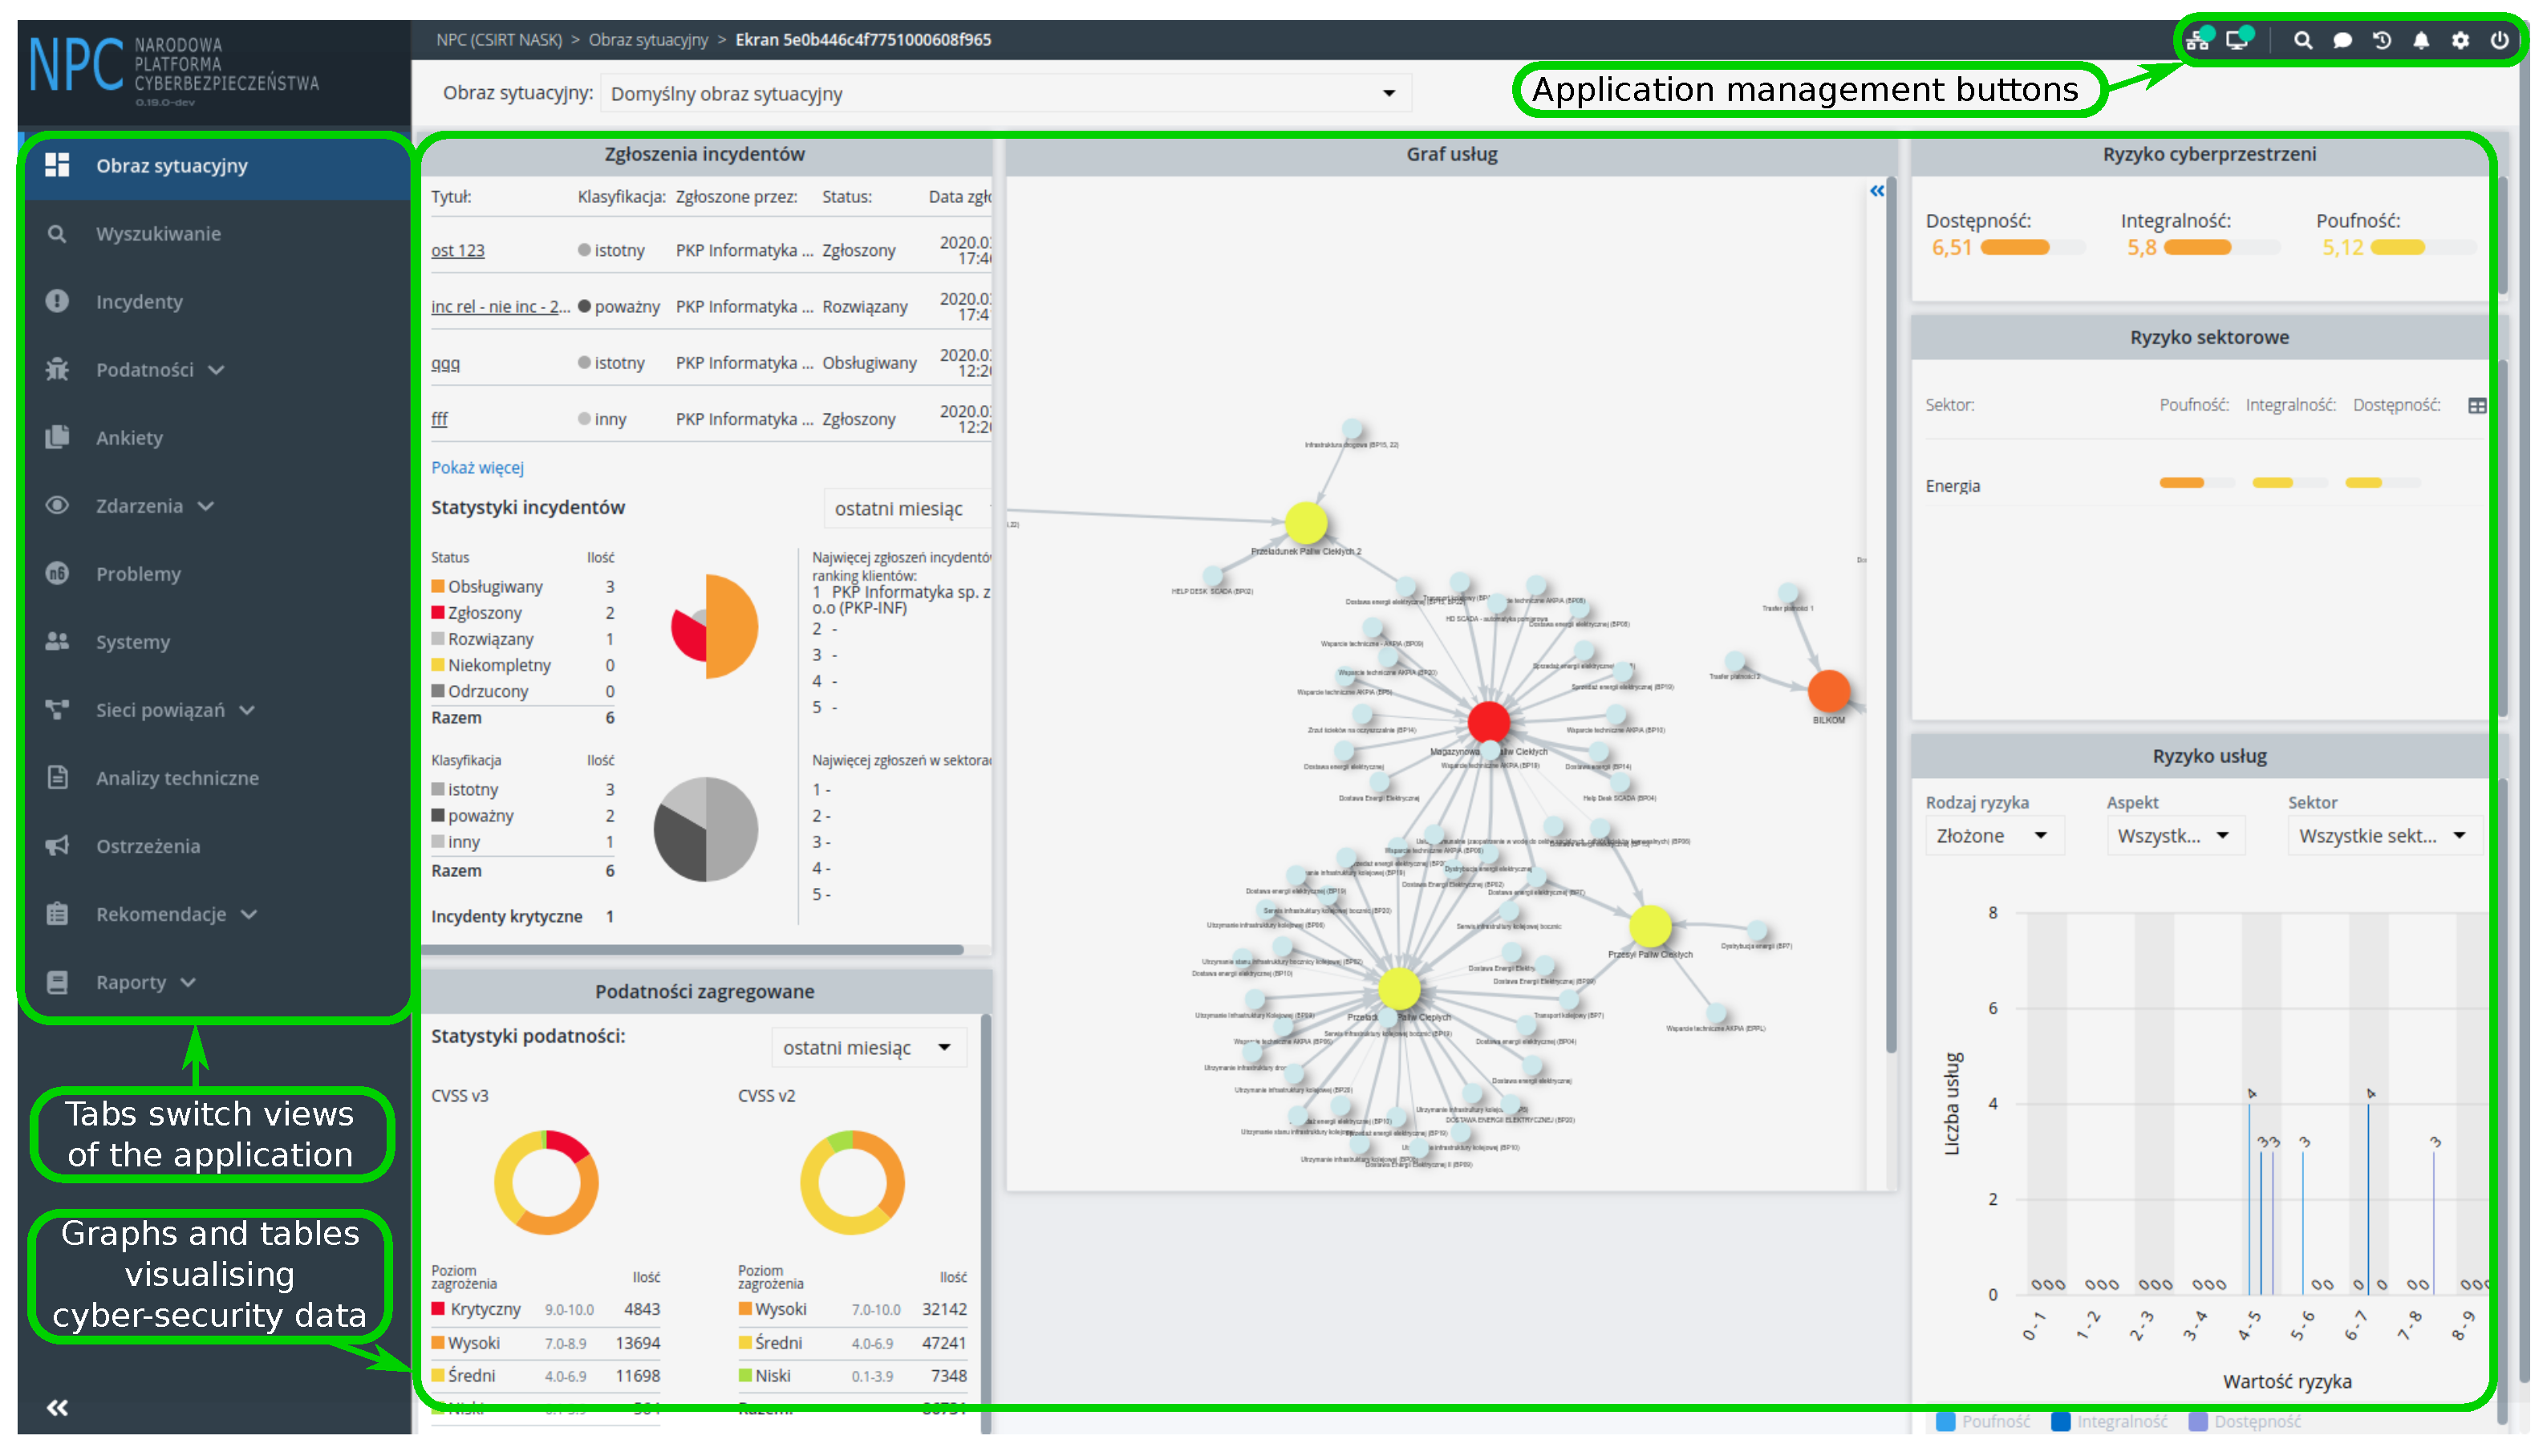
Figure 1. Example of a cybersecurity window. The menu tabs can be selected by either a computer mouse, or keyboard, while the graphs visualising data are scaled by touch screen events.
Electronics 09 00976 g001
Figure 2. A smart human–computer interface (HCI) for on-line data presentation.
Electronics 09 00976 g002
Figure 3. Interactions between interface modules and National Cybersecurity Platform (NCP).
Electronics 09 00976 g003
Figure 4. General structure of an embodied agent a j .
Electronics 09 00976 g004
Figure 5. General structure of a window agent a α ; where α is the name of the agent producing the window on the screen, β is the name of the agent with which a α communicates, ϕ is a set of information presentation boxes of a window agent a α (such as text fields) and φ is a set of action grabbers of a window agent a α (such as buttons). The following pairs exist: α = pGUI and β = prez , α = visionGUI and β = vision , α = aGUI _ ! and β = audio (where ω { init , user , cmd , ctrl } ).
Electronics 09 00976 g005
Figure 6. Finite state machine (FSM) of the control subsystem of a window agent a α .
Electronics 09 00976 g006
Figure 7. Structure of the agent a OID , where γ { mouse , keyboard , touch screen } , δ { mainPointer , secPointer , keyExecutor } .
Electronics 09 00976 g007
Figure 8. FSM of the control subsystem c OID .
Electronics 09 00976 g008
Figure 9. Structure of the vision module.
Electronics 09 00976 g009
Figure 10. Structure of the agent a vision .
Electronics 09 00976 g010
Figure 11. The FSM switching behaviours of the control subsystem c vision of the of agent a vision ; square brackets contain initial conditions.
Electronics 09 00976 g011
Figure 12. Structure of the agent a vDB .
Electronics 09 00976 g012
Figure 13. Structure of the audio module.
Electronics 09 00976 g013
Figure 14. Structure of the audio agent a audio , where ω { init , user , cmd , ctrl } .
Electronics 09 00976 g014
Figure 15. The FSM switching behaviours of the control subsystem c audio of the agent a audio ; square brackets enclose initial conditions.
Electronics 09 00976 g015
Figure 16. Structure of the presentation module.
Electronics 09 00976 g016
Figure 17. Structure of the agent a prez .
Electronics 09 00976 g017
Figure 18. FSM of the control subsystem c pres .
Electronics 09 00976 g018
Figure 19. The audio signal parametrisation process, common to the learning and control behaviours of the audio agent.
Electronics 09 00976 g019
Figure 20. Structure of the closed dictionary case of spoken command recognition.
Electronics 09 00976 g020
Figure 21. Command recognition structure utilising both the closed dictionary case (pure acoustic modelling) and open dictionary case (phonetic modelling).
Electronics 09 00976 g021
Figure 22. Illustration of time-relevant phonetic modelling of 20 commands.
Electronics 09 00976 g022
Figure 23. Illustration of phoneme labels being associated with signal frames of one training data by a human designer.
Electronics 09 00976 g023
Figure 24. The UBM-GMM approach to speaker modelling and recognition.
Electronics 09 00976 g024
Figure 25. Processing flow in the vision agent a v i s i o n .
Electronics 09 00976 g025
Figure 26. Hand poses (static gestures).
Electronics 09 00976 g026
Figure 27. Set of nine gestures used for the joint-based experiments. Coloured dots represent estimated joints positions, calculated with the 3DHand tool.
Electronics 09 00976 g027
Figure 28. Sample dynamic gesture: wave right.
Electronics 09 00976 g028
Figure 29. FAR–FRR (False Acceptance Rate–False Rejection Rate) diagram of off-line (Left Drawing) and on-line (Right Drawing) command recognition (20 commands) with stationary microphones.
Electronics 09 00976 g029
Figure 30. FAR–FRR diagram for results of off-line (Left Drawing) and on-line (Right Drawing) speaker recognition tests (11 speakers) with stationary microphones.
Electronics 09 00976 g030
Figure 31. Confusion matrix for the HOG-SVM gesture classifier.
Electronics 09 00976 g031
Figure 32. Aggregated joint positions for gestures: (a) palm, (b) two fingers (V), (c) thumb, (d) three fingers.
Electronics 09 00976 g032
Figure 33. Distance matrices (between all pairs of the training images, darker is lower, yellow means wrong joint detection); (a) SRHandNet, (b) MediaPipe, (c) 3DHand.
Electronics 09 00976 g033
Figure 34. 2D embedding of joints for the nine gestures with 30 samples for each, calculated using t-SNE. Joints calculated using the (a) MediaPipe and (b) 3DHand tools.
Electronics 09 00976 g034
Figure 35. A 5-NN classification of gestures based on the skeleton model.
Electronics 09 00976 g035
Figure 36. A visual feedback window for the HCI operator.
Electronics 09 00976 g036
Figure 37. The camera arrangement in front of the presentation board.
Electronics 09 00976 g037
Figure 38. Tests of multi-touch interaction with the verifying web application.
Electronics 09 00976 g038
Table 1. Mapping of exemplary keyboard shortcuts to the NCP visualisation component actions.
Keyboard ShortcutVisualisation Component
Page_Downscroll down the screen by its height
Page_Upscroll up the screen by its height
alt + xswitch to bookmark x { 1 , , 9 }
Super_L + llock screen
ctrl + alt + llock screen in the Xfce window manager