Abstract
This paper presents our experience on a real case of applying an indoor localization system for monitoring older adults in their own homes. Since the system is designed to be used by real users, there are many situations that cannot be controlled by system developers and can be a source of errors. This paper presents some of the problems that arise when real non-expert users use localization systems and discusses some strategies to deal with such situations. Two technologies were tested to provide indoor localization: Wi-Fi and Bluetooth Low Energy. The results shown in the paper suggest that the Bluetooth Low Energy based one is preferable in the proposed task.
1. Introduction
In the last years, many Indoor Positioning Systems (IPSs) have been presented, most of them relying on Wi-Fi fingerprinting-based technologies [1,2]. In most cases, the experiments have been performed in a very controlled scenario and by expert users, for instance, the developers of the IPS. In these scenarios, the proposed algorithms usually perform quite well [3,4]. Unfortunately, in real-world applications, the conditions are largely variable and there are many possible sources of errors that can drastically reduce the expected accuracy of the IPS [5]. One of the most challenging scenarios is when real users, instead of expert ones, test the developed IPS.
This paper presents our experience in the development of an IPS to be used for monitoring people at their own houses. In particular, this indoor localization method is part of a bigger project called Senior Monitoring, where the main aim is to monitor older adults to study behavioral patterns as a tool for early detection of some degenerative diseases such as Alzheimer’s disease [6,7,8,9]. The older adults wear a smartwatch to collect samples using the sensors included in the device. This monitoring system may be useful to monitor the behavior of older persons who live alone while at home and it may be used to evaluate the gait speed or motor changes for predicting mild cognitive impairment. Additionally, the system may be useful for healthcare professionals, formal and informal caregivers, and families, especially in an aging society in which the number of older persons and people living alone is increasing.
The first part of the experiments presented in this paper was conducted in real scenarios where the conditions were not controlled by the researchers. Seventeen volunteers, mostly older adults, tested the system in their own homes for two months on average. In this case, a Wi-Fi fingerprinting-based IPS was used. Since one of the objective of the project is to develop a system able to be deployed by the users, they created the radio map of their own homes and, therefore, there is no way of knowing if the training process was correctly performed. The performance of the system depends on the ability of the users to perform this task correctly. The present work contributes to a better understanding of the difficulties and problems that arise when implementing an indoor positioning system in real scenarios with real users.
After the experience obtained by using the Wi-Fi fingerprinting-based IPS, a Bluetooth Low Energy (BLE)-based IPS was tested too. A set of experiments was performed to test if the BLE-based method can deal with the difficulties arisen when using the Wi-Fi based one. In this case, four volunteers tested the system in their own homes for one month on average. The results obtained suggest that the BLE-based system is preferable in the scenarios tested.
In summary, the main contributions of this paper are as follows:
- We present a set of experiments where real users tested a Wi-Fi fingerprinting-based indoor positioning system deployed in their own homes, instead of in controlled scenarios.
- We present a comprehensible study of all possible sources of error arising during the experiments.
- We present a set of experiments where a BLE-based IPS was used to assess its performance in real scenarios and to study if this technology can deal with some of the problems arising when the Wi-Fi-based IPS was used
A preliminary version of this paper was presented, as a work-in-progress conference paper, in [10]. In that paper, we briefly presented the proposed Wi-Fi fingerprinting-based indoor positioning system. In this paper, a new section to present the RSSI-based indoor positioning problem statement is included and the explanation of the Wi-Fi-based IPS system is extended. We also present several additional experiments that help to better understand the problems that arose. Finally, we present a new BLE-based IPS, a set of preliminary experiments using this system instead of the Wi-Fi one, and a discussion about the results obtained when comparing both technologies.
The rest of the paper is organized as follows. A summary of some of the most relevant papers in this field is presented in Section 2. Section 3 presents the RSSI-based indoor positioning problem statement. Section 4 deals with the Senior Monitoring project. The tested Wi-Fi fingerprinting approach is presented in Section 5, together with a set of experiments and a discussion on the problems that arose when using this system. Similarly, the tested Bluetooth approach is presented in Section 6, as well as a set of experiments and a discussion comparing both technologies. Finally, the most important conclusions from this work are detailed in Section 7.
2. Related Work
In general terms, experiments for Wi-Fi-based IPS are performed in a very controlled scenarios. Khalajmehrabadi et al. [1] a reviewed some methods and tested some of the most relevant ones in a controlled scenario, a floor of 176 m × 12 m in a university building. The ground truth was accurate but required a lot of time to acquire. The scenarios usually proposed to test the IPS are quite different from users’ homes. Regarding BLE-based methods, in [11], experiments were conducted in an office scenario of 60 m × 40 m. The locations of BLE beacons were accurately measured by using a commercial laser rangefinder and using the floor plan of the building. Similarly, in [12,13], the authors tested the system in an office scenario of 50 m × 15 m and 52 m × 34 m, respectively. In [12], the Active Bat system [14] was used to provide ground truth position. Again, the scenario and set up proposed in those papers are quite far from real user’s homes.
The above scenarios are very different from the ones proposed in our work, since, in our case, it is not possible to know the exact position of the beacons in the scenario. The unique instruction given to users is to put the beacon in some place inside the correct room. In addition, developers do not have the floor plan of the users’ homes and do not have access to deploy the beacons for privacy reasons. This is one of the main features of our work, to test the IPS in a real scenario by real users. One critical aspect of fingerprint method is the training phase. Experts users perform this task very well, because they know all the “tricks” to do the task. However, the real user does not know which is the correct way to do it even if they receive some training. The problem is that they do not know these “tricks” since they have not participated in the development of the system and they so not have the background knowledge to understand how the system works. In our opinion, the experiments presented in this paper have a very relevant aspect in terms of novelty. Any research group that wants to test its IPS in real conditions can obtain a valuable benefit from our work, broadly speaking, to avoid falling into the same trap twice.
In our previous works [3,4], we tested a similar Wi-Fi fingerprinting-based approach in five different urban flats. The users were the developers of the system, i.e., they are expert users. Experimental results show that the system was robust and reliable enough for locating a user at room level in his/her home. In particular, the accuracy reported was in the best scenario and in the worst. The results obtained in that preliminary experiment encouraged us to continue working on this research line. In this study, we tested a sophisticated IPS but using real users instead of expert ones. We greatly improved the IPS from the one reported in [3,4] in terms of accuracy, battery life of the device, and usability of the application, among other features. However, the change from controlled scenarios to real ones produces some sources of errors that this paper analyzes and discusses.
Another relevant part of this paper is the use of wearable devices in a healthcare scenario. In our case, this work is related to a bigger project where the aim is to monitor the behaviors of older adults at home. The objective is to obtain in which room is the user while preserving his/her privacy and in a comfortable and easy way. Data should be acquired without disturbing users. The use of wearable and other devices in healthcare-related problems is a hot topic nowadays [15] as well as the use of technology to assists older adults [16,17,18,19,20]. For instance, Randazzo et al. [21] used a wearable smart device to monitor multiple vital parameters. One important difference of our system with respect the one presented in [21] is that the wearable used in our experiments is a common smartwatch instead of a probably uncomfortable device. This is very important, since users are required to wear the device whenever possible. Saponara et al. [22] presented a similar idea for remote monitoring of chronic diseases. However, the device used has the same problem. Shyamkumar et al. [23] performed cardiovascular monitoring by using a wireless textile-based wearable. This is a very interesting approach since the device was inserted into a T-shirt allowing continuous monitoring. The problem is that the user will need several of these devices to allow many days of monitoring.
The healthcare of older adults is a hot topic today. For instance, Schwenk et al. [24] developed a system for assessment of gait, balance, and physical activity for discrimination of frailty status. They used commercially available technology for gait assessment and balance assessment. Both systems used five small inertial sensors attached to the shanks, thighs, and lower back. Although the results provided for this work are very interesting, the use of the sensors can be quite uncomfortable to users. The use of a smartwatch can be more appropriate in many scenarios because users know this device since they have used a similar device during their lives.
In summary, the main difference of the proposed work compared to the previous ones is that we focus on testing the IPS in real scenarios. The developers do not know the size of the scenario, the floor plan, how many beacons will be detected, and so on. In addition, when using the Wi-Fi fingerprinting-based method, users themselves are responsible for acquiring the radio map to preserve their privacy. The use of a smartphone instead of a more uncomfortable device is also important if the users are older adults. It is preferable since older adults usually use watches in their lives and smartwatches are worn in a very similar way as traditional watches. Unlike other works, our system has been developed to allow continuous monitoring. This is crucial for future studies using the data generated by the proposed IPS. A problem that will be fixed in the future is the battery life of current smartwatches, since new devices are expected to reduce battery consumption and have batteries with a longer lifespan.
3. RSSI-Based Indoor Positioning Problem Statement
RSSI (Received Signal Strength Indicator) indoor positioning systems are based on measuring the intensities of the received radio signals of the emitting devices (beacons) that are available at a particular scenario. There are two dominant methodologies: Fingerprinting based, where the measured intensities are compared with a previously built RSSI dataset [25], and Proximity based, where the localization of the closest beacon is the one assigned.
3.1. Fingerprinting-Based
A fingerprint is an RSSI feature vector composed of received signal values from different emitting devices or beacons, associated to a precise position. In the last years, this technique has become increasingly important for indoor localization [1,26,27], since Wi-Fi is generally available in indoor environments where GPS signals cannot penetrate, and wireless access points (WAPs) can be used as emitting devices [28]. In addition, it has lower power consumption, lower cost, and does not require additional equipment. As an alternative to Wi-Fi-based method, Bluetooth-based beacons are gaining popularity in the last years [11,12,13].
The RSSI fingerprinting localization approach requires two phases of operation: a training phase, also known as offline or survey phase, and a positioning phase, sometimes referred to as online, operational or test phase. In the training phase, multi-dimensional vectors of RSSI values (the fingerprints) are collected and associated with known locations. These measurements are used to build the training dataset (also known as radio map) that covers the area of interest. Later, during the positioning (or test/online) phase, an RSSI vector collected by a device is compared with the stored data to generate an estimation of its position.
Figure 1 shows the schemes of the online phase of two IPS where the difference between them is the technology used for the beacons. The left image shows an IPS using Wi-Fi based beacons and the right one an IPS using BLE-based ones. One of the main differences between the two systems is that, in the case of the Wi-Fi-based one, just one of the beacons is inside the studied scenario (the one used to provide internet connection to the user), being the rest outside, for instance in the neighbors’ homes. However, in the case of the BLE-based system, all the beacons are located inside of the user’s home.
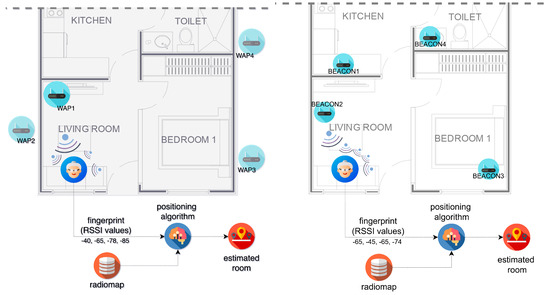
Figure 1.
Schemes of the online phase of: a Wi-Fi fingerprinting IPS (left); and a BLE-based IPS (right). (Icons made by Freepik from www.flaticon.com.)
Let us assume that there are q different beacons in the environment where the IPS is going to be deployed. The set of all beacons is .
A radio map is composed of a set of collected fingerprints and the associated positions where the measurements were taken. It is used to create models of the environment that can be used to estimate the position of a new fingerprint. Let be a radio map ( stands for training). Then,
where is the set of collected fingerprints and is the set of associated locations.
On the one hand, is composed of n fingerprints, stored as n vectors of RSSI measurements:
Each fingerprint consists of q RSSI values:
The set can be viewed as a dataset where the rows are the fingerprints and the columns are the different beacons perceived in the scenario.
On the other hand, is composed of n locations, stored as vectors, representing the position associated with its correspondent fingerprint:
where each associated position can be given as a vector of values representing its coordinates, although, on multi-floor and multi-building environments, labels can be used to represent buildings, floors, offices, etc. Let l be the number of dimensions of a position vector. Then,
Therefore, each () is the RSSI obtained from beacon at location , i.e., .
Once the radio map has been created, the positioning step can be performed, where the user device will capture a fingerprint that will be compared with the stored radio map to generate an estimation of its position . Assuming that the user captured m fingerprints, the test dataset can be defined as:
where
To be able to compare a test observation with the training fingerprints, the number of RSSI values of its respective fingerprints has to be the same, and the position in the RSSI vector must represent the same beacon in both datasets. Therefore, each one of the m observations of the test dataset should be composed of a fingerprint with q RSSI values,
and a location vector with the same spatial dimensions as the training location vectors,
In this case, is the RSSI obtained from beacon at location , i.e., .
In this paper, the dimension of the location vector is , since only the label of the room is used. In this case, the localization problem can be solved, for example, using a pattern recognition classifier, where the features and the labels of the training set are the training fingerprints and the locations (room identifiers) where they were captured, respectively. Therefore, the problem to solve in the positioning phase is to estimate the location (room) of the user given the test fingerprint captured at an unknown position.
3.2. Proximity-Based
A fingerprinting-based IPS, as explained above, does not need to know the position of the beacons in the environment. This is the usual case of Wi-Fi fingerprinting methods. However, in some scenarios, the position of the beacons can be known. When the position of the beacons is known or, at least, it is known in which room of the scenario each beacon has been deployed, a proximity-based algorithm can be used.
This algorithm is based on, given a test fingerprint , assigning the localization of the closest beacon , i.e., the one perceived with the highest RSSI value, which can be expressed as follows:
The main advantage of this method is that it is not necessary to capture the radio map.
4. An Overview of the Senior Monitoring Project
The experiments described in this paper were conducted as part of a greater research project, named Senior Monitoring. The main goal of this project is to provide assistance for monitoring the bevaior of elderly people and to detect short-term issues (falls) as well as long-term issues, such as cognitive and physical decline. As part of this research, an Indoor Positioning System was developed to assist monitored people in their homes. The proposed system consists of a smartwatch, which is worn by the user who is being monitored, and a smartphone, which is paired to the smartwatch and is used to configure and control its behavior, as well as to communicate with a central cloud server (see Figure 2). The data gathered by the smartwatch are sent to the server through the paired smartphone, where they are stored and analyzed to provide assistance and decision support services by performing analysis tasks such as indoor positioning, activity recognition, or anomaly detection.
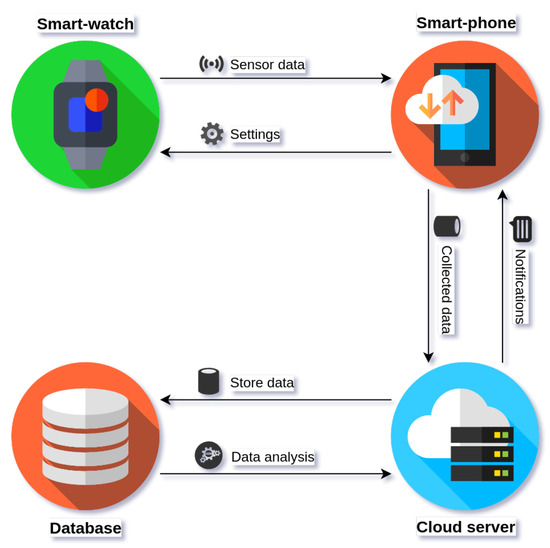
Figure 2.
Senior monitoring IPS overview. The smartwatch sends sensor data to the smartphone. An application installed on the smartphone is the interface through witch the user or the caregiver configures the smartwatch. The smartphone sends the data to a cloud server. The server performs data analysis and can communicate with the user through notifications. (Icons made by Freepik from www.flaticon.com.)
4.1. Hardware
The proposed IPS requires the use of two devices: a smartwatch attached to the user’s wrist and a smartphone that communicates with the former and sends data to a remote server. The detailed characteristics of the specific hardware used for the experiments are described bellow:
- Smartwatch: All participants wore a Sony Smart Watch 3 model running Android Wear as its operating system. This device incorporates a 1.8 screen with a resolution of 320 × 320 pixels. It supports remote connectivity through Wi-Fi, NFC, and Bluetooth. As for other sensors, it includes GPS, accelerometer, compass, gyroscope, and ambient light sensors. The application developed to support the experiments can be set up to continuously scan for any nearby beacon (WAP and/or BLE) signals, as well as to record readings from some other sensors. As the data are being gathered, they are sent to the paired smartphone through a Bluetooth connection. In the case the devices are not in range, the smartwatch buffers the data to be sent when a network connection becomes available. While in normal operation, the application works as a service and does not interfere with the conventional use of the smartwatch. Some operational settings can be modified through the application installed in the paired smartphone.
- Smartphone: The data collected by the smartwatch sensors are sent to a smartphone that works as a proxy between the watch and a remote server. The application developed for this project has been designed to work on many devices, and has been tested on several different models, with the goal that users might be able to use their own smartphones. Besides sending data to a central server, the smartphone is used to configure some sensor options on the smartwatch, such as scan intervals, number of consecutive scans, sensor activation, etc., as well as to show some statistics to the user. Furthermore, the system can provide some feedback, or even require some actions from users, through a notification system that is built into the application.
All participants in the study were provided with a smartwatch device to use in the experiments. Participants were given assistance and instructions on how to pair the device with their own smartphones; how to install the application; and how to configure, use, and interact with the monitoring system.
4.2. Software
The application deployed on both the smartwatch and the smartphone has been developed to work on Android devices. The smartphone software sends the sensory data received from the smartwatch to a cloud server using the MQTT protocol. This data are stored for posterior analysis using Elasticsearch as a NoSQL database. Data from other sources, such as login data, communication through notifications, or settings modifications, are sent to a REST cloud server and stored in the same database.
Figure 3 shows a screenshot of the smartphone application showing some information relevant only to research purposes, such as the number of access point detected or a confidence metric for the activity the user is performing, along with general information that is useful for end users, such as a measure of the overall activity of the user in the last hour, or the daily number of steps. The smartphone’s application is the interface through which the elderly user can perform tasks such as checking the smartwatch status, viewing his/her level of physical activity, observing the readings and status of active sensors or responding to notifications delivered by his/her caregivers, health professionals, or automatic health-care services provided by the analysis system.
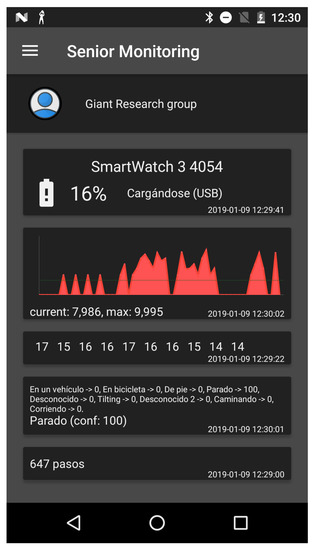
Figure 3.
The application main screen shows detailed information about the smartwatch status, the levels of physical activity of the user in the previous hour, and other useful information from other active sensors such as Wi-Fi access points detected or a daily step counter.
4.3. Sensors
The software has been designed to mainly make use of the Wi-Fi, Bluetooth Low Energy, and significant motion sensors.
4.3.1. Wi-Fi
This sensor constitutes the base of the Wi-Fi-based positioning system. The smartwatch performs a given number of consecutive Wi-Fi scans every minute. The default number of scans is 5, but this setting can be modified through the smartphone app.
When a Wi-Fi scan is performed, the Wi-Fi module updates some data in the cache while keeping some intact. Some WAPs may be present in the scan results even though they have not been detected in the most recent scan. The details of the cache updating algorithm are unknown, but outdated data may persist during some scans. Moreover, in highly crowded WAP environments, channel interference is very likely. This means that some WAP signals, especially those whose RSSI is low, may appear and disappear stochastically. Because of the aforementioned conditions, signals collected from incorrect locations at incorrect times are likely to be acquired, introducing errors in data analysis. To minimize the impact of this behavior and lessen stochasticity, the application completes a default number of five consecutive scans, each one taking approximately 1 s to complete.
4.3.2. Bluetooth Low Energy
BLE protocol has been designed as an energy efficient alternative to classical Bluetooth technology, to allow wireless communications between devices while keeping power consumption low. The smartwatch application continuously scans for advertising devices and stores the received strength signal indication value for each device. The frequency on which advertising signals are received depends on the particular setting for each beacon, since the advertising interval can be manually adjusted.
BLE technology uses 40 channels, from 2.4 to 2.4835 GHz. The majority of these channels, Channels 0–36, are used for connection data, while the last three channels (37–39) are used as advertising channels to set up connections and send broadcast data. To minimize the effect of any radio interference, BLE uses a frequency-hopping scheme in which the radio hops between channels on each connection event, where the value of the hop is different for every new established connection. Advertising data are constantly being transmitted from a peripheral device in order to be seen by other devices. The advertising device sends a packet on at least one of the three advertising channels, with a repetition period called the advertising interval. To reduce the chance of multiple consecutive collisions, a random delay of up to 10 ms is added to each advertising interval. The scanner device listens to the channel for a duration called the scan window, which is periodically repeated every scan interval.
With respect to the BLE scanning process, one of its shortcomings is that its design is focused on very short range communication. It is possible for a BLE device to reliably transmit data 30 m or more on a line-of-sight, but typical operating range is probably closer to 5 m. However, if beacons are properly deployed, this aspect can be an advantage from an IPS point of view, since it may facilitate the discrimination between near and distant emitters.
4.3.3. Significant Motion
An indicator of the user’s physical activity can be determined with the use of sensors such as accelerometer and gyroscope. Both sensors are capable of measuring human motion and estimating body position, allowing to determine the physical activity the user is performing, such as walk, run, sit, etc., either using classical machine learning techniques [29] or deep learning architectures [30]. The main drawback of the use of these sensors in a smartwatch is its energy cost. Their continuous monitoring keeps the system from going into low power/sleep mode and drastically reduces the battery duration to less than a whole day, which is a minimum requirement for monitoring applications. An alternative is the use of the Significant Motion Sensor (SMS). It has been previously used to improve the localization accuracy [31].
SMS is a virtual sensor that detects user movement using the physical accelerometer, but only triggers when it detects a meaningful motion, that is, a movement that might lead to a change in the user’s location. Thus, although the limited scope of this sensor does not allow determining the activity the user is performing, it provides a way to detect a possible change in his/her location. Inversely, if it has not been triggered during an interval of time, it may be assumed that the user has not changed his/her location during that period.
4.4. User Feedback
To introduce a mechanism to obtain a higher degree of certainty about the quality of the training and, therefore, to know if the Wi-Fi fingerprinting-based indoor localization algorithm is performing well, a notification system has been developed to collect validation samples. When the system detects stationary moments by using the SMS, the users are asked about where they were during that particular interval of time. The answer is then used to label the samples captured during this period. These labeled samples can be used to validate the accuracy of the system and therefore can be used to improve the positioning system. However, since people using the application are real users, many non-desirable situations can happen. The user may not be sure of his/her localization during that interval of time, but still answer the question, introducing a possible source of error. These situations can produce poorly labeled samples that can reduce the accuracy of the classifier.
5. Wifi-Based Positioning
5.1. Method
For training, participants must use the Senior Monitoring application to create the radio map of their home. Participants must select the room and the type of training session in the smartphone app to be performed. Then, the smartphone application communicates with the smartwatch app and it starts to capture fingerprinting samples. One hundred consecutive samples are taken at each training session.
There are six possible rooms: bedroom, bathroom, living room, dining room, office, and kitchen. In addition, there are three different ways to perform the training session, i.e., to create the radio map . In the first one, the user must stand in the middle of the room while the device captures RSSI data from nearby beacons. In the second one, the user must randomly move around the room. In the last one, the user must be in the most common place into the room. For instance, for the bedroom, they must stay close to the bed while capturing the data.
This process can take around 1 min. Each room can be trained as many times as the users want. In addition, he/she can use one, two, or three types of training sessions, or perform several training sessions of the same type in a particular room. All possible combinations are allowed. For instance, if the user performed three training sessions in the bedroom, two in the living room and in the kitchen, and one in each of the other rooms, the radio map database for this user would contain training sessions and, if 100 samples were captured at each training session, a total of fingerprinting samples would be captured.
The smartphone application sends the information to the server, which stores all the samples of each training session, together with information about the user who performed it, date, type of training session selected, and the room type.
With this information, the system trains a pattern recognition classifier for each user. This classifier will predict the room given a set of several consecutive fingerprints as input. Therefore, the fingerprints included in are the features of the classification problems, and the locations included in are the labels of the problem. The well-known Random Forest model (using a voting scheme) is used. This classifier has been demonstrated as reliable in this kind of problems [3,4,31]. Each time the server receives a new training session from any user, the system trains again the classifier of the corresponding user, using all the available labeled samples.
Once the classifier has been trained, the application starts to record a sample each minute. Five consecutive fingerprints are captured for each sample, i.e., . They are sent to the server where the previously trained classifier is used to estimate the current localization (room) of the user, i.e., . In this case, the Random Forest classifier uses a voting scheme to estimate a unique label given the five consecutive samples. The number of consecutive samples and the capturing frequency can be adjusted through the smart phone application.
A validation phase has been introduced to obtain ground truth information that can be used to get an estimation of the accuracy of the localization system. For this purpose, the application uses the significant motion sensor to look for time periods where the user did not move from the same room. A 20-min threshold is used. When a period with no significant movement is found, the application sends a notification to the user showing the interval of time and a list of the most probable rooms where the user stayed. The user should select the room that he/she remembers to have been staying during this time period.
The same Random Forest classification model is used to obtain the probabilities of being in each room. The train set contains all the samples belonging to the radio map. The validation set contains the samples sent to the server during the non-activity time periods. For instance, if the static time period is 40 min, samples are used to estimate the probabilities of each room. When a room is selected by the user, all the validation samples are stored in the server. They can be used in the future to validate the quality of the localization system and even to improve it.
To not disturb to the users too much, a maximum number of three notifications per day has been established. In addition, notifications are never received at night. These setting can be changed using the mobile phone application.
5.2. Experiments and Results
To test our proposed system, 17 volunteers used the Senior Monitoring application for several weeks. Table 1 shows the ID of each user, his/her age, the number q of WAPs that can be perceived in their homes, the number of rooms trained, the total number training sessions performed (Tr.), and the number of answered notifications (Not.). The last two rows show the median and the standard deviation. Note that most users are more than 60 years old.

Table 1.
For each user, each row shows the ID, his/her age, the number of WAPs that can be perceived in their homes, the number of rooms trained, the total number training session performed, and the number of answered notifications. # stands for number of. The last two columns show both ways of estimating the accuracy of the IPS (see accuracy definitions at Section 5.2).
According to the data shown in Table 1, the number of days that users tested the application is quite variable across users, ranging from 3 to 22 weeks, being 2 months the average time. It is important to note the quite variable number of perceived WAPs of each user. There are some scenarios with a very low number of WAPs, such as Users 12 and 14 with just one and three perceived WAPs, respectively. This very low number makes it very difficult to obtain accurate results when estimating the user’s localization. Regarding the number of rooms trained, users trained from four to all the available rooms. Therefore, the pattern recognition classification problems become a four-, five-, or six-class problem, depending on the user.
An important issue is the number of training sessions performed. Again, there are strong differences across users. There are users who have trained several times each room (e.g., Users 1-3), but there are others who trained each room only once (e.g., Users 5–7). The seventh column represents the number of notifications answered by the users. The number of notifications answered by the users is also quite variable. In many cases, there are a lot of notifications produced by the system that the user decided not to answer. There are several reasons including forgetting to do it or not remembering the place where the user stood at the reported time. All this demonstrates that there are many different scenarios and that the indoor localization system must cope with all of them.
To obtain a measure of the accuracy of the IPS for each user, two ways of estimating the accuracy were mplemented. The first one, called Notification accuracy, is the percentage of times that the user selected the room that the localization algorithm selected as the most probable. Assuming that the user always provides the correct answer, this measure should be a good indication of the accuracy of the indoor localization system. However, since there is no way of knowing if the users did the task correctly, a second way of estimating the accuracy has been also tested, Test accuracy. In this case, all samples belonging to the time periods of the answered notifications are labeled using the room label provided by the user as ground truth and then, the classifier estimates the label and compares it with the one provided by the user to estimate the accuracy. Note that, in both cases, we are assuming that the user provides reliable information.
The last two columns of Table 1 show both accuracy measures. It shows that the localization system is working very well for some users, such as Users 1, 3, and 16, but very poorly for others, such as Users 4, 14, and 17. There are some surprising results, for instance Users 2 and 7 obtaining quite better results in the test accuracy than in the notification one and Users 8 and 9 where the opposite happens.
5.3. Discussion
Table 1 shows that the proposed IPS works very well in some scenarios while very poorly in others. There are several possible reason for this variability of performance. This section discusses some of them.
5.3.1. Number of WAPs vs. Accuracy
There are many different scenarios according to the number of WAPs that can be perceived. Figure 4 shows that there is a relationship between the number of WAPs and the two accuracy measures estimated. The blue points and the blue line are related to the notification accuracy and the red crosses and red line are related to the test accuracy. Pearson’s correlation coefficients [32] are 0.48 and 0.71, respectively. Figure 4 and Table 1 clearly show that Users 7 and 15 do not follow the regression line, i.e., they are scenarios with a big number the WAPS but obtaining low accuracy. The Pearson’s correlation coefficients were recalculated without the data for these two users, obtaining 0.86 and 0.88, which shows that most cases follow the rule that, when more WAPs are perceived in the scenario, better accuracy can be obtained. According to this fact, the poor results for Users 12 and 14 is not surprising, with just one and three perceived WAPs, respectively.
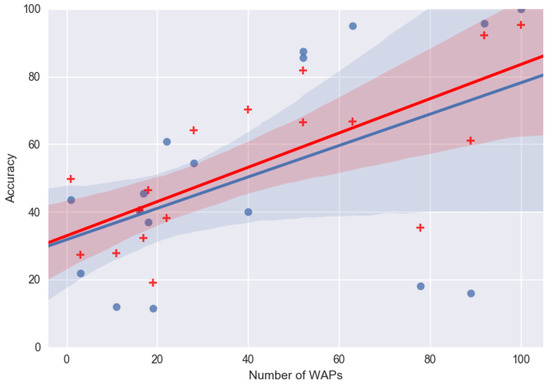
Figure 4.
Relationship between the number of WAPs perceived in a scenario and the accuracy measures estimated (see accuracy definitions in Section 5.2). Blue points and the blue line are related to the notification accuracy and the red crosses and red line are related to the test accuracy.
5.3.2. Number of Training Sessions vs. Accuracy
Figure 5 shows the relationship between the number of training sessions and the two accuracy measures estimated. Pearson’s correlation coefficients are 0.21 and 0.27, respectively, showing a very weak relationship. There are two users (Users 4 and 11) that, despite the fact that they performed several training sessions, their estimated accuracy is quite low. Pearson’s correlation coefficients without these two users are 0.65 and 0.68, respectively. Therefore, it seems that better accuracy values could be obtained in most cases if users had performed more training sessions. In particular, this could be crucial for the users having performed just one training session of each room, i.e., for Users 5–7, 10, 15, and 17.
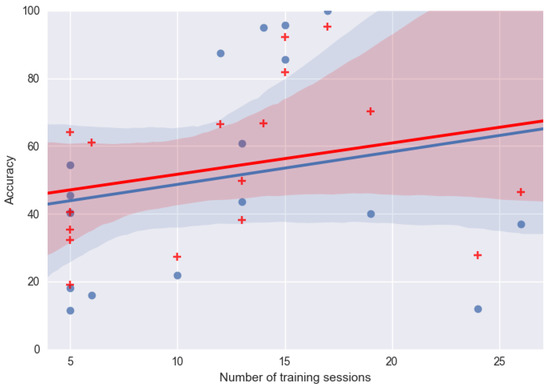
Figure 5.
Relationship between the number of training sessions performed and the accuracy measures estimated (see accuracy definitions in Section 5.2). Blue points and the blue line are related to the notification accuracy and the red crosses and red line are related to the test accuracy.
5.3.3. Data Visualization
Another way of studying the data produced in the studied scenarios is to apply the well known t-Distributed Stochastic Neighbor Embedding (T-SNE) dimension reduction technique [33] to represent each training dataset using just two dimensions. This way, if samples belonging to the different rooms are well separated, it is expected to obtain good classification results when applying the IPS. Figure 6 shows the results of applying T-SNE to the training data of Users 1 (very good result), 2 (acceptable result), and 4 (poor result). On the one hand, Figure 6a shows that the samples belonging to the different classes (rooms) of the classification problem are well separated. Therefore, the good accuracy results obtained is not surprising. On the other hand, Figure 6c presents an example of a scenario where it is almost impossible to obtain good results since the samples belonging to the different classes are all mixed in the feature space. User 2 (see Figure 6b) is a mean term between the two previous cases. There are many possible reasons for obtaining such poor separation among classes in the scenario of User 4. Perhaps, the user did not perform the training sessions correctly or, in that scenario, it is not feasible to use the proposed IPS.
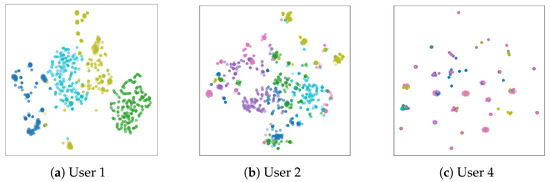
Figure 6.
Training data of three after applying the T-SNE technique. Each color represents the samples belong to each room.
5.3.4. Silhouette vs. Accuracy
Figure 7 shows the relationship between the silhouette measure [34] and the two accuracy measures estimated. The silhouette is a well-known measure frequently used in clustering analysis to study the quality of the results of the clustering process. It provides, for each sample, a value from −1 to 1, where values close to 1 mean that the sample has been correctly classified. In our case, the average of the silhouette measure for all samples was estimated. The hypothesis is that, the better is the silhouette measure, and therefore better separated are the classes, the better is accuracy obtained. Pearson’s correlation coefficients are 0.31 and 0.56. Similar to the previous cases, there are two users (Users 7 and 15) who seem to be outliers, since, despite having a good silhouette value, the accuracy is not good. Pearson’s correlation coefficients, without these two users, are 0.69 and 0.70. Note that Users 7 and 15 are the same outliers detected when studying the relationship between the number of WAPs and the accuracy.
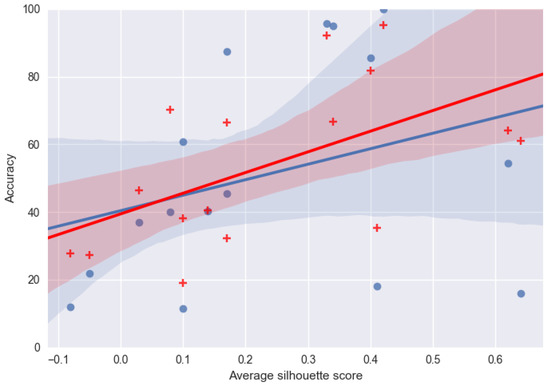
Figure 7.
Relationship between the silhouette estimated after applying the T-SNE technique to the training set and the accuracy measures estimated (see accuracy definitions in Section 5.2). Blue points and the blue line are related to the notification accuracy and the red crosses and red line are related to the test accuracy.
5.3.5. Possible Source of Errors
Some conclusions that can be derived from the previous discussion is that a good scenario should have many WAPS, a large number of training sessions, and the training samples should be well separated. In these conditions, it is expected to obtain good accuracy results. However, even in those cases, there are exceptions, i.e., scenarios where the conditions seem to be quite good but the accuracy obtained does not confirm this fact. Some possible sources of problems may be the following:
- The Significant Motion Sensor used to determine static time periods sometimes needs some significant time to detect user motion. Therefore, it is possible that the user moves for some small period to other rooms and comes back to the original position (for instance, to go to the bathroom). The system does not detect this movement and throws a notification to the user. When the user labels the samples belonging to this time period, the samples belonging to the room where the user stood just for a while are incorrectly labeled.
- Sometimes the user does not remember well the place where he/she stayed. However, instead of using the “I do not remember” option, he/she selects the one he/she thinks is the correct one since he/she wants to collaborate with the study and thinks that this is the correct way of behaving. This introduces incorrectly labeled samples.
- Users are highly motivated volunteers but do not always behave as they should. Sometimes they do not correctly perform the training sessions since they do not understand that there are many ways of introducing significant errors in the training set.
- There are some special cases that are very difficult to deal with. For instance, in many cases, the bathroom is inside the bedroom or, in other ones, the living room and the dining room are the same room. These special cases introduce samples very similar in the feature space but with different labels. This fact impacts negatively on the performance of the classifier.
- The smartwatch must be charged each day. This is usually done at night. Most users charge the device in their bedroom. However, some of them selected different places to do it. There are also some users who change the place across days. This can introduce some additional problems, since sometimes the user remembered where he/she stayed, but did not remember where the smartwatch was.
- The fingerprints captured have data from all the visible WAPs that can be perceived in each scenario, including WAPs of the neighbors of the user. Even if the user takes care to not move his/her WAP, it is impossible to control if some neighbor moves or even replaces his/her WAP. Therefore, the integrity of the fingerprint captured can be seriously affected.
6. Bluetooth Low Energy-Based Positioning
6.1. Method
A new localization method was tested relying on BLE beacons instead of Wi-Fi ones. The use of BLE beacons can be a valid alternative in many scenarios [11,12,13]. Three different strategies were tried: (1) a proximity positioning method; (2) a method based on fingerprinting techniques where the training has been done manually, as in the case of the Wi-Fi IPS presented in Section 5; and (3) replacing the manual training with an automatic process. Nowadays, research on how to automatically create the radio map is a hot trend in the indoor positioning research field [35].
To perform the automatic training, for each beacon, a subset of samples in which the beacon has been measured with a very powerfully intensity is selected to be the radio map . That is, when the localization where the sample has been captured is very close to a beacon, we have a very high degree of certainty that the user is in the room where the beacon has been located. With the set of selected samples, the classifier is trained.
The user is provided with a set of five beacons to be self-installed at home. Four users took part in this experiment, with a total of 20 beacons, being 10 of them model iBKS plus and the remaining 10 iBKS 105, from Accent Systems. Each device is clearly labeled using the name of the room. The beacons should be located in the most representative place of the room. The rooms used in the experiment are the same as the Wi-Fi experiments (see Section 5), i.e., living room, bedroom, kitchen, bathroom, and office. The user also receives a smartwatch with the application for capturing RSSI data from the beacons. The application has been configured to match each beacon with the corresponding room.
The two fingerprint methods tested work as in the case of the Wi-Fi system (see Figure 2). The only difference is that, in the BLE case, the notification system has not been used.
6.2. Experiments and Results
The objective of this set of experiments was to assess the performance of the BLE-based IPS in order to test if it can be used in the real scenarios proposed in this paper. In addition, we wanted to study if the BLE-based method can deal with some of the problems that arose when the Wi-FI based method was used (see Section 5). To test the BLE-based proposed system, four volunteers tested the proposed methodologies. Three of the four users who took part in this experiment also participated in the experiments explained in Section 5, obtaining for two of them, a very low level of accuracy (less than ).
To obtain ground truth, volunteers annotated the room where they were, but only when they were sure about it. Table 2 shows the number of hours that the user labeled to be in each room during the experiments.
Table 2.
Number of hours that each user stay in each room.
Figure 8 shows the results obtained for each user using the proximity based algorithm. Results for User 1 are excellent. The other users have some rooms where the system provides very accurate results, but there are some rooms with low accuracy. There are some cases, such as the one illustrated in Figure 9, where the user is physically closer to a beacon located in a different room from the one he/she is in. Therefore, the system might make a wrong estimation about the location of the user.
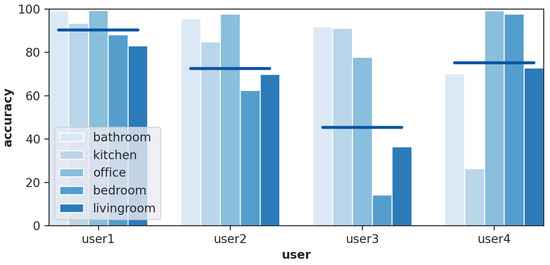
Figure 8.
Results of the proximity method. Accuracy is the percentage of times the system is able to correctly estimate the room with respect the ground truth.
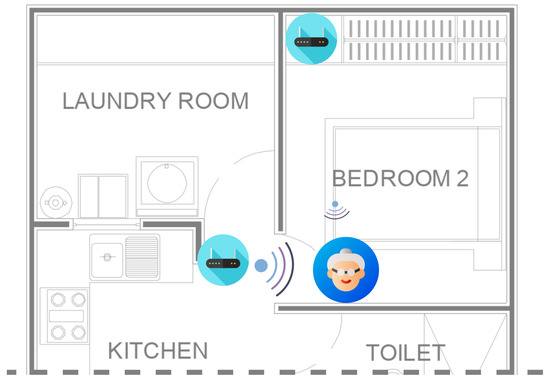
Figure 9.
A possible scenario where the proximity method can fail.
To deal with such situations, a fingerprinting method can be used. Figure 10 shows the results obtained for each user using the fingerprinting method. A one-nearest neighbor classifier was trained using the of the data stratified by class to take into account the unbalanced number of samples for each room. The results obtained are excellent in terms of accuracy. For all users and rooms, the accuracy is almost . However, this method has the problem that it requires a manually labeled training set. As discussed sbove, this can cause problems when the training has to be done by real users.
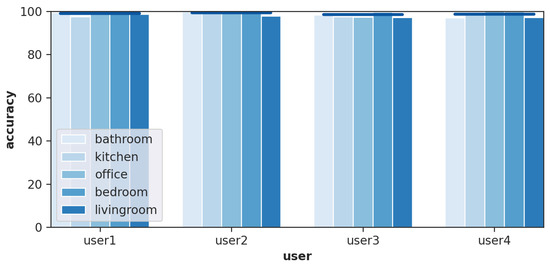
Figure 10.
Results of the fingerprint method when using manual training. Accuracy is the percentage of times the system is able to correctly estimate the room with respect the ground truth.
Figure 11 shows the results obtained for each user using the auto-training algorithm. The 100 closest samples to each beacon were used to train a one-nearest neighbor classifier. It can be shown how the accuracy has been strongly improved for the rooms where the proximity based algorithm provided low results. Although the accuracy level is not so high compared to using manual training, the results are quite good for all users and almost all rooms. The rooms with lowest accuracy are the ones with fewer samples. It is very important to note that the auto-training method is able to obtain high accurate results without having to perform any manual training by the users. The system itself is able to train a reliable model, avoiding an important source of error. Note that some of the users having problems in the experiments reported in Section 5 when a Wi-Fi-based IPS was used now have excellent results in terms of accuracy.
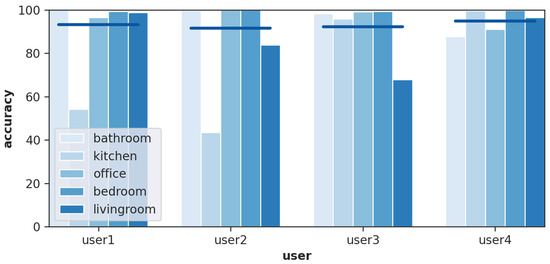
Figure 11.
Results of the fingerprint method when using automatic training. Accuracy is the percentage of times the system is able to correctly estimate the room with respect the ground truth.
6.3. Discussion
The results shown in this section provide a clear conclusion about the preferability of the BLE-based localization system against the WiFi-based one. The BLE-based system is able to obtain accurate results with a minimal intervention of the user. Users only have to put the beacon in the correct room without the needing to perform a training process. The system itself is able to perform the training process with good results in terms of accuracy. Most of the possible sources of error commented in Section 5.3.5 are therefore removed.
7. Conclusions
This paper presents our experience on a real case of applying an indoor localization system for monitoring older adults in their own homes. Since the system is used by real users, there are many situations that cannot be controlled by system developers and which can be a source of errors. Two technologies were tested to provide indoor localization: Wi-Fi and BLE. From the results obtained with the Wi-Fi based system, it seems that a good scenario should have many WAPs, a large number of training sessions, and the training samples should be well separated. Under these conditions, good accuracy results can be obtained. However, even in those cases, there are exceptions. This paper discusses the possible causes of such low accuracy results.
Three different strategies were tested using a BLE-based method. The proximity-based strategy is the one requiring less user intervention but it can fail in some situations. A classical fingerprinting approach was also tested. It clearly outperforms the proximity-based method but it has the same problems discovered when experimenting with the Wi-Fi-based one, i.e., the users need to create their own radio map. Finally, a fingerprinting method with auto training was successfully tested. The main advantage is that the radio map is automatically created without user intervention. In addition, the accuracy obtained is good enough to fulfill the objectives of this work, outperforming the one obtained when using the Wi-Fi-based system.
Future work will be focused on testing the BLE-based system with a bigger set of real users and in more different scenarios. We also want to study how moving the location of the beacons can affect the accuracy of the IPS. Besides, it is also interesting to focus on developing techniques to automatically detect when a beacon has been moved. After detecting a change in the position of some beacon, the automatic training method (see Section 6) can be run again to update the fingerprinting database.
Author Contributions
All authors contributed equally in this work. All authors have read and agreed to the published version of the manuscript.
Funding
This work was partially funded by the Spanish Ministry of Science, Innovation and Universities through the Retos investigación programme (RTI2018-095168-B-C53) and by Jaume I University Pla de promoció de la investigació programme (UJI-B2017-45).
Acknowledgments
The authors would like to thank the volunteers for participating in the experiments presented in this paper.
Conflicts of Interest
The authors declare no conflict of interest.
Abbreviations
The following abbreviations are used in this manuscript:
| BLE | Bluetooth Low Energy |
| IPS | Indoor Positioning System |
| RSSI | Received Strength Signal Intensity |
| SMS | Significant Motion Sensor |
| WAP | Wireless Access Point |
References
- Khalajmehrabadi, A.; Gatsis, N.; Akopian, D. Modern WLAN Fingerprinting Indoor Positioning Methods and Deployment Challenges. IEEE Commun. Surv. Tutor. 2017, 19, 1974–2002. [Google Scholar] [CrossRef]
- Xia, S.; Liu, Y.; Yuan, G.; Hu, Z.; Wang, Z. Indoor Fingerprint Positioning Based on Wi-Fi: An Overview. ISPRS Int. J. Geo-Inf. 2017, 6, 135. [Google Scholar] [CrossRef]
- Belmonte-Fernández, O.; Puertas-Cabedo, A.; Torres-Sospedra, J.; Montoliu, R.; Trilles, S. An Indoor Positioning System Based on Wearables for Ambient-Assisted Living. Sensors 2017, 17, 36. [Google Scholar] [CrossRef] [PubMed]
- Torres-Sospedra, J.; Belmonte, O.; Montoliu, R.; Trilles, S.; Calia, A. How Feasible Is WiFi Fingerprint-Based Indoor Positioning for In-Home Monitoring? In Proceedings of the 12th International Conference on Intelligent Environments (IE’16), London, UK, 14–16 September 2016. [Google Scholar]
- Pérez-Navarro, A.; Torres-Sospedra, J.; Montoliu, R.; Conesa, J.; Berkvens, R.; Caso, G.; Costa, C.; Dorigatti, N.; Hernández, N.; Knauth, S.; et al. Challenges of Fingerprinting in Indoor Positioning and Navigation. In Geographical and Fingerprinting Data to Create Systems for Indoor Positioning and Indoor/Outdoor Navigation; Conesa, J., Pérez-Navarro, A., Torres-Sospedra, J., Montoliu, R., Eds.; Intelligent Data-Centric Systems; Academic Press: Cambridge, MA, USA, 2019; pp. 1–20. [Google Scholar]
- Lyons, B.; Austin, D.; Seelye, A.; Austin, J.; Yeargers, J.; Riley, T.; Sharma, N.; Mattek, N.; Wild, K.; Dodge, H.; et al. Pervasive Computing Technologies to Continuously Assess Alzheimer’s Disease Progression and Intervention Efficacy. Front. Aging Neurosci. 2015, 7, 102. [Google Scholar] [CrossRef] [PubMed]
- Barsocchi, P.; Cimino, M.G.C.; Ferro, E.; Lazzeri, A.; Palumbo, F.; Vaglini, G. Monitoring elderly behavior via indoor position-based stigmergy. Pervasive Mob. Comput. 2015, 23, 26–42. [Google Scholar] [CrossRef]
- Dawadi, P.; Cook, D.; Schmitter-Edgecombe, M. Automated Cognitive Health Assessment From Smart Home-Based Behavior Data. IEEE J. Biomed. Health Inform. 2015, 20, 1188–1194. [Google Scholar] [CrossRef]
- Alberdi, A.; Weakley, A.; Goenaga, A.; Schmitter-Edgecombe, M.; Cook, D. Automatic assessment of functional health decline in older adults based on smart home data. J. Biomed. Inform. 2018, 81, 119–130. [Google Scholar] [CrossRef]
- Montoliu, R.; Sansano, E.; Gascó, A.; Belmonte-Fernández, O.; Caballer, A. Senior Monitoring: A Real Case of Applying a WiFiFingerprinting-based Indoor Positioning Method forPeople Monitoring. In Proceedings of the 2019 International Conference on Indoor Positioning and Indoor Navigation (IPIN’19), Zurich, Switzerland, 30 September–3 October 2019. [Google Scholar]
- Zhuang, Y.; Yang, J.; Li, Y.; Qi, L.; El-Sheimy, N. Smartphone-based indoor localization with Bluetooth Low Energy beacons. Sensors 2016, 16, 596. [Google Scholar] [CrossRef]
- Faragher, R.; Harle, R. Location fingerprinting with Bluetooth Low Energy beacons. IEEE J. Sel. Areas Commun. 2015, 33, 2418–2428. [Google Scholar] [CrossRef]
- Kriz, P.; Maly, F.; Kozel, T. Improving Indoor Localization Using Bluetooth Low Energy Beacons. Mob. Inf. Syst. 2016, 2016, 2083094. [Google Scholar] [CrossRef]
- Addlesee, M.; Curwen, R.; Hodges, S.; Newman, J.; Steggles, P.; Ward, A.; Hopper, A. Implementing a sentient computing system. Computer 2001, 34, 50–56. [Google Scholar] [CrossRef]
- Marques, G.; Pitarma, R.M.; Garcia, N.; Pombo, N. Internet of Things Architectures, Technologies, Applications, Challenges, and Future Directions for Enhanced Living Environments and Healthcare Systems: A Review. Electronics 2019, 8, 1081. [Google Scholar] [CrossRef]
- Mostaghel, R. Innovation and technology for the elderly: Systematic literature review. J. Bus. Res. 2016, 69, 4896–4900. [Google Scholar] [CrossRef]
- Malasinghe, L.; Ramzan, N.; Dahal, K. Remote patient monitoring: A comprehensive study. J. Ambient. Intell. Humaniz. Comput. 2019, 10, 57–76. [Google Scholar] [CrossRef]
- Ramezani, R.; Zhang, W.; Xie, Z.; Shen, J.; Elashoff, D.; Roberts, P.; Stanton, A.; Eslami, M.; Wenger, N.; Sarrafzadeh, M.; et al. A Combination of Indoor Localization and Wearable Sensor–Based Physical Activity Recognition to Assess Older Patients Undergoing Subacute Rehabilitation: Baseline Study Results. JMIR Mhealth Uhealth 2019, 7, e14090. [Google Scholar] [CrossRef]
- Sukreep, S.; Nukoolkit, C.M.P. Indoor Position Detection Using Smartwatch and Beacons. Sens. Mater. 2020, 32, 455–473. [Google Scholar] [CrossRef]
- Tegou, T.; Kalamaras, I.; Tsipouras, M.; Giannakeas, N.; Votis, K.; Tzovaras, D. A Low-Cost Indoor Activity Monitoring System for Detecting Frailty in Older Adults. Sensors 2019, 19, 452. [Google Scholar] [CrossRef]
- Randazzo, V.; Ferretti, J.; Pasero, E. A Wearable Smart Device to Monitor Multiple Vital Parameters—VITAL ECG. Electronics 2020, 9, 300. [Google Scholar] [CrossRef]
- Saponara, S.; Donati, M.; Fanucci, L.; Celli, A. An Embedded Sensing and Communication Platform, and a Healthcare Model for Remote Monitoring of Chronic Diseases. Electronics 2016, 5, 47. [Google Scholar] [CrossRef]
- Shyamkumar, P.; Rai, P.; Oh, S.; Ramasamy, M.; Harbaugh, R.E.; Varadan, V. Wearable Wireless Cardiovascular Monitoring Using Textile-Based Nanosensor and Nanomaterial Systems. Electronics 2014, 3, 504–520. [Google Scholar] [CrossRef]
- Schwenk, M.; Mohler, J.; Wendel, C.; D’Huyvetter, K.; Fain, M.; Taylor-Piliae, R.; Najafi, B. Wearable sensor-based in-home assessment of gait, balance, and physical activity for discrimination of frailty status: Baseline results of the Arizona frailty cohort study. Gerontology 2015, 61, 258–267. [Google Scholar] [CrossRef] [PubMed]
- Lee, J.y.; Yoon, C.h.; Park, H.; So, J. Analysis of Location Estimation Algorithms for Wifi Fingerprint-based Indoor Localization. In Proceedings of the 2nd International Conference on Software Technology (SoftTech’13), Yeosoo, Korea, 26–27 April 2013; pp. 89–92. [Google Scholar]
- He, S.; Chan, S.H.G. Wi-Fi fingerprint-based indoor positioning: Recent advances and comparisons. IEEE Commun. Surv. Tutor. 2016, 18, 466–490. [Google Scholar] [CrossRef]
- Liu, H.; Darabi, H.; Banerjee, P.; Liu, J. Survey of wireless indoor positioning techniques and systems. IEEE Trans. Syst. Man Cybern. Part C Appl. Rev. 2007, 37, 1067–1080. [Google Scholar] [CrossRef]
- Li, B.; Salter, J.; Dempster, A.; Rizos, C. Indoor positioning techniques based on wireless LAN. In Proceedings of the 1st IEEE International Conference on Wireless Broadband and Ultra Wide-band Communications (AusWireless’06), Sydney, Australia, 13–16 March 2006; pp. 13–16. [Google Scholar]
- Lara, O.; Labrador, M. A survey on human activity recognition using wearable sensors. IEEE Commun. Surv. Tutor. 2013, 15, 1192–1209. [Google Scholar] [CrossRef]
- Sansano, E.; Montoliu, R.; belmonte Fernéndez, O. A study of Deep Neural Networks for Human Activity Recognition. Comput. Intell. 2020, 37, 1–27. [Google Scholar] [CrossRef]
- Sansano, E.; belmonte Fernéndez, O.; Montoliu, R.; Gascó, A.; Caballer, A.; Bayarri, P. Improving positioning accuracy in Ambient Assisted Living environments. A multi-sensor approach. Proceedings of The 15th International Conference on Intelligent Environments (IE’19), Rabat, Morocco, 24–27 June 2019. [Google Scholar]
- Rodgers, J.; Nicewander, W. Thirteen ways to look at the correlation coefficient. Am. Stat. 1988, 42, 59–66. [Google Scholar] [CrossRef]
- Van der Maaten, L.; Hinton, G. Visualizing High-Dimensional Data Using t-SNE. J. Mach. Learn. Res. 2008, 9, 2579–2605. [Google Scholar]
- Rousseeuw, P.J. Silhouettes: A graphical aid to the interpretation and validation of cluster analysis. J. Comput. Appl. Math. 1987, 20, 53–65. [Google Scholar] [CrossRef]
- Jang, B.; Kim, H. Indoor positioning technologies without offline fingerprinting map: A survey. IEEE Commun. Surv. Tutor. 2019, 21, 508–525. [Google Scholar] [CrossRef]
© 2020 by the authors. Licensee MDPI, Basel, Switzerland. This article is an open access article distributed under the terms and conditions of the Creative Commons Attribution (CC BY) license (http://creativecommons.org/licenses/by/4.0/).