The Influence of Different Levels of Cognitive Engagement on the Seated Postural Sway


Abstract
1. Introduction
2. Materials and Methods
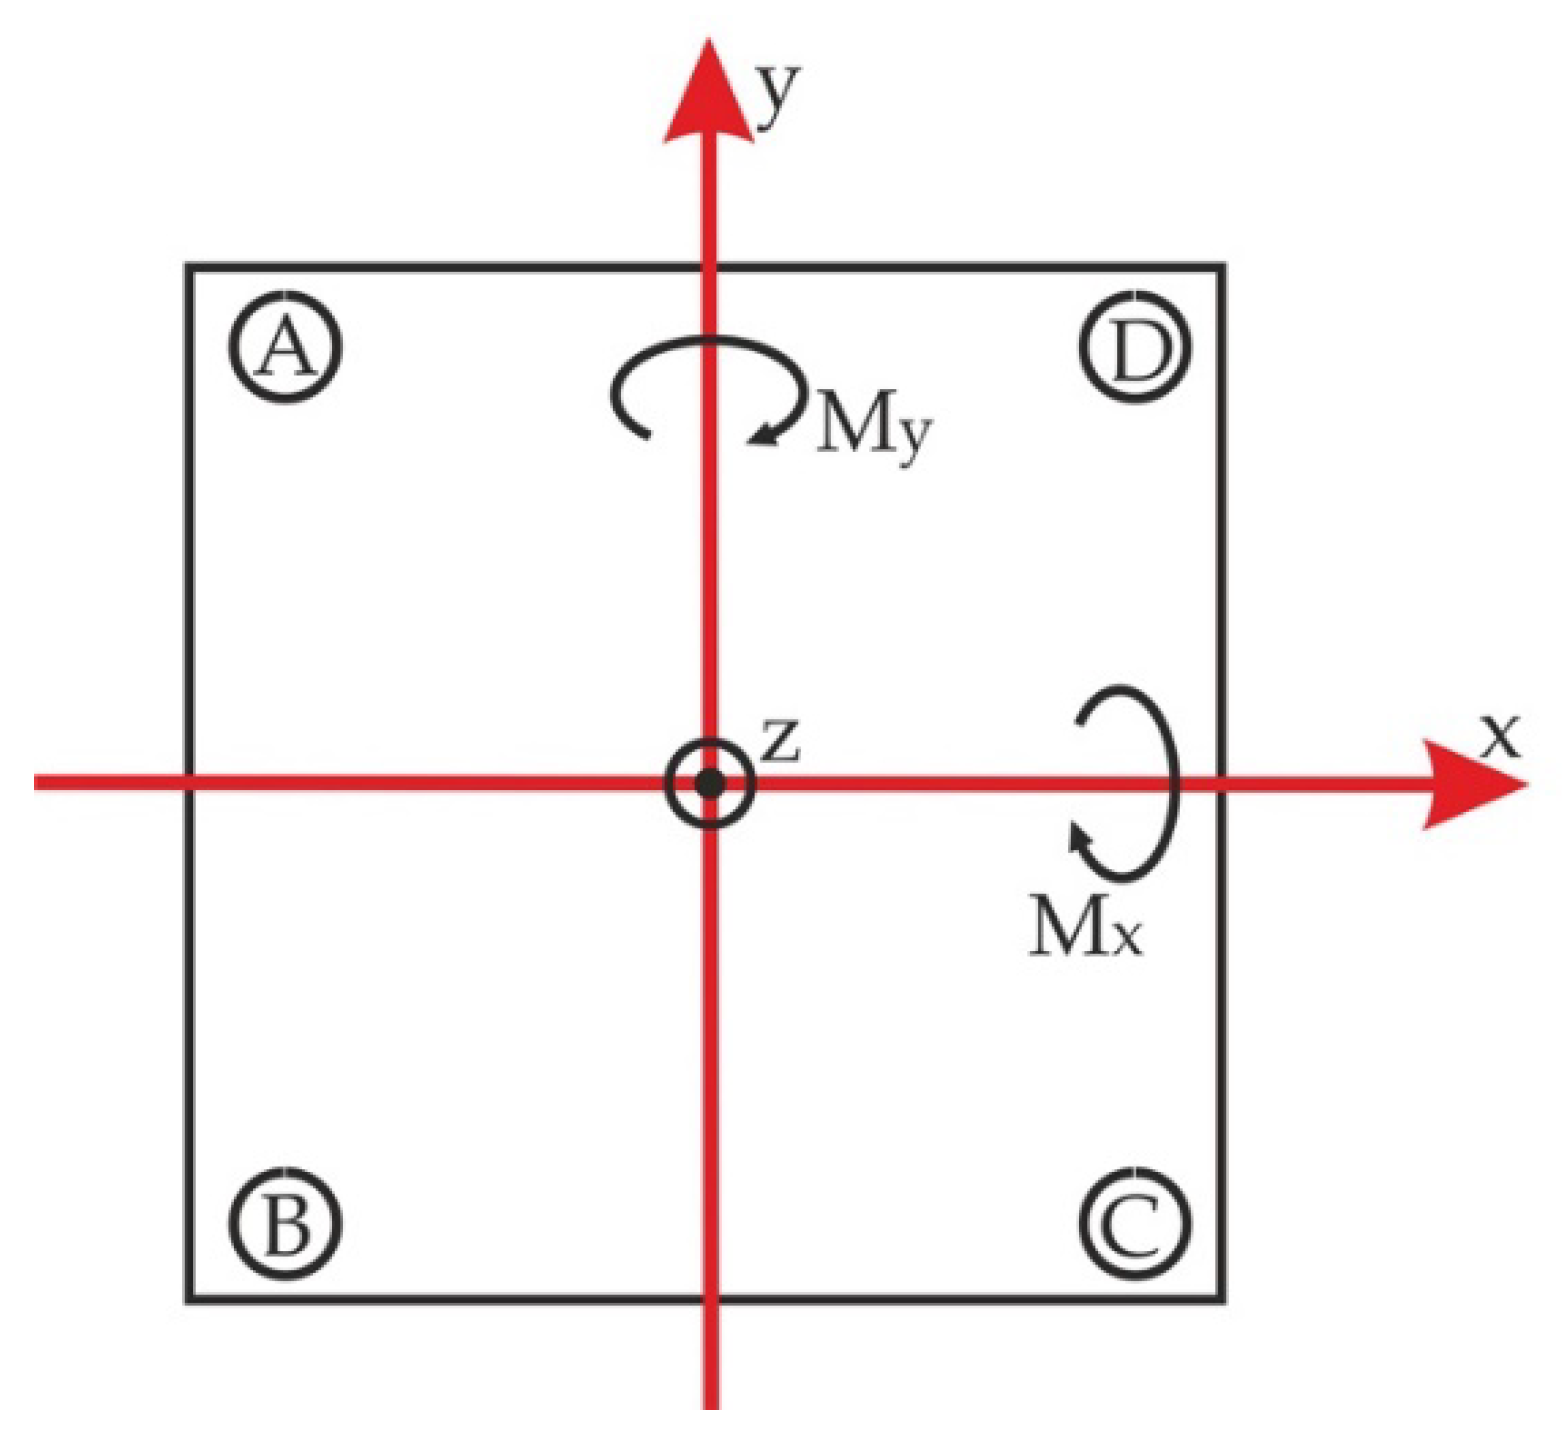
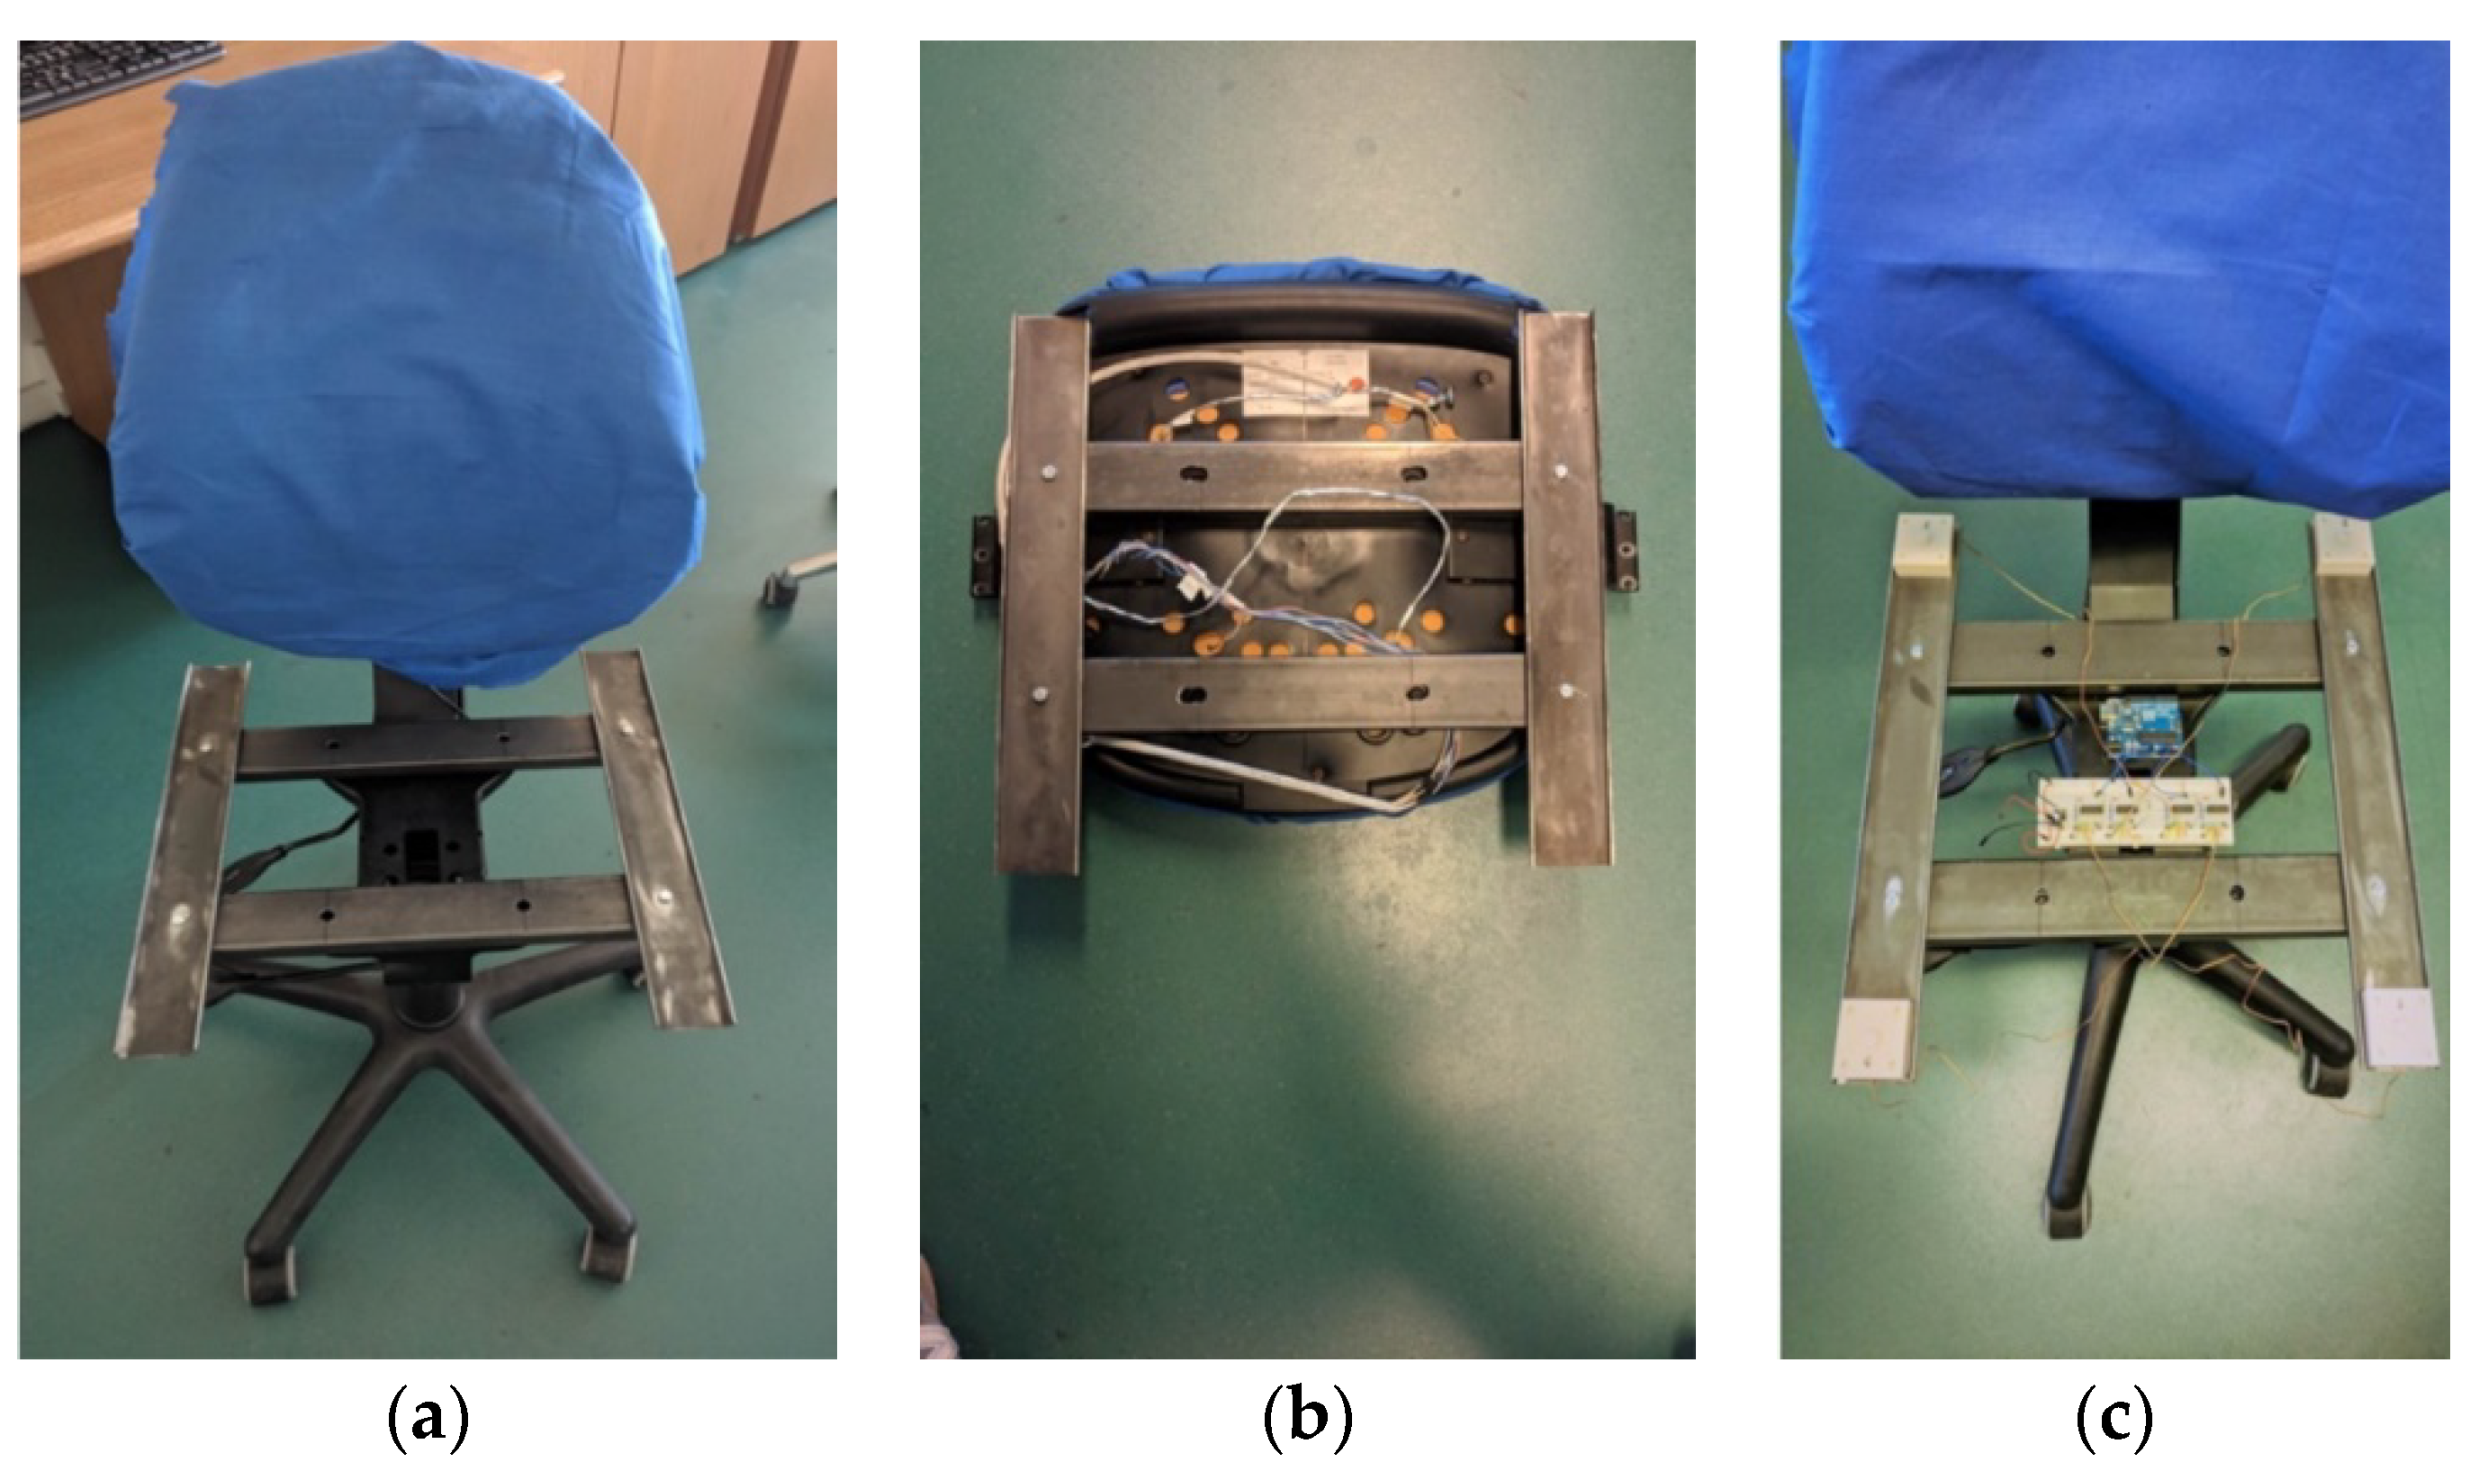
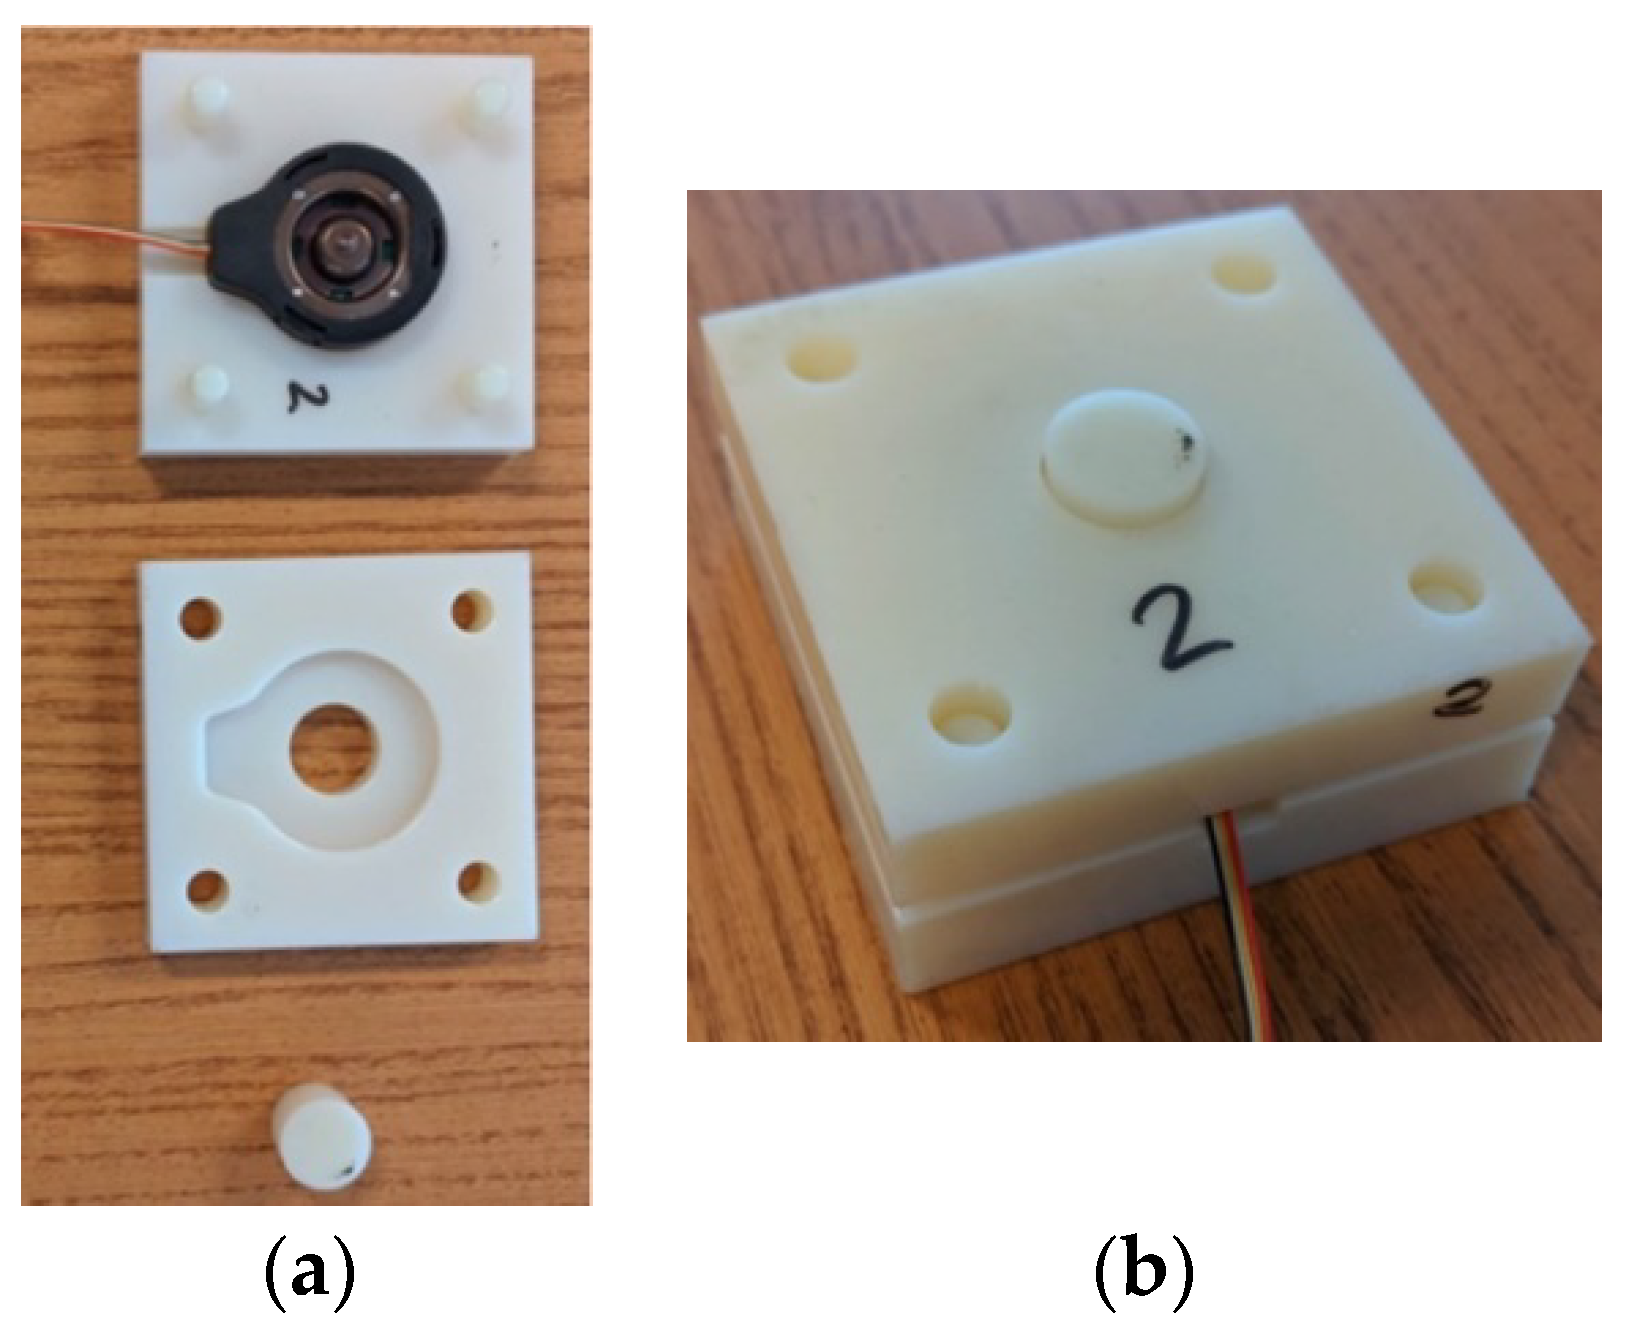
2.1. Instrumented Chair Design
2.2. Experimental Protocol
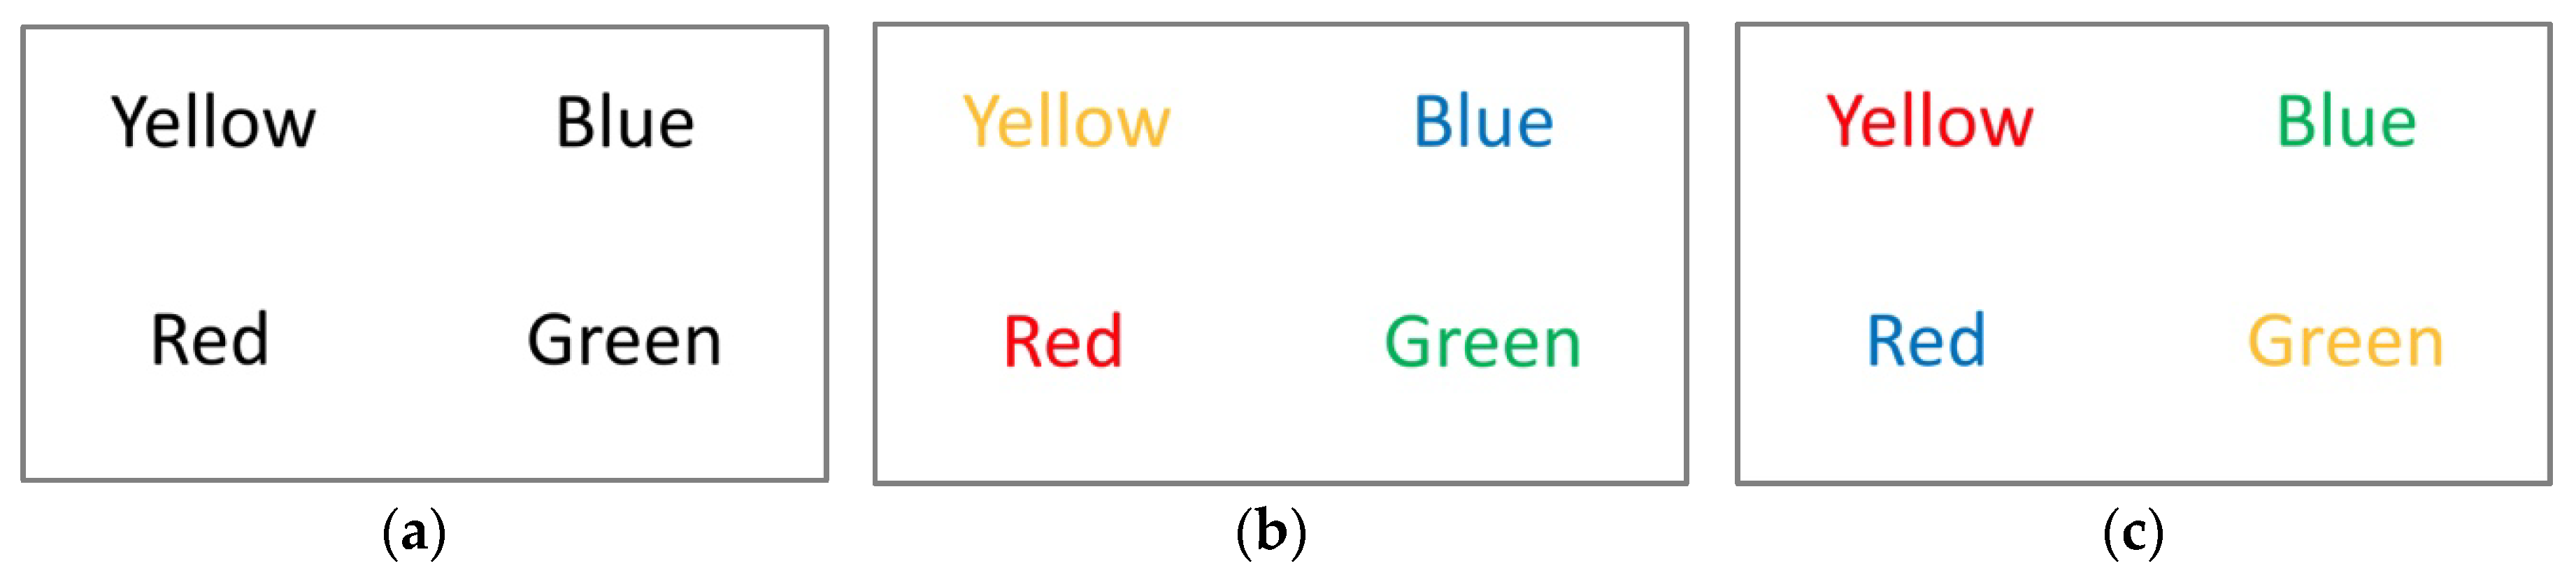
2.2.1. Stroop Test
- (a)
- PHA: 6 sets of black and white words representing color names, that were included in the test to make the participant familiar with the required task (i.e., the readings of words on a display in a predefined time slot) (Figure 5a).
- (b)
- PHB: 6 sets of colored words representing color names with a correspondence between the adopted color and the meaning (Figure 5b).
- (c)
- PHC: 12 sets of colored words representing color names with mismatching color and meaning (Figure 5c).
2.2.2. Experimental Protocol
2.3. Data Analysis
3. Results
4. Conclusions
Author Contributions
Funding
Acknowledgments
Conflicts of Interest
References
- Mielke, G.I.; Burton, N.W.; Turrellc, G.; Browna, W.J. Temporal trends in sitting time by domain in a cohort of mid-age Australian men and women. Maturitas 2018, 116, 108–115. [Google Scholar] [CrossRef]
- Medina, C.; Tolentino-Mayo, L.; López-Ridaura, R.; Barquera, S. Evidence of Increasing Sedentarism in Mexico City during the Last Decade: Sitting Time Prevalence, Trends, and Associations with Obesity and Diabetes. PLoS ONE 2017, 12, e0188518. [Google Scholar] [CrossRef] [PubMed]
- Owen, N.; Sparling, P.B.; Healy, G.N.; Dunstan, D.W.; Matthews, C.E. Sedentary Behavior: Emerging Evidence for a New Health Risk. Mayo Clin. Proc. 2010, 85, 1138–1141. [Google Scholar] [CrossRef] [PubMed]
- Loyen, A.; Chey, T.; Engelen, L.; Bauman, A.; Lakerveld, J.; van der Ploeg, H.P.; Brug, J.; Chau, J.Y. Recent Trends in Population Levels and Correlates of Occupational and Leisure Sitting Time in Full-Time Employed Australian Adults. PLoS ONE 2018, 13, e0195177. [Google Scholar] [CrossRef] [PubMed]
- Ekelund, U.; Steene-Johannessen, J.; Brown, W.J.; Fagerland, M.W.; Owen, N.; Powell, K.E.; Bauman, A.; Lee, I.M. Lancet Physical Activity Series 2 Executive Committe; Lancet Sedentary Behaviour Working Group. Does physical activity attenuate, or even eliminate, the detrimental association of sitting time with mortality? A harmonised meta-analysis of data from more than 1 million men and women. Lancet 2016, 388, 1302–1310. [Google Scholar] [CrossRef]
- Ikegami, K.; Hirata, H.; Ishihara, H.; Guo, S. Development of a Chair Preventing Low Back Pain with Sitting Person Doing Hand Working at the Same Time. In Proceedings of the 2018 IEEE International Conference on Mechatronics and Automation (ICMA), Changchun, China, 5–8 August 2018; pp. 1760–1764. [Google Scholar] [CrossRef]
- Kim, J.B.; Yoo, J.K.; Yu, S. Neck–Tongue Syndrome Precipitated by Prolonged Poor Sitting Posture. Neurol. Sci. 2014, 35, 121–122. [Google Scholar] [CrossRef]
- Sardini, E.; Serpelloni, M.; Pasqui, V. Daylong sitting posture measurement with a new wearable system for at home body movement monitoring. In Proceedings of the 2015 IEEE International Instrumentation and Measurement Technology Conference (I2MTC), Pisa, Italy, 11–14 May 2015; pp. 652–657. [Google Scholar] [CrossRef]
- Dunne, L.; Walsh, P.; Smyth, B.; Caulfield, B. Design and Evaluation of a Wearable Optical Sensor for Monitoring Seated Spinal Posture. In Proceedings of the 2006 10th IEEE International Symposium on Wearable Computers, Montreux, Switzerland, 11–14 October 2006; pp. 65–68. [Google Scholar]
- Fida, B.; Bernabucci, I.; Bibbo, D.; Conforto, S.; Proto, A.; Schmid, M. The Effect of Window Length on the Classification of Dynamic Activities through a Single Accelerometer, Biomedical Engineering. In Proceedings of the IASTED International Conference Biomedical Engineering (BioMed), Zurich, Switerzland, 23–25 June 2014. [Google Scholar]
- Fida, B.; Bibbo, D.; Bernabucci, I.; Proto, A.; Conforto, S.; Schmid, M. Real Time Event-Based Segmentation to Classify Locomotion Activities through a Single Inertial Sensor. In Proceedings of the 5th EAI International Conference on Wireless Mobile Communication and Healthcare, London, UK, 14–16 October 2015. [Google Scholar]
- Yamato, Y. Experiments of Posture Estimation on Vehicles Using Wearable Acceleration Sensors. In Proceedings of the 2017 IEEE 3rd International Conference on Big Data Security on Cloud (BigDataSecurity), IEEE International Conference on High Performance and Smart Computing, (HPSC) and IEEE International Conference on Intelligent Data and Security (IDS), Beijing, China, 26–28 May 2017; pp. 14–17. [Google Scholar]
- Massé, F.; Bourke, A.K.; Chardonnens, J.; Paraschiv-Ionescu, A.; Aminian, K. Suitability of commercial barometric pressure sensors to distinguish sitting and standing activities for wearable monitoring. Med. Eng. Phys. 2014, 36, 739–744. [Google Scholar] [CrossRef]
- Estrada, J.; Vea, L. Sitting posture recognition for computer users using smartphones and a web camera. In Proceedings of the TENCON 2017 - 2017 IEEE Region 10 Conference, Penang, Malaysia, 5–8 November 2017; pp. 1520–1525. [Google Scholar] [CrossRef]
- Amine Elforaici, M.E.; Chaaraoui, I.; Bouachir, W.; Ouakrim, Y.; Mezghani, N. Posture Recognition Using an RGB-D Camera: Exploring 3D Body Modeling and Deep Learning Approaches. In Proceedings of the 2018 IEEE Life Sciences Conference (LSC), Montreal, QC, Canada, 28–30 October 2018; pp. 69–72. [Google Scholar]
- Wang, W.-J.; Chang, J.-W.; Haung, S.-F.; Wang, R.-J. Human Posture Recognition Based on Images Captured by the Kinect Sensor. Int. J. Adv. Robot. Syst. 2016, 13. [Google Scholar] [CrossRef]
- D’Anna, C.; Varrecchia, T.; Bibbo, D.; Orsini, F.; Schmid, M.; Conforto, S. Effect of different smartphone uses on posture while seating and standing. In Proceedings of the 2018 IEEE International Symposium on Medical Measurements and Applications (MeMeA), Rome, Italy, 11–13 June 2018. [Google Scholar]
- Ishac, K.; Suzuki, K. LifeChair: A Conductive Fabric Sensor-Based Smart Cushion for Actively Shaping Sitting Posture. Sensors 2018, 18, 2261. [Google Scholar] [CrossRef]
- Zemp, R.; Tanadini, M.; Plüss, S.; Schnüriger, K.; Singh, N.B.; Taylor, W.R.; Lorenzetti, S. Application of Machine Learning Approaches for Classifying Sitting Posture Based on Force and Acceleration Sensors. BioMed Res. Int. 2016, 2016, 5978489. [Google Scholar] [CrossRef]
- Roh, J.; Park, H.J.; Lee, K.J.; Hyeong, J.; Kim, S.; Lee, B. Sitting Posture Monitoring System Based on a Low-Cost Load Cell Using Machine Learning. Sensors 2018, 18, 208. [Google Scholar] [CrossRef] [PubMed]
- Bibbo, D.; Carli, M.; Conforto, S.; Federica, B. A Sitting Posture Monitoring Instrument to Assess Different Levels of Cognitive Engagement. Sensors 2019, 19, 455. [Google Scholar] [CrossRef] [PubMed]
- Prieto, T.E.; Myklebust, J.; Hoffmann, R.; Lovett, E.; Myklebust, B. Measures of postural steadiness: Differences between healthy young and elderly adults. IEEE Trans. Biomed. Eng. 1996, 43, 956–966. [Google Scholar] [CrossRef] [PubMed]
- Błaszczyk, J.W. The use of force-plate posturography in the assessment of postural instability. Gait Posture 2016, 44, 1–6. [Google Scholar] [CrossRef] [PubMed]
- Morasso, P.G.; Sanguineti, V. Ankle Muscle Stiffness Alone Cannot Stabilize Balance during Quiet Standing. J. Neurophysiol. 2002, 88, 2157–2162. [Google Scholar] [CrossRef] [PubMed]
- Schmid, M.; Conforto, S.; Bibbo, D.; D’Alessio, T. Respiration and postural sway: Detection of phase synchronizations and interactions. Hum. Mov. Sci. 2004, 23, 105–119. [Google Scholar] [CrossRef]
- Conforto, S.; Schmid, M.; Camomilla, V.; D’Alessio, T.; Cappozzo, A. Hemodynamics as a possible internal mechanical disturbance to balance. Gait Posture 2001, 14, 28–35. [Google Scholar] [CrossRef]
- Goodworth, A.D.; Tetreault, K.; Lanman, J.; Klidonas, T.; Kim, S.; Saavedra, S. Sensorimotor control of the trunk in sitting sway referencing. J. Neurophysiol. 2018, 120, 37–52. [Google Scholar] [CrossRef]
- Galin, D.; Johnstone, J.; Herron, J. Effects of task difficulty on EEG measures of cerebral engagement. Neuropsychologia 1978, 16, 461–472. [Google Scholar] [CrossRef]
- Hou, X.; Liu, Y.; Sourina, O.; Tan, Y.R.E.; Wang, L.; Mueller-Wittig, W. EEG Based Stress Monitoring. In Proceedings of the 2015 IEEE International Conference on Systems, Man, and Cybernetics, Kowloon, China, 9–12 October 2015; pp. 3110–3115. [Google Scholar] [CrossRef]
- Russ, S.; MacKenzie, R.K.; Morrison, I.; Morse, J.; Johnston, M.; Bell, C.; Patey, R. 0094 The impact of demand and cognitive load on stress and performance in 2nd year medical students: A simulation study. BMJ Simul. Technol. Enhanc. Learn. 2015, 1, A10. [Google Scholar] [CrossRef]
- West, R.; Bell, M.A. Stroop color—word interference and electroencephalogram activation: Evidence for age-related decline of the anterior attention system. Neuropsychology 1997, 11, 421–427. [Google Scholar] [CrossRef] [PubMed]
- Bonnet, C.T.; Davin, D.; Hoang, J.-Y.; Baudry, S. Relations between Eye Movement, Postural Sway and Cognitive Involvement in Unprecise and Precise Visual Tasks. Neuroscience 2018, 416, 177–189. [Google Scholar] [CrossRef] [PubMed]
- Stins, J.F.; Michielsen, M.E.; Roerdink, M.; Beek, P.J. Sway regularity reflects attentional involvement in postural control: Effects of expertise, vision and cognition. Gait Posture 2009, 30, 106–109. [Google Scholar] [CrossRef] [PubMed]
- Leach, J.M.; Mancini, M.; Kaye, J.A.; Haye, T.L.; Horak, F.B. Day-to-Day Variability of Postural Sway and Its Association With Cognitive Function in Older Adults: A Pilot Study. Front. Aging Neurosci. 2018, 10, 126. [Google Scholar] [CrossRef]
- Bibbo, D.; Gabriele, S.; Scorza, A.; Schmid, M.; Sciuto, S.A.; Conforto, S. Strain gauges position optimization in designing custom load cells for sport gesture analysis. In Proceedings of the IEEE 20th International Conference on E-Health Networking, Applications and Services (Healthcom), Ostrava, Czech Republic, 17–20 September 2018; pp. 1–6. [Google Scholar]
- Bibbo, D.; Gabriele, S.; Scorza, A.; Schmid, M.; Sciuto, S.A.; Conforto, S. A Novel Technique to Design and Optimize Performances of Custom Load Cells for Sport Gesture Analysis. IRBM 2019, 40, 201–210. [Google Scholar] [CrossRef]
- Stroop, J.R. Studies of interference in serial verbal reactions. J. Exp. Psychol. 1935, 18, 643–662. [Google Scholar] [CrossRef]
- Renaud, P.; Blondin, J.-P. The Stress of Stroop Performance: Physiological and Emotional Responses to Color–Word Interference, Task Pacing, and Pacing Speed. Int. J. Psychophysiol. 1997, 27, 87–97. [Google Scholar] [CrossRef]


| Number of Words Per Set | Number of Slides | Time Per Slide [s] | |
|---|---|---|---|
| PHA: Black and white words | 3 | 2 | 2 |
| 4 | 2 | 2.5 | |
| 5 | 1 | 3 | |
| 6 | 1 | 3.5 | |
| PHB: Colored words with color matching the meaning | 3 | 2 | 2 |
| 4 | 2 | 2.5 | |
| 5 | 1 | 3 | |
| 6 | 1 | 3.5 | |
| PHC: Colored words with color not matching the meaning | 3 | 2 | 2.5 |
| 4 | 2 | 3 | |
| 5 | 2 | 3.5 | |
| 6 | 2 | 4 | |
| 9 | 2 | 6 | |
| 12 | 2 | 8 |
| Measure | PHA | PHB | PHC | p-values | ||||||||
|---|---|---|---|---|---|---|---|---|---|---|---|---|
| Mean | std | Mean | std | Mean | std | PHA-PHB | PHA-PHC | PHB-PHC | PHA-PHB | PHA-PHC | PHB-PHC | |
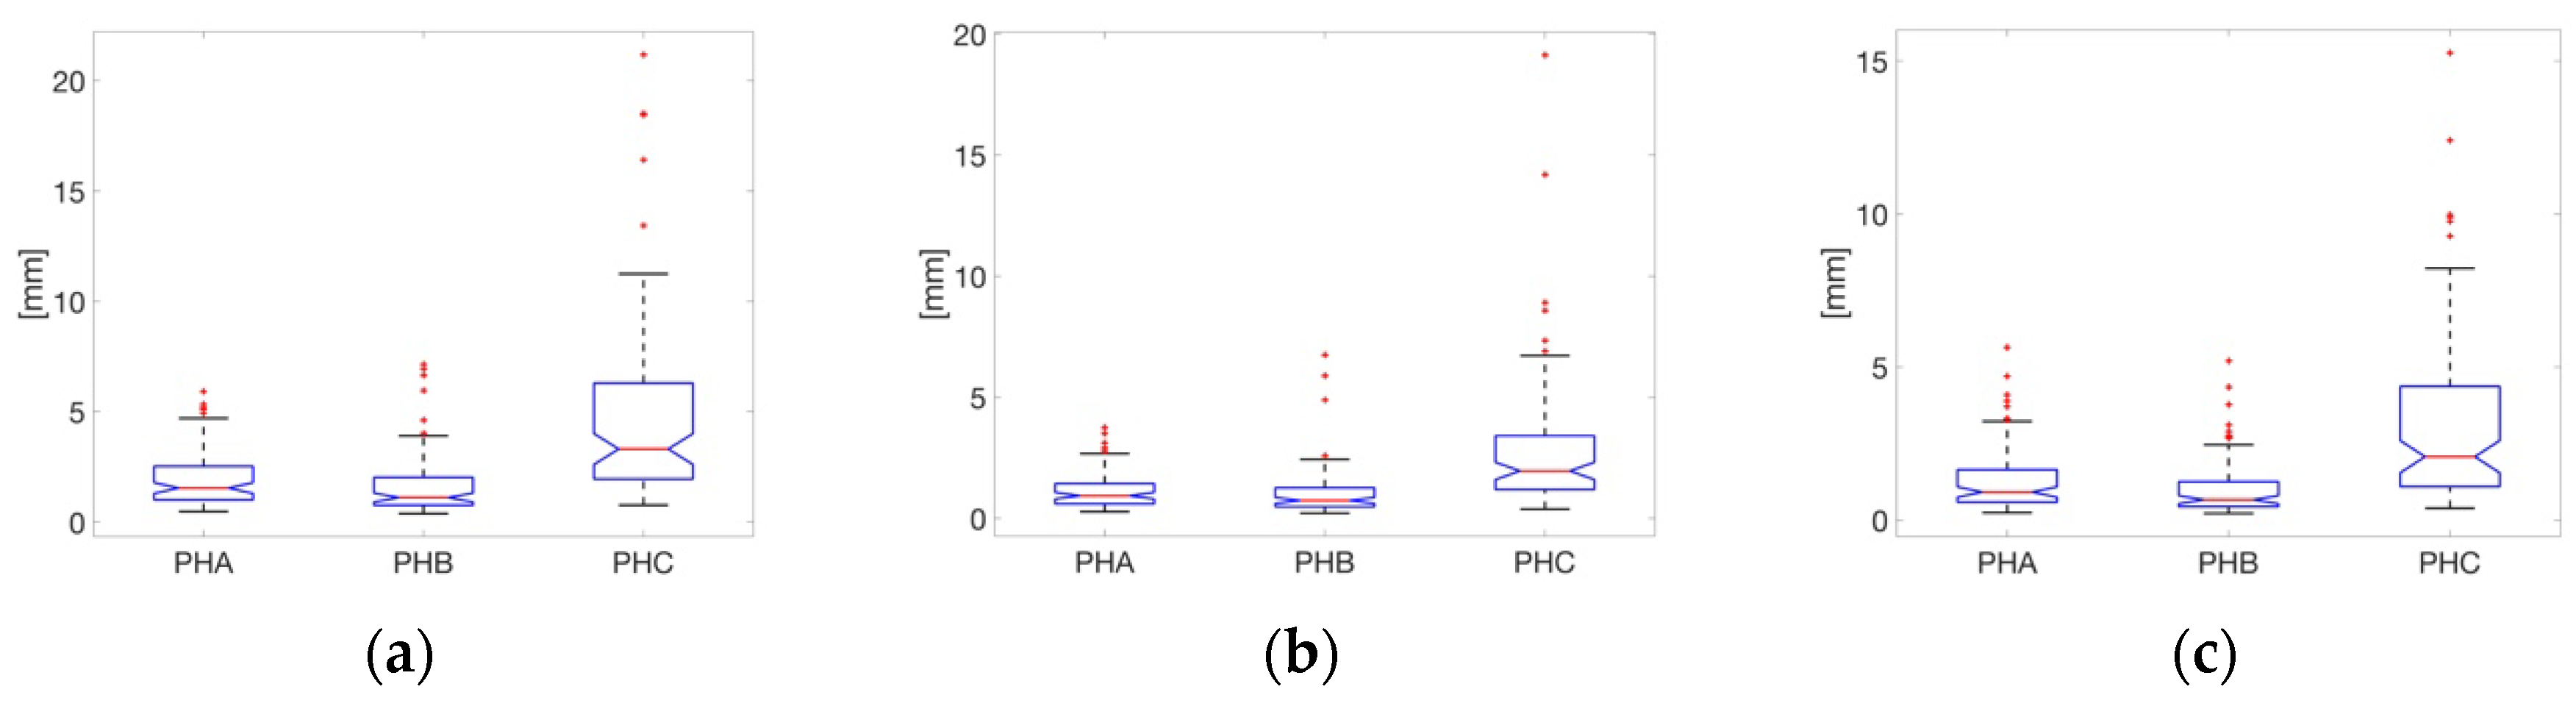
| mean distance (mm) | 1.95 | 1.30 | 1.66 | 1.44 | 4.72 | 4.14 | 0.1481 | 1.06 × 10⁻¹⁵ | 1.22 × 10⁻¹⁰ | **** | **** | |
| mean distance x (mm) | 1.16 | 0.74 | 1.07 | 1.06 | 2.84 | 2.83 | 0.5376 | 2.90 × 10⁻¹² | 4.68 × 10⁻⁸ | **** | **** | |
| mean distance y (mm) | 1.30 | 1.05 | 1.03 | 0.93 | 3.14 | 2.85 | 0.0628 | 4.21 × 10⁻¹⁵ | 9.41 × 10⁻¹¹ | **** | **** | |
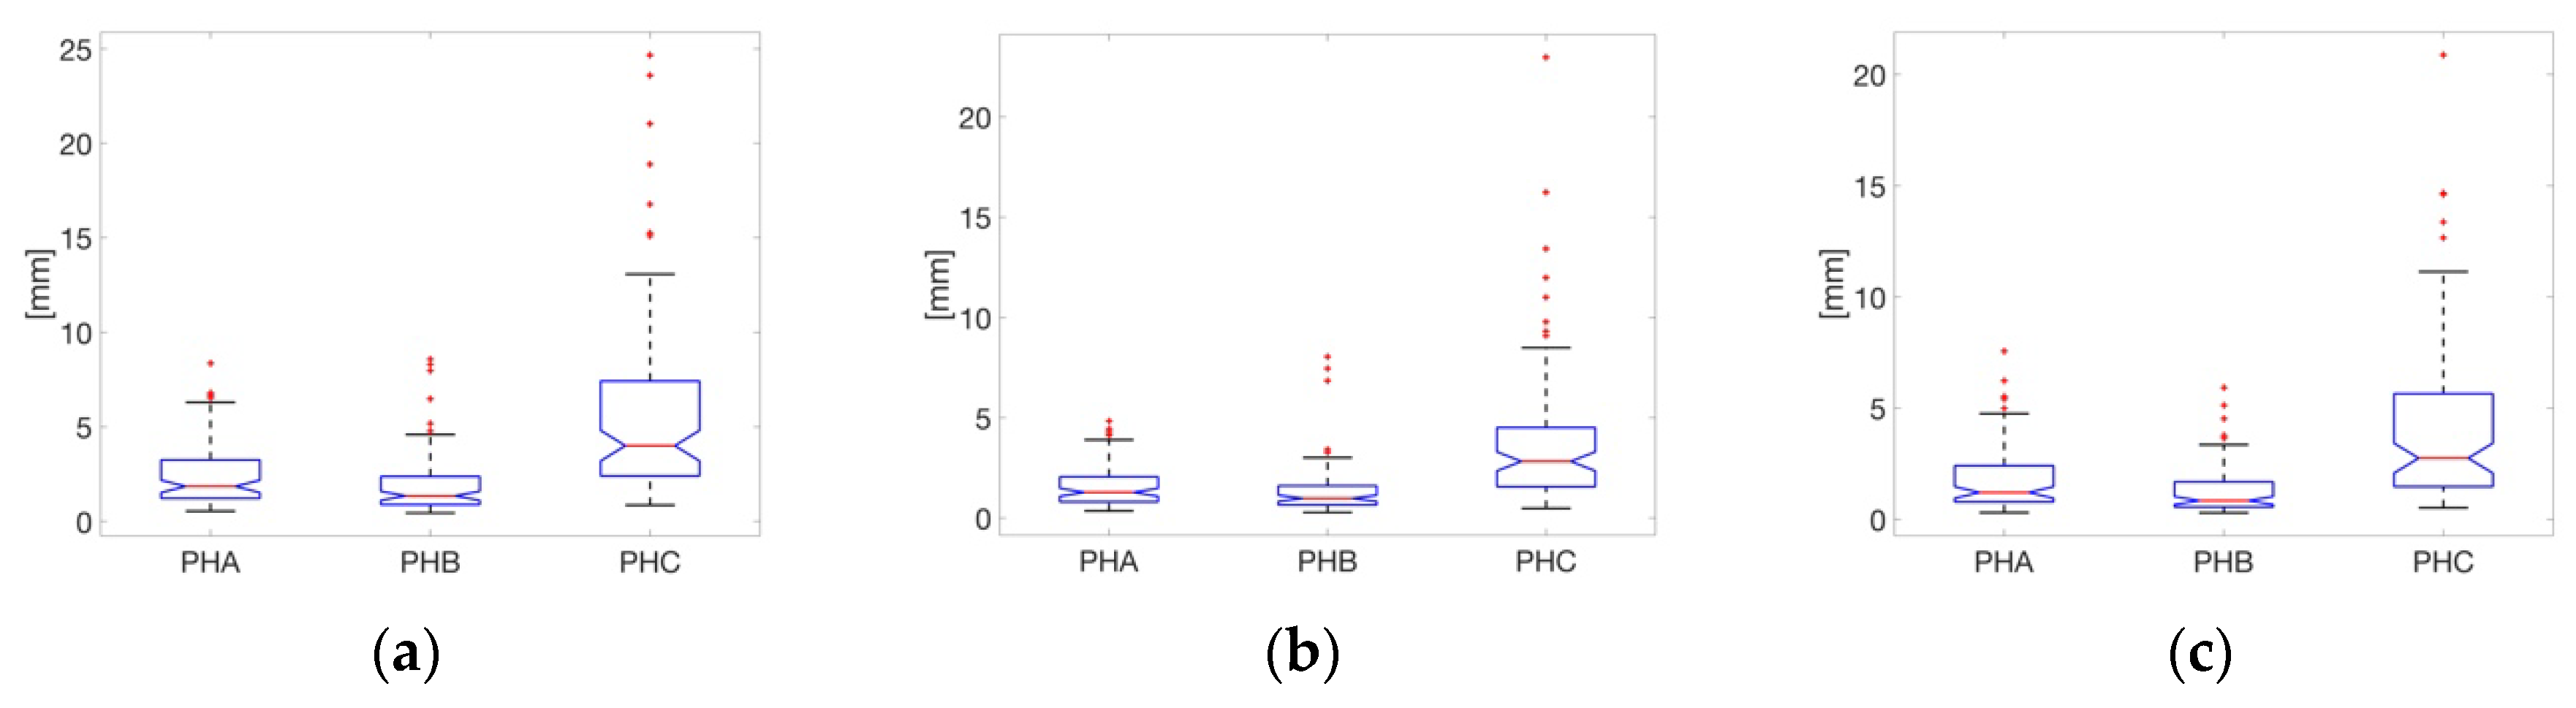
| rms distance (mm) | 2.45 | 1.67 | 1.96 | 1.69 | 5.77 | 5.03 | 0.0457 | 6.38 × 10⁻¹⁶ | 4.18 × 10⁻¹¹ | * | **** | **** |
| rms distance x (mm) | 1.59 | 1.03 | 1.40 | 1.35 | 3.81 | 3.61 | 0.2878 | 2.50 × 10⁻¹³ | 6.02 × 10⁻⁹ | **** | **** | |
| rms distance y (mm) | 1.77 | 1.44 | 1.30 | 1.10 | 4.14 | 3.74 | 0.0124 | 2.18 × 10⁻¹⁵ | 2.66 × 10⁻¹¹ | * | **** | **** |
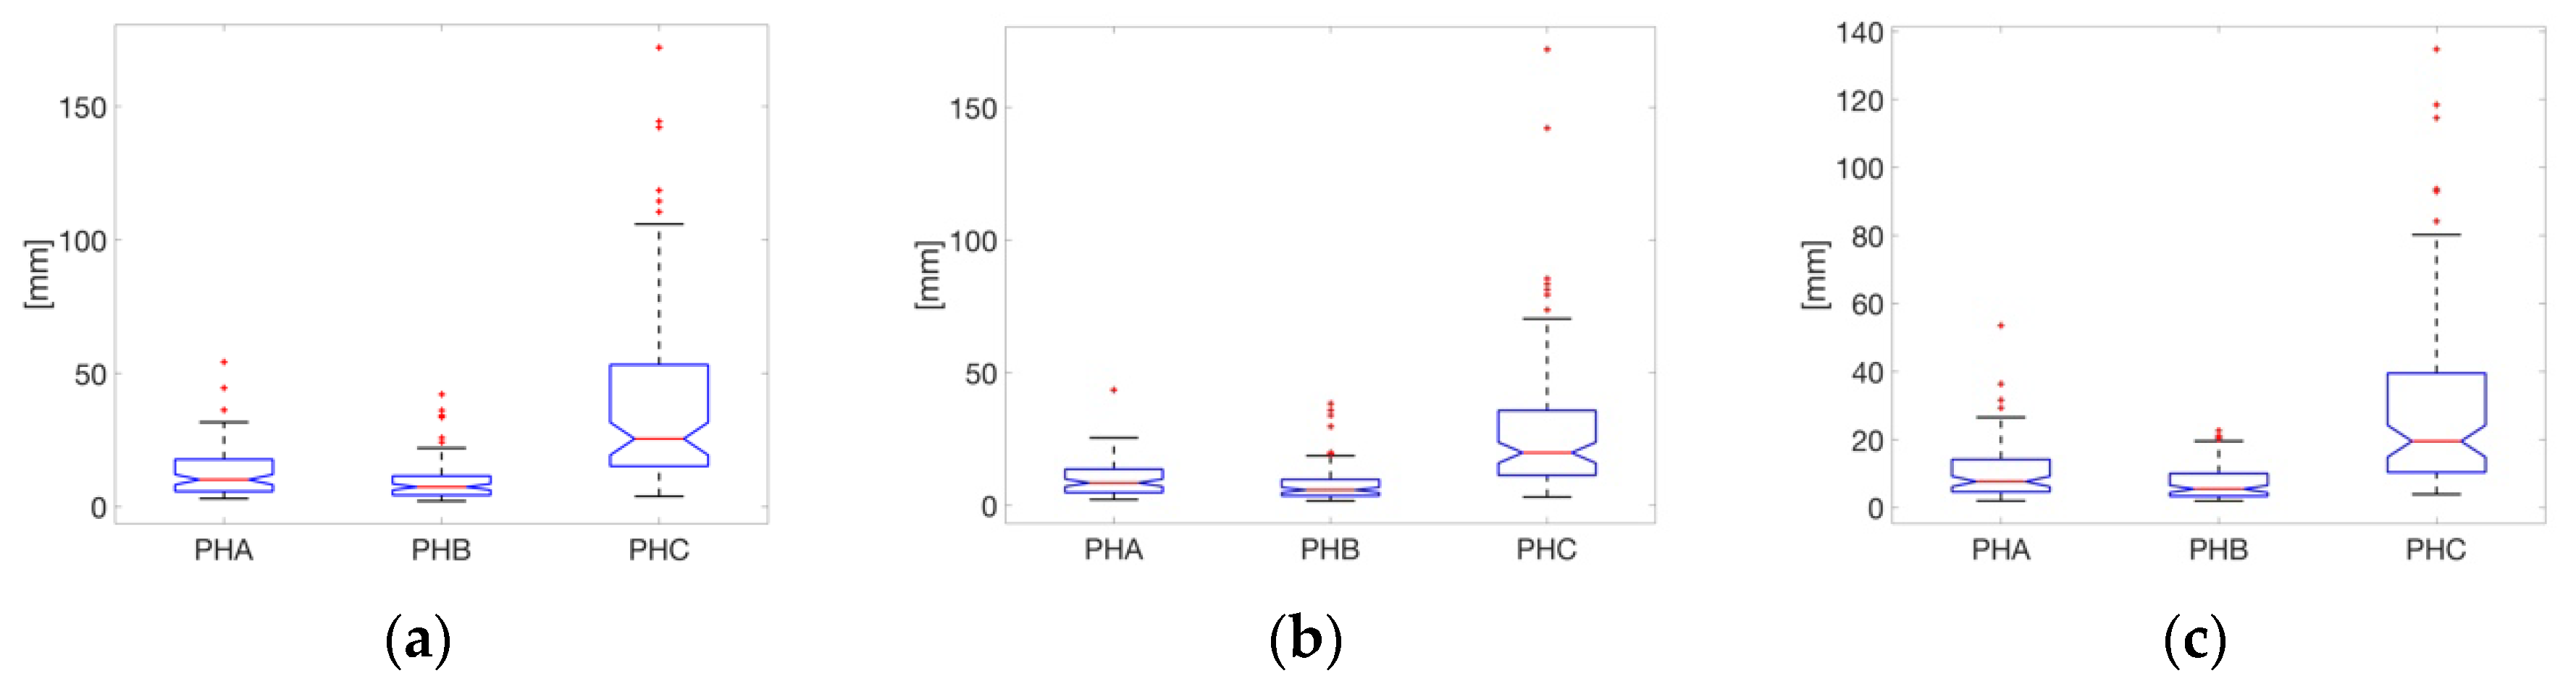
| range (mm) | 13.11 | 9.57 | 9.70 | 7.93 | 37.54 | 33.40 | 0.0082 | 7.41 × 10⁻²⁰ | 2.25 × 10⁻¹³ | ** | **** | **** |
| range x (mm) | 10.25 | 7.17 | 8.14 | 7.12 | 28.72 | 27.62 | 0.0435 | 9.16 × 10⁻¹⁷ | 3.69 × 10⁻¹¹ | * | **** | **** |
| range y (mm) | 10.72 | 8.82 | 7.30 | 5.20 | 29.89 | 26.80 | 0.0014 | 9.68 × 10⁻²⁰ | 8.33 × 10⁻¹⁴ | ** | **** | **** |
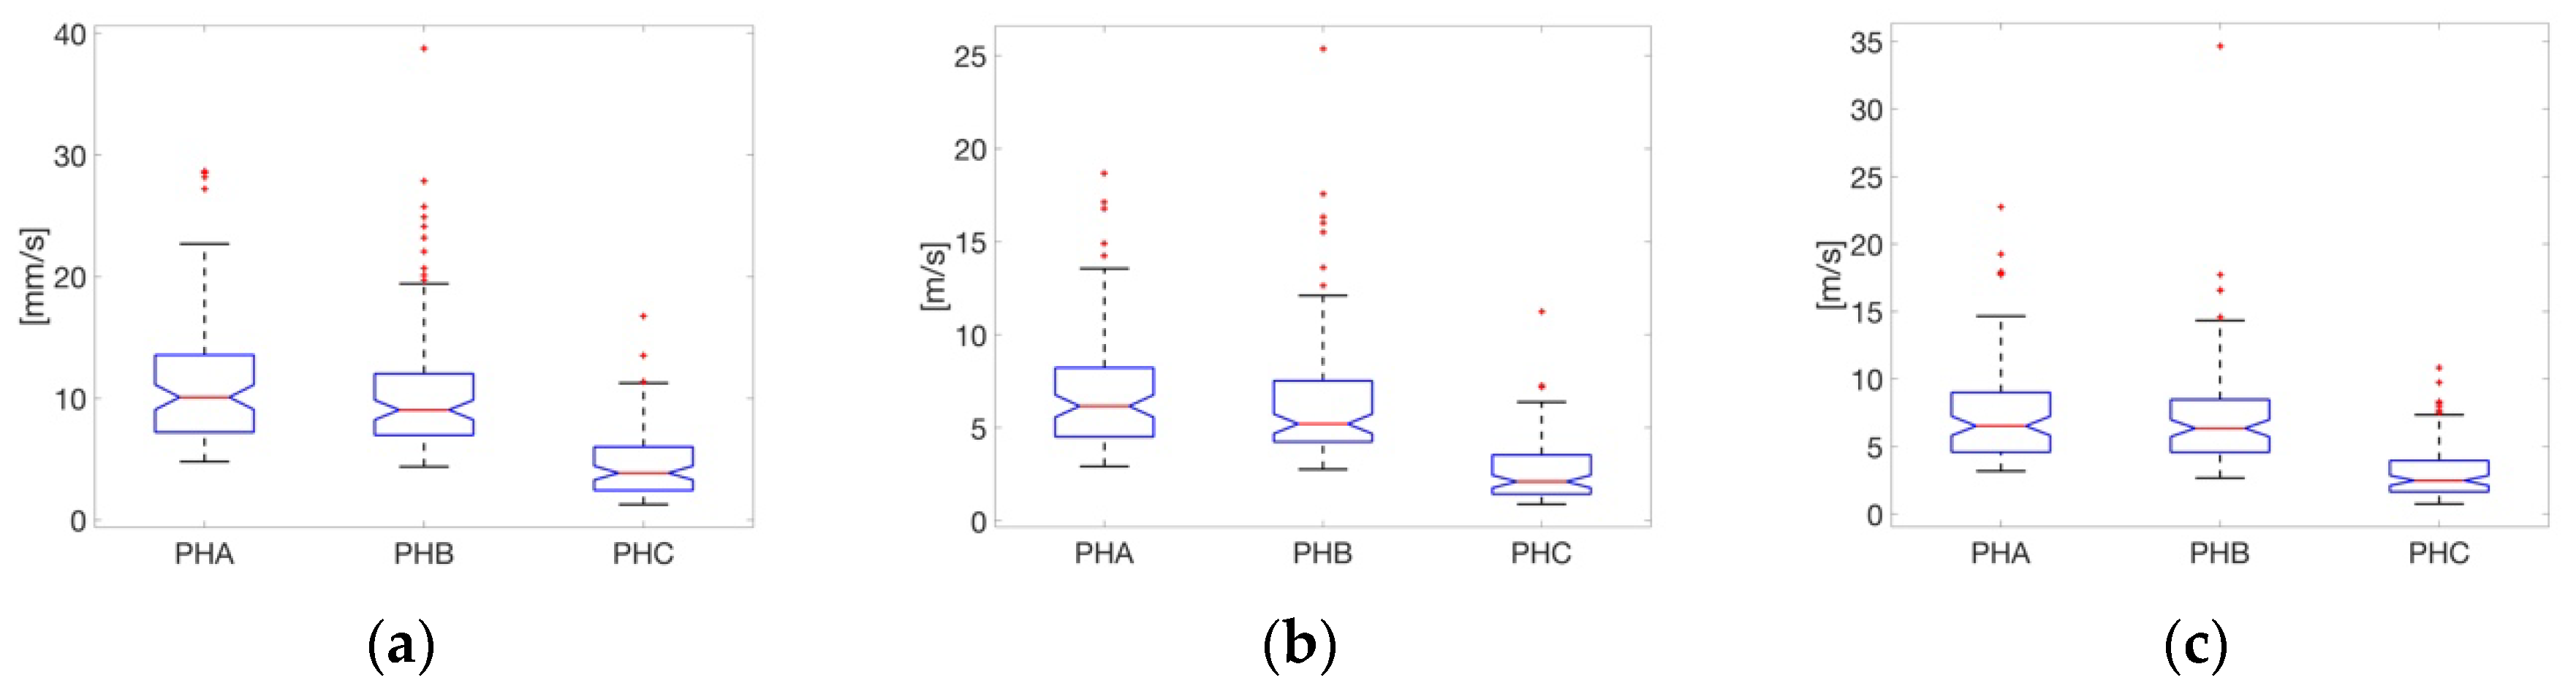
| mean velocity (mm/s) | 11.33 | 5.47 | 10.78 | 5.84 | 4.72 | 2.97 | 0.5044 | 3.98 × 10⁻²⁰ | 2.32 × 10⁻¹⁶ | **** | **** | |
| mean velocity x (mm/s) | 6.86 | 3.31 | 6.44 | 3.72 | 2.79 | 1.84 | 0.4176 | 1.55 × 10⁻¹⁹ | 3.48 × 10⁻¹⁵ | **** | **** | |
| mean velocity y (mm/s) | 7.48 | 3.92 | 7.22 | 4.30 | 3.18 | 2.07 | 0.6617 | 3.81 × 10⁻¹⁷ | 2.80 × 10⁻¹⁴ | **** | **** | |
| 95% confidence circle area (mm2) | 6.19 | 2.11 | 5.35 | 2.09 | 9.20 | 3.86 | 0.0067 | 4.54 × 10⁻¹⁹ | 4.25 × 10⁻¹⁵ | ** | **** | **** |
| 95% confidence ellipse area (mm2) | 66.36 | 94.90 | 47.43 | 79.17 | 433.16 | 732.97 | 0.1371 | 1.70 × 10⁻¹⁰ | 8.27E-07 | **** | **** | |
| sway area (mm2/s) | 10.36 | 13.32 | 7.45 | 10.19 | 11.75 | 18.59 | 0.0932 | 0.1145 | 0.0497 | * | ||
© 2020 by the authors. Licensee MDPI, Basel, Switzerland. This article is an open access article distributed under the terms and conditions of the Creative Commons Attribution (CC BY) license (http://creativecommons.org/licenses/by/4.0/).
Share and Cite
Bibbo, D.; Conforto, S.; Schmid, M.; Battisti, F. The Influence of Different Levels of Cognitive Engagement on the Seated Postural Sway. Electronics 2020, 9, 601. https://doi.org/10.3390/electronics9040601
Bibbo D, Conforto S, Schmid M, Battisti F. The Influence of Different Levels of Cognitive Engagement on the Seated Postural Sway. Electronics. 2020; 9(4):601. https://doi.org/10.3390/electronics9040601
Chicago/Turabian StyleBibbo, Daniele, Silvia Conforto, Maurizio Schmid, and Federica Battisti. 2020. "The Influence of Different Levels of Cognitive Engagement on the Seated Postural Sway" Electronics 9, no. 4: 601. https://doi.org/10.3390/electronics9040601
APA StyleBibbo, D., Conforto, S., Schmid, M., & Battisti, F. (2020). The Influence of Different Levels of Cognitive Engagement on the Seated Postural Sway. Electronics, 9(4), 601. https://doi.org/10.3390/electronics9040601