Article

Dynamic Basic Activity Sequence Matching Method in Abnormal Driving Pattern Detection Using Smartphone Sensors

1
Faculty of Information Technology, VNU University of Engineering and Technology, Vietnam National University in Hanoi (VNU-UET), Hanoi 123105, Vietnam
2
Academy of Journalism and Communication (AJC), Hanoi 123105, Vietnam
3
Faculty of Telecommunications, Posts and Telecommunications Institute of Technology in Hanoi (PTIT), Hanoi 151100, Vietnam
4
VNU Information Technology Institute, Vietnam National University in Hanoi (VNU-ITI), Hanoi 123105, Vietnam
*
Authors to whom correspondence should be addressed.
Electronics 2020, 9(2), 217; https://doi.org/10.3390/electronics9020217
Submission received: 3 December 2019 / Revised: 10 January 2020 / Accepted: 25 January 2020 / Published: 27 January 2020
(This article belongs to the Section Electrical and Autonomous Vehicles)

Abstract

:
In this work, we present a novel method, namely dynamic basic activity sequence matching (DAS), a combination of machine learning methods and flexible threshold based methods for distinguishing normal and abnormal driving patterns. Indeed, DAS relies on the activity detection module (ADM) presented in our previous work to analyze each driving pattern as a sequence of basic activities—stopping (S), going straight (G), turning left (L), and turning right (R). In fact, the threshold value and other parameters like the duration of long and short activities are iteratively induced from the collected dataset. Hence, DAS is flexible and independent of driving contexts such as vehicle modes and road conditions. Experimental results, on the dataset collected from numerous motorcyclists, show the outperformance of our proposed method against dynamic time warping and the two popular machine learning methods—random forest and neural network—in distinguishing the normal and abnormal driving patterns. Moreover, we propose an efficient framework composing of two phases: in the first phase, the normal and abnormal driving patterns are distinguished by relying on DAS. In the second phase, the detected abnormal patterns are further classified into various specific abnormal driving patterns—weaving, sudden braking, etc. This fusion framework again achieves the highest overall accuracy of 97.94%.

1. Introduction

According to the global status report on road safety 2018 by the World Health Organization (WHO), approximately 1.35 million of people die per year as a result of road traffic crashes [1]. The main cause of road accidents is due to human factors, e.g., drunken drivers, speeding, sudden turning. Therefore, real-time detecting abnormal driving patterns is an effective approach to prevent such fatal accidents by alerting drivers to the potentially predicted dangerous scenarios as well as reporting the detected risk cases to a transportation management center.
Recently, numerous studies on abnormal driving pattern detection have been carried on. Indeed, such works primarily fall into the following categories: identifying driving styles (normal, aggressive, drunken, fatigue, drowsy, inattentive, etc.) [2,3,4,5,6,7,8], detecting normal and abnormal driving events (moving, stopping, turning left, turning right, weaving, sudden braking, fast u-turn, etc.) [9,10,11,12,13,14], accident detection [15,16].
Due to the high increment in popularity and computational capability, smartphones become widely used in these studies. Yet, they are considered the powerful devices being able either to access driver and vehicle information with the help of the embedded sensors—such as accelerometers, gyroscopes, GPSs, etc.—or to provide immediate feedbacks to drivers through intelligent abnormal driving pattern detection applications.
In order to deal with the above problems, various methods have been proposed to detect the driving abnormalities. These methods can be classified into two main categories: the binary and multiclass detection methods. The binary detection methods focus on identifying driving patterns as normal or abnormal ones [14,17,18]. In contrast, the multiclass detection methods try to recognize various specific abnormal driving patterns such as weaving, swerving, sudden braking, etc. [9,10,11,12,13,19,20,21,22]. Moreover, the abnormal driving pattern detection problem has been solved by three main approaches: dynamic time warping (DTW) [3,17,18], threshold based methods [20], and machine learning methods [14,17,18,19,21,22]. In fact, each method has its own pros and cons depending on its application domain. The DTW methods often apply on the raw sensor data signal. Hence, they do not acquire much of computation resource. Nonetheless, their prediction accuracy is often low [3,17,18]. In the threshold-based methods, the sensor data signal must be further processed, then a threshold value is selected to determine the abnormal patterns. However, such threshold values are quite sensitive to driving context such as vehicle mode and road condition. On the other hand, studies have shown that the machine learning methods often achieve relatively high prediction accuracy [14,19,20,21,22]. However, these methods might encounter several problems such as the imbalance of training dataset, the incorrect labels of collected data. In fact, our experiments show that the performance of some machine-learning methods, such as RF, is quite sensitive due to the hardness of collecting abnormal driving patterns.
In this study, we first propose a novel approach, namely dynamic basic activity sequence (DAS) matching, a combination of machine learning methods and threshold based methods for identifying normal and abnormal driving patterns. Indeed, DAS relies on the activity detection module (ADM) presented in [23] to analyze each driving pattern as a sequence of basic activities—stopping (S), going straight (G), turning left (L), turning right (R). In the previous study, it has been shown that in the normal driving scenarios of cars or motorcycles, the optimal duration of basic activities leading to the best prediction accuracy ranges from 4 to 6 s. However, by observing, when an abnormal driving pattern occurs, the duration of its basic activities is often much shorter, i.e., 1 or 2 s. Thus, each basic activity with a long duration—i.e., from 4 to 6 s—is then further analyzed as a sequence of sub basic activities with a shorter duration. By estimating the difference between the sequence of sub basic activities and the original basic activity, the abnormal driving pattern can be effectively detected with a proper threshold. Note that the threshold value and other parameters like the duration of long and short activities are induced from the collected dataset in an iterative procedure. Hence, our proposed method is flexible and independent of driving contexts such as vehicle modes and road conditions. Experimental results illustrate that DAS achieves the prediction accuracy, which is higher than DTW, RF, and NN by 28.83%, 9.24%, and 1.10% respectively in distinguish normal and abnormal driving patterns.
Secondly, we present an efficient framework for recognizing specific abnormal driving patterns, for instance weaving, sudden braking, etc. This task is done through a fusion of two modules: the first one is responsible for distinguishing normal and abnormal driving patterns by relying on DAS. The second one is in charge of further classifying the obtained abnormal patterns into various specific abnormal driving patterns. This fusion approach allows us to achieve the overall accuracy of 97.94%, which outperforms all common existing methods—DTW, RF, and NN.
The rest of this article is organized as followings: The related work is presented in Section 2. Then, the details of the proposed method are described in Section 3. Next, the experimental settings and results are shown in Section 4. Finally, Section 5 provides various conclusion remarks.

2. Related Work

This section presents the review of recent researches on abnormal driving pattern detection. These works have investigated various methods such as DTW [17,18], threshold based [20], and numerous machine-learning algorithms including RF, NN, SVM (support vector machine), artificial neural network (ANN), Bayesian network (BN), maximum likelihood (ML), naive Bayes (NB) [14,17,18,19,21,22]. Moreover, RF and NN have been shown to achieve a high performance among others [19,21,22]. Table 1 provides the summary of recent researches in the area of abnormal driving pattern detection.
In the machine learning methods, the time domain features, and the frequency domain features are popularly applied. Yet, Carlos et al. propose a novel approach relying on the bag of words to automatically extract features from accelerometers [22].
Though the method of Yu et al. [19] obtains a high prediction accuracy, i.e., 96.88%, its feature set is quite big, i.e., 152 features. This factor absolutely leads to a high computational time and resource. Thus, our proposed framework utilizes the smaller feature set consisting of 34 time-domain features and seven frequency-domain features and 18 Hjorth features previously described in [23].

3. Proposed Method

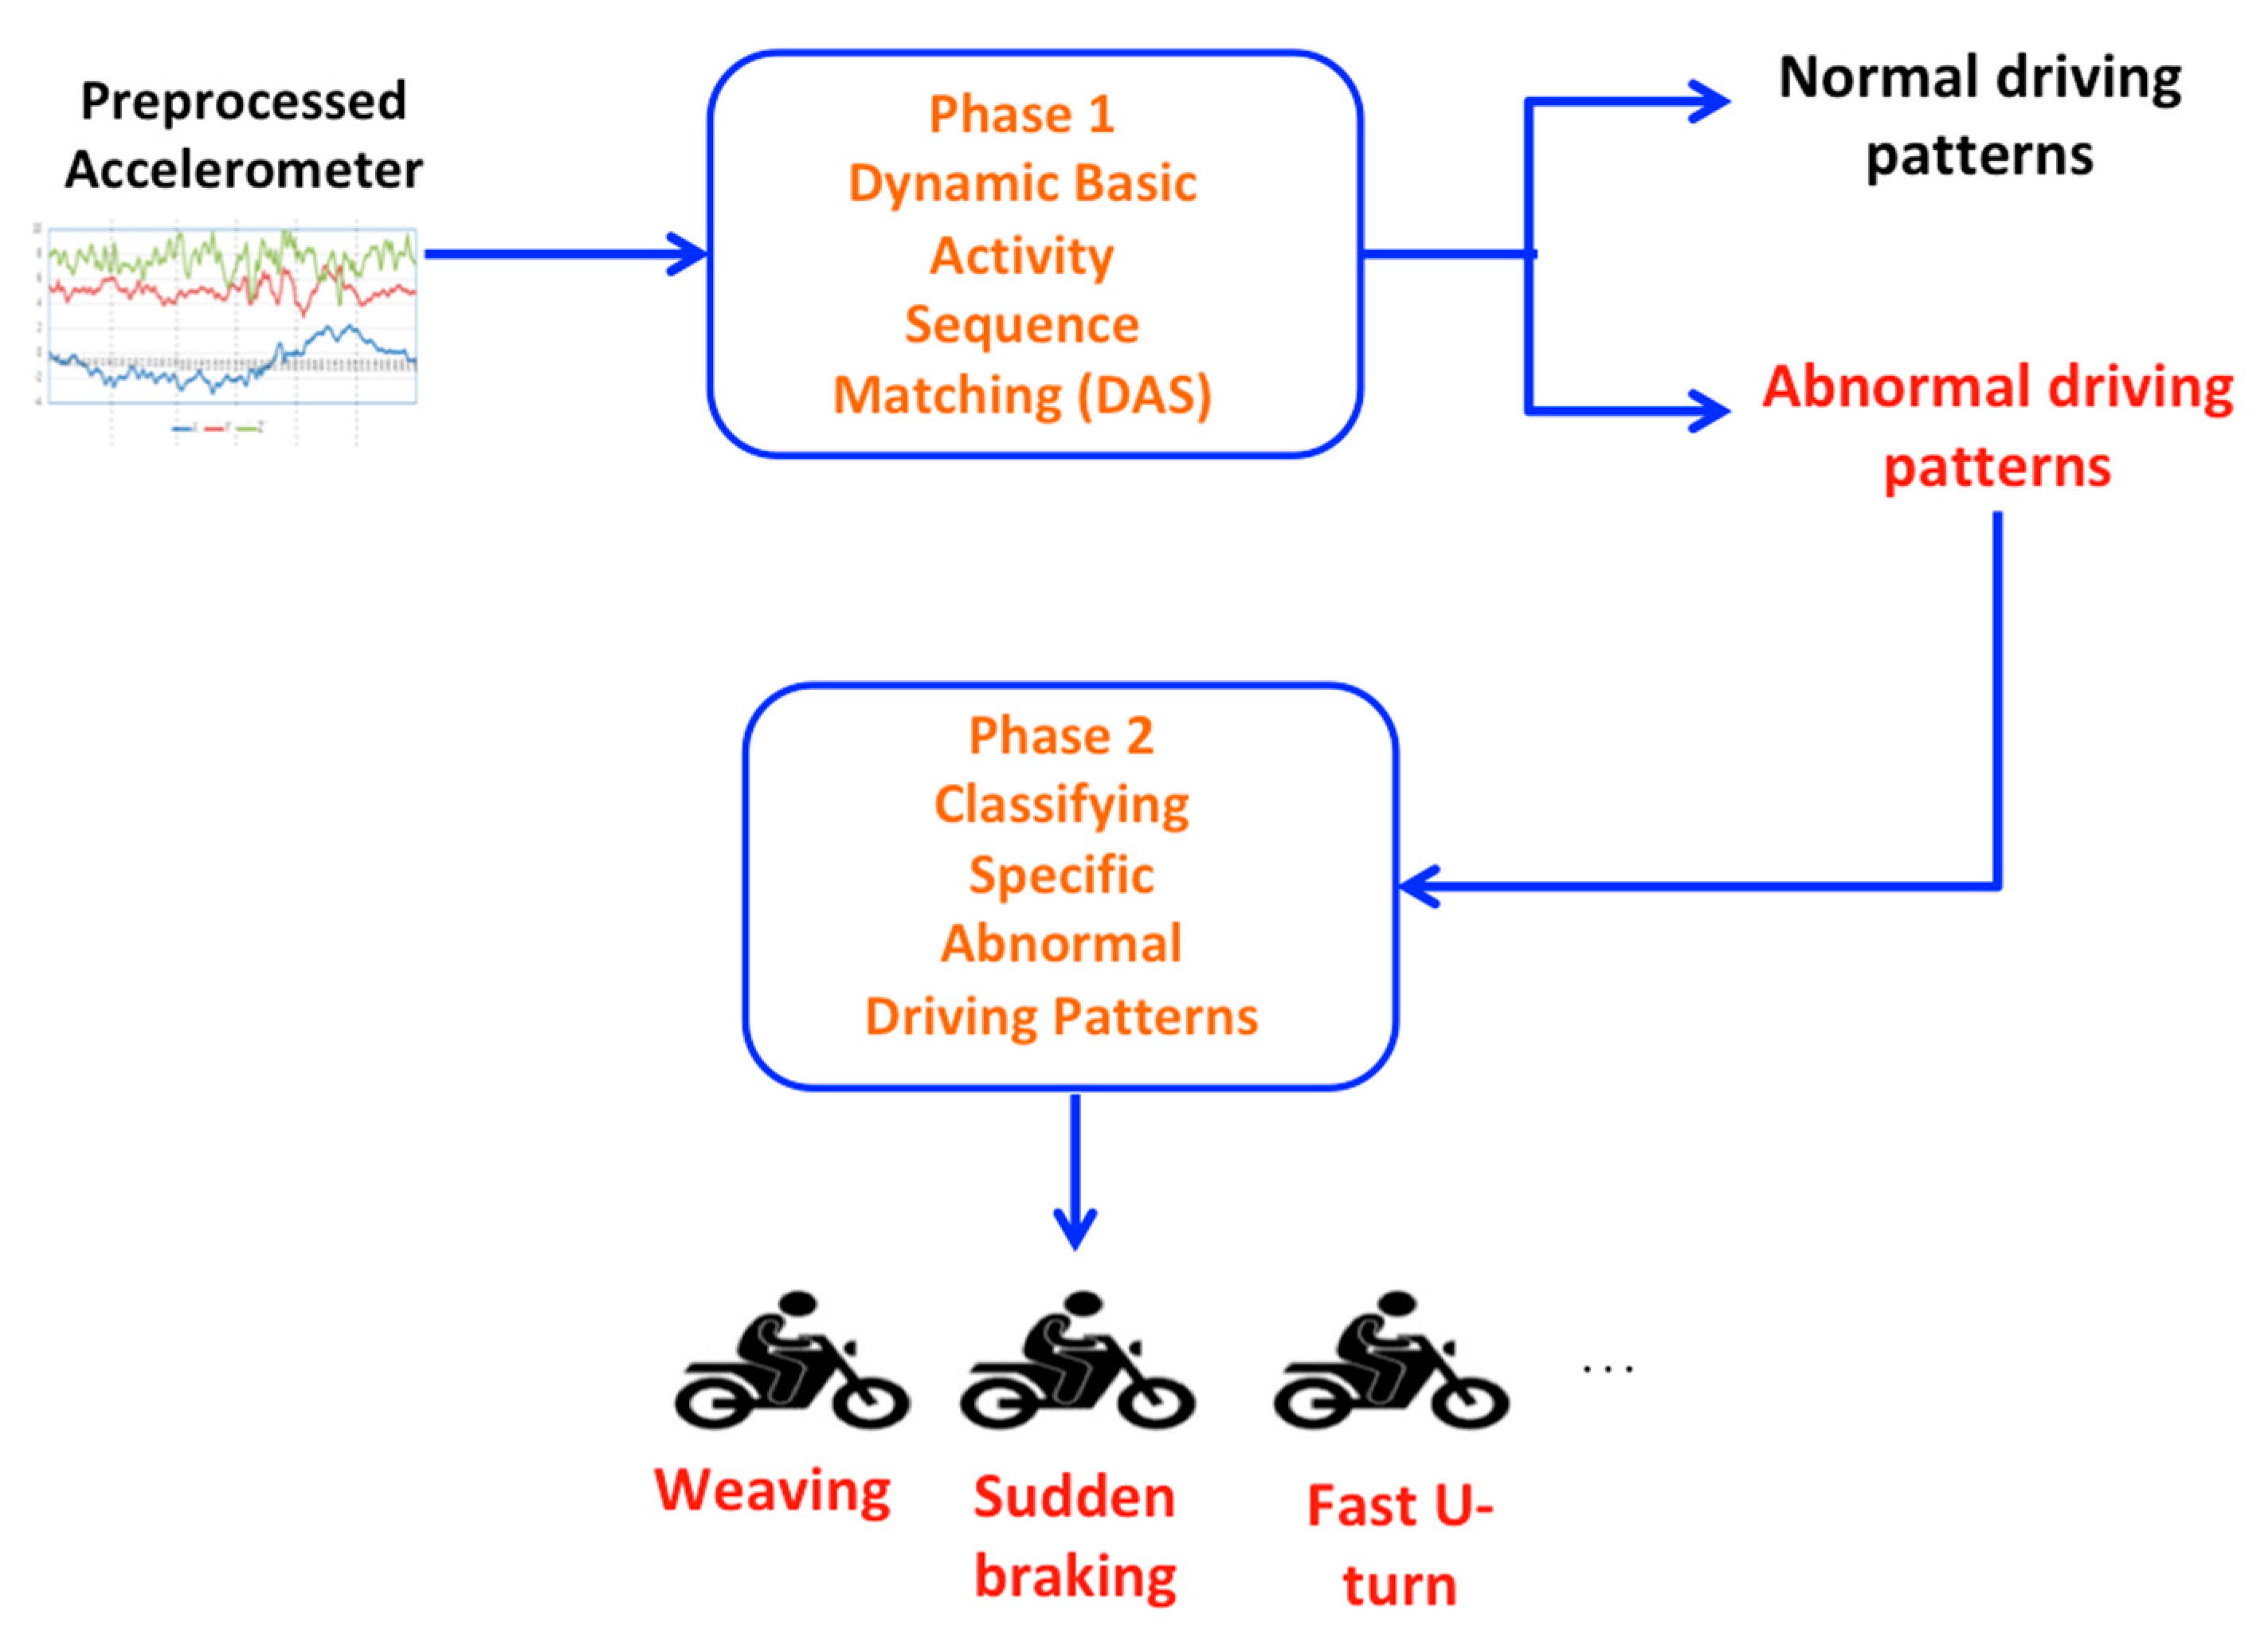
In order to increase the accuracy in detecting specific abnormal driving patterns, we propose a framework composing of two parts (Figure 1): in the first phase, the normal and abnormal driving patterns are distinguished relying on DAS. Then, in the second one, the detected abnormal patterns are further classified into various specific abnormal driving patterns—weaving, sudden braking, etc.—with the help of DAS. This framework allows us to achieve the highest overall accuracy of 97.94%.

3.1. Dynamic Basic Activity Sequence Matching

As aforementioned, the proposed method, namely dynamic basic activity sequence matching (DAS), for identifying generic abnormal patterns is a combination between the machine learning techniques and the threshold-based techniques. Note that the threshold values and certain parameters are induced from the training dataset in an iterative procedure. Hence, our proposed method is flexible and independent of driving context such vehicle mode and road condition.
Indeed, the proposed method contains two phases: the parameter optimization phase and the detection phase (Figure 2). In the parameter optimization phase, the sensor data, including accelerometer, gyroscope, and magnetometer, are collected and labeled corresponding to the normal or abnormal driving patterns. Then, such data are passed to activity detection module (ADM) (described in [23]) to transform into two sequences of basic driving activities—containing stop ( S ), going straight ( G ), turning left ( L ), turning right ( R )—corresponding to the long duration of activities in normal driving scenarios (representing by the window size W ) and the short duration of activities in abnormal driving scenarios (representing by the window size W ). Thus, each basic driving activity is detected by ADM in a sliding data window with a specific overlapping ratio that determines the overlap between two consecutive data windows.
Supposing that ADM, using the window size W seconds, transforms a sensor data segment into a sequence of basic activities A 1 , A 2 A n where A i { S , G , L , R } , i = 1, 2, …, n. In our previous work [23], it has been shown that in the normal driving scenarios, the optimal window size for accurately identifying basic activities of car and motorcycle drivers usually ranges from 4 to 6 s. Hence, in the later experiments, W will be tested in this range.
On the other hand, by observing, when an abnormal driving pattern occurs, the duration of its basic activities is often much shorter, i.e., 1 or 2 s. Hence, each basic activity A i inferred by ADM with the window size W seconds, can be alternatively considered as a set of k smaller data windows of the size W seconds where k = | W W | . Then, A i is further analyzed by ADM as a sequence of k smaller basic driving activities A i 1 , A i 2 A i k where A i j { S , G , L , R } , j = 1, 2, …, k. Let S i = { A i 1 , A i 2 A i k } be the set of sub-labels of A i .
The sub-label difference of the basic activity A i is computed as
d i = | D i | | S i |
where D i is the set of labels in the set S i that are different from the original activity label A i or D i = { x : x S i ,   x A i } .
In the other word, d i represents the basic signal change rate detected during the period of the activity A i . Thus, if d i > ε then A i should be considered as an abnormal driving pattern, where ε denotes the threshold value. We would investigate ε in the range of (0.5–0.9) as more than half of the sub-labels of an abnormal activity are different from the label of the original activity.
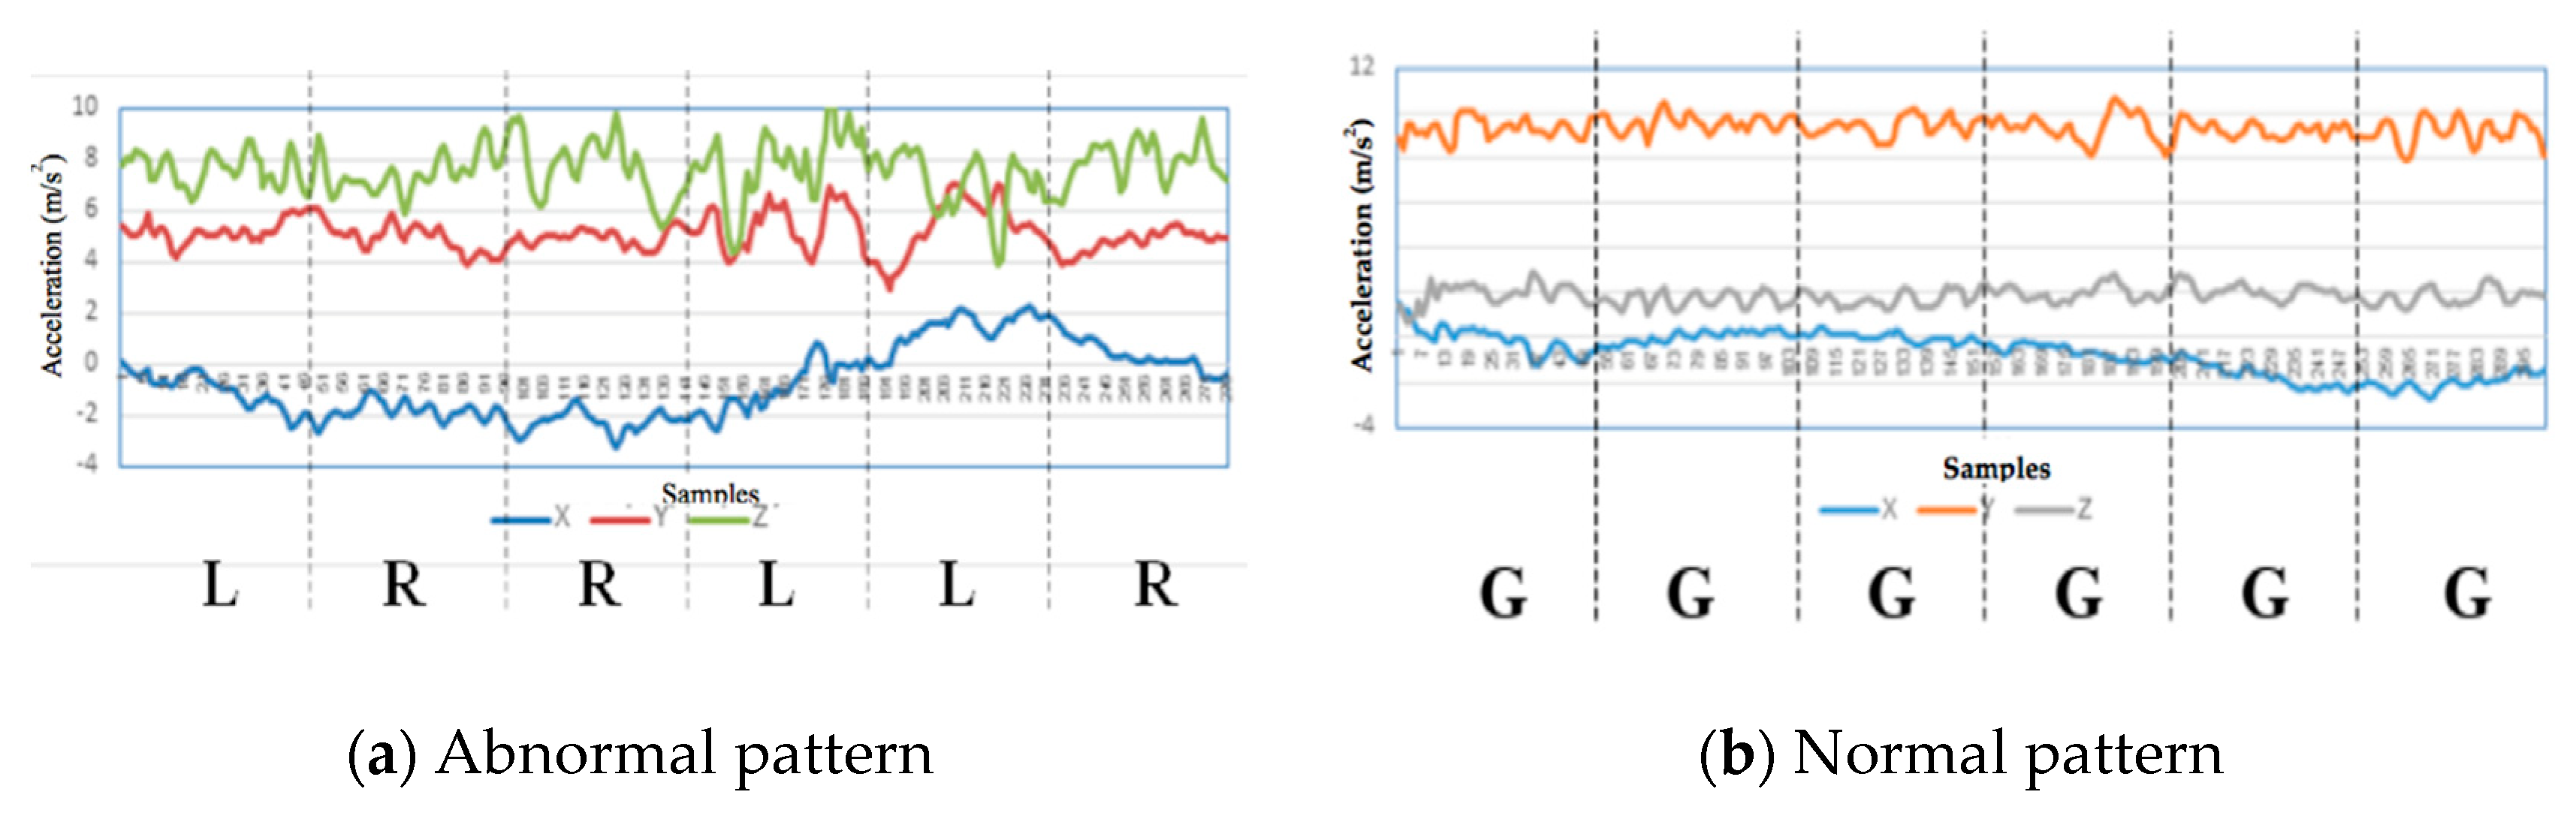
Figure 3a shows the acceleration patterns of abnormal driving pattern from a data window size of 6 s. The strong fluctuations on z and y components show the changes in direction or basic activities ( R and L ), which are recognized in smaller windows. For normal driving pattern, the acceleration patterns in the same window size as shown in Figure 3b are smoother in the ‘going straight’ mode.
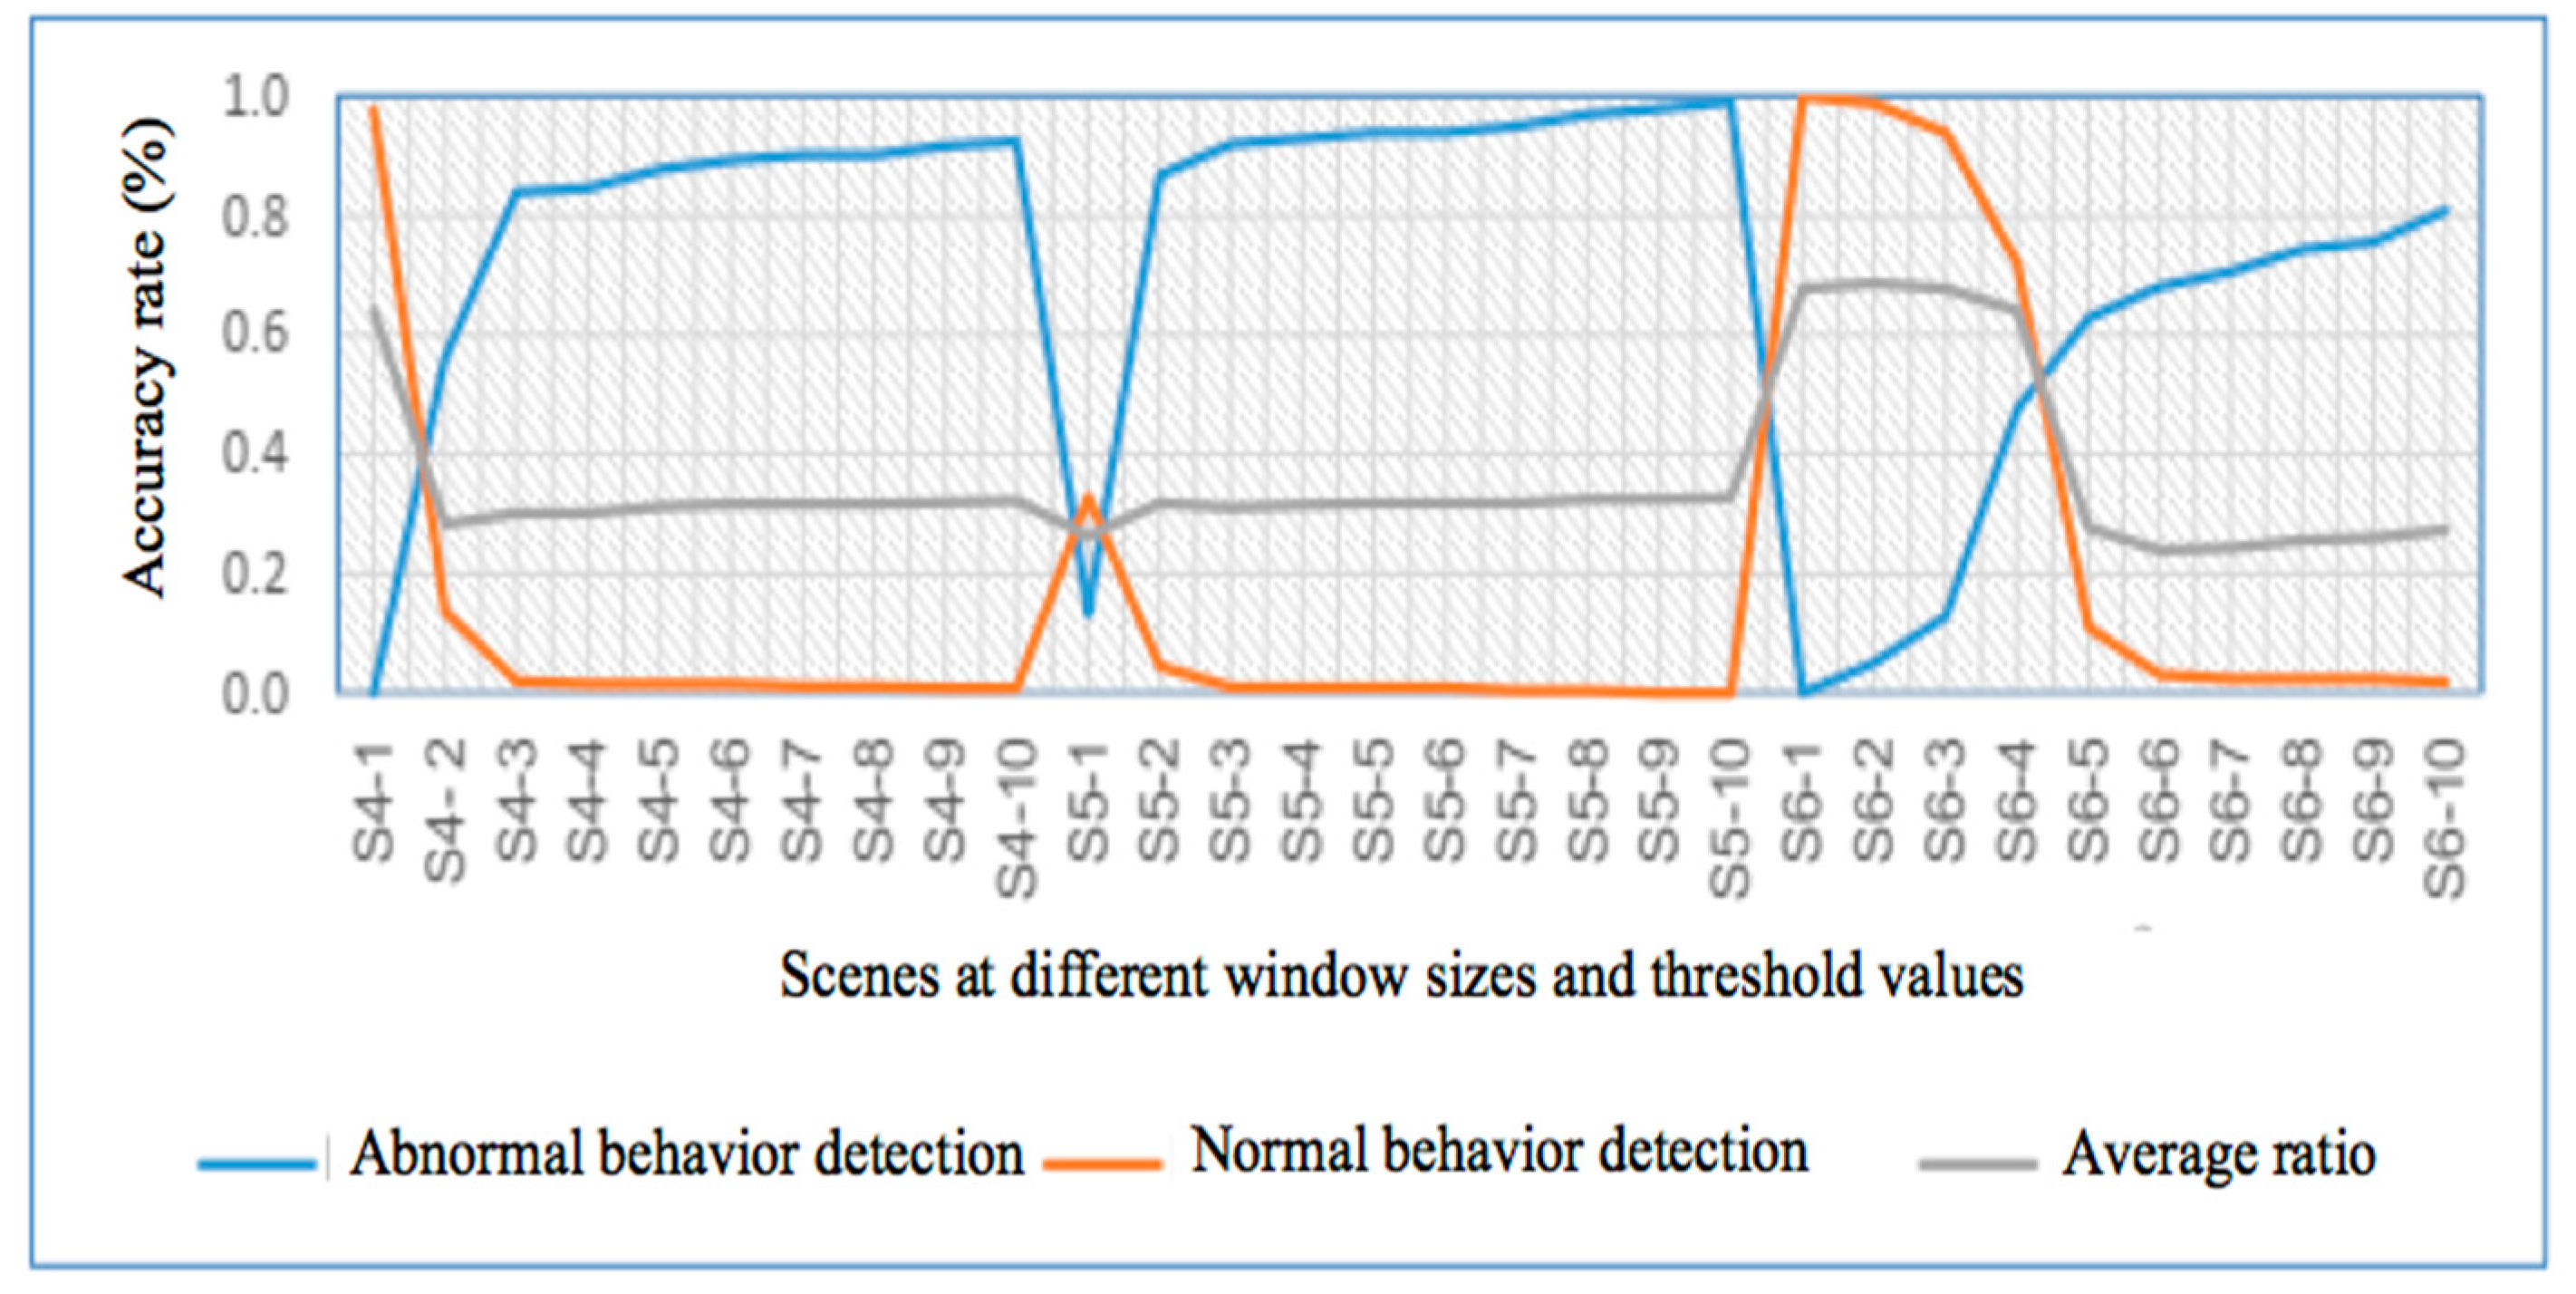
The prediction accuracy with the parameter set ( W , W , ε) is estimated on the training dataset. This procedure is repeatedly done with various combinations of W , W , and ε values in previously mentioned ranges. The parameter set ( W , W , ε) corresponding to the best prediction accuracy is the optimal one.
In the detection phase, the accelerometer data is collected and then preprocessed similar to that in the parameter optimization phase. The details of this phase are described in Figure 2: two simultaneous processes of driving activity detection at the different data window size W and W are implemented; the abnormal driving pattern is identified by using the optimal set of parameters ( W , W , ε) obtained from the parameter optimization phase. The procedure of detecting abnormal driving pattern is demonstrated in Algorithm 1, where A D M   ( W i ) is responsible for identifying the basic activity of the data window W i .
Algorithm 1: Abnormal Driving Pattern Detection ( W i ,   ε ,   k )
Input: A data window Wi, threshold value ε, k
Output: The pattern label (normal/abnormal) with respect to the data window Wi
 1.  A i A D M   ( W i )
 2. Splitting the data window W i into k smaller data windows W i j ,   j = 1 , 2 , , k
 3.  S i
 4.  D i
 5. For j = 1 to k do
 6.      A i j A D M   ( W i j )
 7.       S i { S i     A i j }
 8.    If A i j A i then
 9.       D i { D i     A i j }
 10.  d i | D i | | S i |
 11. If d i > ε then
 12.     l a b e l a b n o r m a l
 13. Else
 14.      l a b e l n o r m a l
 15. Return label

3.2. Specific Abnormal Driving Pattern Classification

As previously described, the abnormal driving patterns identified by DAS are then further classified into various specific abnormal patterns. Phase 2 is divided into the training and the monitoring modules. In the training part, time series data are first collected from accelerometer sensor and manually labeled with the corresponding pattern type—i.e., weaving, sudden braking, etc. Then, these data were calibrated by preprocessing techniques such as noise filtering, and windowing techniques. Next, representative information is extracted by exploring various categories of popular features, for example time domain features, and frequency domain features as shown in Figure 4. The time-domain features provide statistic metrics of driving activities in time domain; the frequency-domain features provide information about cyclic characteristics of activities; and Hjorth features can provide additional information of activities in both time and frequency domains. A set of formulas for computing such features is presented in [23]. The resulting feature vectors are then used to train the abnormal driving detection model. Finally, we use machine learning classifiers such as random forest (RF) and neural network (NN) for training dataset to select the most suitable classifier in the monitoring part.

4. Experiments

4.1. Environment and Data Collection

We develop an Android-based application for collecting the tri-axis data from accelerometers, gyroscopes, and magnetometers. This application is built on Android OS version 6.0 to 7.0. Using this application, we collected two datasets from eight volunteer subjects with the age of 22–40 years old. Each dataset contains the samples for normal or abnormal driving patterns. The sensor data is sampled at 50 Hz on different types of smartphones. The smartphones can be freely put into the shirt pockets or held in one hand of the subject or in the vehicle’s hold during travelling. In our study, we focus on identifying abnormal driving patterns of motorcyclists. The subjects used different types of motorbikes and simulated the abnormal scenarios, including weaving and sudden braking, in which travelers were driving with alternative or abrupt changes in the direction of vehicle at a high speed. For the safety of the subjects, the abnormal driving situations were carried out in carefully supervised conditions. Otherwise, the subjects traveled in usual driving conditions to collect the normal pattern data. Figure 5 shows the percentage of each type of driving pattern with total amount of 3240 samples.
Next, the collected datasets are used to evaluate the performance of three groups of techniques for distinguishing normal and abnormal driving patterns: the typical rule-based methods (DTW), the machine learning methods (RF and NN), and our proposed method (DAS). Based on the experimental results obtained from our previous work [23], the optimal window size for each basic activity should range from 4 to 6 s.
As aforementioned, the framework of specific abnormal driving pattern detection is carried out in two phases (Figure 1): the phase 1 is responsible for distinguishing the normal and abnormal driving patterns, then the detected abnormal ones are further classified with the help of RF and NN classifiers. In the later phase, the feature set is extracted from every sliding window of preprocessed accelerometer data. As described in detail in [23], the feature set combines the features computed on different preprocessed accelerometer components in different domains that consists of 34 time-domain features and seven frequency-domain features and 18 Hjorth features.
For evaluating the performance of each method, we use 10-fold cross validation and the accuracy metric. The accuracy of a classification is the proportion of correctly classified examples of a specific class out of all its examples [24].
A c c u r a c y = T P + T N T P + F P + T N + F N
where TP, TN, FP, and FN respectively represent the number of true positive, true negative, false positive, and false negative samples.

4.2. Result and Discussions

4.2.1. Normal and Abnormal Driving Pattern Detection

In this implementation, the collected dataset is randomly divided into training (V) and testing (T) datasets with 70% and 30% of data samples, respectively.
• Dynamic Time Wrapping
The performance of the DTW technique on the generic abnormal driving pattern detection is evaluated by computing the similarity between two time series patterns of acceleration data, i.e., the input one and the collected one labeled as normal or abnormal. In this work, the threshold value ε D T W and the window size are investigated in the range (1, 2–10) meter per second squared and (4, 5, 6) seconds respectively. The selection of threshold values is based on the range of the similarity values which is computed as the root sum squared error of acceleration data patterns in each window.
Figure 6 shows the prediction accuracy of the DTW model as a function of threshold value and the window size. Each scene Si – j is represented for the test case at the window size of i seconds and the threshold value of j. The results indicate the difficulty in selecting the optimal threshold to detect the abnormal driving pattern. The accuracy of detection depends much on the collected dataset that must be adequate and representative in various contexts. In the obtained results, the case S 6 4 is selected that corresponds to the window size of 6 s and the threshold value of 4. By using the selected values, the accuracy of abnormal driving pattern detection based on the DTW model is 61.6%.
• Machine Learning Method
In this method, the datasets are preprocessed and then transformed into sets of features before the classifiers such as RF and CNN (using Dl4jMlpClassifier package in Weka) are applied to recognize the abnormal patterns. The set of features that was used for activity recognition consists of 34 features in time domain and seven features in frequency domain and 18 Hjorth features [23]. In each classification algorithm, the Weka default setting was utilized. For evaluating the performance of each detection algorithm, 10-fold cross validation and the accuracy metric are applied.
Table 2 shows the performance of abnormal driving detection using two classifiers with various window sizes. The results show that the best performance of detection can be obtained with the window size of 6 s and the classifier CNN outperforms RF over all window sizes. The highest accuracy of 89.33% is obtained for the classifier CNN.
• Proposed Method
In our proposed method (DAS), the collected datasets are also split into the training set and the testing set that is similar to the above methods. Then, the training set is used in the parameter optimization phase to obtain the optimal parameter set ( W , W , ε). Finally, the testing set is used to evaluate the performance.
As aforementioned, the window size W , W , and the threshold value ε are investigated in the range of (4,5,6) seconds, (1,2) seconds, and (0.5,0.6,0.7,0.8,0.9) respectively. Note that DAS must rely on ADM (presented in [23]) that is responsible for identifying a basic activity ( S , G , L ) corresponding to each data segment with a specific overlapping ratio. The accuracy of the ADM on the training dataset is shown in Table 3 after using 10-fold cross validation. The results show the best performance of ADM can be achieved at the window size of 2 s with 50% overlapping ratio.
Next, we investigate the effect of threshold value ε and the window size W on the DAS performance given W = 2 s. Table 4 shows the accuracy of DAS on the training set. The results indicate that the performance is sensitive to the threshold and the best results are only attained in the widow size of 6 s with the threshold ε = {0.5, 0.6, 0.7}.
After the parameters of the detection model are properly selected, we estimate the abnormal driving detection model on the testing dataset. The performance of the driving pattern detection, shown in Table 5, presents the accuracy of detection in both abnormal and normal driving patterns. The best performance of 90.43% is attained at the threshold of 0.5, which is higher than the machine learning methods. Although the performance of the normal pattern detection for the threshold of 0.7 outperforms that of the abnormal pattern detection is much lower.
Figure 6, Table 2 and Table 4 indicate that the proposed method achieves the best accuracy in distinguishing normal and abnormal behaviors with the window size W = 6 s. Hence, this window size will be used in Phase 2 of DAS for identifying specific abnormal driving patterns.
• Discussion
Table 6 shows that choosing the appropriate window to recognize a behavior is very difficult task, especially for unusual actions due to the relatively short time it takes. The experimental results show that the DTW techniques obtained the lowest accuracy, while the proposed method achieved the highest one among three approaches. In addition, DTW techniques rely on the selected threshold to evaluate and classify abnormal behaviors so the results are quite sensitive to the fixed threshold. In contrast, the proposed method is flexible in estimating the threshold value from the training dataset. Hence, it is able to detect abnormal driving patterns that the system never meets in advance. It helps our system deal with the unknown potential dangers on the road.

4.2.2. Specific Abnormal Driving Pattern Detection

In fact, there are many kinds of abnormal driving patterns. We just use two abnormal driving patterns including weaving and sudden braking for evaluating the proposed method. The collected dataset is eliminated all normal driving samples and then divided into abnormal training (AV) and abnormal testing (AT) dataset with 70% and 30% of data samples, respectively. The size of data segments is 6 s. Note that 10-fold cross-validation is applied.
We also have applied three methods including DTW algorithm, the machine learning methods and the proposed technique to identify various types of abnormal behaviors. Experiments were performed on the same collected dataset to evaluate the performance of each technique.
• DTW Algorithm Based Approach
The DTW algorithm evaluates the accuracy of identification of abnormal behavior types by comparing the similarity between the behavioral patterns of abnormalities on the set AT and the samples on the set AV. All labeled data in AV and AT are cut with the window size W = 6 s. The 6-s data is then further divided into segments with window size W ’= 2 s based on the sliding window technique. Next, the featured data will be extracted according to the attribute set that is similar to the set used in the activity recognition model. Identification of behaviors with the window size W data obtains the corresponding set of behaviors. To do the same for the AT data set, we will obtain sequence of behaviors. We then applied the DTW algorithm to evaluate the accuracy when matching these two data sets. Parameters to classify abnormal behaviors are selected from the experiments on S i j with i = 6 s and threshold j = 4. The results obtained with this experiment are shown in Table 7 below.
• Machine Learning Methods
In this experiment, we also extracted data according to the same attribute set as above mentioned with data window size W = 6 s. Next, a number of classification algorithms are used including two RF algorithms and CNN (Dl4jMlpClassifier). Experimental results on the data set AT are also shown in Table 7 below.
• Classifying Abnormal Patterns of Driving Behaviors Based on DAS
We also applied the DAS to classify the specific abnormal behaviors. The parameter set ( W = 6, W = 2, ε = 0.5) was selected to evaluate the performance of the proposal on the dataset. The experimental results achieved better performance than line based methods (Table 7).
• Discussion
Table 7 shows that RF is able to detect weaving patterns with 100% accuracy. However, its performance drops to 93% in identifying sudden braking patterns. These results indicate that the performance of some machine-learning techniques might be quite sensitive. Indeed, correctly collecting abnormal driving patterns is a difficult task. The DTW returns the better average result, comparing to two machine-learning methods. Overall, the proposed method achieves the highest average performance.

5. Conclusions

We proposed a novel method, namely DAS, for detecting abnormal driving patterns relying on analyzing sensor data into a sequence of basic driving activities. Indeed, DAS is a combination of the threshold methods and the machine leaning methods. However, the threshold value and other parameters are iteratively induced from the collected datasets. They are thus independent of driving contexts, such as vehicle mode and road conditions. The experimental results indicate DAS outperforms over DTW and the two popular machine-learning methods—RF and NN. Furthermore, the proposed framework for detecting specific abnormal driving patterns—composed of two detection phases—obtains the relatively high overall prediction accuracy of 97.94%. The experiments also illustrate that for distinguishing normal and abnormal driving patterns problem, the longer window size leads to the higher prediction accuracy, as the duration of each basic activity is often long in the normal driving scenarios. In contrast, for specific abnormal driving pattern detection problem, the shorter window size leads to the higher prediction accuracy, as the duration of each basic activity is quite short in the abnormal driving scenarios. Moreover, our experiments also indicate that the performances of some machine-learning methods, such as RF, are quite sensitive.

Author Contributions

T.-H.N., D.-N.L., D.-N.N., and H.-N.N. conceived and designed the algorithms and the experiments; D.-N.L. performed the experiments; T.-H.N., D.-N.N., and H.-N.N. analyzed the data; T.-H.N., D.-N.L., D.-N.N., and H.-N.N. wrote the paper. All authors have read and agreed to the published version of the manuscript.

Funding

This research was funded by Vietnam National University, Hanoi (VNU) under the project no. QG 17.39

Conflicts of Interest

The authors declare no conflict of interest.

References

  1. World Health Organization. Global Status Report on Road Safety 2018. Available online: https://www.who.int/violence_injury_prevention/road_safety_status/2018/en/ (accessed on 15 September 2019).
  2. Van Ly, M.; Martin, S.; Trivedi, M.M. Driver classification and driving style recognition using inertial sensors. In Proceedings of the 2013 IEEE Intelligent Vehicles Symposium, Gold Coast, Australia, 23–26 June 2013; pp. 1040–1045. [Google Scholar]
  3. Aljaafreh, A.; Alshabatat, N.; Al-Din, M.S.N. Driving style recognition using fuzzy logic. In Proceedings of the 2012 IEEE International Conference on Vehicular Electronics and Safety (ICVES), Istanbul, Turkey, 24–27 July 2012; pp. 460–463. [Google Scholar]
  4. Al-Sultan, S.; Al-Bayatti, A.H.; Zedan, H. Context-Aware Driver Behavior Detection System in Intelligent Transportation Systems. IEEE Trans. Veh. Technol. 2013, 62, 4264–4275. [Google Scholar] [CrossRef]
  5. Bergasa, L.M.; Almería, D.; Almazán, J.; Yebes, J.J.; Arroyo, R. Drivesafe: An app for alerting inattentive drivers and scoring driving behaviors. In Proceedings of the 2014 IEEE Intelligent Vehicles Symposium Proceedings, Dearborn, MI, USA, 8–11 June 2014; pp. 240–245. [Google Scholar]
  6. Dai, J.; Teng, J.; Bai, X.; Shen, Z.; Xuan, D. Mobile phone based drunk driving detection. In Proceedings of the 2010 4th International Conference on Pervasive Computing Technologies for Healthcare, Munich, Germany, 22–25 March 2010. [Google Scholar]
  7. Castignani, G.; Derrmann, T.; Frank, R.; Engel, T. Driver Behavior Profiling Using Smartphones: A Low-Cost Platform for Driver Monitoring. IEEE Intell. Transp. Syst. Mag. 2015, 7, 91–102. [Google Scholar] [CrossRef]
  8. Johnson, D.A.; Trivedi, M.M. Driving style recognition using a smartphone as a sensor platform. In Proceedings of the 2011 14th International IEEE Conference on Intelligent Transportation Systems (ITSC), Washington, DC, USA, 5–7 October 2011; pp. 1609–1615. [Google Scholar]
  9. Fazeen, M.; Gozick, B.; Dantu, R.; Bhukhiya, M.; González, M.C. Safe Driving Using Mobile Phones. IEEE Trans. Intell. Transp. Syst. 2012, 13, 1462–1468. [Google Scholar] [CrossRef]
  10. Eren, H.; Makinist, S.; Akin, E.; Yilmaz, A. Estimating driving behavior by a smartphone. In Proceedings of the 2012 IEEE Intelligent Vehicles Symposium, Alcala de Henares, Spain, 3–7 June 2012. [Google Scholar]
  11. Chen, Z.; Yu, J.; Zhu, Y.; Chen, Y.; Li, M. D3: Abnormal Driving Behaviors Detection and Identification using Smartphone Sensors. In Proceedings of the 12th Annual IEEE International Conference on Sensing, Communication, and Networking (SECON), Seattle, WA, USA, 22–25 June 2015; pp. 524–532. [Google Scholar]
  12. Lu, D.-N.; Nguyen, T.-T.; Ngo, T.-T.-T.; Nguyen, T.-H.; Nguyen, H.-N. Mobile Online Activity Recognition System Based on Smartphone Sensors. In Advances in Information and Communication Technology; Akagi, M., Nguyen, T.-T., Eds.; Springer International Publishing: Cham, Switzerland, 2016; Volume 538, pp. 357–366. [Google Scholar]
  13. Lu, D.-N.; Ngo, T.-T.-T.; Nguyen, D.-N.; Nguyen, T.-H.; Nguyen, H.-N. A Novel Mobile Online Vehicle Status Awareness Method Using Smartphone Sensors. In Information Science and Applications 2017; Kim, K., Joukov, N., Eds.; Springer: Singapore, 2017; Volume 424, pp. 30–37. [Google Scholar]
  14. Lu, D.-N.; Tran, T.-B.; Nguyen, D.-N.; Nguyen, T.-H.; Nguyen, H.-N. Abnormal Behavior Detection Based on Smartphone Sensors. In Context-Aware Systems and Applications, and Nature of Computation and Communication; Vinh, P.C., Cuong, N.H.H., Eds.; Springer: Cham, Switzerland, 2017; Volume 217, pp. 195–204. [Google Scholar]
  15. Lee, C.; Saccomanno, F.; Hellinga, B.; Information, R. Analysis of Crash Precursors on Instrumented Freeways. Transp. Res. Rec. J. Transp. Res. Board 2002, 1784, 1–8. [Google Scholar] [CrossRef]
  16. Zaldivar, J.; Calafate, C.T.; Cano, J.C.; Manzoni, P. Providing accident detection in vehicular networks through OBD-II devices and Android-based smartphones. In Proceedings of the 2011 IEEE 36th Conference on Local Computer Networks, Bonn, Germany, 4–7 October 2011; pp. 813–819. [Google Scholar]
  17. Masry, N.E.; Passant, E.-D.; Ashram, M.E.; Atia, A.; Tanaka, J. Amelio-rater: Detection and Classification of Driving Abnormal Behaviours for Automated Ratings and Real-Time Monitoring. In Proceedings of the 2018 13th International Conference on Computer Engineering and Systems (ICCES), Cairo, Egypt, 18–19 December 2018. [Google Scholar]
  18. Engelbrecht, J.; Booysen, M.J.; van Rooyen, G.-J.; Bruwer, F.J. Performance comparison of dynamic time warping (DTW) and a maximum likelihood (ML) classifier in measuring driver behavior with smartphones. In Proceedings of the 2015 IEEE Symposium Series on Computational Intelligence, Cape Town, South Africa, 7–10 December 2015. [Google Scholar]
  19. Yu, J.; Chen, Z.; Zhu, Y.; Chen, Y.; Kong, L.; Li, M. Fine-grained abnormal driving behaviors detection and identification with smartphones. IEEE Trans. Mob. Comput. 2016, 16, 2198–2212. [Google Scholar] [CrossRef]
  20. Li, F.; Zhang, H.; Che, H.; Qiu, X. Dangerous driving behavior detection using smartphone sensors. In Proceedings of the 2016 IEEE 19th International Conference on Intelligent Transportation Systems (ITSC), Rio de Janeiro, Brazil, 1–4 November 2016; pp. 1902–1907. [Google Scholar]
  21. Júnior, J.F.; Carvalho, E.; Ferreira, B.V.; de Souza, C.; Suhara, Y.; Pentland, A.; Pessin, G. Driver behavior profiling: An investigation with different smartphone sensors and machine learning. PLoS ONE 2017, 12, e0174959. [Google Scholar]
  22. Carlos, M.R.; Gonzalez, L.C.; Wahlstrom, J.; Ramirez, G.; Martinez, F.; Runger, G. How Smartphone Accelerometers Reveal Aggressive Driving Behavior?--The Key Is the Representation. IEEE Trans. Intell. Transp. Syst. 2019, 1–11. [Google Scholar] [CrossRef]
  23. Lu, D.-N.; Nguyen, D.-N.; Nguyen, T.-H.; Nguyen, H.-N. Vehicle Mode and Driving Activity Detection Based on Analyzing Sensor Data of Smartphones. Sensors 2018, 18, 1036. [Google Scholar] [CrossRef] [PubMed] [Green Version]
  24. Metz, C.E. Basic principles of ROC analysis. Semin. Nucl. Med. 1978, 8, 283–298. [Google Scholar] [CrossRef]
Figure 1. Proposed framework for detecting specific abnormal driving patterns.
Electronics 09 00217 g001
Figure 2. Proposed framework of the abnormal driving pattern detection.
Electronics 09 00217 g002
Figure 3. Typical abnormal/normal driving pattern of tri-axis accelerometer data of a basic activity with the duration of 6 s.
Electronics 09 00217 g003
Figure 4. Feature extraction process combines the features computed in different domains.
Electronics 09 00217 g004
Figure 5. Collected dataset.
Electronics 09 00217 g005
Figure 6. Results of pattern detection model using DTW method. S i j denotes the test case at the window size of i seconds and the threshold value of j .
Electronics 09 00217 g006
Table 1. Summary of recent researches on abnormal driving pattern detection
StudiesDriving EventsSmartphone DataMethodsFeaturesCoordinate ReorientationPrediction Accuracy
Masry et al. [17]Sudden lane change, single weave, meanderingAccelerometer, gyroscope, GPSDTW, SVM250 Euclidean and Manhattan distancesYesAccuracy: 95%
Engelbrechtt et al. [18]Aggressive/safe drivingAccelerometer, gyroscope, GPSDTW, ML90 time domain and frequency domain featuresyesAccuracy: 91.5%
Lu et al. [14]Stopping, moving, deceleration, acceleration, turning left, turning right, U-turnAccelerometer, gyroscope, magnetometerRF, SVM, KNN, NB, ANN21 time domain and frequency domain featuresYesAccuracy: 86.71%
Li et al. [20]Abnormal speed changing, steering, weaving, operating smartphone during drivingAccelerometer, gyroscopethreshold detectionReal and calculated yaw, pitch, roll angles, accelerations, angular rates, slopeYesTP > 90%
Yu et al. [19]Weaving, swerving, side-slipping, fast u-turn, turning with a wide radius, sudden brakingAccelerometer, orientation sensorSVM, NN152 time-domain featuresYesAccuracy: 96.88%
Júnior et al. [21]Aggressive braking, aggressive acceleration, aggressive left/right turn, aggressive left/right lane changing, non-aggressive eventsAccelerometer, magnetometer, gyroscope, linear accelerationANN, SVM, RF, BN60 time-domain featuressmartphones are fixedAUC: 0.980-0.999
Carlos et al. [22]Swerving left/right, sudden braking/accelerationAccelerometer, gyroscope, magnetometerRF, NB, NNBag of words (2–250 codewords)yesAccuracy: 96.88%
TP: true positive; AUC: area under the curve.
Table 2. Performance of abnormal driving detection using machine-learning methods
Window SizeRFCNN
4 s80.97%89.13%
5 s81.12%86.57%
6 s81.19%89.33%
Table 3. Performance of basic driving activity detection with respect to different small window sizes, overlapping ratios on the training dataset
Window Size1 s2 s
Overlapping75%50%25%75%50%25%
Accuracy67.58%59.79%64.40%84.40%84.93%83.42%
Table 4. Prediction accuracy of the proposed method with respect to various window sizes and threshold values on the training dataset
W\ε0.50.60.70.80.9
4 s39%25%14%11%5%
5 s39%29%17%11%4%
6 s100%100%94%73%39%
Table 5. Prediction accuracy of the proposed method on the testing dataset
(W, ε)Abnormal PatternNormal PatternAverage
(6, 0.5)90.86%90.00%90.43%
(6, 0.6)80.00%90.81%85.41%
(6, 0.7)66.28%95.90%81.09%
Table 6. Prediction accuracy for identifying abnormal driving patterns
MethodsAccuracy
Dynamic Time Wrapping (DTW)61.6%.
Machine LearningRandom Forest (RF)81.19%
Convolution Neural Network (CNN)89.33%
Propose Method (DAS)90.43%
Table 7. Prediction accuracy for identifying various specific abnormal driving patterns
MethodsWeavingSudden BrakingAverage
Dynamic Time Wrapping (DTW)97.65%96.45%97.05%
Machine LearningRandom Forest (RF)100%93%96.50%
Convolution Neural Network (CNN)96.20%97.70%96.95%
Proposed Method98.04%97.83%97.94%

