Article

Research of HRV as a Measure of Mental Workload in Human and Dual-Arm Robot Interaction

1
State Key Laboratory of Robotics, Shenyang Institute of Automation, Chinese Academy of Sciences, Shenyang 110016, China
2
Institutes for Robotics and Intelligent Manufacturing, Chinese Academy of Sciences, Shenyang 110169, China
3
University of Chinese Academy of Sciences, Beijing 100049, China
*
Author to whom correspondence should be addressed.
Electronics 2020, 9(12), 2174; https://doi.org/10.3390/electronics9122174
Submission received: 3 November 2020 / Revised: 12 December 2020 / Accepted: 13 December 2020 / Published: 17 December 2020
(This article belongs to the Special Issue Human Computer Interaction for Intelligent Systems)

Abstract

:
Robots instead of humans work in unstructured environments, expanding the scope of human work. The interactions between humans and robots are indirect through operating terminals. The mental workloads of human increase with the lack of direct perception to the real scenes. Thus, mental workload assessment is important, which could effectively avoid serious accidents caused by mental overloading. In this paper, the operating object is a dual-arm robot. The classification of operator’s mental workload is studied by using the heart rate variability (HRV) signal. First, two kinds of electrocardiogram (ECG) signals are collected from six subjects who performed tasks or maintained a relaxed state. Then, HRV data is obtained from ECG signals and 20 kinds of HRV features are extracted. Last, six different classifications are used for mental workload classification. Using each subject’s HRV signal to train the model, the subject’s mental workload is classified. Average classification accuracy of 98.77% is obtained using the K-Nearest Neighbor (KNN) method. By using the HRV signal of five subjects for training and that of one subject for testing with the Gentle Boost (GB) method, the highest average classification accuracy (80.56%) is obtained. This study has implications for the analysis of HRV signals characteristic of mental workload in different subjects, which could improve operators’ well-being and safety in the human-robot interaction process.

1. Introduction

In unstructured environments, robots replace humans to perform some complex tasks, which expends the scope of human work [1,2]. The dual-arm robot, a kind of typical robot, has been widely studied [3,4]. Dual-arm robots can simulate the movement of two arms of human, making an important step towards humanoid operation. Studies based on dual-arm robots have always moved towards the operation of humanization. In this paper, a dual-arm robot is studied as the operating object, which is controlled by a wearable exoskeleton controller in master-slave mode. The dual-arm robot’s performance is not only limited by the performance of the system, but also related to the current state of the operator closely. Sometimes, a large mental workload can still lead to improper or wrong operation even when the system is stable and the operator has a good sense of presence. Therefore, it is crucial to monitor the mental workload of the operator. On this basis, the human-robot task assignment could be dynamically adjusted based on the mental workload. This kind of research improves human-robot system performance and safety and refine the subjective experience of operators. Therefore, it is of great theoretical significance and practical value to study the mental workload measurement of the operators of dual-arm robots.
In recent years, mental workload has gradually become a hot research topic. The concept was first proposed in the 1940s [5]; its purpose was to optimize the human–machine system. There are various definitions of mental workload; however, the primary content of the definitions is the relationship between ‘requirement of resources for tasks’ and ‘ability of the operator to provide those resources’ [6]. In reality, the traditional methods of evaluating mental workload are mainly subjective. However, the main defect of the subjective scale method is the lack of objectivity and continuity of measurement. Undeniably, the evaluation of mental workload by physiological signals, such as electroencephalogram (EEG) [7,8], respiration rate (RR) [9], blood pressure (BP) [10], skin temperature (ST) [11], galvanic skin response (GSR) [12], blink frequency (BF) [13], and heart rate variability (HRV) [14], has achieved some progress. Although more effective information can be obtained by using multi-sensors fusion to analyze mental workload, it causes great inconvenience to operators because they have to use a large number of electrodes, sensor units, and so on. HRV is the physiological phenomenon of fluctuation in the time interval between heartbeats. It is the most convenient and common physiological measurement method for mental workload. Thus, in this paper, HRV is studied as a measure of mental workload in human and dual-arm robot interaction.
The traditional mental workload measuring method using HRV is considered to be on the basis of time domain and frequency domain features. About the time domain features, the better performing ones are the standard deviation of the R-R interval (SDNN), the root mean square of the successive R-R interval difference (RMSSD), the proportion of the beats with a successive R-R interval difference exceeding 50 ms (PNN50), and the sum of all R-R intervals divided by the maximum density distribution (HRVTi) [15,16]. Moreover, in the frequency domain analysis method, the HRV signal is always decomposed into multi-frequency components. In fact, the power spectral of each frequency component and the sum of power spectral of all frequency bands are regarded as features for mental workload measurement. In detail, these features include power spectrum of very low frequency band (VLF: 0.003–0.040 Hz), low frequency band (LF: 0.04–0.15 Hz), high frequency band (HF: 0.15–0.4 Hz), and total power spectrum (TP: ≤ 0.4 Hz) [17,18]. However, the time domain indices cannot show the time-varying characteristics of HRV. Thus, it is limited for the response to the autonomic nervous system. Meanwhile, the frequency domain indices can only provide global frequency information, lacking in coupling information between local and different frequencies. A human body can be abstracted into a complex nonlinear system. Nevertheless, the time domain and frequency domain features of HRV signals are unable to express the nonlinear characteristics of HRV signals completely [19,20]. At present, relevant studies have used nonlinear analysis methods to analyze HRV signals for mental workload. Castaldo et al. [21] extracted the nonlinear features of HRV signals to achieve psychological load measurement analysis while playing games. Specifically, it includes Poincare plot, de-trending fluctuation analysis, recurrence plot, sample entropy, approximate entropy, and Shannon entropy, among others. Tiwari et al. [22] proposed an improved multi-scale permutation entropy analysis method to measure and analyze HRV signals. Finally, they accomplish the classification of mental workload in the process of MATB. Delliaux et al. [23] analyzed a variety of nonlinear features of HRV signals through statistical analysis.
However, there is no research on HRV as a measure of mental workload in human and dual-arm robot interaction. In this paper, HRV is studied as a measure of mental workload in human and dual-arm robot interaction. The main contributions of this work are summarized as follows: First, this paper extracts time domain features, frequency domain features, and nonlinear features of HRV signals, exploring the hidden layer of neural activity information deeply. Then, the mapping relationship between the HRV signal and mental workload is analyzed. In addition, models trained with the same subject data and across different subjects are researched, respectively.
The rest of the paper is structured as follows: In Section 2, the process of ECG data acquisition is described and the HRV signal extraction algorithm is presented. Additionally, the features extraction method is presented. Section 3 shows the experimental results, which reflect the statistical analysis of features and mental workload measures. The discussion of results are present in Section 4. In Section 5, the conclusion of this paper is presented.

2. Data and Methods

Firstly, the process of mental workload recognition in this paper is presented and shown in Figure 1. Then, the subjects that participated in the data acquisition are introduced, respectively. Subsequently, the data acquisition process is introduced and the features are extracted. Finally, the mental workload identification results based on the extraction features are presented.

2.1. Participants

Subjects were, on average, 25.16 years old, and the study employed a total of six male participants, as shown in Table 1. They were selected from the Shenyang Institute of Automation, Chinese Academy of Sciences. They have normal or corrected vision, right-handedness, good health, and no heart, cerebrovascular, or nervous system problems. All participants were informed of the experiment, and participants were asked to wear loose and comfortable clothing.

2.2. Data Acquisition and Processing

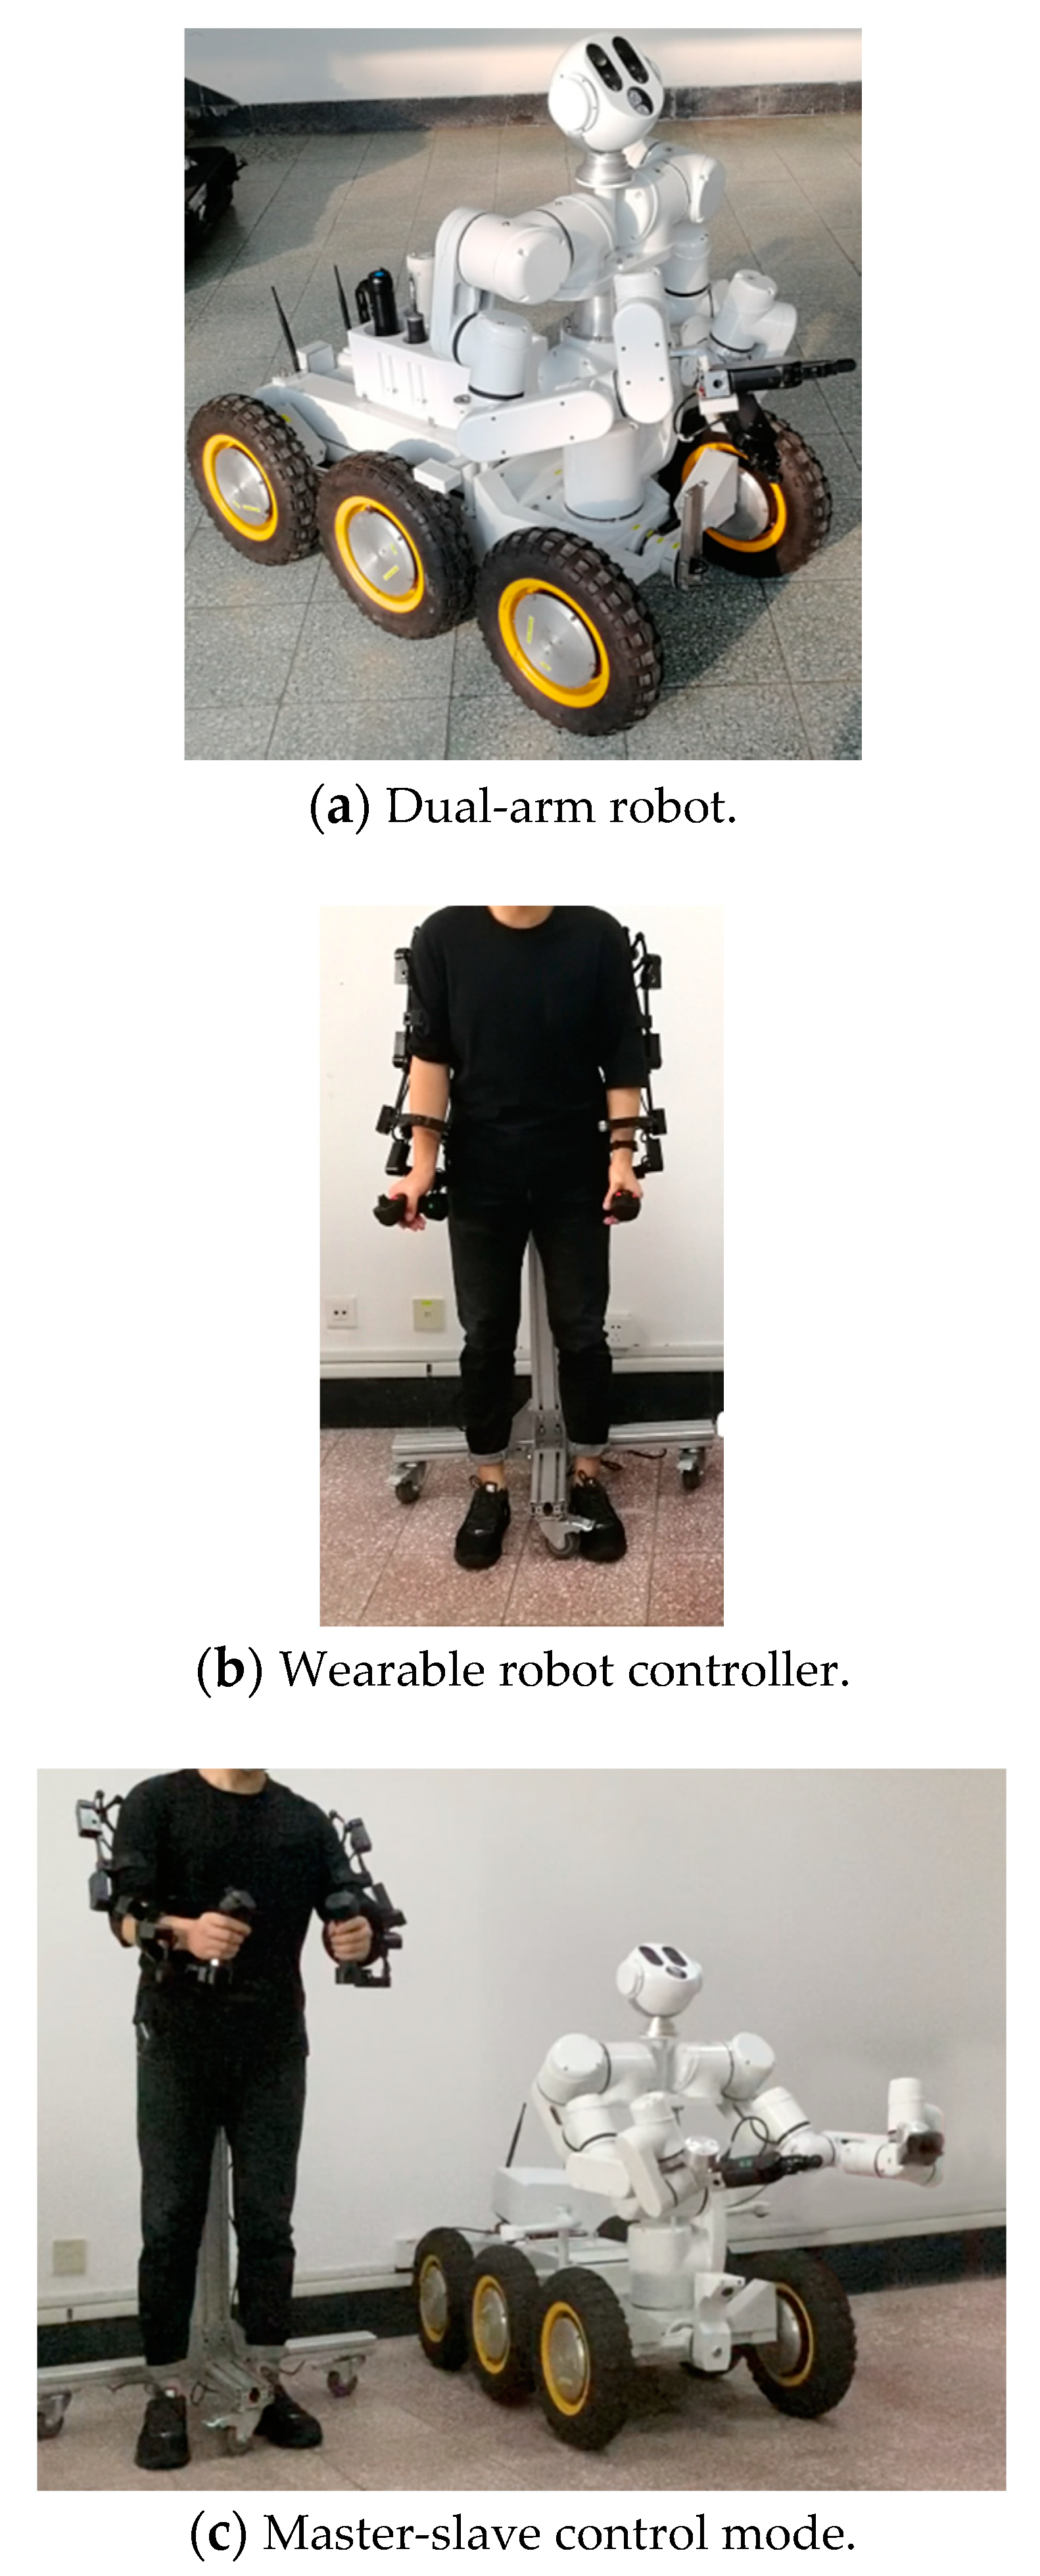
The dual-arm robot utilized in this paper is shown in the Figure 2a. The robot has six independent driving wheels. Therefore, it can adapt to various complex topographic structures. Moreover, the robot is equipped with double arms, both with seven degrees of freedom, to imitate the number and structure of a human. The end of the arm is an open-close clamp, which can be used for precision operation. At the same time, the robot is equipped with a binocular camera, which can be used to enhance the operator’s sense of presence. In order to facilitate operation, the manipulator of the dual-arm robot adopts a wearable controller, which is shown in Figure 2b. Obviously, the wearable controller has the same structure as arms of the dual-arm robot. Between the wearable controller and the dual-arm robot, the master-slave control mode is used, as shown in Figure 2c.
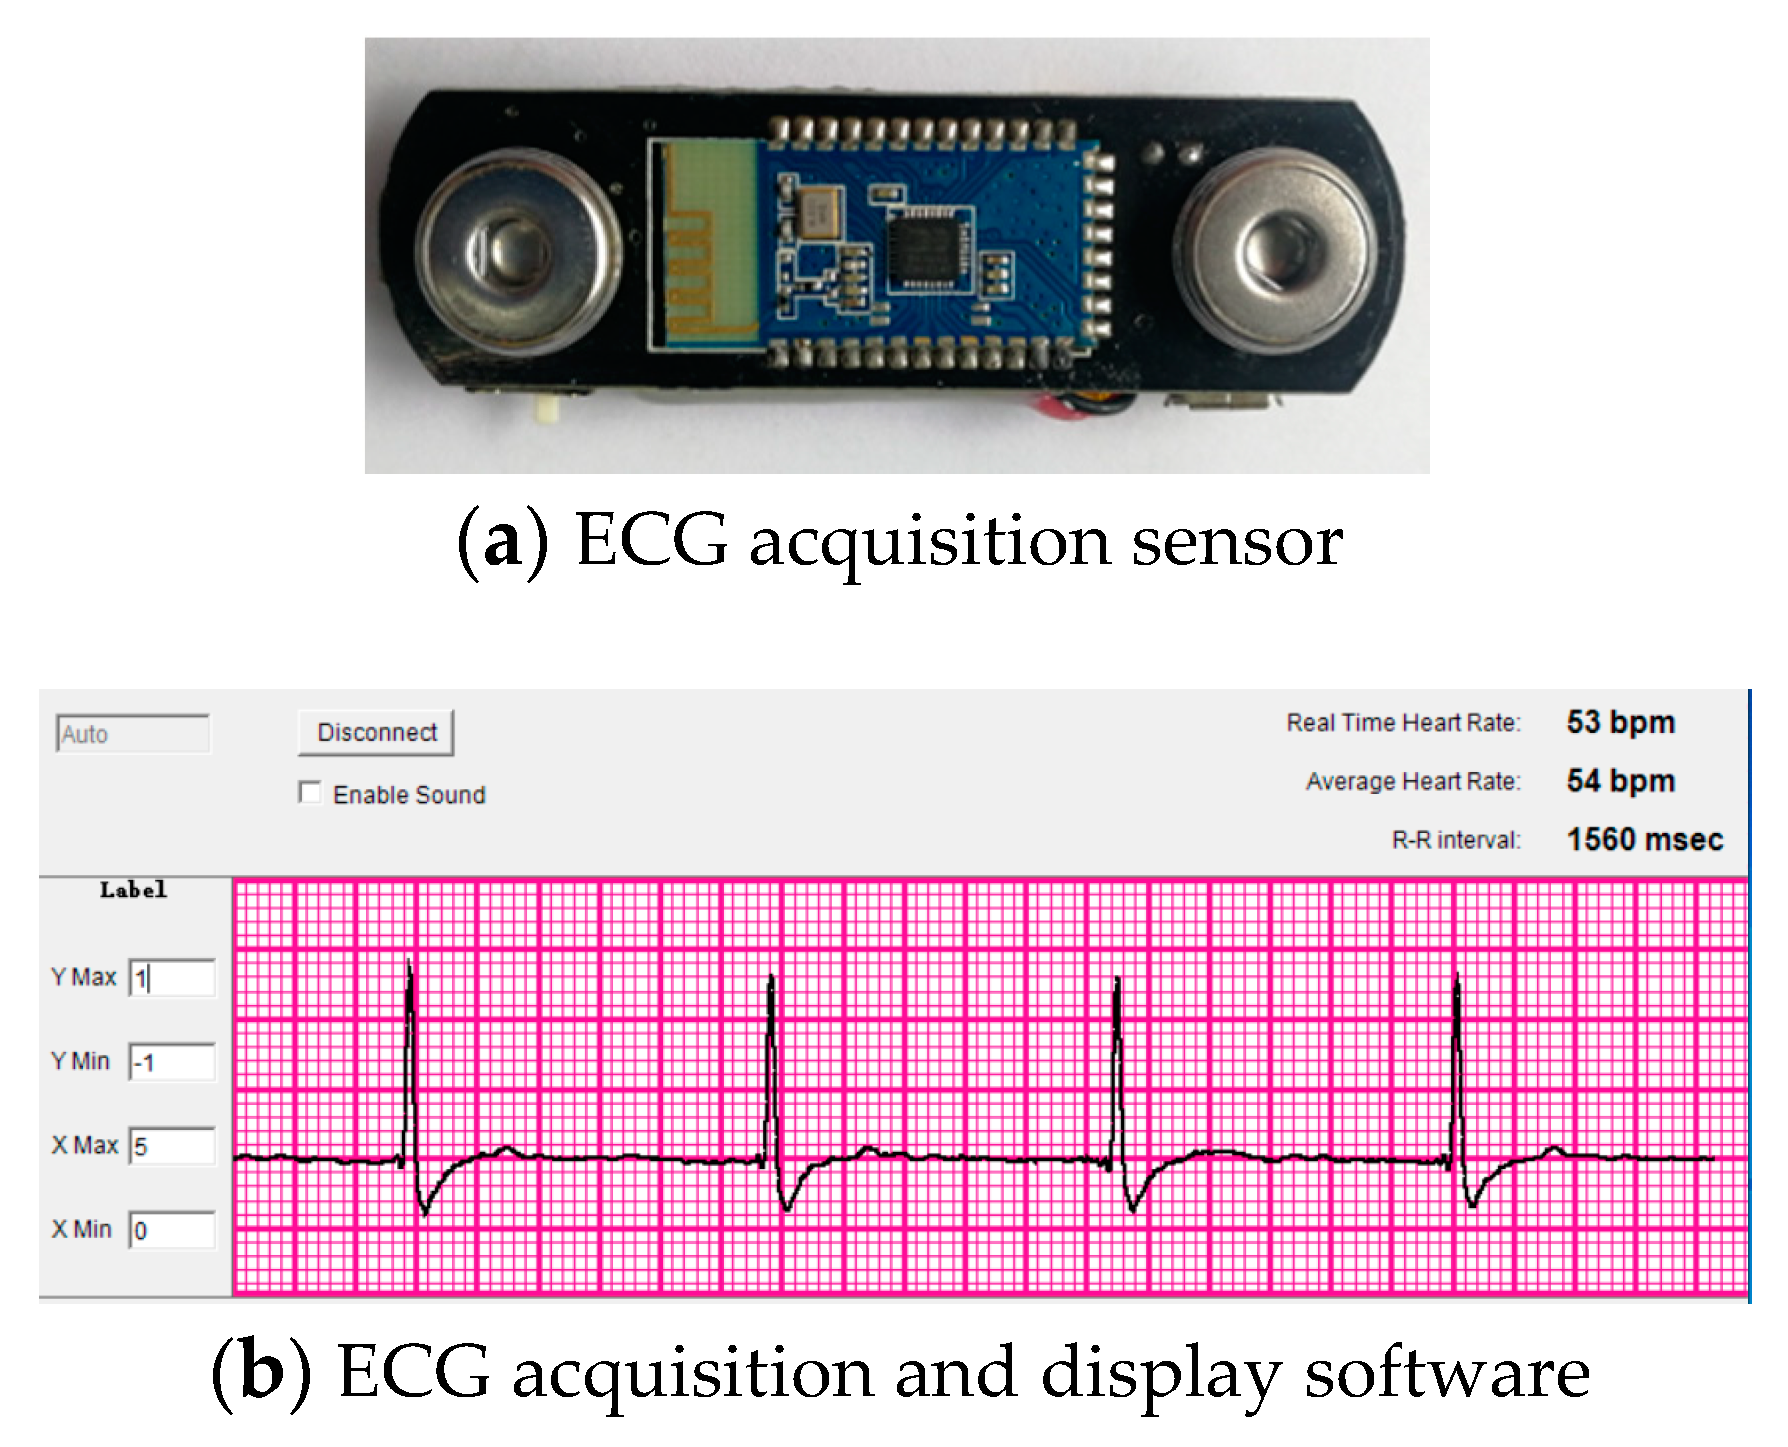
The ECG signal acquisition sensor and software in this paper are shown in Figure 3a,b. The sensor is a portable chest strap that can be attached to the operator’s chest. Additionally, The sensor is based on the BMD101 chip, which is the most widely used ECG signal acquisition sensor at present and can avoid interfering with the operator’s normal operation. Then, the ECG data is transmitted via Bluetooth to a computer for collecting and displaying the ECG signals.
The flow chart of data acquisition is shown in Figure 4. Firstly, subjects read and sign the informed consent. Then, they are trained in operating the robot professionally. Only after passing the set assessment indicators can they participate in the experiment. Before the beginning of experiment, the ECG acquisition device needs to be placed on the subject’s chest. Then the Karolinska Sleepiness Scale (KSS) is filled to determine the operator’s sleepiness state. The KSS needs to be filled once the operator has completed their mission. After giving the operator a minute to concentrate, the experiment starts. ECG signals of each operator in two mental workload states are collected. The tasks performed under each level of mental workload are defined as follows: (1) The task of mental workload level 1: The operator does not perform any task and maintains a relaxed state. (2) The task of mental workload level 2: The operator operates the arms of robot to follow a specified trajectory. ECG signals of the operator are collected at each task for 10 min. At the end of the task, the data records are checked and the ECG acquisition equipment on the subject is removed. The experiment ends. A 3 min sliding window is used to process the data, which slides for 10 s each time. The sliding window segments the 10-min data of each state of each subject. Furthermore, the three-minute segments obtained are used for the identification and classification of the two mental workload states.
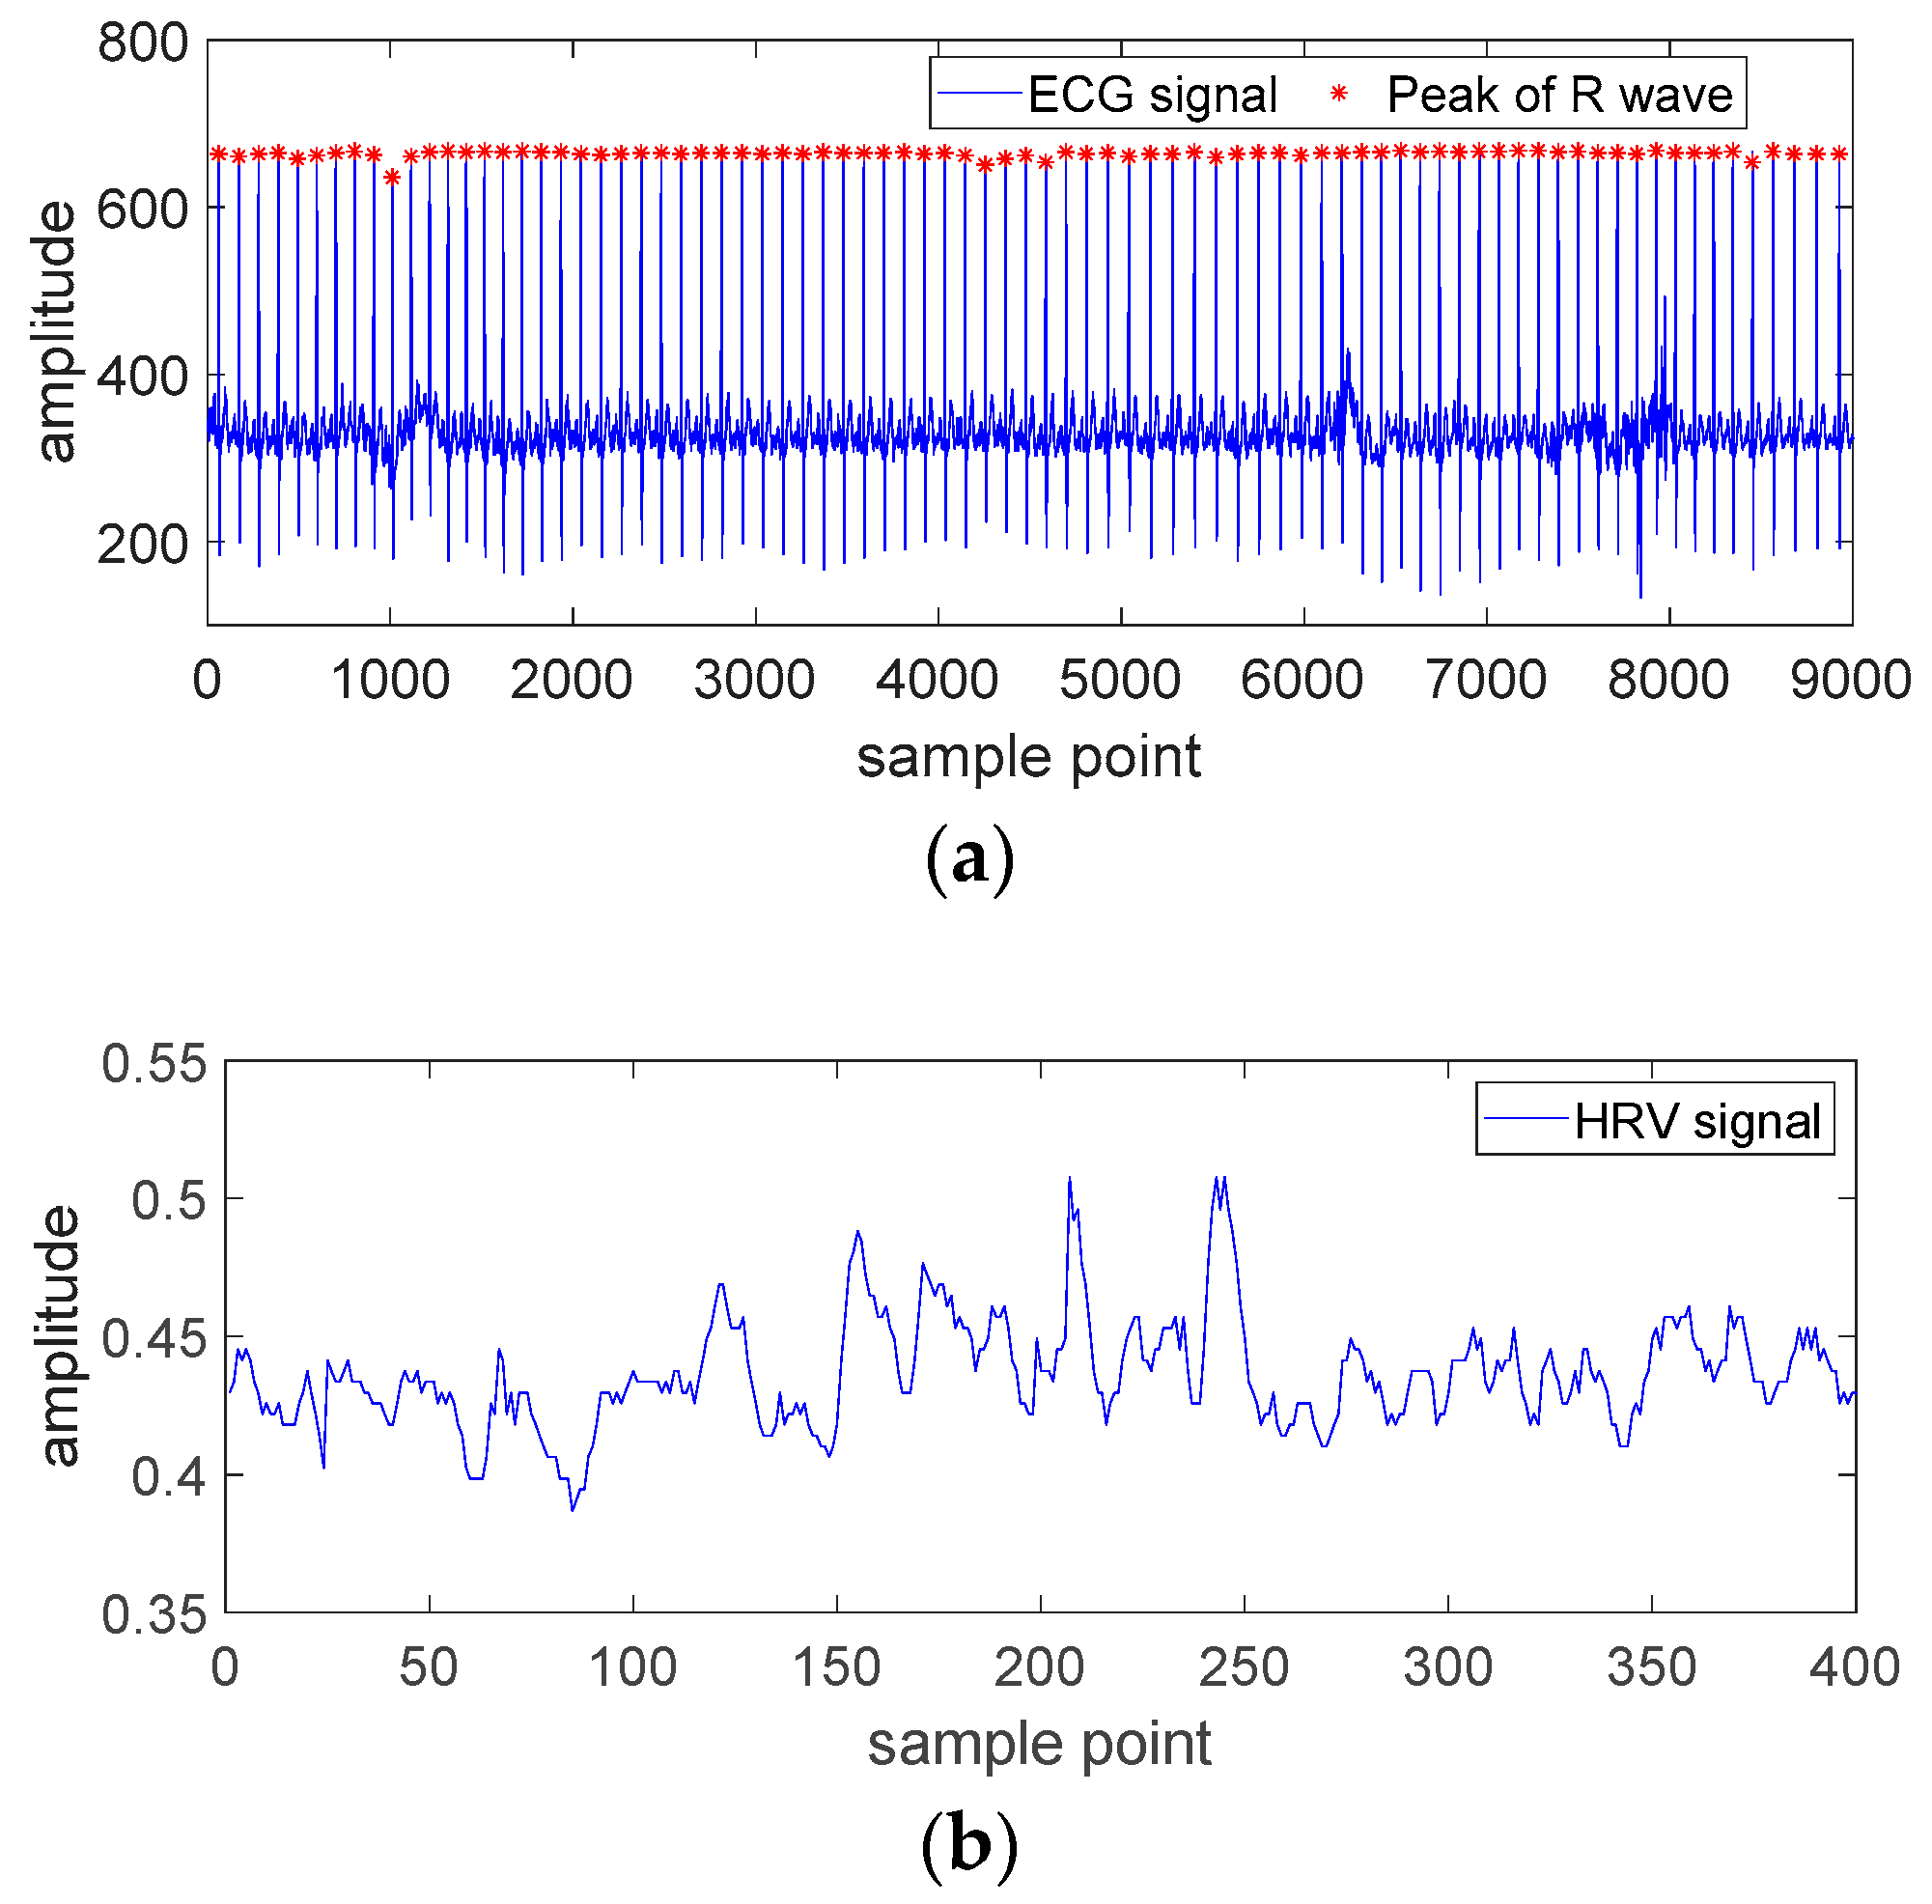
The HRV is shown in Figure 5, which is obtained by ECG signal collected by sensor. In reality, the HRV signal is defined as the fluctuation in continuous RR intervals. Hence, for the sake of getting the HRV sequence from the ECG signal, a QRS wave group detection method is utilized to detect the Q wave, R wave, and S wave [24]. Nevertheless, the abnormal point maybe present in the HRV signal that is output by the QRS wave group detection method. In order to remove the exception value, a median filtering method is utilized [25].

2.3. Feature Extraction

In this sub-section, extracting features from the HRV data obtained is presented. During the operation of the dual-arm robot operation tasks, the change of mental workload of operator is related to the volatility of sympathetic and parasympathetic nerve closely. In fact, the time domain features of the HRV signal reflect the overall volatility of the autonomic nervous system reaction. Additionally, frequency domain features of high frequency are related to the intensity of the modulation of parasympathetic nerve. Nevertheless, the low frequency band is influenced more by sympathetic nervous regulation. In addition, nonlinear features are expressed the chaotic and dynamic characteristics of HRV signal.

2.3.1. Linear Features

1.
Time domain features
The main features used in time domain is shown in Table 2. They are SDNN, RMSSD, RMSSD, PNN50, and HRVTi. In addition, the mean and median of the HRV signal are also extracted as features.
2.
Frequency domain features
The all frequency features used in this paper are based on the power spectra density. In this paper, a Lomb–Scamble periodic graph is used to calculate the power spectral density, which has a higher estimation accuracy than the FFT-based method [26]. The detailed description and definition are shown in Table 3.

2.3.2. Nonlinear Features

1.
Sample Entropy (SaEn):
SaEn is a method that can be used for the measurement of physiological signal complexity. SaEn is a probability of two HRV signals matching at a length of m + 1 if they match at m. In addition, a tolerance parameter r will determine the match result. In this paper, the value of m is set to 2, and the value of r is defined as 0.2 × std. The std in this paper represents the standard deviation of the input HRV data [27].
2.
Detrended Fluctuation Analysis (DFA):
DFA can be used for the statistical self-affinity of physiological signal, which is used for removing the trend of a series of events. Especially, it can reflect the information about the long-term correlation in the HRV signal. Furthermore, it has been widely used in HRV signal analysis [28]. The fluctuations of the HRV signal can express as a function of time intervals: F ( n ) = p n A l p h a where p is a constant and Alpha is a scale factor. F represents the fluctuations of HRV and n is time intervals. The HRV signal fluctuations will be altered by changing the parameter n. Two parameters of Alpha1 and Alpha2 are defined as the slop of F ( n ) , which is a function of logn in different time range.

3. Results

Using the time domain, frequency domain and nonlinear analysis method above, the HRV signals are analyzed when the subjects are in performing the task and relaxing state, respectively. Firstly, a t-test is used and the statistical significance of the extracted time domain, frequency domain, and nonlinear features are analyzed. Then, the features with statistical differences are selected for the classification of mental workload. Furthermore, for the sake of excluding the effects of classifier performance differences, six classifier algorithms are selected to identify and classify the mental workload, which are Support Vector Machine (SVM), Linear Discriminant Analysis (LDA), K-Nearest Neighbor (KNN), Decision Tree (DT), Gentle Boost (GB), and Naive Bayes (NB). The default parameters are selected as the parameters of the six classification algorithms in this paper. In addition, the HRV signals under different mental workload are divided into testing set and training set based on 10-fold cross-validation. Furthermore, the performance of mental workload levels are classified and evaluated by three indicators, which are defined as follows:
Accuracy : Acc = T P + T N T P + F P + T N + F N × 100 % ;
Sensitivity : Sen = T P T P + F N × 100 % ;
Specificity : Spe = T N F P + T N × 100 % .
where TP is defined as those samples in which the predicted and actual values are both positive. FP is defined as those samples that are classified as positive samples, but they are actually negative samples. FN is defined as those samples that are predicted to be negative samples, but their actual values are positive. Additionally, TN is defined as the actual values of samples that are positive but that are predicted to be negative. In this paper, the performing task state samples are defined as positive samples and the relaxing state samples are defined as negative samples.

3.1. Statistical Analysis of Features

3.1.1. Statistical Difference Analysis of Features from the Same Subject

Using the t-test, the statistical differences of time domain, frequency domain, and nonlinear features are analyzed in the same subject at different states (performing task state and relaxing state). Defining the sample set of subject1’s performing task state as S1-M, sample set of subject1’s relaxing state as S1-R. Meanwhile, the sample set of subject2′s, subject3’s, subject4’s, subject5’s, and subject6’s different lengths of time is defined by this rule.
Table 4 shows the statistical differences among 6 subjects. Moreover, each subject has two different mental workload states (performing task state and relaxing state). In detail, Table 4 shows the statistical differences of time domain, frequency domain and nonlinear features. It can be seen that there are total 87 features that are most significant differences (p < 0.001) between two different mental workload states from Table 4.
Among them, subject1 has 20 features with most significant differences (p < 0.001), which consist of six time domain features, 10 frequency domain features, and four nonlinear features.
Subject2 has 13 features with most significant differences (p < 0.001), which consist of six time domain features, five frequency domain features, and two nonlinear features.
Subject3 has 15 features with most significant differences (p < 0.001), which consist of six time domain features, seven frequency domain features, and two nonlinear features.
Subject4 has 16 features with most significant differences (p < 0.001), which consist of five time domain features, seven frequency domain features, and four nonlinear features.
Subject5 has nine features with most significant differences (p < 0.001), which consist of five time domain features, and four frequency domain features.
Subject6 has 14 features with most significant differences (p < 0.001), which consist of five time domain features, five frequency domain features, and four nonlinear features.

3.1.2. Statistical difference analysis of features cross the different subject

Using the t-test, the statistical differences of time domain, frequency domain, and nonlinear features are analyzed cross the different subject at different states (perform task state and relaxed state). The sample set of subject1’s, subject2’s, subject3’s, subject4’s, subject5’s, and subject6’s performing task state is defined as the CM group and the sample set of subject1’s–subject6’s in the relaxing state is defined as CR group.
Table 5 shows the statistical differences between two different mental workload state sample sets. Table 5 shows time domain and nonlinear features and Table 5 shows frequency domain features. It can be seen from Table 5 that there are 18 most significant difference (p < 0.001) features in the two groups of CM and CR.

3.2. Mental Workload Classification Based on the Same Subject

The classification and identification of mental workload are carried out on six subjects, respectively. Additionally, the features with statistical differences are selected for the classification of mental workload. The sample datasets for each experiment are divided into training set and testing set. In order to verify the classification performance of features, a total of six classification algorithms are used in this paper so each subject has trained six models. In this paper, there are six experimental subjects and 6 × 6 = 36 models are trained. The average value of 10-fold cross-validation is used as the final experimental result. In order to ensure the reliability of the experimental results, the 10-fold cross-validation is repeated 100 times.
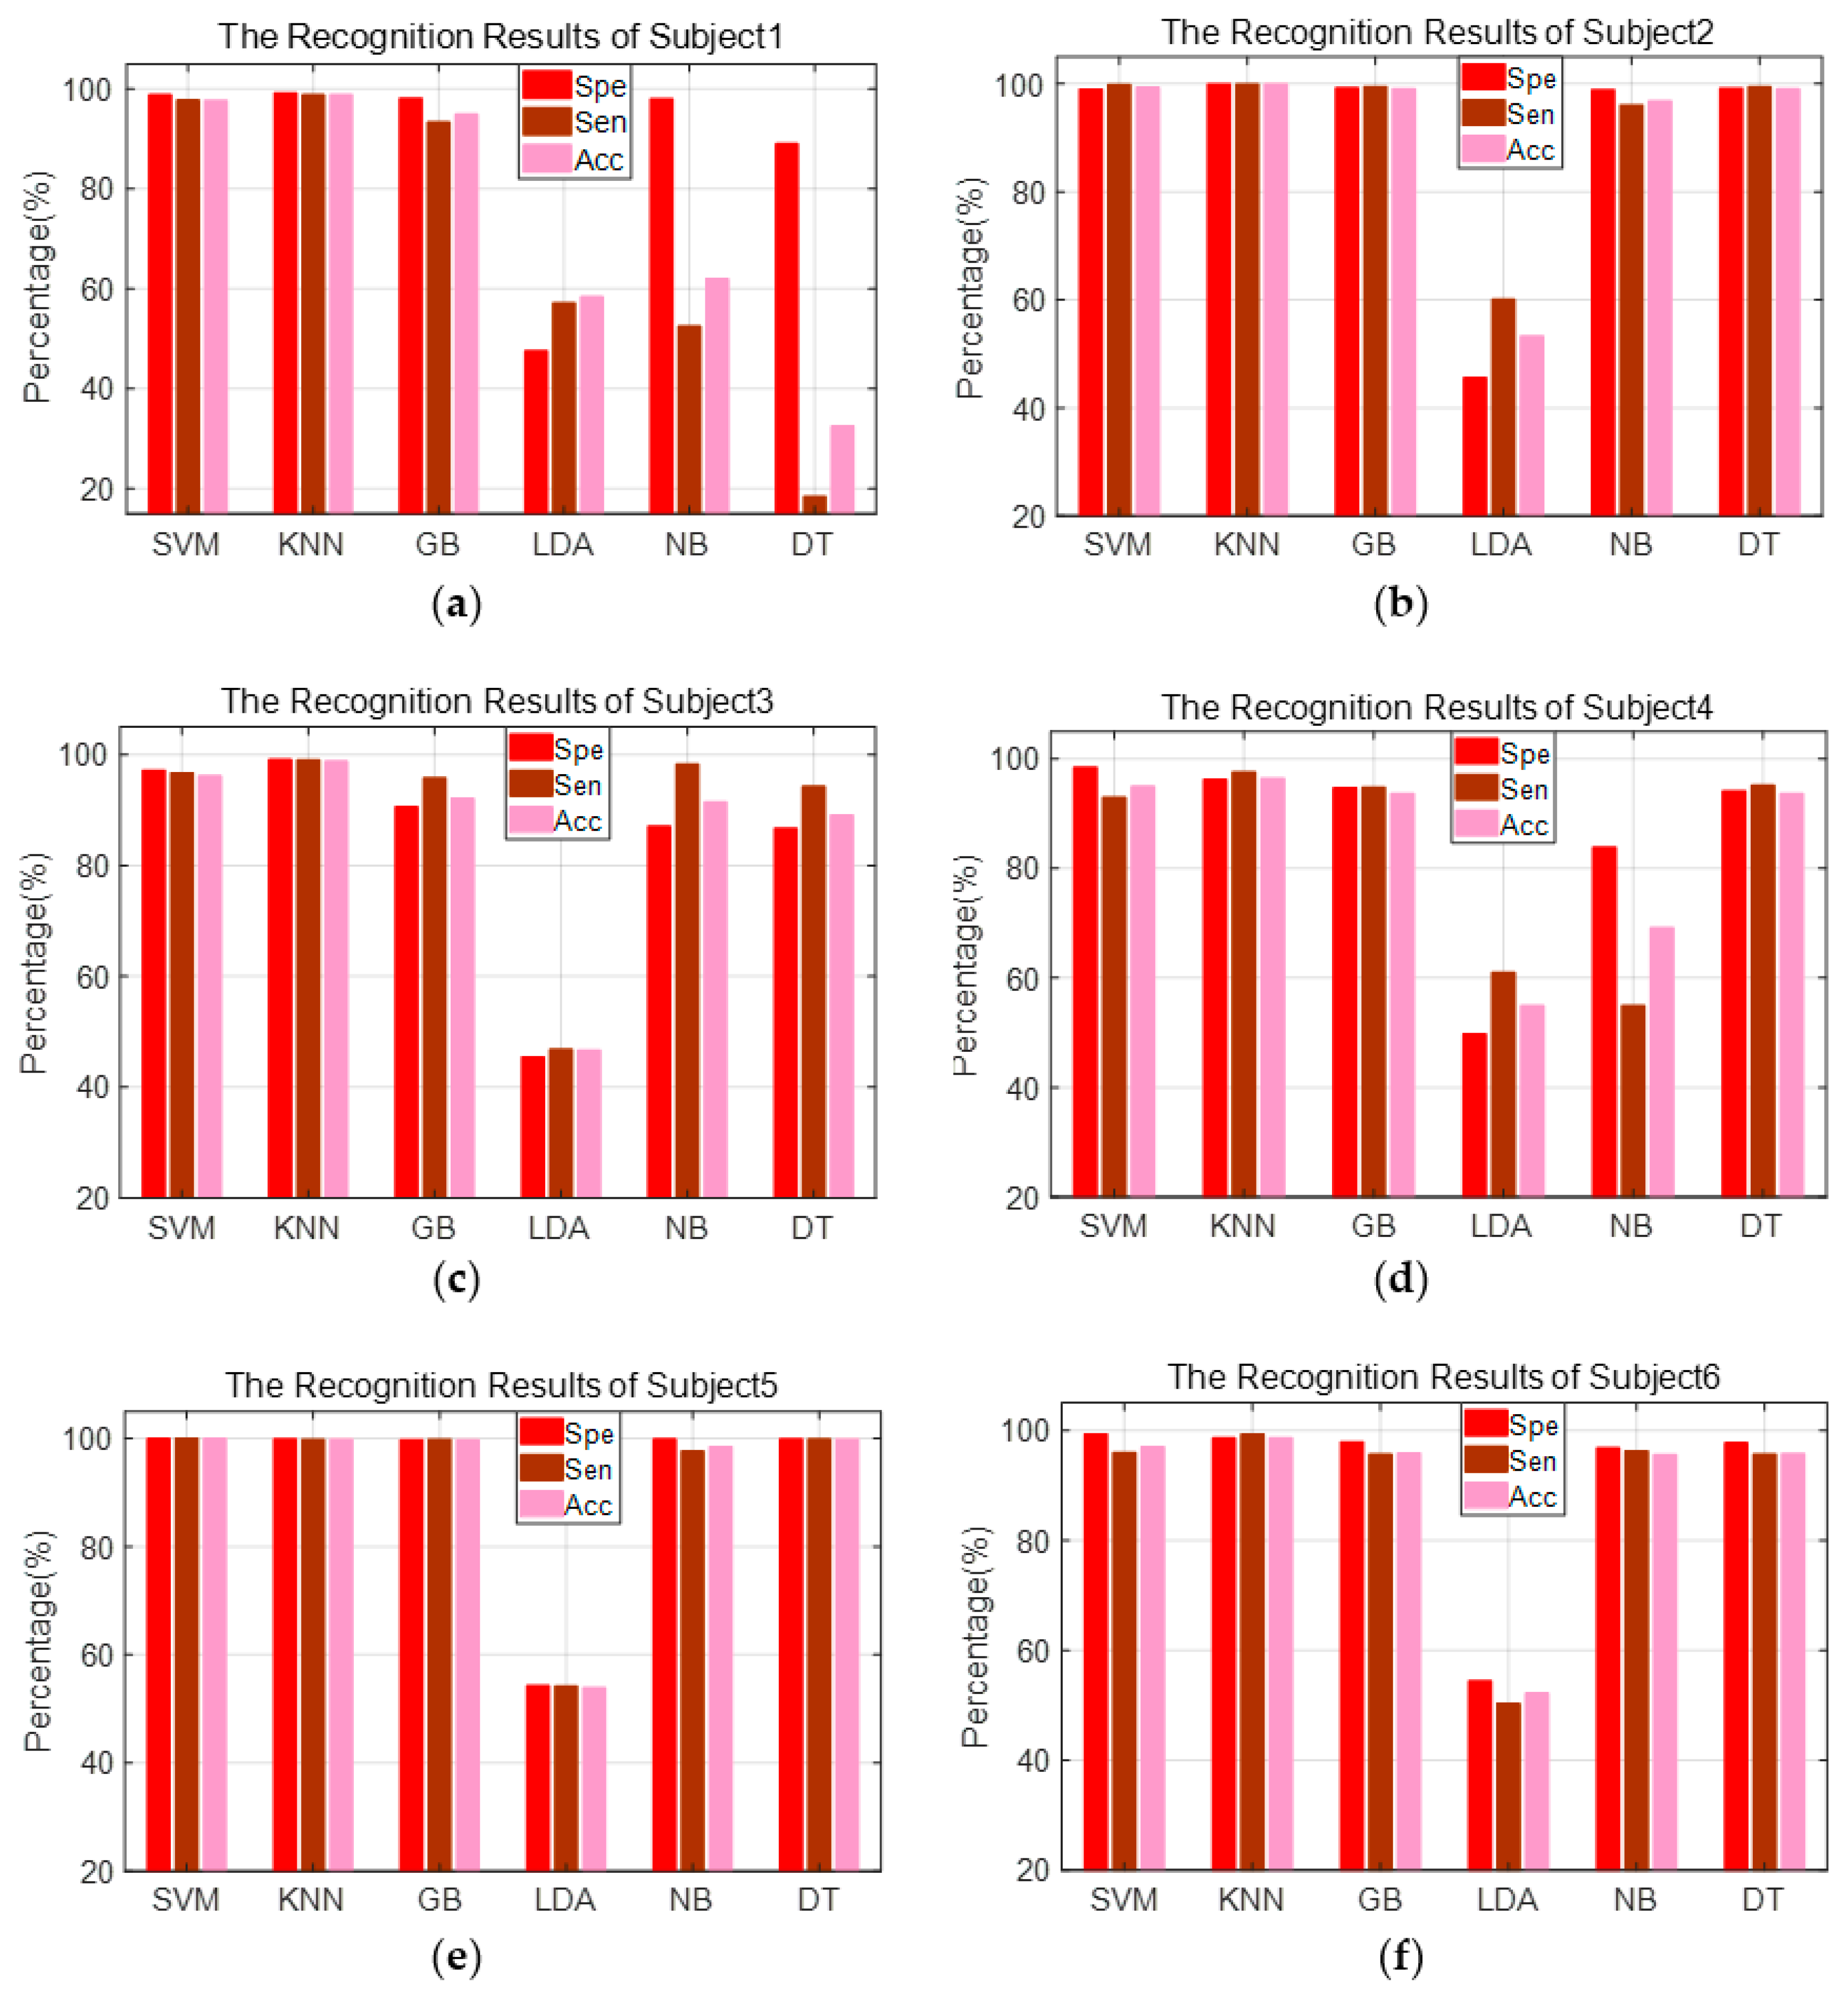
Figure 6 and Table 6 are the classification results for each subject using different classifiers, as can be seen from Figure 6a and Table 6. SVM, KNN, and GB show better classification results for subject1. In addition, the KNN classification algorithm shows the highest Spe, Sen, and Acc: 99.26%, 98.86%, and 98.91%, respectively. It can be seen from Figure 6b and Table 6 that SVM, KNN GB, NB, and DT show better classification results for subject2. In addition, the KNN classification algorithm shows the highest Spe, Sen, and Acc: 99.99%, 98.94%, and 99.95%, respectively. It can be seen from Figure 6c and Table 6, for the subject3. LDA shows the worst classification effect and the KNN classification algorithm shows the highest Spe, Sen, and Acc: 99.15%, 99.07%, and 98.84%, respectively. As Figure 6d and Table 6 demonstrate, SVM, KNN, GB, and DT show better classification results for subject4. The SVM classification algorithm shows the highest Spe (98.43%) and KNN classification algorithm shows the highest Sen and Acc: 97.61% and 96.45%, respectively. As can be seen from Figure 6e and Table 6, for the subject5, all five classification algorithms, except LDA, show good performance of classification. The SVM classification algorithm shows the best Spe, Sen, and Acc: 99.97%, 99.99%, and 99.97%, respectively. It can be seen from Figure 6f and Table 6 that the KNN classification algorithm shows the highest Spe, Sen, and Acc: 98.61%, 99.34%, and 98.64%, respectively.
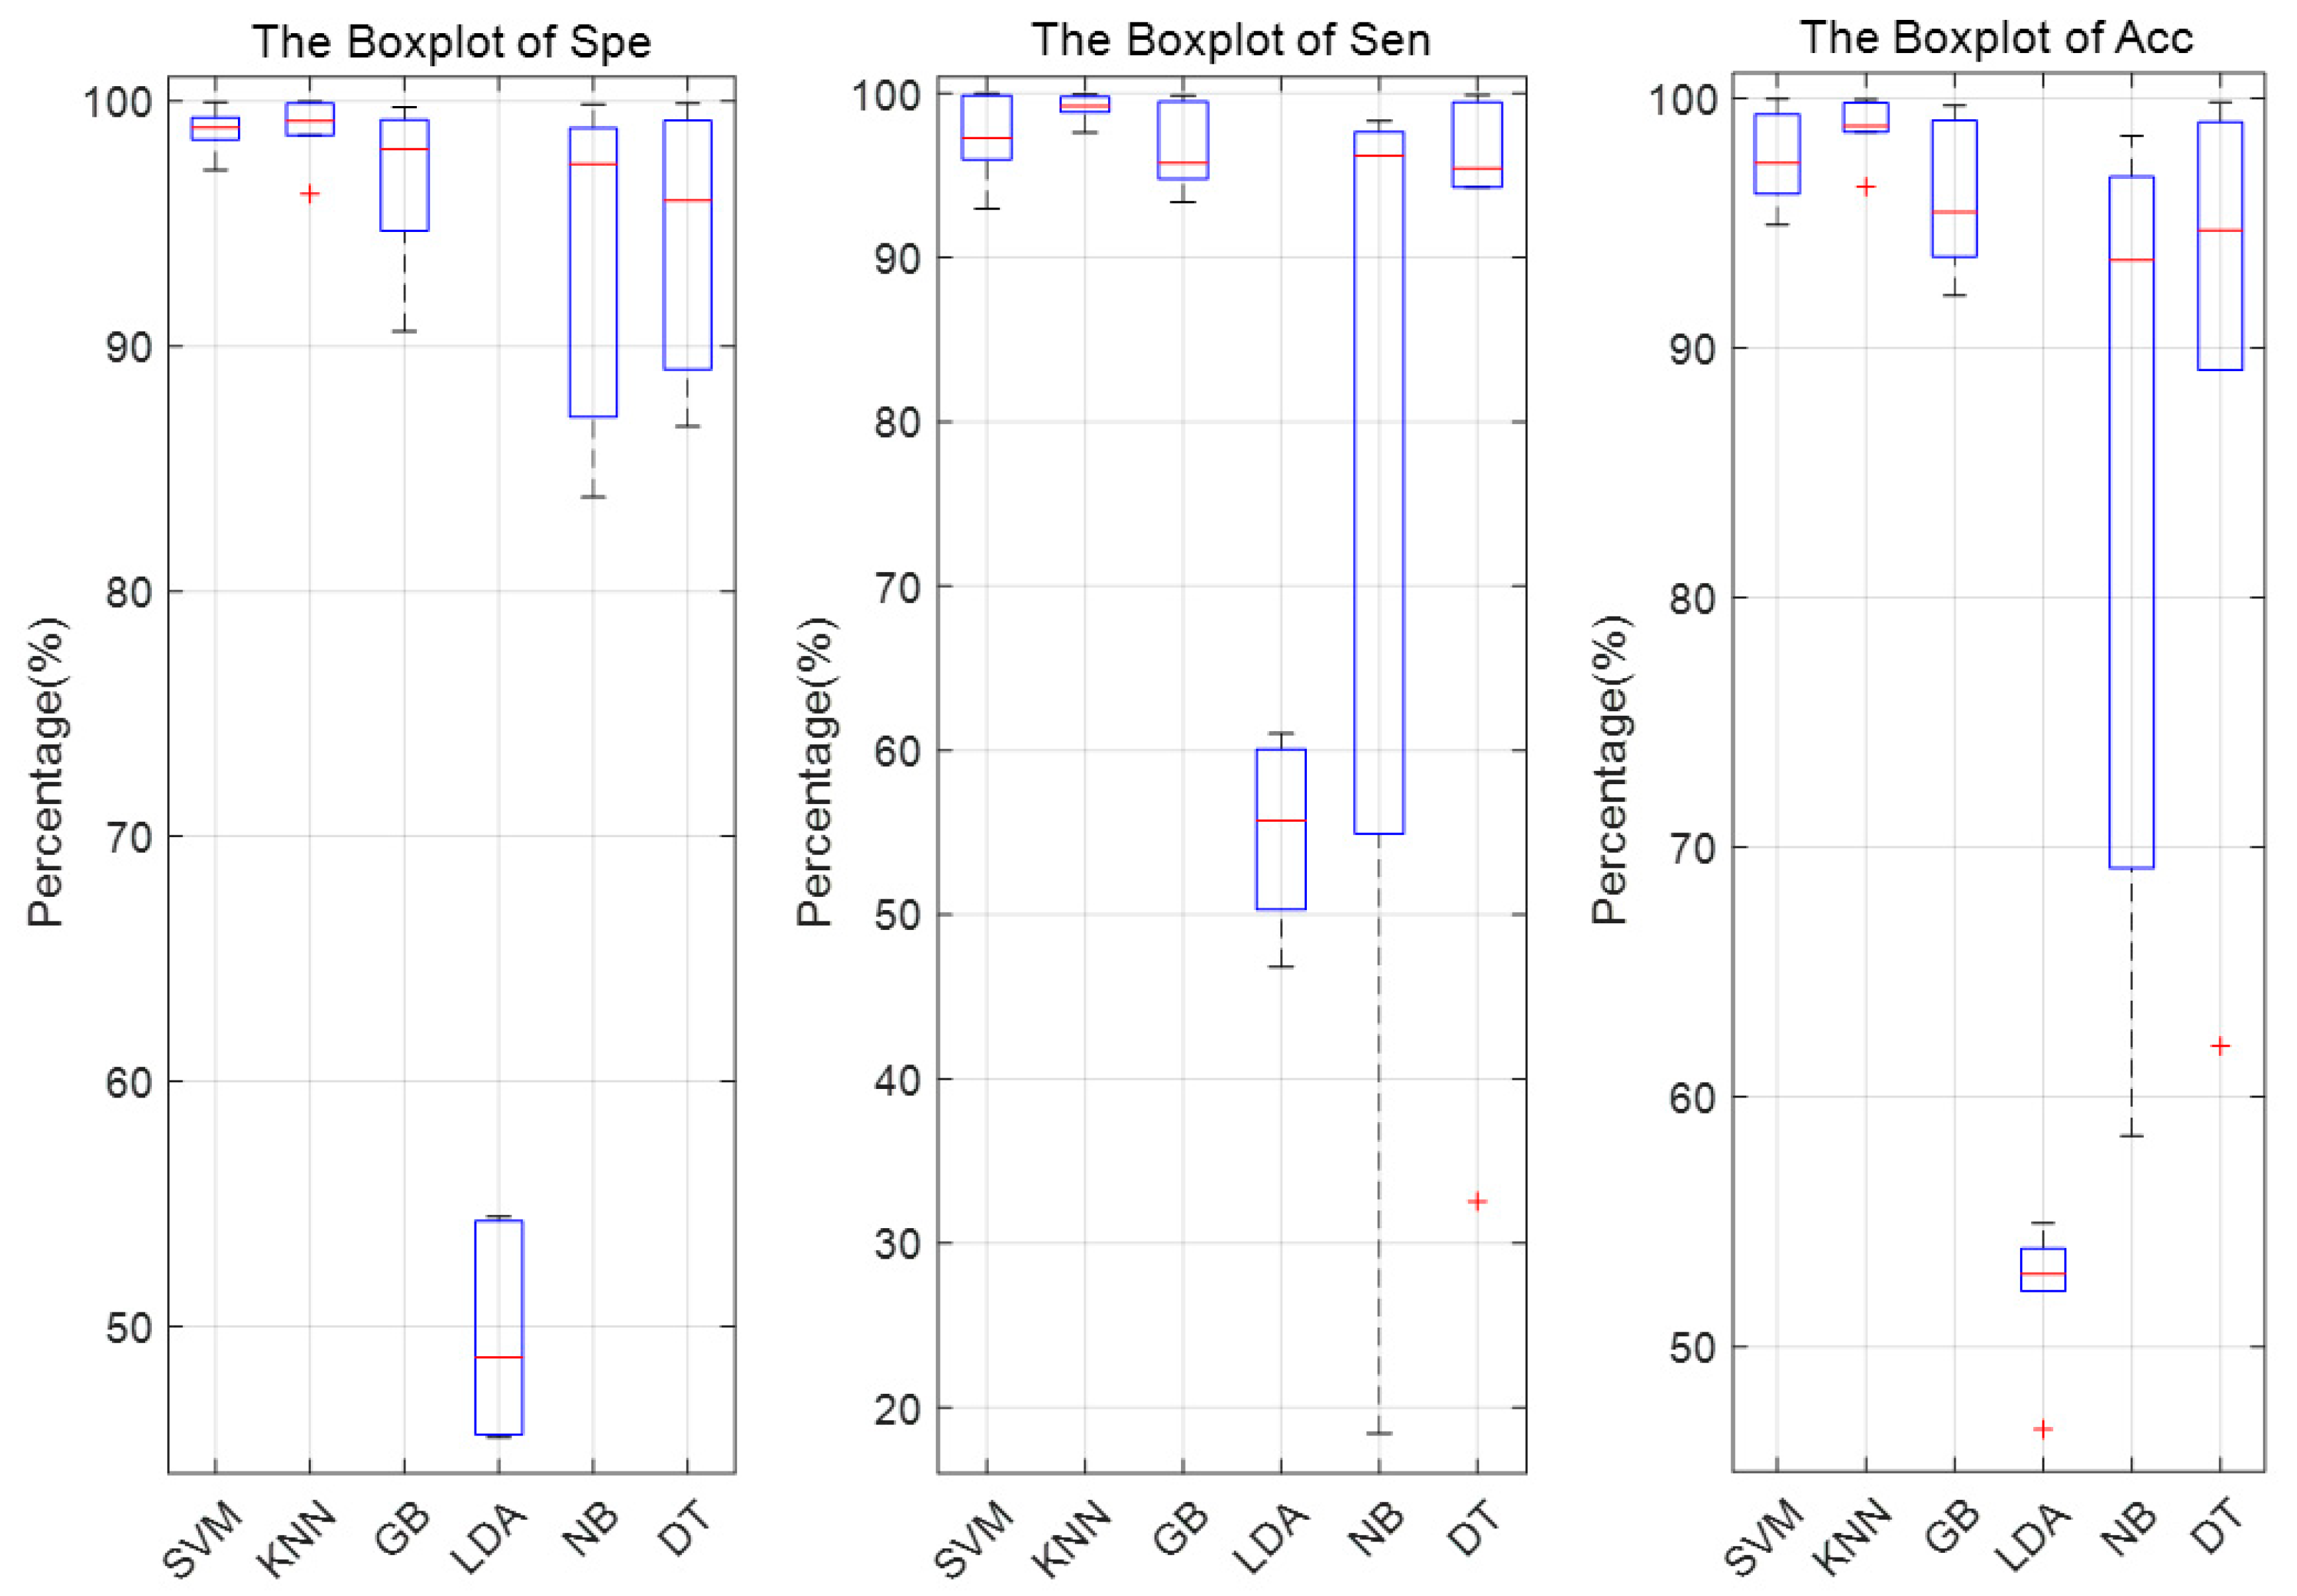
Finally, the Spe, Sen, and Acc of the six subjects under different classification are presented in box plots (Figure 7). Box plots not only show the average values, but the distribution of the computed values can also be given. Additionally, the abnormal values are given by red points. As can be seen from the figure, while using the KNN classifier, all 6 subjects exhibit highest Spe, Sen, and Acc, with the least overall discreteness. However, in Spe and Acc, outliers appear. While using the SVM classifier, the six subjects perform higher Spe, Sen, and Acc, and the data are less discrete. Comparing with KNN and SVM classifiers, the GB classifier shows a large degree of discreteness but the classification results are stable. The performance of classification of the DT classifier is slightly worse than GB. The classification results of LDA and NB classifiers are the least satisfactory, with Spe, Sen, and Acc of LDA being lower, while the Spe, Sen, and Acc of NB classifier are the most discrete.

3.3. Mental Workload Classification Cross Subject

In this sub-section, the performance differences of cross-subject mental workload classification are analyzed. The features with statistical differences are selected for the classification of mental workload. Samples of five subjects are used as a training set and samples of the leave-out subject who is not involved in the training are used as the testing set. Since there are six subjects, the validation process is performed six times.
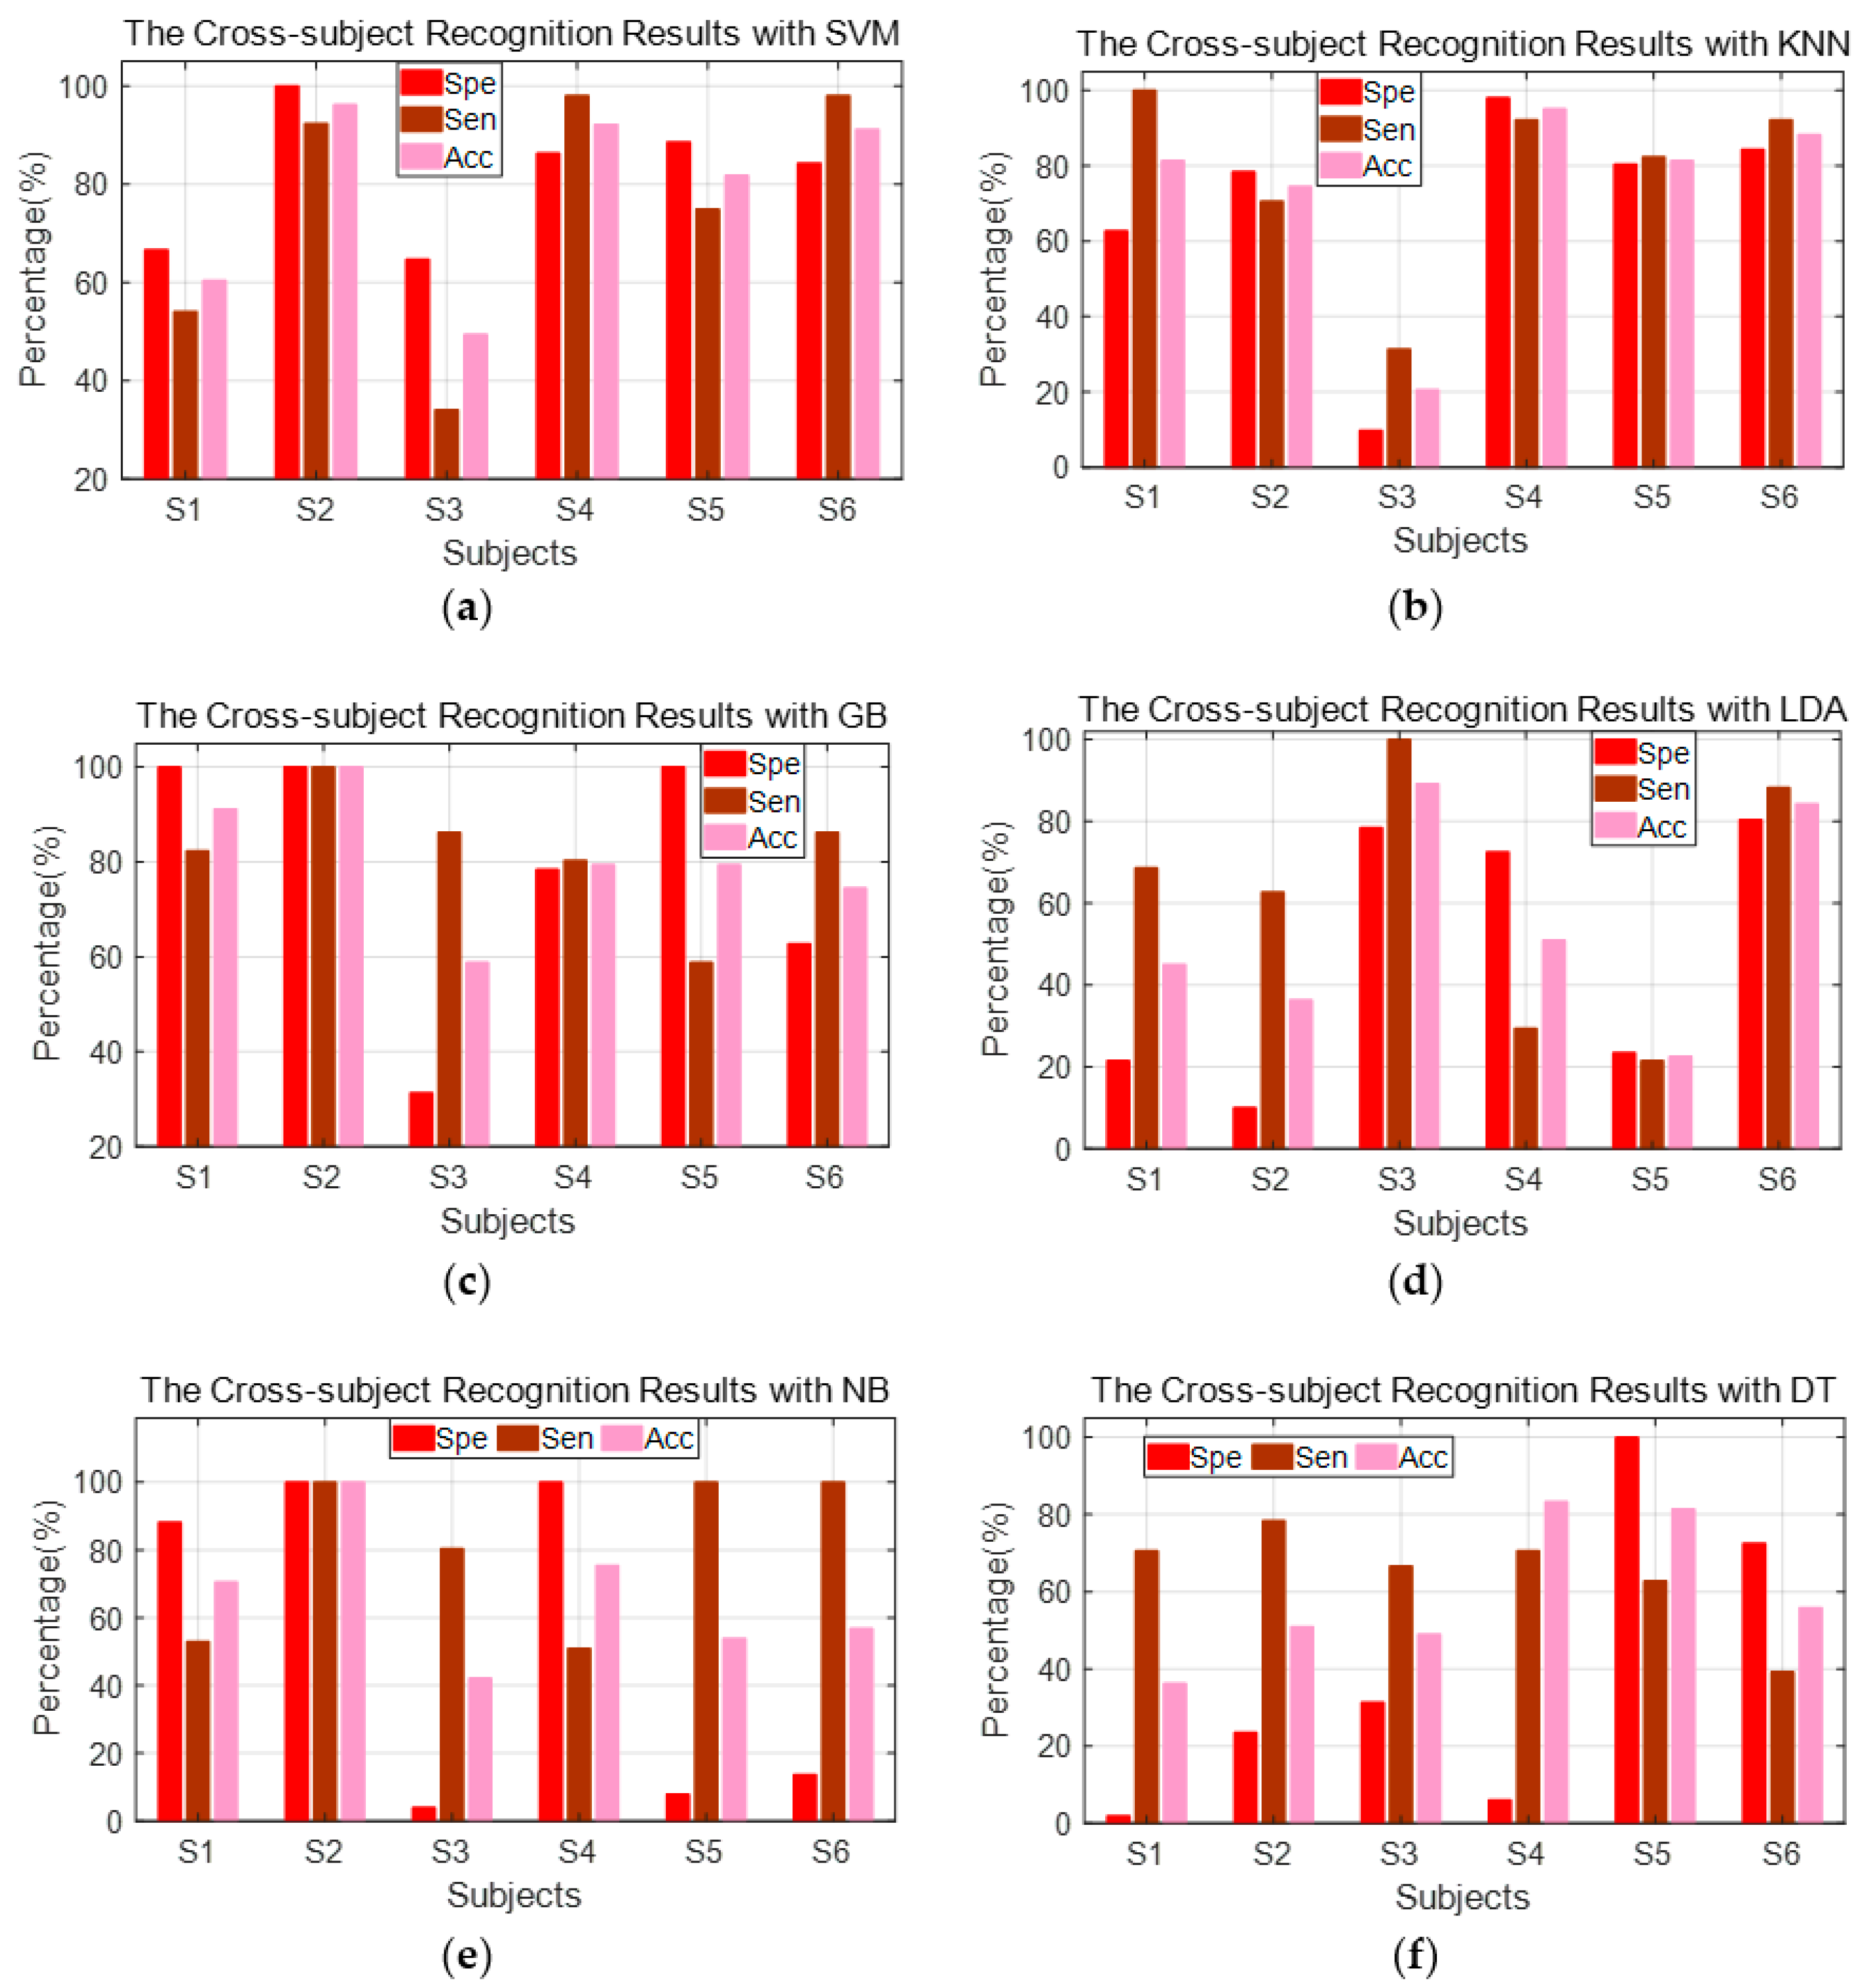
Figure 8 and Table 7 are cross-subject classification results using different classifiers. As can be seen from Figure 8 and Table 7, for subject1, the KNN classification algorithm shows the highest Sen (100%), and the GB method shows the highest Spe (100%) and Acc (91.18%). For subject2, SVM and GB methods show the highest Spe (100%). At the same time, the GB method also shows the highest Spe (100%) and Acc (100%). For subject3, the LDA classification algorithm shows the best classification performance. The Spe, Sen, and Acc are 78.43%, 100.00%, and 89.22%, respectively. For subject4, SVM shows the highest Sen (98.43%). The KNN method shows the highest Acc (95.1%). Te NB method shows the highest Spe (100%). For subject5, SVM shows the highest Acc (81.76%). GB and DT show the highest Spe (100%) and the NB method shows the highest Spe (100%). For subject6, both SVM and KNN methods show the highest Spe (84.31%). SVM shows the best Acc (91.18%) and the NB method shows the highest Sen (100%).
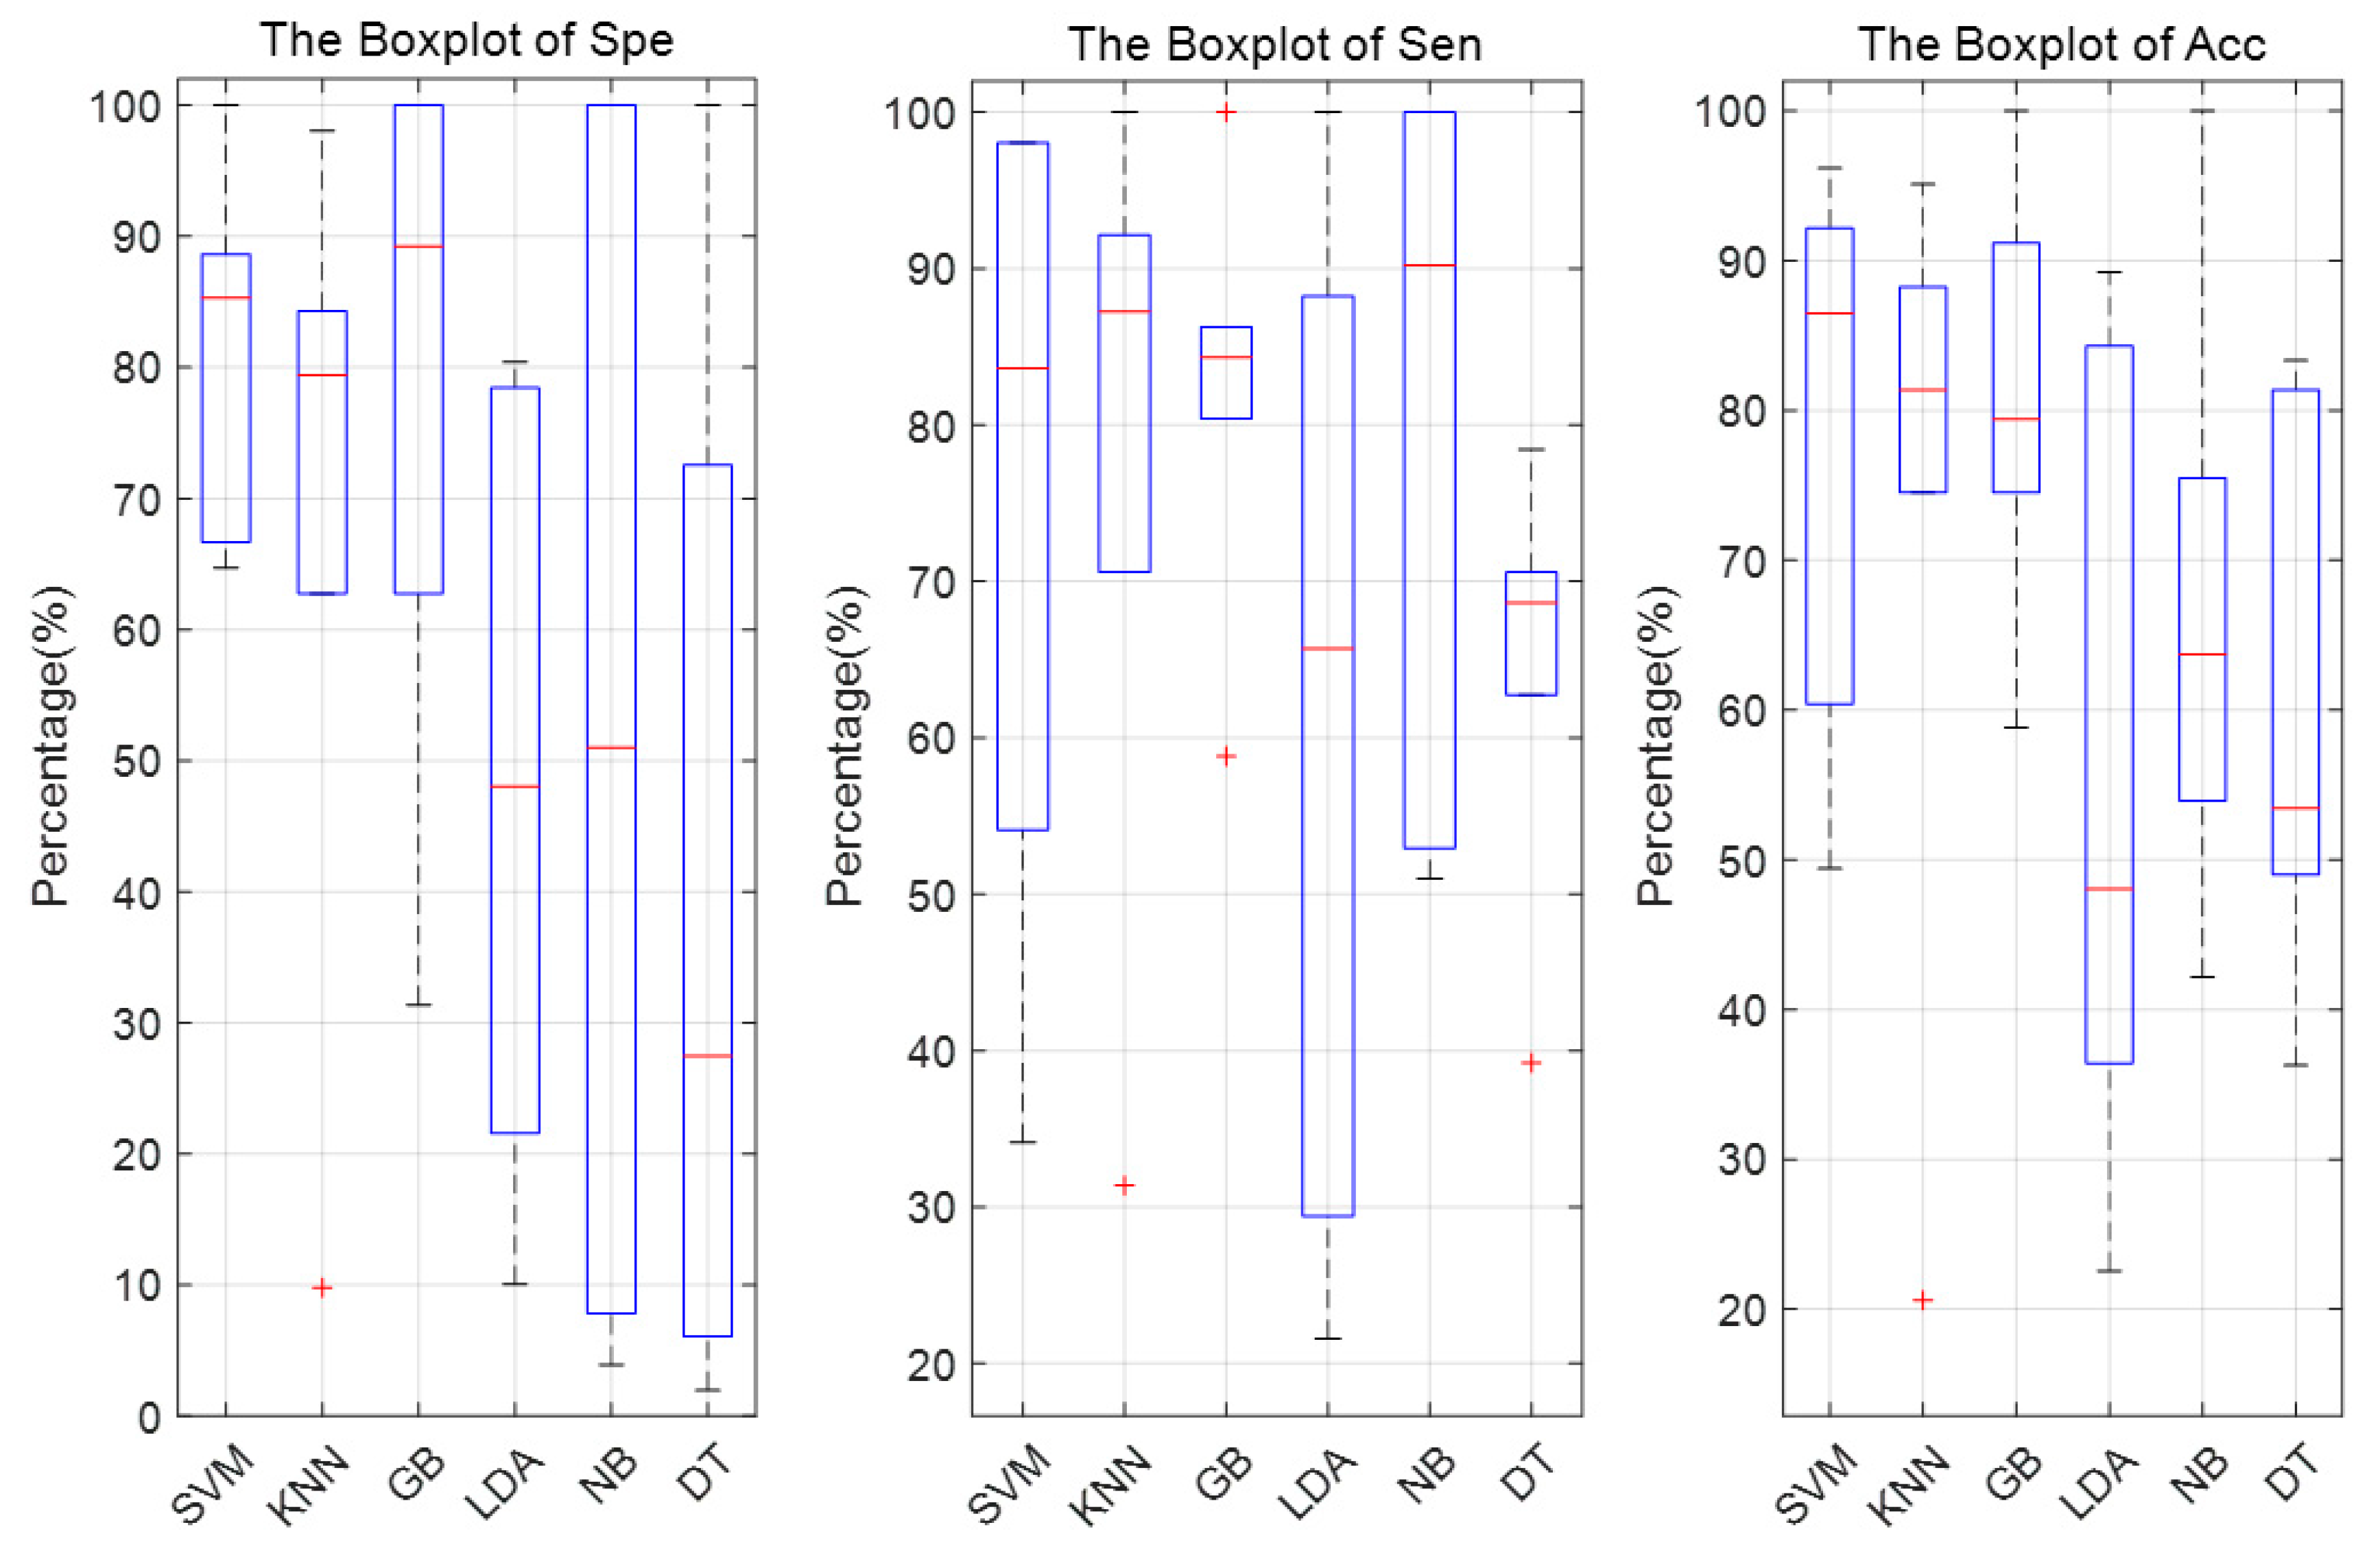
Finally, the results of cross-subject classification under different classifiers are presented in box plots (Figure 9). As can be seen from the figure, there are higher maximums of Spe, Sen, and Acc regardless of the classifier used. However, the figure also shows a more discrete distribution result and the red points represent abnormal values. The difference between the maximum and minimum values is large. In addition, for each subject, there is a classifier that achieves better classification results.

4. Discussion

To the best of our knowledge, this is the first work to measure the operator’s mental workload in human and dual-arm robot interaction process based on wearable exoskeleton controller. At present, many of the studies on mental workload are aimed at the n-back paradigm, simulated driving scenarios, and so on. In the process of interaction between human and dual-arm robot of this paper, the operator adopts the wearable controller. Additionally, the two arms of the dual-arm robot imitate the arms of human. This control mode of master-slave aims to reduce the operator’s burden in the process of human and dual-arm robot interaction as much as possible. In addition, this control mode also excludes the operator’s limb coordination ability differences, which significantly focuses the operator on the task. The study of mental workload in the process of human and dual-arm robot interaction has not been found. In addition, there is no corresponding public datasets. Thus, in this paper, the ECG signal data is collected. According to the ECG signals, the HRV for analysis is extracted.
Studies have shown that a stress response occurs [29] when the mental workload of the human increases. First, the sympathetic nervous system will be activated. Then the entire nervous system will respond to the increase of mental workload and improve human alertness. Furthermore, blood is transferred from the internal organs and skin to the skeletal muscles. Then the heart rate and heart contraction increase rapidly. These changes allow the body to accumulate large amounts of energy in a short period of time to prepare for external threats. Furthermore, the HRV signal contains information about the regulation of the cardiovascular system by body fluid factors, which can reflect fluctuations of the autonomic nervous system. Therefore, it is feasible to use the HRV signal for mental workload analysis.
More specifically, the existing studies show that the aTotal feature reflects the whole activity of the autonomic nervous system. LF-relative features are thought to be associated with sympathetic activity. HF-relative features are thought to have correlation between the parasympathetic activity. The physiological significance of the VLF-relative features have been identified with long-period rhythms. The relationship between LF components and HF components (LF/HF) is an important indicator of the sympathetic and parasympathetic balance in the body [30,31]. The SDNN index and HRVTi feature are believed to primarily measure autonomic influence on HRV [32]. Both RMSSD and PNN50 reflect parasympathetic (vagal) activity. Nonlinear features represent the fluctuation characteristics of the autonomic nervous system [33].
In this paper, the time domain features, frequency domain features, and nonlinear features between two mental workload states of the same subject or across different subjects, most features show statistical differences. Only individual features do not show statistical differences, which may be due to personalized differences between subjects. This does not affect the classification of the two mental workload states. Firstly, this paper analyzes the different mental workload states of the same subject. The results show that, for subject1–subject6, the highest Acc are 98.91% (KNN), 99.95% (KNN), 98.84% (KNN), 96.45% (KNN), 99.97% (SVM), and 98.64% (KNN), respectively. The KNN classifier has the highest average recognition accuracy (98.77%) when using the same classifier to identify six subjects separately. The SVM and GB classifiers also show good classification, with the Acc being 97.54% and 95.90%, respectively. None of the remaining three classifiers (LDA, NB, DT) have a classification accuracy rate of more than 90%. Therefore, the KNN algorithm is more suitable for the human and dual-arm robot interaction, using the sample data training model of the same subject and classifying the mental workload of the subject. Then, the different mental workload states cross-subject are classified. The results show that, for subject1–subject6, the highest Acc are 91.18% (GB), 100% (GB), 89.22% (LDA), 95.10% (KNN), 81.76% (SVM), and 91.18% (SVM). Thus, the average classification accuracy of the six subjects classifying using different classifiers is 91.41%. In the case of using the same classifier for the six subjects, the average accuracy of cross-subject identification is 80.56% (GB). Additionally, SVM and KNN also show good classification results, with classification accuracy of 78.51% and 73.53%, respectively. When identifying across subjects, each subject has a classifier that makes it better classified. Therefore, in the future, multiple classifiers should be considered for use and use the voting method to select the best classifier’s classification results.
The analysis of mental workload is related to specific tasks and the study of mental workload in the process of master-to-slave interaction between a wearable controller and a dual-arm robot have not been reported. Therefore, this paper chooses to compare the studies related to mental workload or stress in other scenarios. In [34], a pilot study is conducted on whether machine learning can predict stress decrease after relaxation on the basis of a wearable sensor. The status before and after relaxation is classified using the ECG and GSR signals for 79.2% classification accuracy. In [35], detection of drivers’ anxiety based on physiological signals is studied. The results show that classification on the basis of EEG alone shows the best accuracy, it is 77.01%. In [36], the cross-subject mental workload classification is studied on the basis of kernel spectral regression and transfer learning techniques. An average Acc of 72.66% is obtained for six subjects, the Acc of six subjects are 73.15%, 77.32%, 78.63%, 65.40%, 71.08%, and 70.36%, respectively. In [37], using wearable sensors, the mental workload of human and robot collaboration is analyzed. However, it is only the statistical analysis of HRV signals in different mental workload states. In addition, there is no study of classification and identification. In this paper, the data of two different mental workload states are collected and 20 kinds of HRV features are extracted. Then, the statistical significance of HRV signal features are analyzed in different states. The features with statistical differences (p < 0.05) are selected for the identification and analysis of mental workload. Models trained with the same subject data and models trained across different subjects all obtained higher Acc compared with [34,35,36,37].
In addition, in this paper, the heart beat data collection device is a custom one. Its functionality can be modified based on demand. Furthermore, it is cheap. However, with the rapid development of consumer electronics devices, most of the existing smart watches have heart beat monitoring capabilities. This will be more conducive to long-term detection. Thus, in the future, smart watches will be considered as the heart beat data collection device for research.

5. Conclusions

A human remote-controlled robot performs complex or dangerous tasks in unstructured environments, which expends the scope of human work. In the process of completing the tasks, the mental workload of the operator will change based on the different tasks of the robot. However, too much mental workload will not only affect the robot’s working efficiency and safety, but also impact human physical and mental health. In order to assess the mental workload during human interaction with a dual-arm robot, in this paper, HRV is the measure that is studied. Firstly, the ECG signals of two kinds of mental workload states (performing task state and relaxing state) are collected. The ECG signals are collected from six subjects based on a custom device. Based on the ECG signal, the HRV signal is obtained. Then, 20 kinds of HRV features (time domain, frequency domain, and nonlinear features) are extracted. Finally, six different classifications are used to mental workload classification. The results are that, firstly, using each subject’s HRV signal training model, the subject’s mental workload is classified. The average classification accuracy of 98.77% is obtained using the KNN method. Then, using the HRV signal of five subjects for training, and the remaining one subject for testing, the GB method can obtain the highest average classification accuracy, with the average classification accuracy of six subjects being 80.56%. This study has demonstrated that the HRV can be used to measure the mental workload during human interaction with a dual-arm robot.

Author Contributions

Conceptualization: S.S. and T.W.; methodology: S.S., T.W., C.S. and C.Y.; software: S.S.; formal analysis: S.S. and C.S.; investigation: S.S., Y.W. and Y.S.; data curation: S.S., Y.W. and Y.S.; writing—original draft preparation: S.S. and C.S.; writing—review and editing: S.S. and C.S. All authors have read and agreed to the published version of the manuscript.

Funding

This research is funded by the National Natural Science Foundation of China (grant number U20A20201), the Doctoral Scientific Research Foundation of Liaoning Province (grant number 2020-BS-025), the LiaoNing Revitalization Talents Program (grant number XLYC1807018), and the National key research and development program of China (grant number 2016YFE0206200).

Conflicts of Interest

The authors declare no conflict of interest.

References

  1. Spiers, A.J.; Morgan, A.S.; Srinivasan, K.; Calli, B.; Dollar, A.M. Using a variable-friction robot hand to determine proprioceptive features for object classification during within-hand-manipulation. IEEE Trans. Haptic. 2020, 13, 600–610. [Google Scholar] [CrossRef]
  2. Su, Y.; Wang, T.; Yao, C.; Shao, S.L.; Wang, Z.D. A target tracking method of UAV based on cooperative target. Robot 2019, 4, 425–432. [Google Scholar]
  3. Zhao, T.; Deng, M.; Li, Z.; Hu, Y.B. Cooperative manipulation for a mobile dual-arm robot using sequences of dynamic movement primitives. IEEE Trans. Cogn. Dev. Syst. 2020, 12, 18–29. [Google Scholar] [CrossRef]
  4. Li, Y.; Xu, D. Cooperative path planning of dual-arm robot based on attractive force self-adaptive step size RRT. Robot 2020, 42, 606–616. [Google Scholar]
  5. Heard, J.; Harriott, C.E.; Adams, J.A. A survey of workload assessment algorithms. IEEE Trans. Hum. Mach. Syst. 2018, 48, 434–451. [Google Scholar] [CrossRef]
  6. Young, M.S.; Brookhuis, K.A.; Wickens, C.D.; Hancock, P.A. State of science: Mental workload in ergonomics. Ergonomics 2015, 58, 1–17. [Google Scholar] [CrossRef] [PubMed]
  7. Bajaj, N.; Carrionk, J.R.; Bellotti, F.; Berta, R.; de Gloria, A. Automatic and tunable algorithm for EEG artifact removal using wavelet decomposition with applications in predictive modeling during auditory tasks. Biomed. Signal Process. Control. 2020, 55, 101624. [Google Scholar] [CrossRef]
  8. Aldridge, A.; Barnes, E.; Bethel, C.L.; Carruth, D.W.; Kocturova, M.; Pleva, M.; Juhar, J. Accessible electroencephalograms (EEGs): A comparative review with openbci’s ultracortex mark IV headset. In Proceedings of the International Conference Radioelektronika, RADIOELEKTRONIKA-Microwave and Radio Electronics Week, Pardubice, Czech Republic, 16–18 April 2019. [Google Scholar]
  9. Taishi, N.; Hiroshi, H. Workload induces changes in hemodynamics, respiratory rate and heart rate variability. In Proceedings of the IEEE International Conference on Bioinformatics and Bioengineering, Taichung, Taiwan, 31 October–2 November 2016. [Google Scholar]
  10. Adams, C.E.; Leverland, M.B. Environmental and behavioral factors that can affect blood pressure. Nurse Educ. Pract. 1985, 10, 39–40. [Google Scholar] [CrossRef] [PubMed]
  11. Mizuno, T.; Sakai, T.; Kawazura, S.; Asano, H. Measuring facial skin temperature changes caused by mental work-load with infrared thermography. IEEE J. Trans. Electron. Inf. Syst. 2016, 136, 1581–1585. [Google Scholar] [CrossRef]
  12. Nourbakhsh, N.; Chen, F.; Wang, Y.; Calvo, R.A. Detecting users’ cognitive load by galvanic skin response with affective interference. ACM Trans. Interact. Intell. Syst. 2017, 7, 1–19. [Google Scholar] [CrossRef] [Green Version]
  13. Marquart, C.; Cabrall, C.; Winter, J.D. Review of eye-related measures of drivers’ mental workload. Procedia Manuf. 2015, 3, 2854–2861. [Google Scholar] [CrossRef] [Green Version]
  14. Sakai, R.; Yokoyama, K. Monitoring the work performance and HRV while mental work using surface pressure sensor. In Proceedings of the IEEE Global Conference on Consumer Electronics, Nara, Japan, 9–12 October 2018. [Google Scholar]
  15. Keisuke, T.; Akihiro, C.; Kazuhiro, Y. Predicting changes in cognitive performance using heart rate variability. IEICE Trans. Inf. Syst. 2017, E100D, 2411–2419. [Google Scholar]
  16. Majid, F.; Majid, M.; Rashid, H. Effects of mental workload on physiological and subjective responses during traffic density monitoring: A field study. Appl. Ergon. 2016, 52, 95–103. [Google Scholar]
  17. Sebastian, M.; Julio, L.; Angel, J.M. Simultaneous feature selection and heterogeneity control for SVM classification: An application to mental workload assessment. Expert Sys. Appl. 2020, 143, 112988. [Google Scholar]
  18. Parent, M.; Peysakhovich, V.; Mandrick, K.; Tremblay, S.; Causse, M. The diagnosticity of psychophysiological signatures: Can we disentangle mental workload from acute stress with ECG and fNIRS. Int. J. Psychophysiol. 2020, 146, 139–147. [Google Scholar] [CrossRef]
  19. Li, Y.; Pan, W.; Li, K.; Jiang, Q.; Liu, G. Sliding trend fuzzy approximate entropy as a novel descriptor of heart rate variability in obstructive sleep apnea. IEEE J. Biomed. Health Informat. 2019, 23, 175–183. [Google Scholar] [CrossRef]
  20. Liu, D.Z.; Wang, J.; Li, J.; Li, Y.; Xu, W.M.; Zhao, X. Analysis on power spectrum and base-scale entropy for heart rate variability signals modulated by reversed sleep state. Acta Phys. Sin. 2014, 63, 426–432. [Google Scholar]
  21. Castaldo, R.; Montesinos, L.; Wan, T.S.; Serban, A.; Massaro, S.; Pecchia, L. Heart rate variability analysis and performance during a repeated mental workload task. In Proceedings of the European Medical and Biological Engineering Conference Nordic-Baltic Conference on Biomedical Engineering and Medical Physics, Tampere, Finland, 11–15 June 2017; Springer: Tampere, Finland, 2017. [Google Scholar]
  22. Tiwari, A.; Albuquerque, I.; Parent, M.; Gagnon, J.-F.; Lafond, D.; Tremblay, S.; Falk, T.H. Multi-scale heart beat entropy measures for mental workload assessment of ambulant users. Entropy 2019, 21, 783. [Google Scholar] [CrossRef] [Green Version]
  23. Delliaux, S.; Delaforge, A.; Deharo, J.-C.; Chaumet, G. Mental workload alters heart rate variability, lowering non-linear dynamics. Front. Physiol. 2019, 5, 1–14. [Google Scholar] [CrossRef] [Green Version]
  24. Pan, J.; Tompkins, W.J. A real-time QRS detection algorithm. IEEE Trans. Biomed. Eng. 1985, 32, 230–236. [Google Scholar] [CrossRef]
  25. Chen, L.L.; Zhang, X.; Song, C.Y. An automatic screening approach for obstructive sleep apnea diagnosis based on single-lead electrocardiogram. IEEE Trans. Autom. Sci. Eng. 2015, 12, 106–115. [Google Scholar] [CrossRef]
  26. Clifford, G.D.; Tarassenko, L. Quantifying errors in spectral estimates of HRV due to beat replacement and resampling. IEEE Trans. Biomed. Eng. 2005, 52, 630–638. [Google Scholar] [CrossRef] [PubMed] [Green Version]
  27. Radhagayathri, K.U.; Chandan, K.; Marimuthu, P. Understanding irregularity characteristics of short-term HRV signals using sample entropy profile. IEEE Trans. Biomed. Eng. 2018, 65, 2569–2579. [Google Scholar]
  28. Penzel, T.; Kantelhardt, J.W.; Grote, L.; Peter, J.H.; Bunde, A. Comparison of detrended fluctuation analysis and spectral analysis for heart rate variability in sleep and sleep apnea. IEEE Trans. Biomed. Eng. 2003, 50, 1143–1151. [Google Scholar] [CrossRef] [Green Version]
  29. Alan, R.; James, A.B.; Jay, K. Impact of psychological factors on the pathogenesis of cardiovascular disease and implications for therapy. Circulation 1999, 99, 2192–2217. [Google Scholar]
  30. Berntson, G.G.; Bigger, J.T.J.; Eckberg, D.L.; Grossman, P.; Kaufmann, P.G.; Malik, M.; Nagaraja, H.N.; Porges, S.W.; Saul, J.P.; Stone, P.H.; et al. Heart rate variability: Origins, methods, and interpretive caveats. Psychophysiology 1997, 34, 623–648. [Google Scholar] [CrossRef]
  31. Clifford, G. Signal Processing Methods for HRV; University of Oxford: Oxford, UK, 2002. [Google Scholar]
  32. Shaffer, F.; McCraty, R.; Zerr, C. A healthy heart is not a metronome: An integrative review of the heart’s anatomy and heart rate variability. Front. Psychol. 2014, 5, 1040. [Google Scholar] [CrossRef] [Green Version]
  33. Daniel, N.O.; Ricardo, V.S.; Joao, P.M.; Marcelo, D.M.; Hugo, P.S.; Claudia, Q.; Miguel, V.B.; Hugo, G.; Helena, L.A.V. Autonomic nervous system response to remote ischemic conditioning: Heart rate variability assessment. BMC Cardiovasc. Disord. 2019, 19, 211. [Google Scholar]
  34. Alessandro, T.; Alessandro, D.; Andrea, D.; Lorenzo, B.; Francesco, S.; Raffffaele, C.; Lucia, B. Can machine learning predict stress reduction based on wearable sensors’ data following relaxation at workplace? A Pilot Study. Processes 2020, 8, 448. [Google Scholar]
  35. Seungji, L.; Taejun, L.; Taeyang, Y.; Changrak, Y.; Sung, P.K. Detection of drivers’ anxiety invoked by driving situations using multimodal biosignals. Processes 2020, 8, 155. [Google Scholar]
  36. Zhang, J.H.; Wang, Y.C.; Li, S.A. Cross-subject mental workload classification using kernel spectral regression and transfer learning techniques. Cogn. Technol. Work 2017, 21, 145–157. [Google Scholar] [CrossRef]
  37. Villani, V.; Righi, M.; Sabattini, L.; Secchi, C. Wearable devices for the assessment of cognitive effort for human-robot interaction. IEEE Sens. J. 2020, 20, 13047–13056. [Google Scholar] [CrossRef]
Figure 1. The processes of the mental workload classification based on HRV.
Electronics 09 02174 g001
Figure 2. Dual-arm robot and wearable controller.
Electronics 09 02174 g002
Figure 3. The operator’s ECG signal acquisition system.
Electronics 09 02174 g003
Figure 4. Flow chart of sample data collection.
Electronics 09 02174 g004
Figure 5. The ECG signal and HRV signal. (a) The obtained ECG signal. (b) The extracted HRV signal.
Electronics 09 02174 g005
Figure 6. The classification results of each subject under different classifiers.
Electronics 09 02174 g006
Figure 7. The box plots of Spe, Sen, Acc for six subjects.
Electronics 09 02174 g007
Figure 8. The cross-subject classification results under different classifiers.
Electronics 09 02174 g008
Figure 9. The box plots of Spe, Sen, and Acc for cross-subject classification.
Electronics 09 02174 g009
Table 1. A description of the subjects.
GenderStature (cm)Weight (kg)Age (year)BMI
Subject1Male18067.52420.8
Subject2Male17578.52425.6
Subject3Male173583119.4
Subject4Male180552317.0
Subject5Male175752424.5
Subject6Male17872.52522.9
Table 2. Statistical features in the time domain.
IndexUnitDefinition and Description
SDNN ms The standard deviation of all successive R-R intervals.
SDNN = 1 N i = 1 N ( R R s i 1 N i = 1 N R R s i )
RMSSD ms The root mean square of the successive R-R interval difference. RMSSD = 1 N 1 i = 1 N 1 ( R R s i + 1 R R s i ) 2
PNN50%The proportion of the beats with a successive R-R interval difference that exceed 50 ms.
PNN 50 = n u m [ ( R R s i + 1 R R s i ) > 50 ] N 1
HRVTi---The sum of all R-R intervals divided by the maximum density distribution.
Table 3. Statistical features in the frequency domain.
IndexUnitDefinition and DescriptionFrequency
Total Power (aTotal) ms 2 The sum of the power spectra for all frequency ranges.≤0.4 Hz
aVLF ms 2 The sum of the power spectra for all frequency ranges.0.003–0.04 Hz
aLF ms 2 The sum of the power spectra for all frequency ranges.0.04–0.15 Hz
aHF ms 2 The sum of the power spectra for all frequency ranges.0.15–0.4 Hz
LF/HF% The   ratio   of   LF   [ ms 2 ]   and   HF   [ ms 2 ] /
pVLF% The   ratio   of   aVLF   [ ms 2 ]   and   TP   [ ms 2 ] /
pLF% The   ratio   of   aLF   [ ms 2 ]   and   TP   [ ms 2 ] /
pHF% The   ratio   of   LF   [ ms 2 ]   and   HF   [ ms 2 ] /
nLF% The   ratio   of   aLF   [ ms 2 ]   and   ( aLF + aHF )   [ ms 2 ] /
nHF% The   ratio   of   aHF   [ ms 2 ]   and   ( aLF + aHF )   [ ms 2 ] /
Table 4. Statistical analysis results of HRV time domain, frequency domain, and nonlinear features.
S1-M and S1-RS2-M and S2-RS3-M and S3-RS4-M and S4-RS5-M and S5-RS6-M and S6-R
Time DomainHRVTi0 ***0 ***0 ***0 ***0 ***0 ***
Mean0 ***0 ***0 ***0 ***0 ***0 ***
SDNN0 ***0 ***0 ***0 ***0 ***0 ***
Median0 ***0 ***0 ***0 ***0 ***0 ***
PNN500 ***0 ***0 ***0.280 ***0 ***
RMSSD0 ***0 ***0 ***0 ***0.150.16
Frequency DomainaHF0 ***0 ***0 ***0 ***0.060.61
aLF0 ***0 ***0.02 *0 ***0.060.02 *
aTotal0 ***0 ***0 ***0 ***0.013 *0.19
aVLF0 ***0 ***0.002 **0 ***0 ***0 ***
LF/HF0 ***0.410 ***0.015 *0.004 **0.05
nHF0 ***0.080 ***0.240.560.07
nLF0 ***0.080 ***0.240.560 ***
pHF0 ***0 ***0 ***0 ***0 ***0 ***
pLF0 ***0.02 *0 ***0 ***0 ***0 ***
pVLF0 ***0.008 **0.130 ***0 ***0 ***
NonlinearSaEn0 ***0 ***0 ***0 ***0.160 ***
Alpha0 ***0.120.410 ***0.003 **0 ***
Alpha10 ***0 ***0 ***0 ***0.270 ***
Alpha20 ***0.880.450 ***0.009 **0 ***
*, **, *** represent p < 0.05 , p < 0.01 , p < 0.001 , respectively.
Table 5. Statistical analysis results of HRV time domain, frequency domain, and nonlinear features.
CM and CR
Time DomainHRVTi0 ***
Mean0 ***
SDNN0 ***
Median0 ***
PNN500 ***
RMSSD0 ***
Frequency DomainaHF0 ***
aLF0 ***
aTotal0 ***
aVLF0 ***
LF/HF0.054
nHF0 ***
nLF0 ***
pHF0 ***
pLF0.60
pVLF0 ***
NonlinearSaEn0 ***
Alpha0 ***
Alpha10 ***
Alpha20 ***
*, **, *** represent p < 0.05 , p < 0.01 , p < 0.001 , respectively.
Table 6. The classification results of each subject under different classifiers.
SubjectS1S2S3S4S5S6Meanstd
SVMSpe98.8499.0197.2098.4399.9799.3498.802.03
Sen97.8199.8696.7292.9599.9995.9697.220.39
Acc97.7699.3696.1794.9399.9797.0397.543.03
KNNSpe99.2699.9999.1596.2299.9198.6198.861.80
Sen98.8699.9499.0797.6199.7899.3499.100.11
Acc98.9199.9598.8496.4599.8198.6498.771.49
GBSpe98.2099.2590.6194.7199.7597.9096.742.03
Sen93.3799.4995.8394.7799.8595.67096.500.39
Acc94.9599.1092.0993.6599.7095.9095.903.03
LDASpe47.6745.5845.4649.7854.354.4749.5424.83
Sen57.2260.0746.8361.0254.2150.3054.9422.95
Acc52.5353.3146.6954.9453.9252.2352.2722.70
NBSpe98.0798.9087.1283.8499.8896.8094.1018.81
Sen18.4396.0898.3154.9397.6596.2876.9522.58
Acc58.4496.8491.4569.1698.4995.5884.9922.03
DTSpe89.0599.2186.7394.1399.9197.7594.4624.83
Sen32.5599.4594.2795.1499.8995.7286.1722.95
Acc62.0499.0389.1093.6499.8495.7889.9122.70
Table 7. The classification results of cross-subject under different classifiers.
SubjectS1S2S3S4S5S6Meanstd
SVMSpe66.6710064.7186.2788.6384.3181.7713.60
Sen54.1292.3534.1298.0474.9098.0475.2626.34
Acc60.3996.1849.4192.1681.7691.1878.5119.21
KNNSpe62.7578.439.8098.0480.3984.3168.9531.11
Sen10070.5931.3792.1682.3592.1678.1125.03
Acc81.3774.5120.5995.1081.3788.2473.5326.86
GBSpe10010031.3778.4310062.7578.7627.77
Sen82.3510086.2780.3958.8286.2782.3513.41
Acc91.1810058.8279.4179.4174.5180.5614.16
LDASpe21.5710.0578.4372.5523.5380.3946.0835.09
Sen68.6362.7510029.4121.5788.2461.7731.25
Acc45.1036.4089.2250.9822.5584.3153.9227.38
NBSpe88.241003.921007.8413.7352.2948.26
Sen52.9410080.3950.9810010080.7223.54
Acc70.5910042.1675.4953.9256.8666.5020.31
DTSpe1.9623.5331.376.0810072.5539.2538.99
Sen70.5978.4366.6770.5962.7539.2264.7113.53
Acc36.2750.9849.0283.3381.3755.8859.4818.87
Publisher’s Note: MDPI stays neutral with regard to jurisdictional claims in published maps and institutional affiliations.